
Abstract
Multimaterial structures made using fused deposition modeling (FDM) offer an attractive prospect for enhancing their mechanical properties and functionality. In this study, the interfacial fracture toughness of a unidirectional hybrid composite fabricated by FDM was studied through mechanical testing. The composite structure comprises acrylonitrile butadiene styrene and carbon fiber-reinforced polylactic acid. Since, de-adhesion or bond failure at the interface can occur under a combination of the different fracture modes, therefore, interfacial fracture toughness, in terms of the critical energy release rate, was characterized using double cantilever beam specimen test for mode I, end-notched flexural specimen test for mode II, and mixed-mode bending specimen test for mixed-mode I/II. Effects of varying process parameters, like printing speed and nozzle temperature, on the interfacial fracture toughness in mode I and II were also investigated. It was found that increasing the nozzle temperature and printing speed enhance the fracture toughness, both in mode I and II, but the effect of increasing nozzle temperature on mode II fracture toughness was quite significant.
Keywords
Introduction
Fused deposition modeling (FDM) is an additive manufacturing technique in which a heated nozzle is used to deposit molten material in layers to build a solid part. FDM is widely used in the 3-D printers and is the most popular rapid prototyping technique nowadays. 3-D printing as a rapid prototyping tool has an incredible impact in the field of manufacturing technology for part production because of its low energy consumption, easy fabrication of complex geometries with less tool changes and fabrication times, and reduced material wastage. Due to these reasons, FDM has turned out to be extensively more accessible technique in terms of cost and material processed among the 3-D printing techniques like stereolithography and selective laser sintering. Applications are rapidly evolving in various fields in recent years, such as in automotive, marine, transportation, aerospace, architecture, sports, biomedical, medicines, and other engineering fields. Different researchers have investigated the application of FDM process using 3-D printing for the manufacturing of medical devices, 1 organic farms, 2 improvement in the performance of unmanned aerial vehicles through 3-D printed smart material actuators and multifunctional structures, 3 buildings and building components, 4 fabrication of human organs, medical implants, larger components and structures, 5 etc. The main reason behind the popularity of FDM technique is safe to handle, reliable, and simple fabrication of complex geometry objects as compared to the traditional material subtracting methodologies, which produces considerable material waste.
In FDM, the material is deposited layer-by-layer on a heated platform next to each layer and upon each other to form a solid object. As the material is deposited, it cools down quickly and solidifies. Thermal bonding causes the material to diffuse with the adjacent material or layer previously layered upon. 6 Mostly, thermoplastic materials are used for this process, which can be melted with a heated nozzle as their glass transition and melting temperature is low. A variety of low-cost thermoplastic filaments are available, such as acrylonitrile butadiene styrene (ABS), polylactic acid (PLA), polyethylene terephthalate, polyvinyl alcohol, thermoplastic urethane, nylon, etc. Successful printing is achieved owing to the particular properties, such as low glass temperature (Tg), melting point (Tm), and low shrinkage upon solidification.
The main feature of the FDM process is the local welding of the extruded layers and capability of fusion bonding to make parts with good control of their properties (porosity, mechanical properties, infill %, etc.). Physical and mechanical properties of these parts are governed by the adhesion of these layers. Due to this, FDM-manufactured parts exhibit different properties as compared to those made through conventional polymer processing methods. Research has been carried out to check the effects of different process parameters on mechanical properties of 3-D printed components such as build orientation, raster angle, layer height, nozzle diameter, printing speed, infill density, and printing temperature.7–14
Behavior and structural integrity of FDM fabricated parts is also governed by their interlayer properties and very few studies focus on these properties. Mostly, laminated structures fail due to delamination. The life expectancy of laminated structures requires the knowledge of material’s response to the growth of delamination. 15 Usually, bond strength and interlaminar fracture toughness are used to characterize initiation and propagation of delamination. It is argued that the 3D printed part’s mechanical properties also reduce if the interface bonding is weak. 16 Therefore, these interfacial properties should be known for a given laminated composite to be employed in design process.
Interlayer/interlaminar failure can occur under three different modes: opening (mode I), in-plane shear (mode II), and out-of-plane shear (mode III). In most cases, the failure is caused due to the combination of these three modes. 17 Both tensile and shear interlaminar stresses can be present at the delamination front. It is known that fracture toughness of a material at the initiation of crack growth is predicted by the critical strain energy release rate (CSERR) denoted by Gc. Studies on the interlaminar fracture analysis of structures made through FDM technique are limited. Some research have been commenced and reported the fracture behavior of the FDM 3D printed parts. For example, Spoerk et al. 18 printed double cantilever beam (DCB) specimens of PLA filament and studied the effect of layer height and nozzle temperature on the fracture energy. Arbeiter et al. printed compact tension (CT) and single-end notch bending (SENB) specimens of PLA and evaluated the fracture and fatigue behavior. 19 Aliheidari et al. characterized the change in interlayer adhesion and critical energy release rate of ABS material by varying the printing temperature, layer thickness and layer design using DCB specimens. 20 Reddy et al. showed that the fracture resistance is related directly to interlayer adhesive strength. The critical load for the interlayer separation in ABS filament using Box–Behnken technique was determined and the influence of process parameters like nozzle temperature, chamber temperature, and road gap was studied. 21 The fracture toughness was measured by varying different printing parameters like the number of shells, raster orientation, axis orientation, layer height, and infill percentage using central cracked specimen, by Khatri et al. 13 It was concluded that 0°C raster angle has highest fracture toughness. Torres et al. tested CT samples made up of PLA and studied the crack resistance with varying orientation indirectly. 22 It was concluded that higher crack resistance is offered by lower layer thickness. Hart et al. printed SENB specimens of ABS and performed interlaminar fracture toughness tests to study the effect of print orientation. 23 It was concluded that fracture toughness between the layers is one order lower than fracture toughness through the layer. Damodaran et al. printed PLA polymer reinforcements over the carbon fiber (CF) prepreg and investigated the influence of printing parameters on peel strength using DCB. They further investigated the effect of print spacing and fracture tests using end notched flexure (ENF). 24 Mostly, the reported literature is focused on mode I loading.
Laminated composites are used extensively from the past few decades for industrial applications requiring higher and long-lasting performance, as their physical and mechanical properties are superior to monolithic materials. 25 Predominately, CF-reinforced polymer composites have various applications in the field of automobiles, aerospace, and other engineering industries, because of their high strength to weight ratio. In the recent years, fabrication of composite materials through 3-D printing technique is gaining popularity. Novel stock materials with additives in specific concentrations and structures are now available with unique characteristics. Usually chopped short fibers are blended with thermoplastic polymers to improve the mechanical properties of printed components. Indeed, research has been carried out in this regard and the investigation reports that the inclusion of additives can result in both positive and negative effects on the mechanical properties of the printed component. 26
Most of the experimental and theoretical studies regarding interlaminar/interlayer fracture toughness of FDM-fabricated composites discuss only a single kind of filament. On the other hand, multimaterial/hybrid composites can offer a number of benefits, such as high-specific strength, improved functionality, and through-layer fracture toughness. CF-reinforced PLA (CF-PLA) composite possesses high strength but has low toughness. To increase the toughness, ABS can be introduced with CF-PLA. Combination of these two materials is expected to result in higher toughness of the component. But before any investigation related to the bulk properties of the proposed composite, the integrity of the interface between ABS and CF-PLA has to be investigated under different modes.
The aim of the present study is to fabricate hybrid composite made up of ABS and CF-PLA employing FDM technique and characterize mode I, II, and mixed-mode (I/II) fracture toughness at the interface between ABS and CF-PLA. Based on the reported literature, layer height, infill density, and nozzle diameter to layer height ratio, at which the best mechanical properties were reported, were fixed and effects of varying printing speed and nozzle temperature were studied on modes I and II interfacial fracture toughness.
Experimental procedures
Materials
True white ABS filament was supplied by Xplorer 3D (Dubai, UAE), and CF-PLA, prepared by 4043D PLA resin compounded with 15% by weight chopped short CFs, was manufactured by ProtoPlant, USA (Proto pasta CF PLA filament), both having a diameter of 1.75 mm (±0.5 mm). The filament properties are reported in Table 1. Characterization of CF-PLA is presented. 28 Polyimide film of 13 µm thickness was supplied by Xiamen GBS Optronics Co. Ltd, China, to be used as an insert for crack initiation. Digital adjustable microscope of up to 1000× magnification was used to determine the crack propagation.
Properties of ABS and CF-PLA filaments.
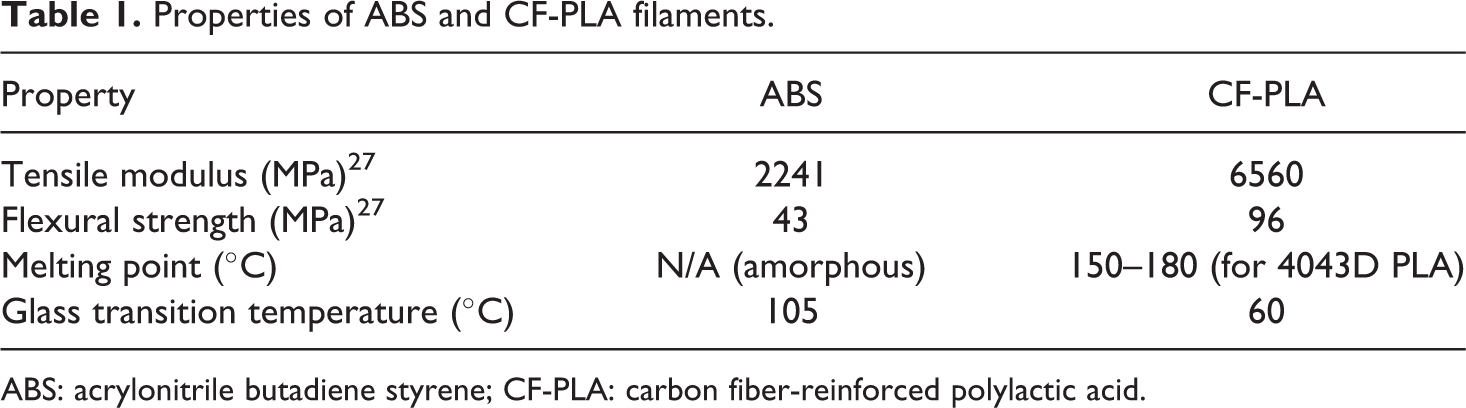
ABS: acrylonitrile butadiene styrene; CF-PLA: carbon fiber-reinforced polylactic acid.
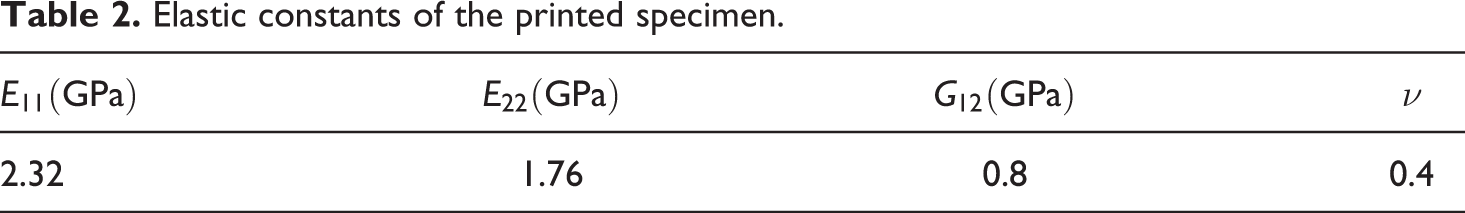
The elastic constants for the printed specimens were determined following specimen geometry and procedure guidelines mentioned in ASTM D3039 29 and ASTM D3518 30 and presented in Table 2.
Elastic constants of the printed specimen.
Specimen printing
Interfacial fracture toughness of ABS and CF-PLA hybrid composite, in terms of the CSERR in mode I, II, and mixed-mode I/II, was investigated by ASTM Standard D5528-13,31 ASTM Standard D7905/D7905M-14,32 and ASTM Standard D6671/D6671M-13, 33 respectively. The geometry and dimensions of the test specimens were selected according to the applicable standard.
At least five test specimens were fabricated for each test using Xplorer 3D PRO printer. A part CAD model was developed in a CAD software (PTC Creo), which was converted to STL file format capturing the details of the CAD model. The STL file format was then processed by FDM software, which included the feasible orientation onto the platform and slicing the part in 2D layers. The printing parameters were specific during the path planning stage. The printing process begins by inserting the filament into the extruder nozzle, which was set above the glass transition temperature of the filament used. Once the filament was heated, it was then deposited in the form of strips on the heated bed, called raster roads, which then cooled down to solid state and adhered to the heated bed or to the material beneath.
Based on the reported literature, the best mechanical properties were achieved approximately at the layer height of 0.25 mm, as reported by Ning et al. 34 Therefore, layer height was taken as a fixed parameter and specimens were made in 16 layers, each layer of 0.25 mm height. ABS and CF-PLA material comprises eight layers each, having a total specimen thickness of 4 mm. Furthermore, according to Kuznetsov et al., 10 the best nozzle diameter to layer height ratio of 3 was selected. The extrusion of ABS and CF-PLA material was done by a 0.75-mm diameter nozzle. All layers were printed unidirectional at 0°C raster angle. To reduce the void content, 100% infill density was used so that the internal volume is filled completely. After that, the printing parameters like printing speed and nozzle temperature were altered keeping all other parameters constant to study their effect on modes I and II interfacial fracture toughness.
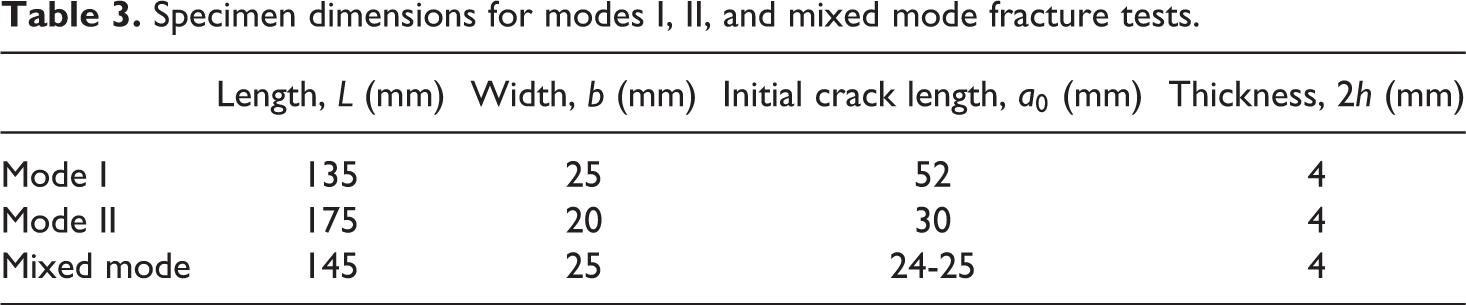
The dimensions for the specimens printed for modes I, II and mixed-mode tests were selected according to applicable ASTM standard31–33 and are provided in Table 3. For printing temperature, three levels for both filaments were selected starting from the recommended printing temperature provided by the manufacturer with increments of 15°C. Specimens were fabricated with nozzle temperature combinations of 23°C and 195°C, 245°C and 210°C, and 260°C and 225°C, for ABS and CF-PLA, respectively. Throughout the process, the heated bed was set to 80°C. Prior to start, UHU paper glue was applied to the bed to improve adhesion of the initial extruded material so that no warping occurs. Specimens were printed at speeds of 20, 30, and 40 mm/s. In principle, to achieve a conservative value of the interlayer/interfacial fracture toughness, an initial crack is made to maximize the stress concentration by placing a very thin insert between the layers. As recommended in the ASTM standards, a 13-µm-thick polyimide sheet insert was placed between ABS and CF-PLA to create a starter crack. Firstly, 2-mm thick beam of ABS was printed, then insert was placed, and finally, 2-mm thick CF-PLA was printed. The thickness of each individual layer was fixed at 0.25 mm. The placement of the insert was carried out without stopping the printing process, as the extruded filament reaches the eighth layer of ABS (Figure 1). The changing of filament and placement of the insert was carried out at the same time. Edges of the samples were smoothened using sandpaper.
Specimen dimensions for modes I, II, and mixed mode fracture tests.
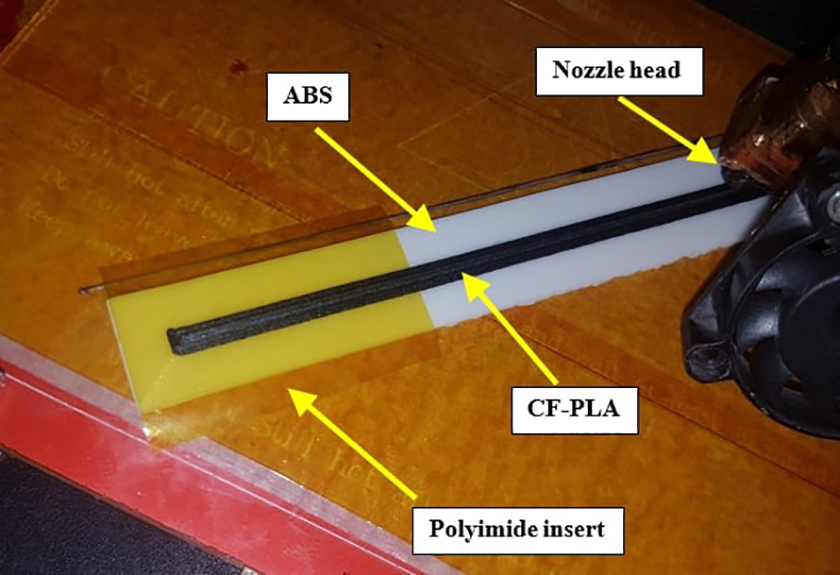
Specimen during printing.
Mode I
DCB specimen test was used to measure the mode I interfacial fracture toughness of the ABS + CF-PLA composite specimen, according to ASTM D5528. 31 The DCB shown in Figure 2(a) consists of a rectangular cross section, uniform thickness, unidirectional printed specimen consisting of a nonadhesive insert at the interface between ABS and CF-PLA, which serves as a delamination starter. All dimensions were according to ASTM D5528. 31 The contact surface of the specimen and loading block was scrubbed with sandpaper and cleaned. A layer of adhesive (cyanoacrylate glue) was applied on the block surface and then it was fixed to the specimen. Greasy removable loading pins were used to fix the loading blocks with the UTM machine fixture for the application of load (Figure 2(b)). To observe the propagation of the crack, the specimen edges were coated using a typewriter correction fluid and marked. Markings were made at 1-mm interval from the insert tip for the first 5 mm and after that, at 5-mm intervals for the propagation length of 45 mm and then again at 1-mm interval for the next 5 mm of the total propagation length of 50 mm to record the corresponding load versus crack tip advancement. Digital microscope having magnification up to 1000× was used to locate the crack tip during propagation.
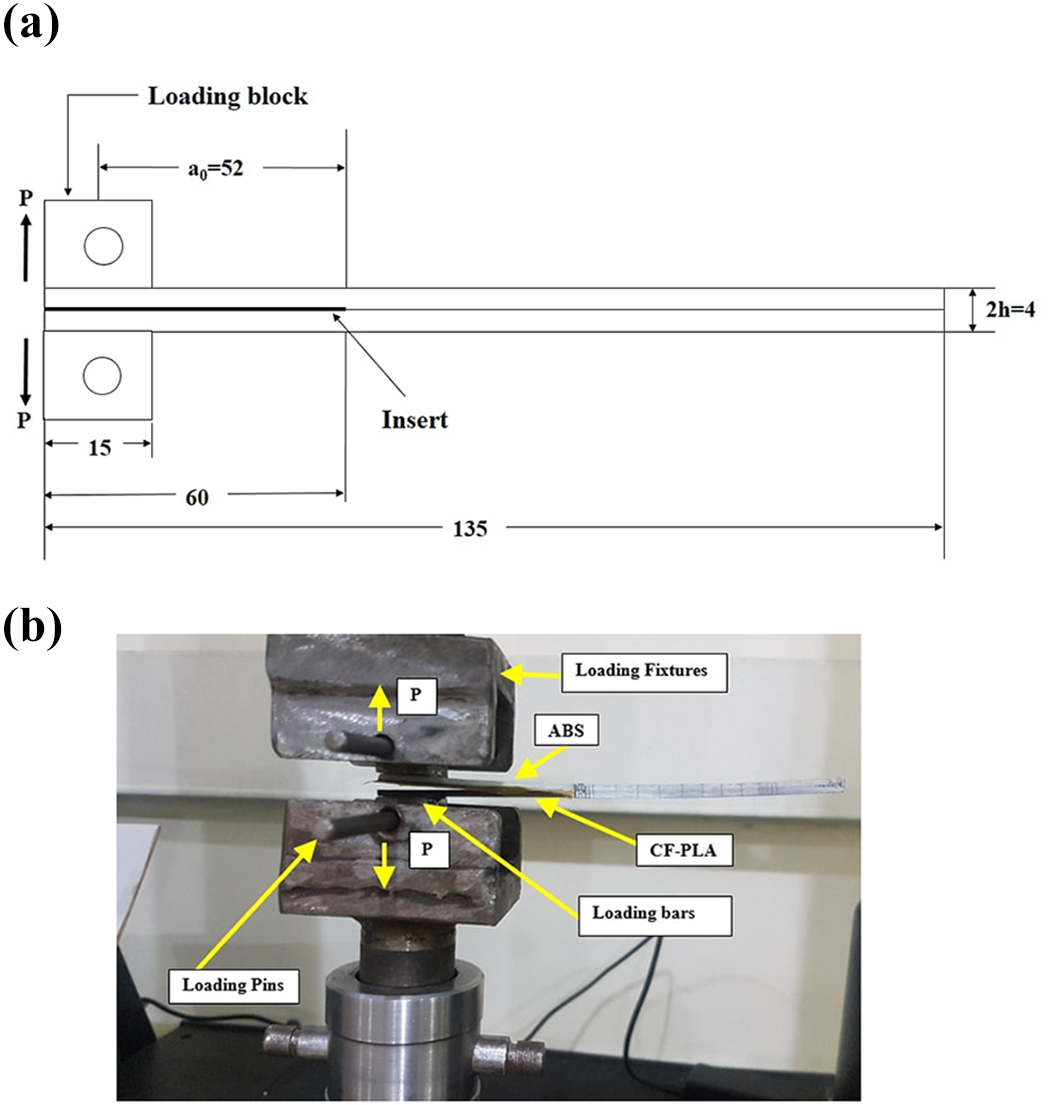
(a) Schematic of DCB test specimen with loading blocks (dimensions in mm). (b) Arrangement of specimen and fixture during DCB test.
Opening load was applied to the specimen using INSTRON UTM 5567 with a 1-kN load cell through loading blocks. The detached ends of the DCB were opened in displacement control mode at a constant crosshead speed of 2 mm/min, while the load and delamination length were recorded. Data acquisition system also recorded the load and the load–point displacement (P − δ) data. Extension of delamination was observed and recorded at each corresponding mark placed on the specimen edge. The specimen was loaded until the crack front reached delamination mark at 50 mm.
Mode II
ENF test specimen was used to measure the mode II interfacial fracture toughness of the ABS+CF-PLA composite specimen, according to ASTM D7905. 32 The ENF specimen consists of a rectangular cross section, uniform thickness, and unidirectional printed specimen consisting of a nonadhesive insert at the interface between ABS and CF-PLA, which serves as a crack initiator. All dimensions were according to ASTM D7905. 32 Load was applied to the specimen through loading roller in displacement controlled loading with a constant displacement rate of 0.5 mm/min (Figure 3). The loading was achieved in three-point bending configuration. Load and the load–point displacement data were recorded by the machine’s data acquisition system.
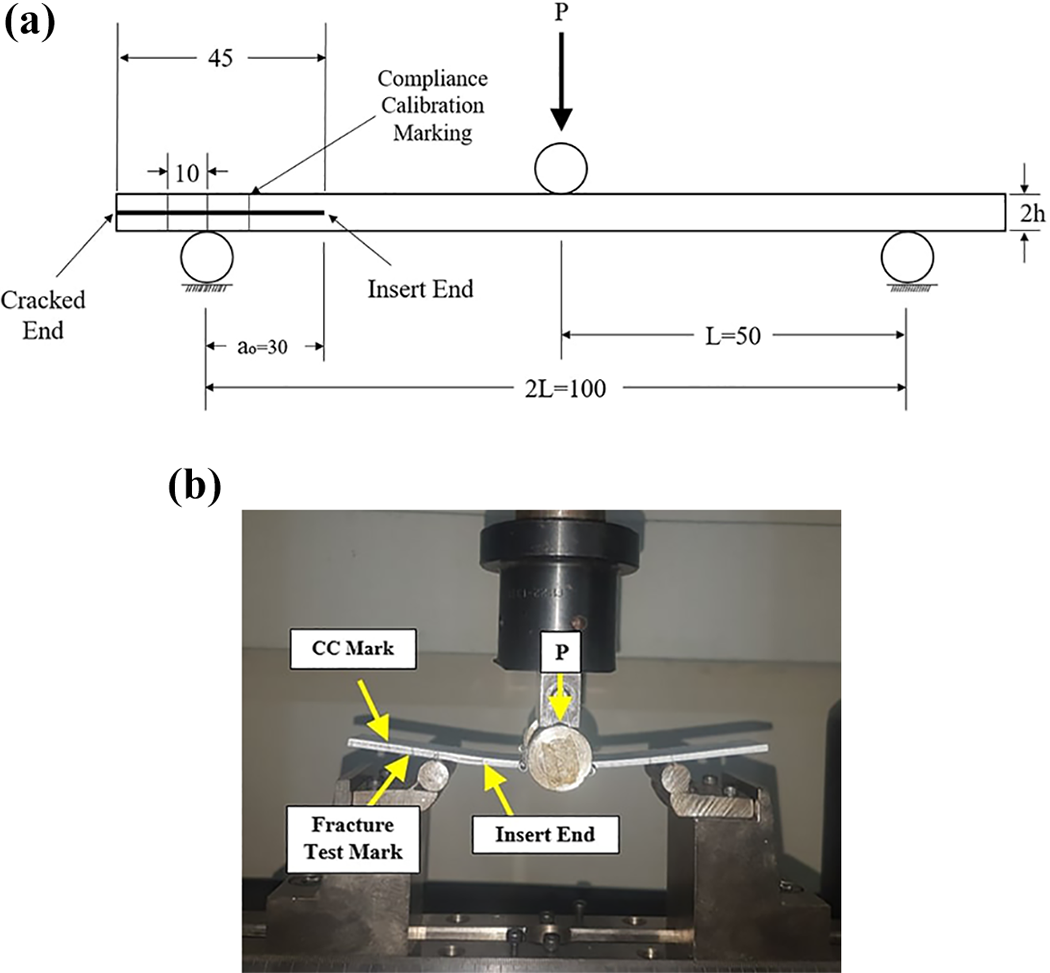
(a) Schematic of ENF test (dimensions in mm). (b) Arrangement of specimen and fixture during ENF test.
In the ENF test, the delamination growth is not stable, so interfacial fracture toughness in mode II was obtained from the preimplanted insert as well as from a precrack. Non-precracked (NPC) and precracked (PC) fracture tests were performed for each specimen. The end of the insert was located, and marks were made at a distance of 20, 30, and 40 mm from the insert end to position the support roller during the compliance calibration (CC). Before that, CC tests were performed at 50–60% critical load of the specimen before fracture by placing the left roller at a = 20 mm and a = 40 mm marks from the end of insert, respectively. Crack length is measured from the center of the support roller to the end of the insert. Span length, which is the distance from the center of one support roller to other support roller, was kept constant for all the tests performed (i.e. 2L = 100 mm).
In ENF test, visual observation of the crack from the insert end is difficult because of the compressive load due to which the crack grows rapidly so the higher load point of the linear section of the load–displacement curve was selected as the failure load and used to determine GIIc.
Mixed mode (I/II)
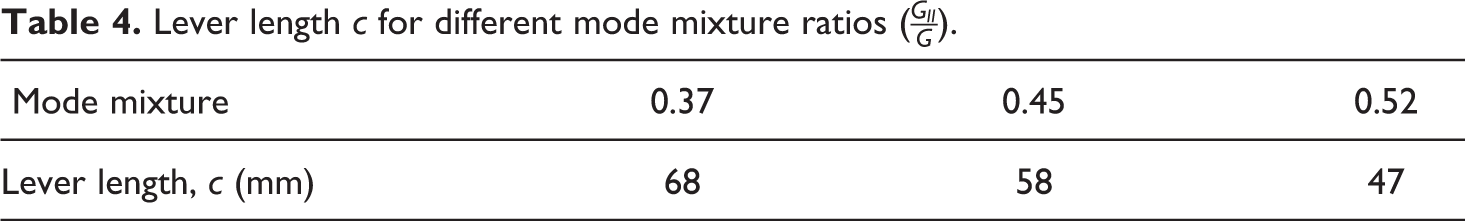
Interfacial fracture toughness of composite specimen at various mode I to mode II loading ratios was determined using the mixed-mode bending (MMB) test, according to ASTM D6671. 33 It is basically the combination of DCB and ENF test. The MMB apparatus was used to determine the interfacial fracture toughness at mode mixture ratios (Mode II/Mode I + II) of 0.37, 0.45, and 0.52. A rectangular specimen of hybrid composite was used with dimensions as per ASTM D6671 33 and containing an insert of length 50 mm as a starter crack. The end of the insert was located and markings were placed on the specimen edge according to the guidelines provided by ASTM Standard D6671/D6671M-13. 33 Initially, 1-mm interval marks were made from the insert tip for first 5 mm and then at 5-mm intervals for the propagation length of 20–25 mm to observe the propagation of crack and record the corresponding load versus crack tip advancement data. The peak load of the load–displacement curve was used to calculate the critical strain energy release rate, Gc (GIc + GIIc). Specimen was loaded via piano hinges at the delaminated region and through a roller in the nondelaminated region that bears against the specimen. The contact region of specimen with the piano hinges was scrubbed with sand paper and hinges were attached with epoxy adhesive. The specimen was held by the base of the apparatus, while the load was applied through apparatus lever (see Figure 4). The half span length was L = 50 mm. The test was performed at a displacement rate of 0.5 mm/min. Mode mixtures were created at different c lengths (see Figure 4(a)). The data recording setup is shown in Figure 5. Lever length c for different mode mixture ratios is presented in Table 4.
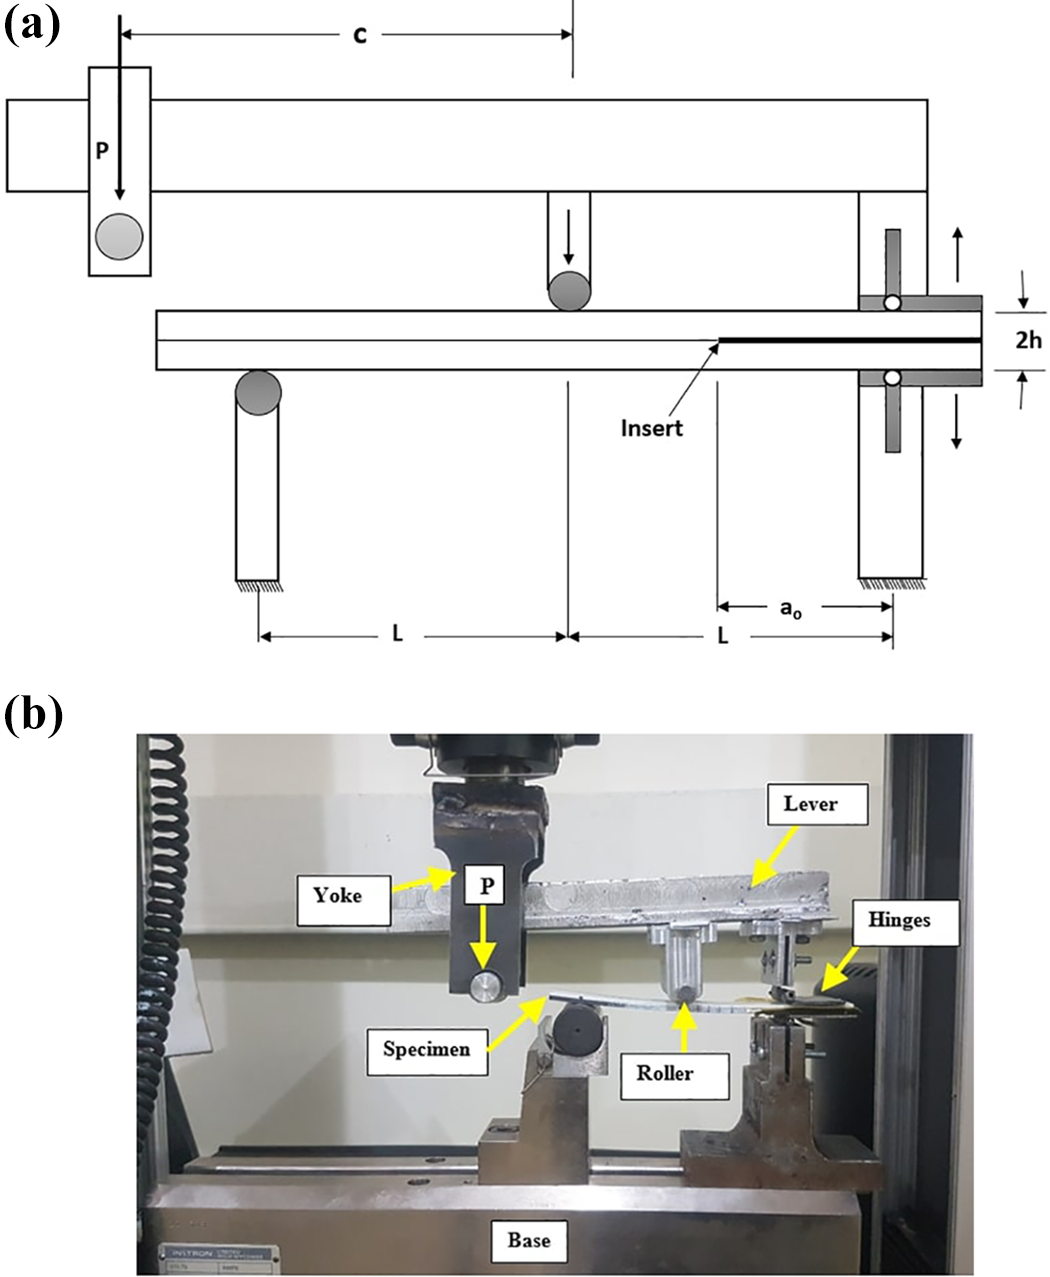
MMB test (a) schematic and (b) experimental setup.
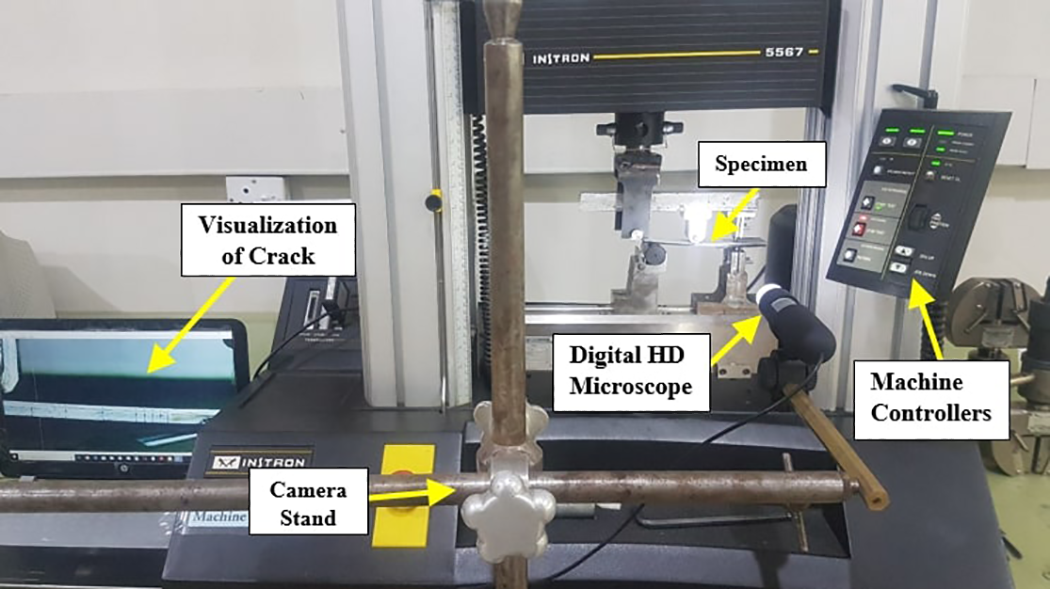
Apparatus arrangement for observation and data recording.
Lever length c for different mode mixture ratios (
Experimental results
Mode I
Mode I interfacial fracture toughness GI was determined using modified beam theory (MBT), which gives the most conservative results. GI was also determined using beam theory (BT) and CC method (CCM) for comparison, following the procedures mentioned by ASTM Standard D5528-13. 31
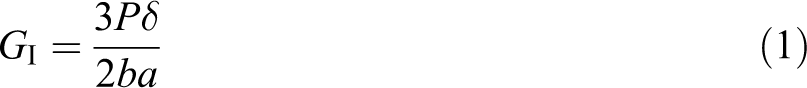
According to the BT, GI is given by equation (1):
According to MBT, GI is given by equation (2):
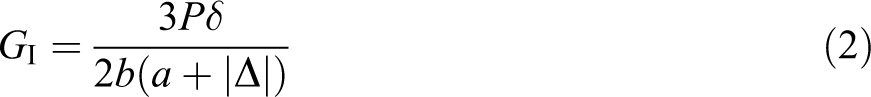
where P is the load, δ is the load point displacement, a is the delamination length, and b is the width of the specimen. Δ considers the rotation at the delamination front and adjusts the measured value according to equation (2). It is calculated by the least square plot of the cube root of the compliance (δ/P)1/3 as a function of delamination length a.
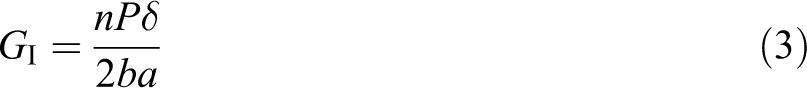
The fracture toughness can also be calculated using the CCM, in which the least square plot of the log compliance is plotted against the log of delamination length and the slope is calculated as n. GI is then calculated by equation (3):
Interfacial fracture toughness for mode I was determined in terms of CSERR by considering the load at visual onset of crack propagation at the insert end and regarded as GIc using MBT. Load–displacement curves of specimens at different printing speeds and nozzle temperatures for ABS and CF-PLA are shown in Figure 6. After reaching the peak load, a drop in load occurs, which represents the mode I failure at the insert end, giving rise to the crack initiation. Beside GIc, propagation values GI − prop at each crack marking were also calculated. The GIc at initiation of the crack at the insert end and the propagation values were used to draw the resistance curve (R-curve) against the crack length (Δa), which are shown in Figure 7.
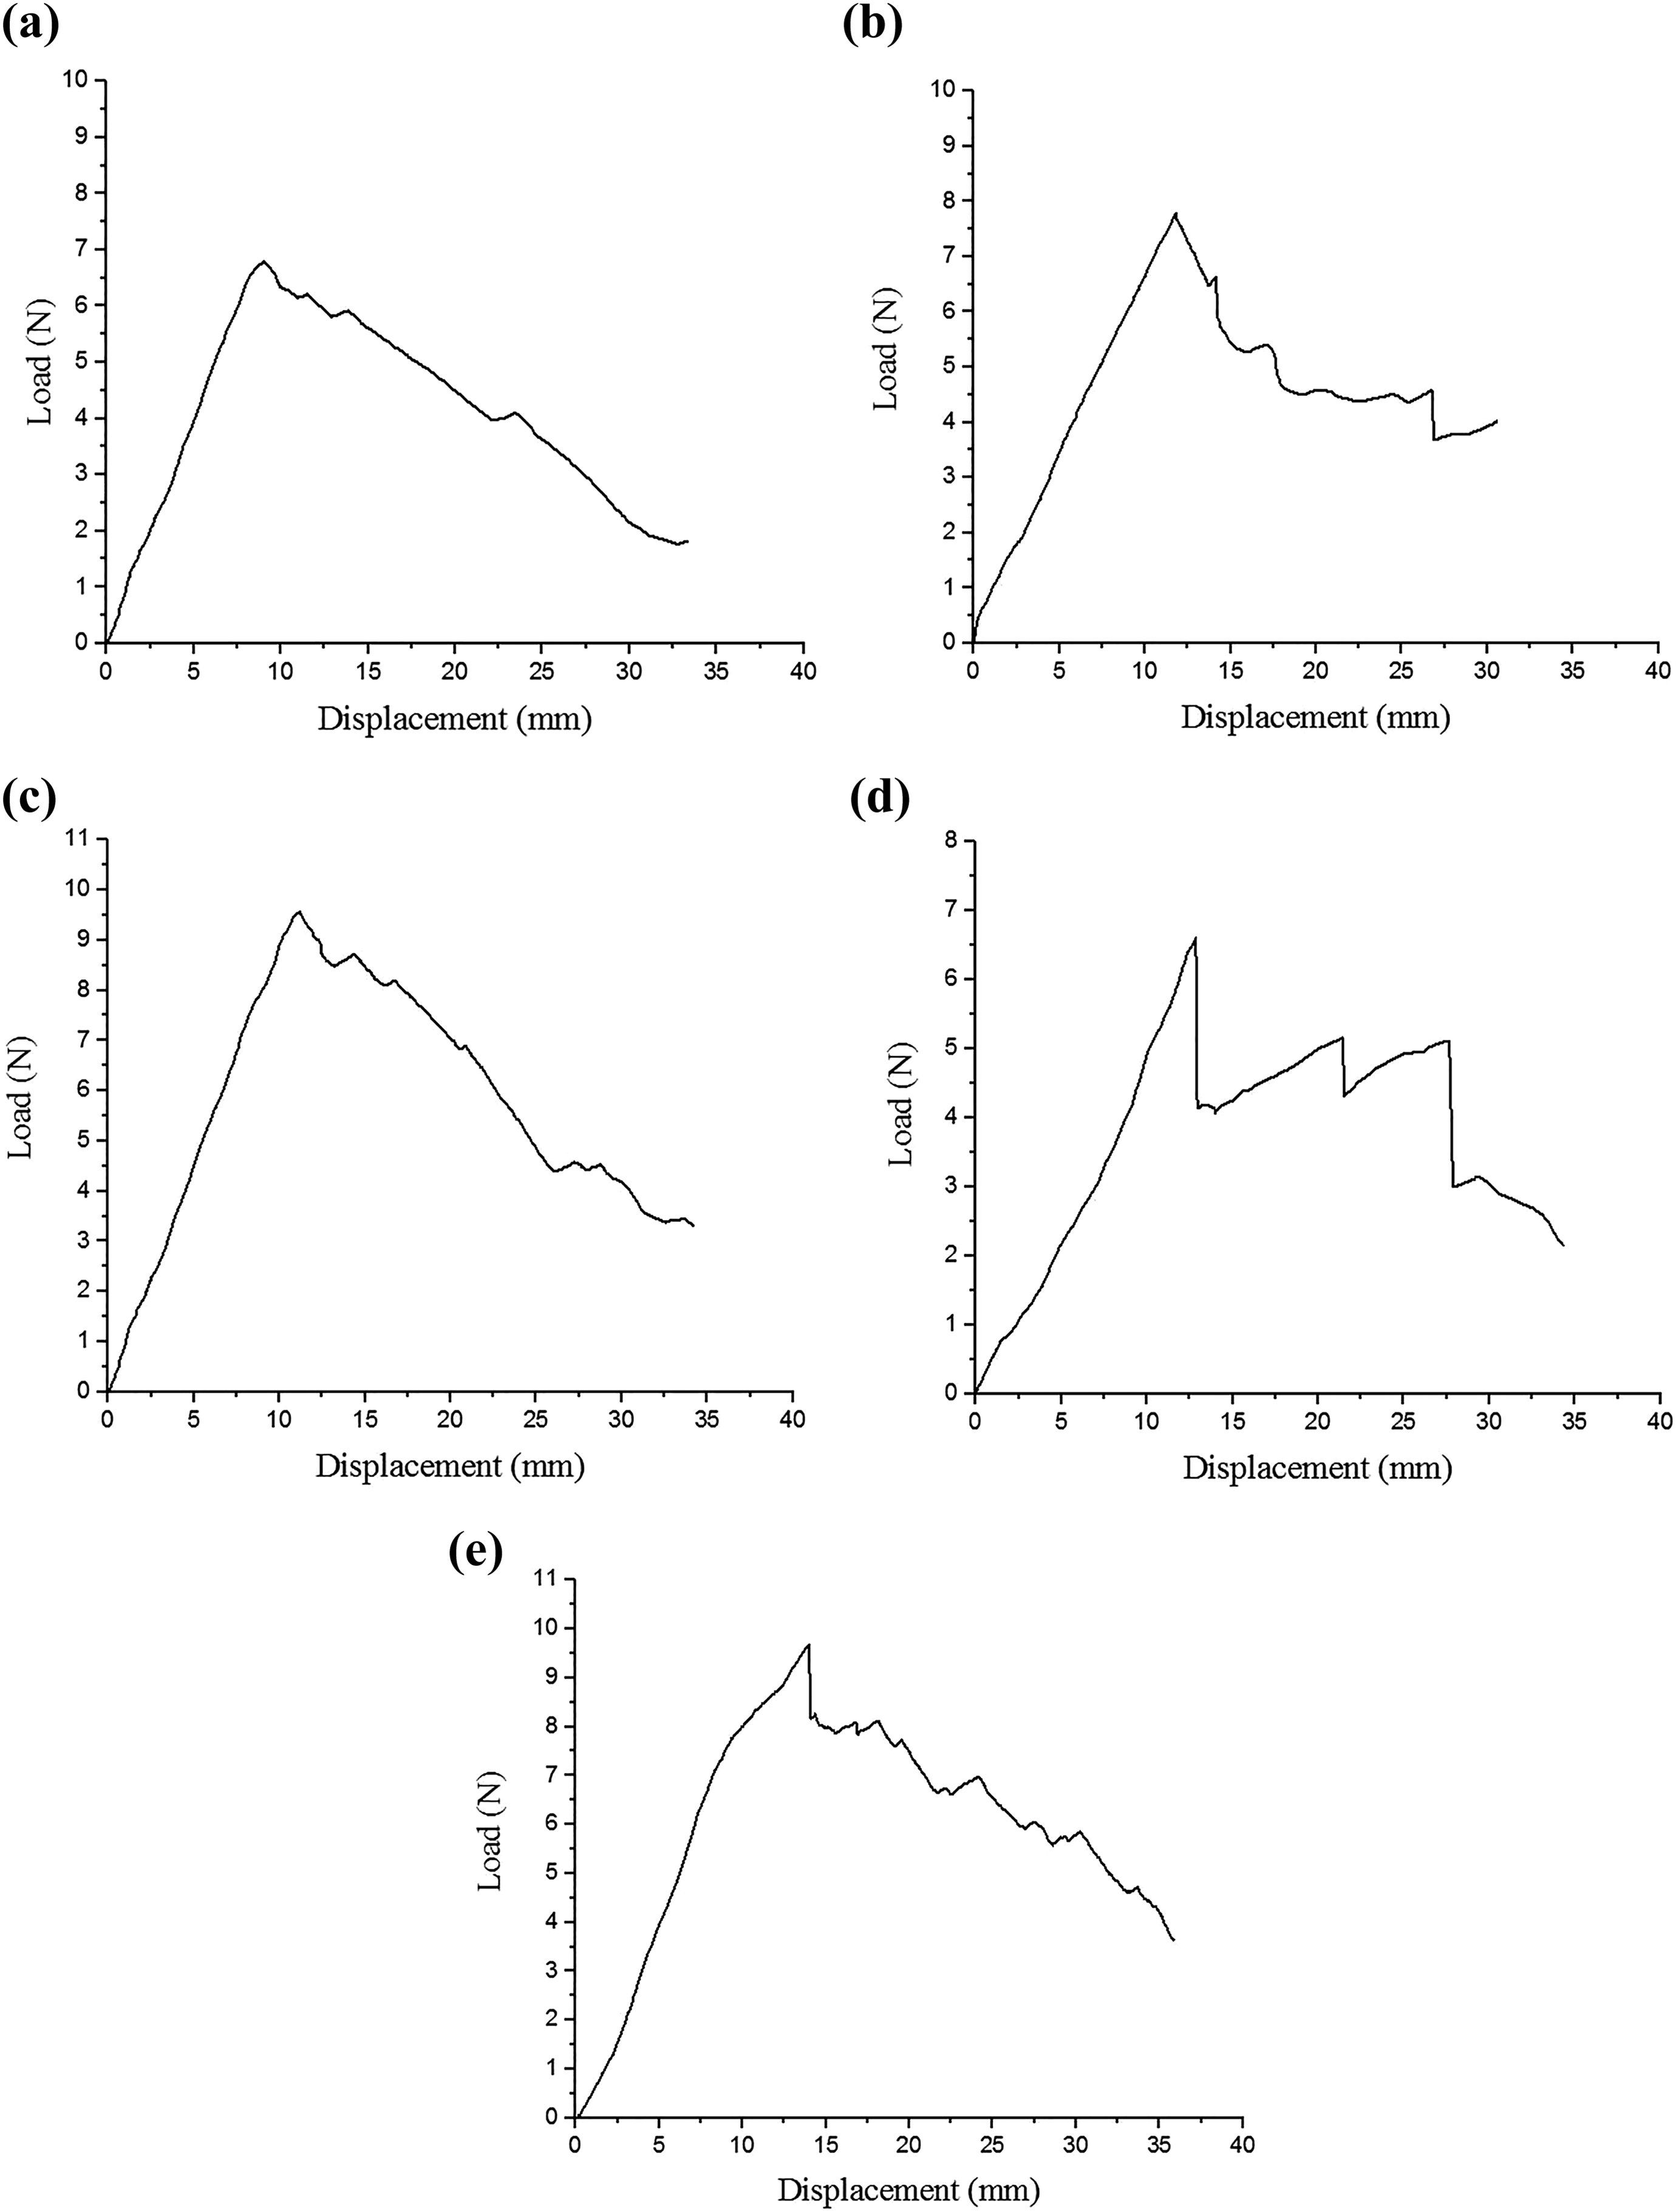
(a)–(d) Load–displacement curves for DCB specimens at various printing speeds and nozzle temperatures for ABS and CF-PLA, respectively. (a) Print speed = 20 mm/s, nozzle temperature 230°C and 195°C. (b) Print speed = 30 mm/s, nozzle temperature 230°C and 195°C. (c) Print speed = 40 mm/s, nozzle temperature 230°C and 195°C. (d) Print speed = 30 mm/s, nozzle temperature 245°C and 210°C. (e) Print speed = 30 mm/s, nozzle temperature 260°C and 225°C.
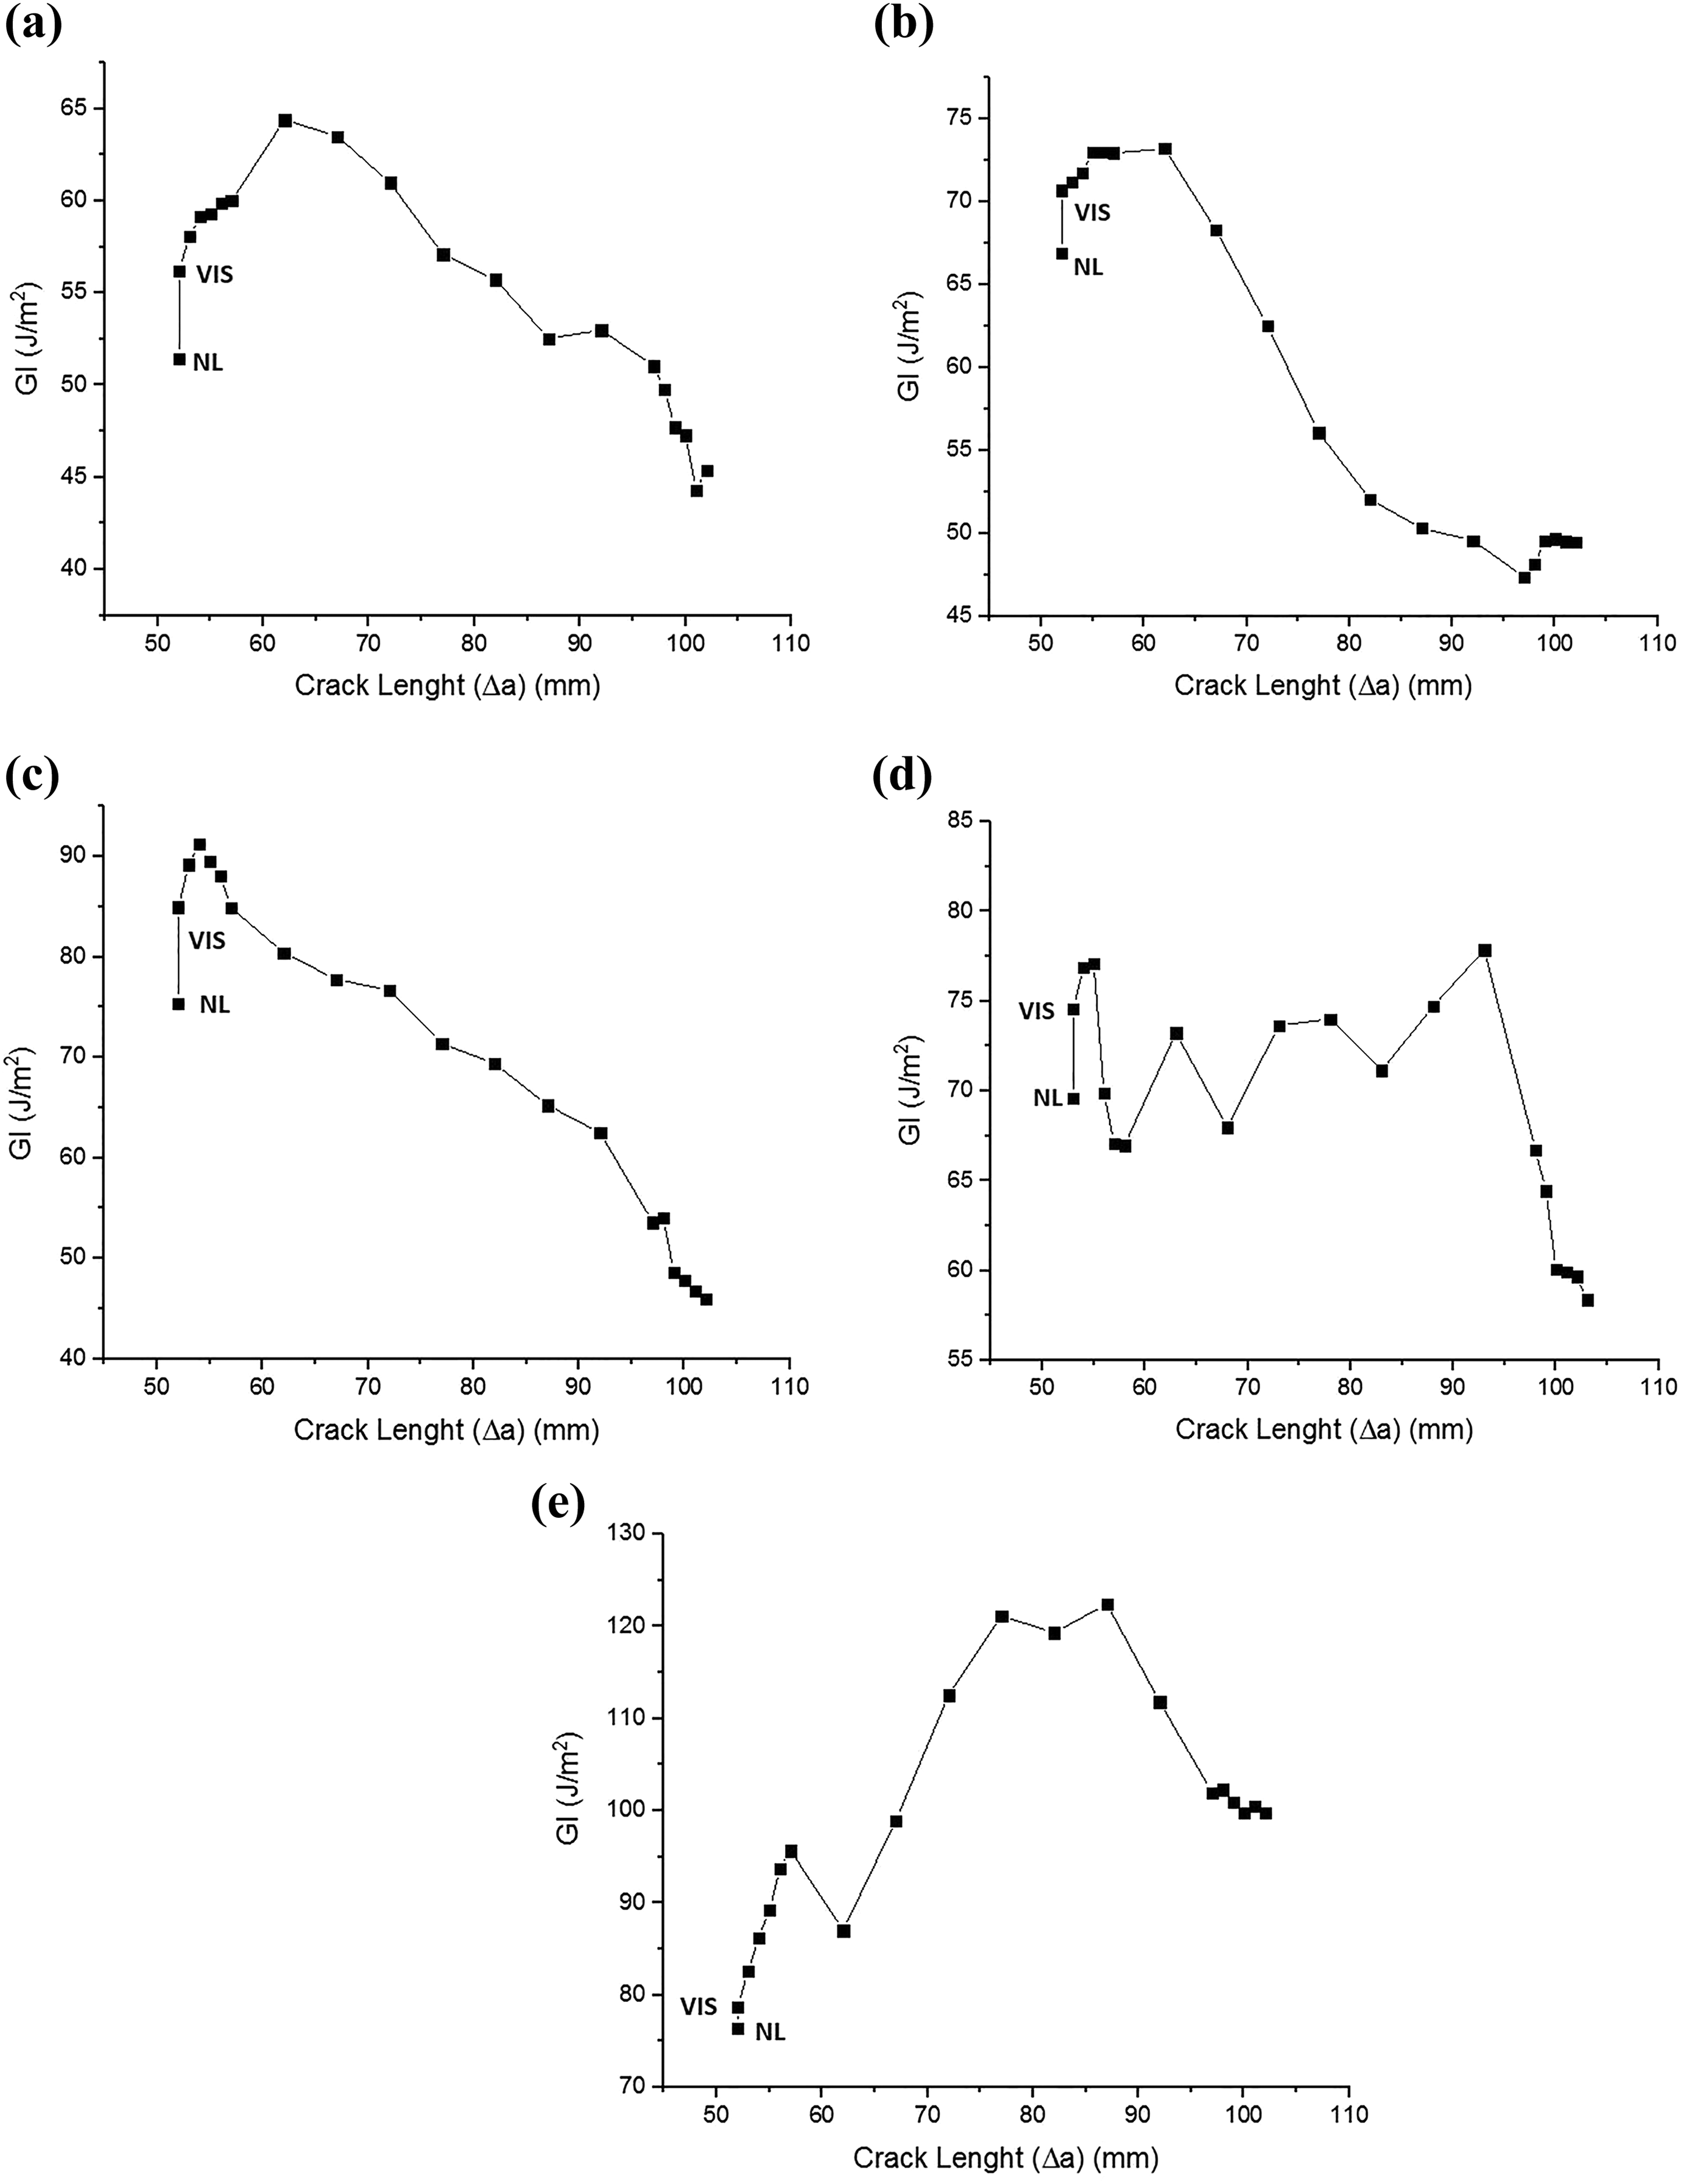
Resistance curves for DCB specimens at various printing speeds and nozzle temperatures for ABS and CF-PLA, respectively. (a) Print speed = 20 mm/s, nozzle temperature 230°C and 195°C. (b) Print speed = 30 mm/s, nozzle temperature 230°C and 195°C. (c) Print speed = 40 mm/s, nozzle temperature 230°C and 195°C. (d) Print speed = 30 mm/s, nozzle temperature 245°C and 210°C. (e) Print speed = 30 mm/s, nozzle temperature 260°C and 225°C.
Figure 7(a) to (c) shows the mode I resistance curve for the specimens at a printing speed of (a) 20 mm/s, (b) 30 mm/s, and (c) 40 mm/s with constant nozzle temperature of 230°C and 195°C for ABS and CF-PLA, respectively. The resistance curve is also shown for specimens made using nozzle temperature of (d) 245°C and 210°C, and (e) 260°C and 225°C for ABS and CF-PLA, respectively, while the printing speed was kept constant at 30 mm/s. The first point indicates GIc value at the nonlinearity point and the second one is GIc at VIS (at which the delamination is visually observed). The further points indicated in Figure 7(a) to (e) correspond to the propagation of crack as the delamination advances. When the overall data are analyzed, the value of the GI increases and then decreases as the propagation advances, which shows low fracture toughness due to the absence of crack jumping and fiber bridging effect. Average GIc at VIS and GI − prop values for different printing speeds and nozzle temperatures are presented in Table 5.
Average GIc and GI − prop values for different printing speeds and nozzle temperatures.
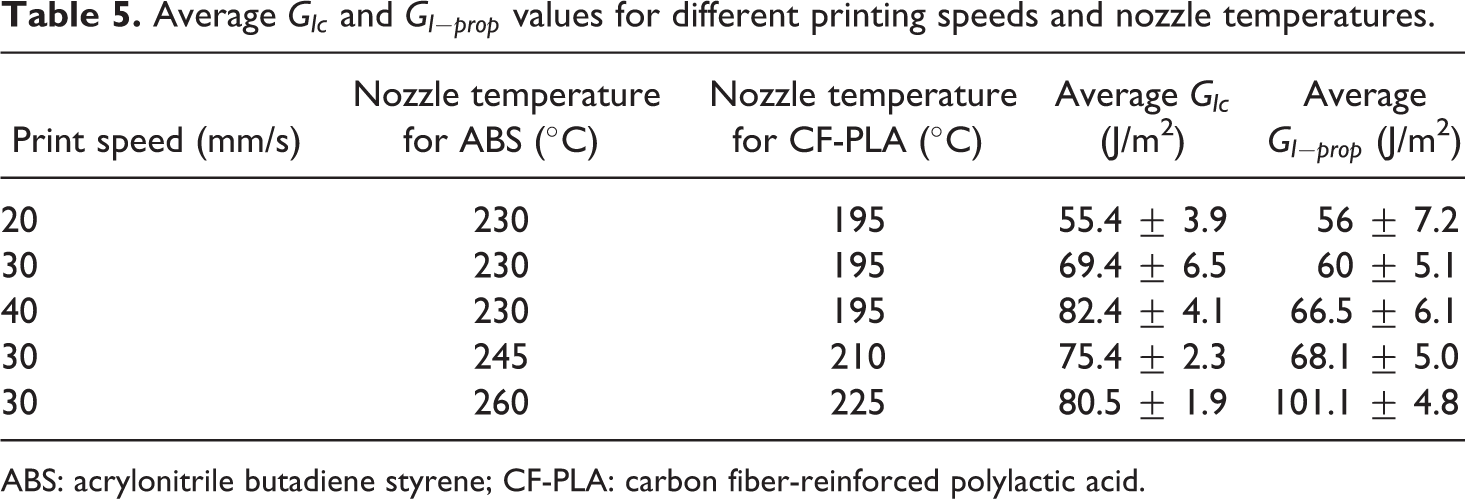
ABS: acrylonitrile butadiene styrene; CF-PLA: carbon fiber-reinforced polylactic acid.
Effect of printing parameters on G Ic in mode I
First, the DCB specimens were fabricated at a printing speed of 20, 30, and 40 mm/s keeping the nozzle temperature constant for ABS and CF-PLA, that is, 230°C and 195°C, respectively. Then, printing speed was kept constant at 30 mm/s and the nozzle temperatures for ABS and CF-PLA were increased with increments of 15°C each, which were then tested in mode I loading. The following Figure 8(a) and (b) shows the trend of GIc against variation in printing speed and nozzle temperature, respectively.
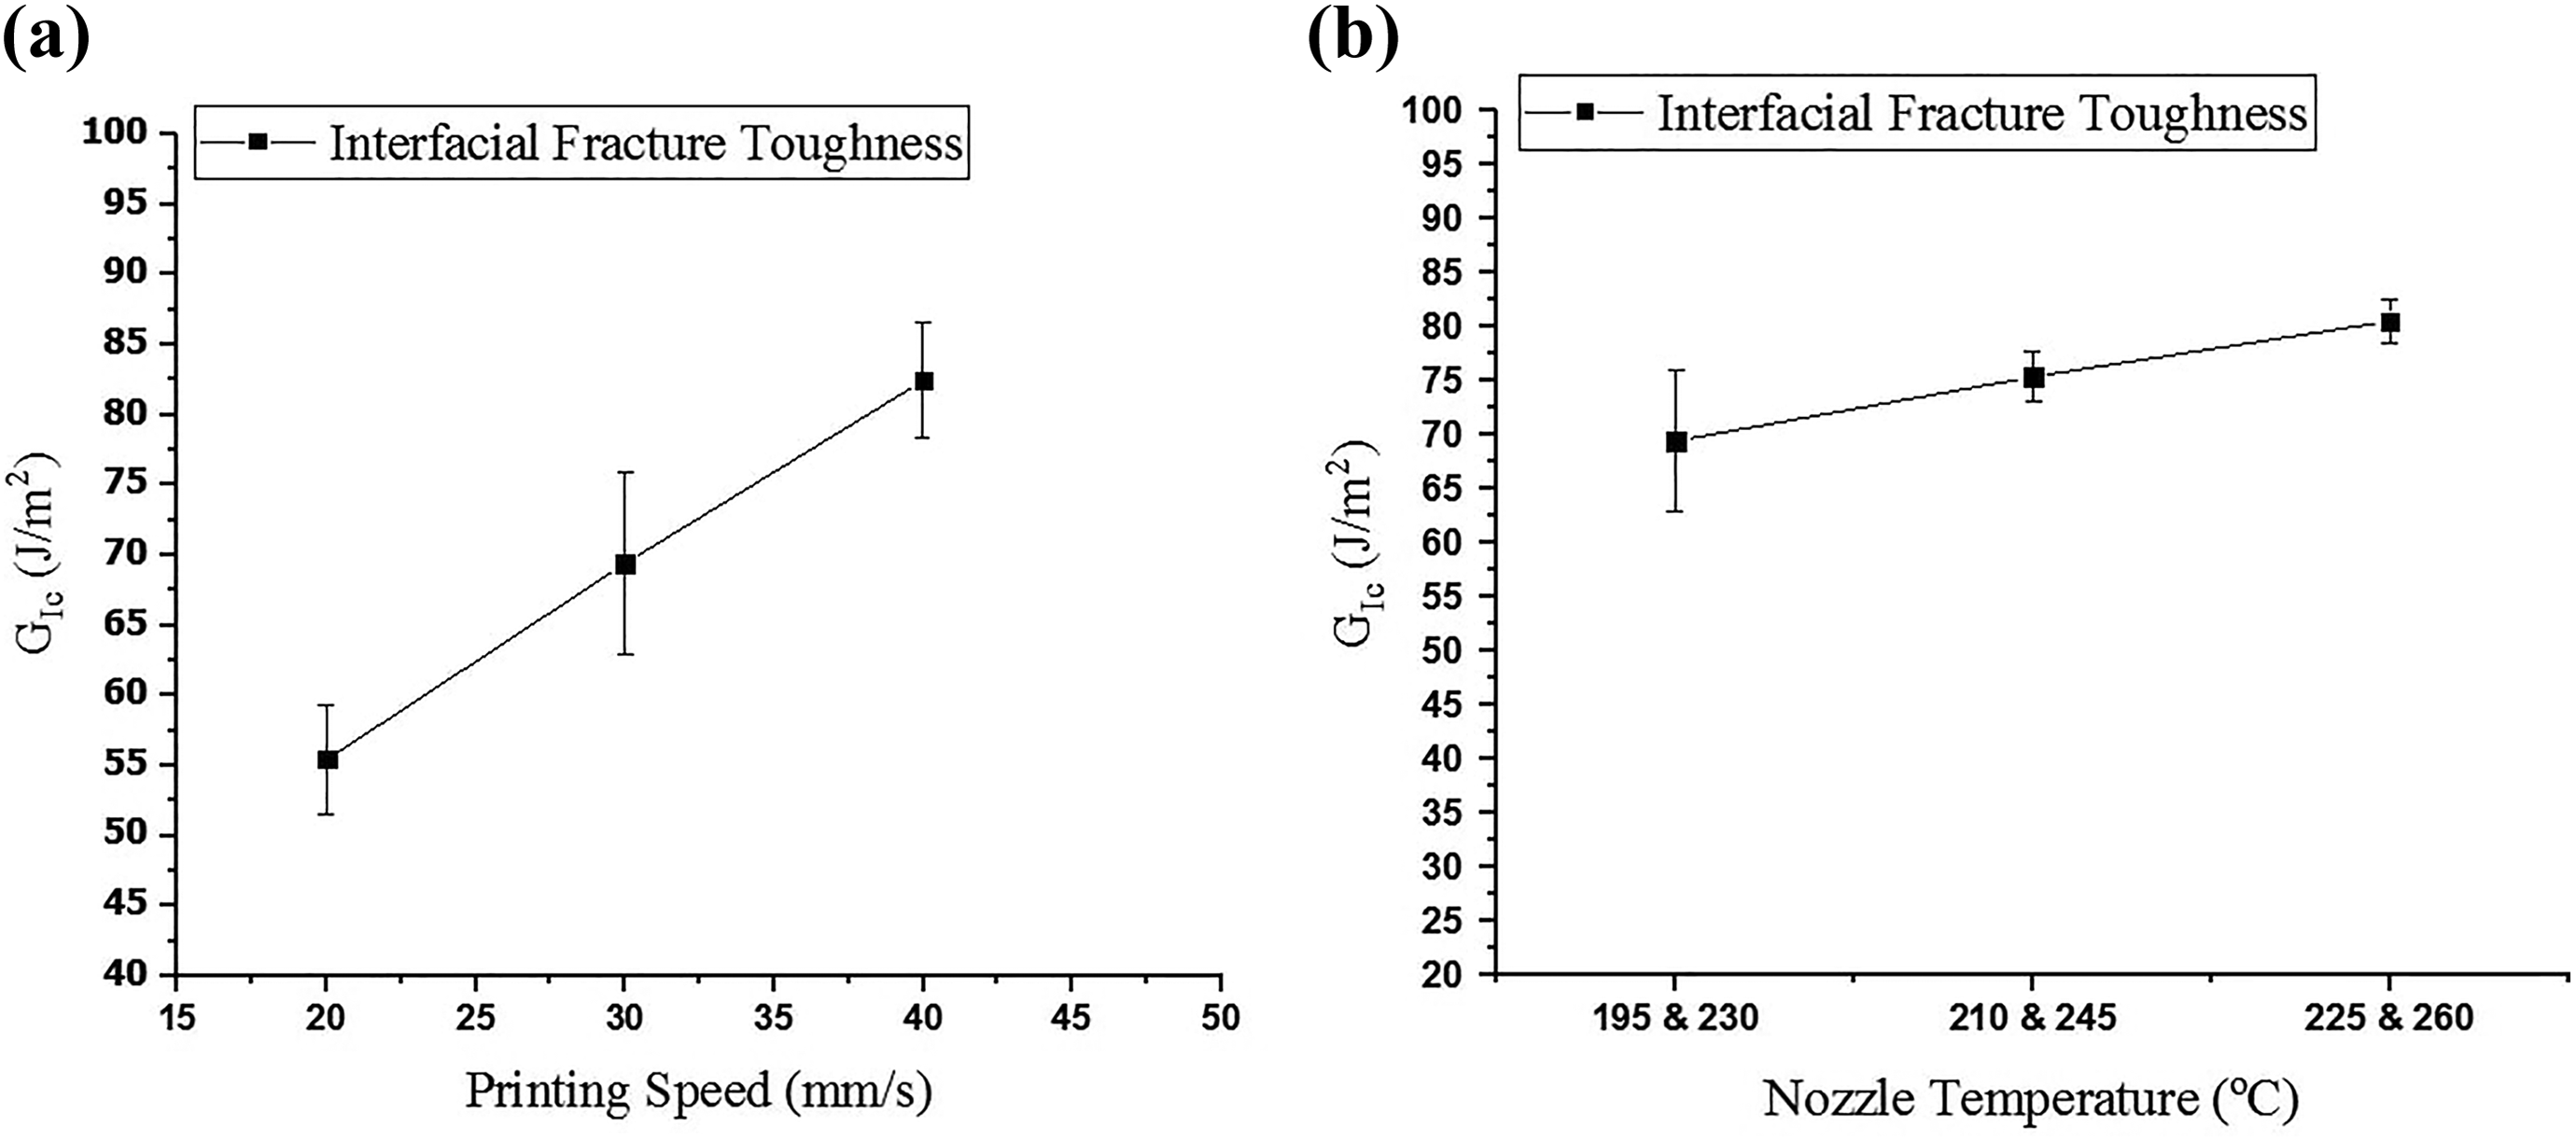
(a) GIc versus printing speed. (b) GIc versus nozzle temperature.
Figure 8(a) shows the average critical interfacial fracture toughness values with corresponding standard deviations against printing speeds. The minimum interfacial fracture toughness (55 J/m2) was obtained for the print speed of 20 mm/s and the maximum value of the interfacial fracture toughness (82.5 J/m2) was obtained for the print speed of 40 mm/s, which accounts for 50% increase in the interfacial fracture toughness.
Similarly, Figure 8(b) shows the average critical interfacial fracture toughness values with corresponding standard deviations against nozzle temperature. The minimum interfacial fracture toughness (69.4 J/m2) was obtained for the nozzle temperature of 230°C and 195°C and the maximum value of the interfacial fracture toughness (80 J/m2) was obtained for the nozzle temperature of 260°C and 225°C, which accounts for 15% increase in the interfacial fracture toughness.
In addition, GIc values were also determined using the BT and CCM for comparison with MBT. Figure 9 and similar trends were observed for GIc against variation of printing parameters.
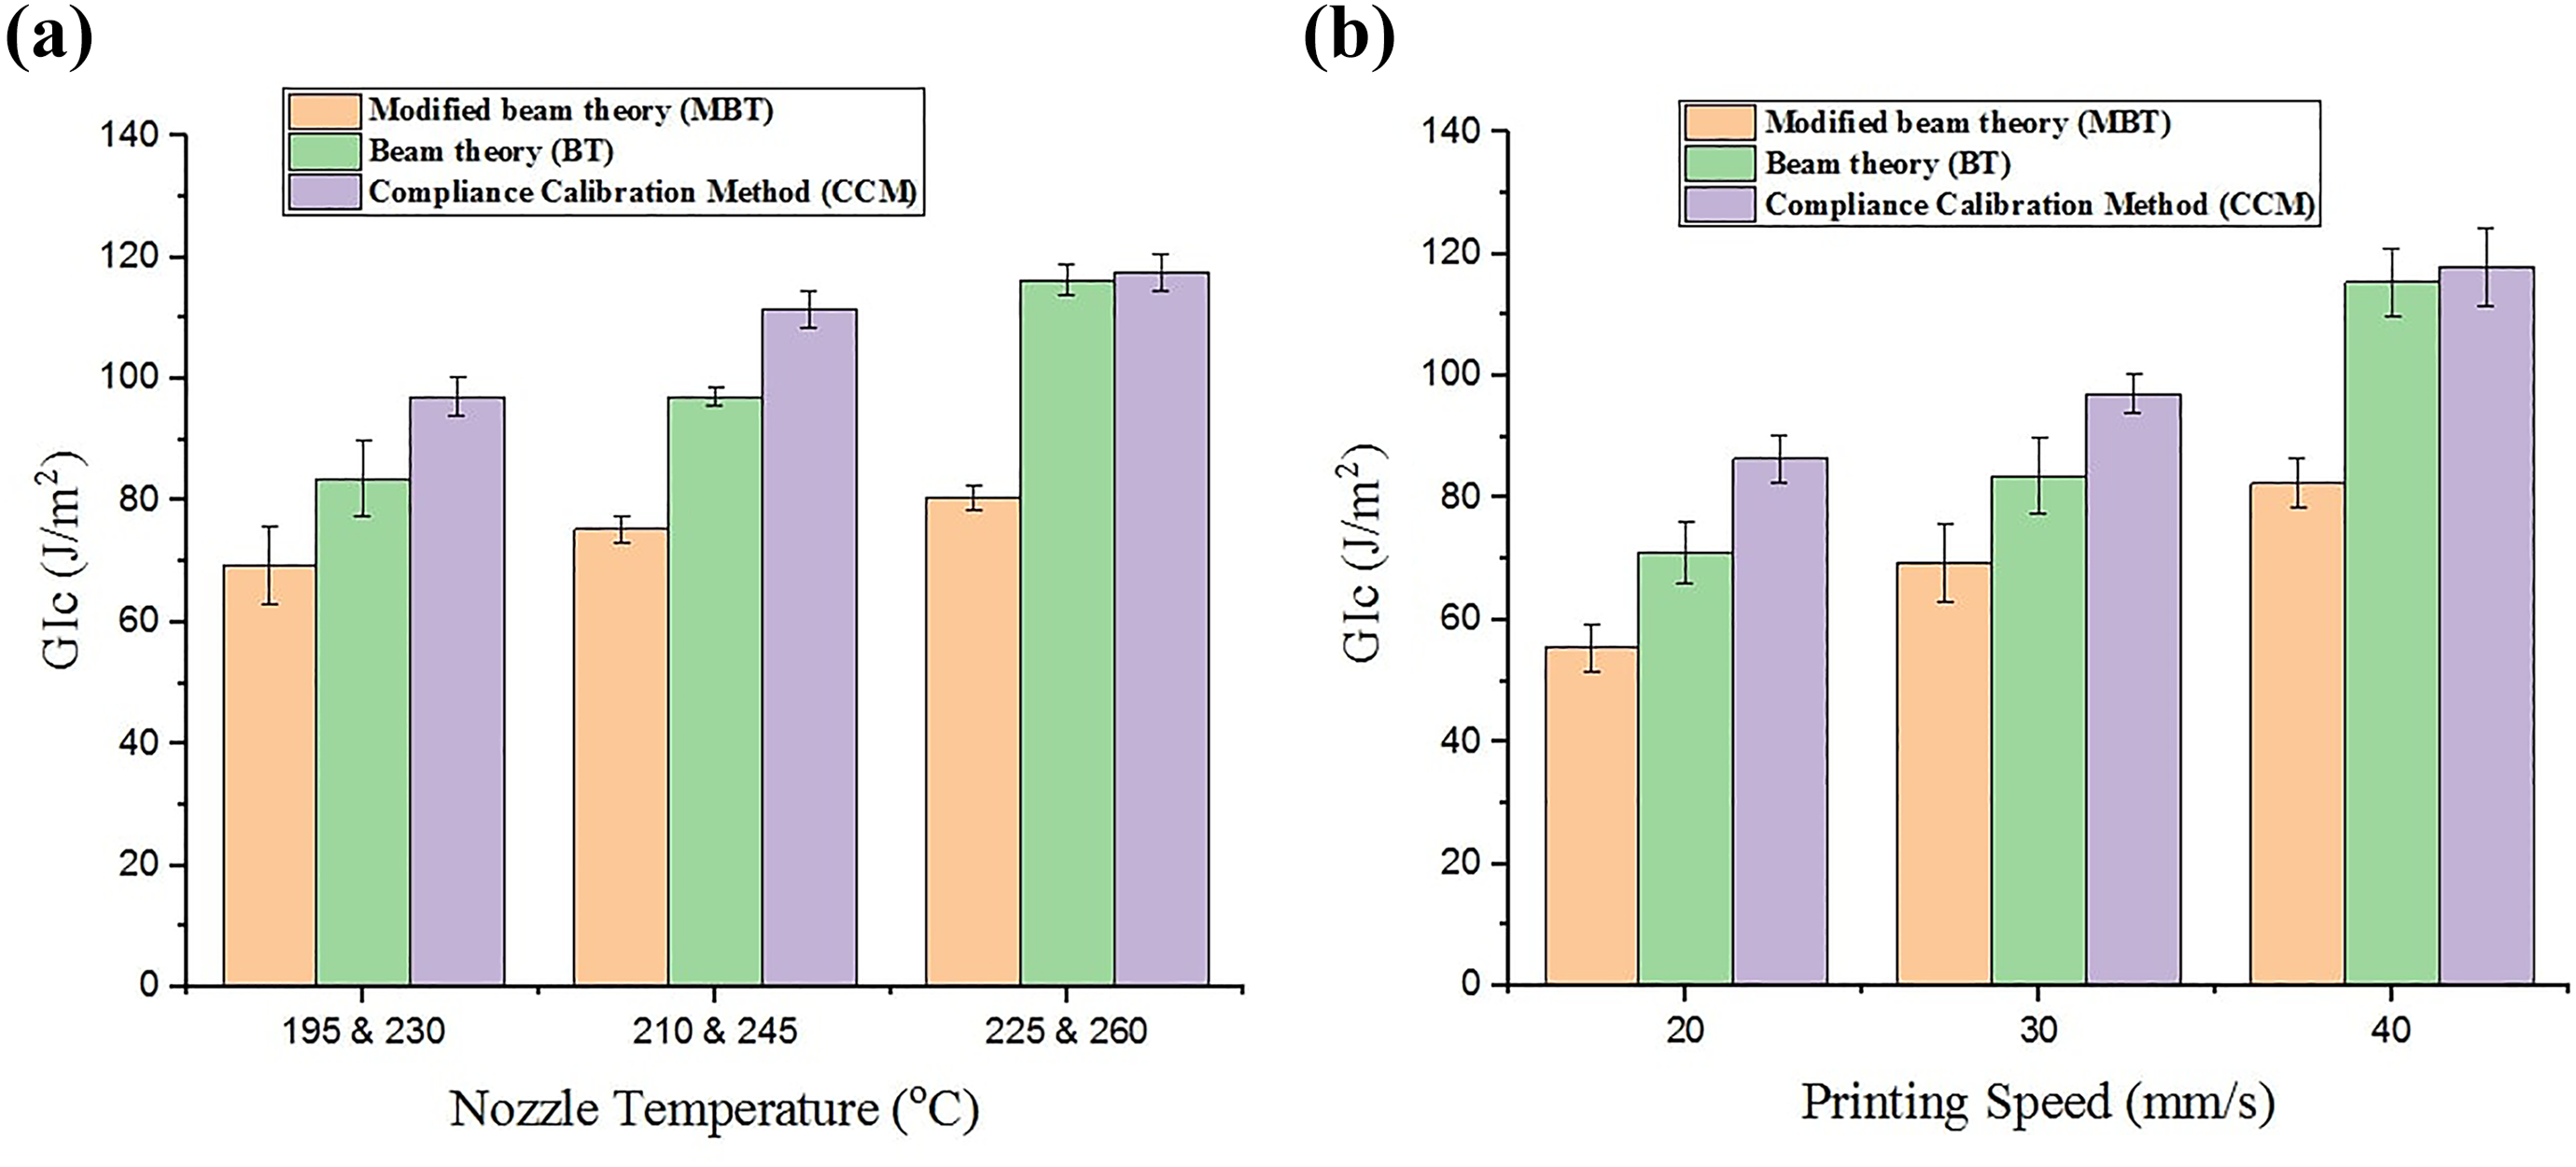
Comparison of MBT, BT, and CCM for different (a) printing speeds. (b) Nozzle temperatures.
Mode II
Mode II test was performed using ENF test, according to the procedure described by ASTM Standard D7905/D7905M-14. 32 Using the CCM, the crack onset fracture toughness GIIc at the critical load of NPC and PC fracture test was determined by equation (4):
where b is the specimen width, P is the critical/maximum load at which the fracture occurs, m is a CC coefficient, and a0 is the initial crack length. NPC and PC tests require three loadings each for a single specimen. The first two loadings are for the CC test and the third one for the fracture test to propagate the crack at critical load (Pc). At each mark, a = 20 mm, a = 40 mm, and also at initial crack length during fracture test a0 = 30 mm on the specimen, compliance C was obtained by taking the inverse of the slope of load–displacement curve using linear regression analysis for each loading. These compliances were then plotted (as shown in Figure 10) against the crack length cubed (a3) to calculate CC coefficients A and m using the following equation (5).
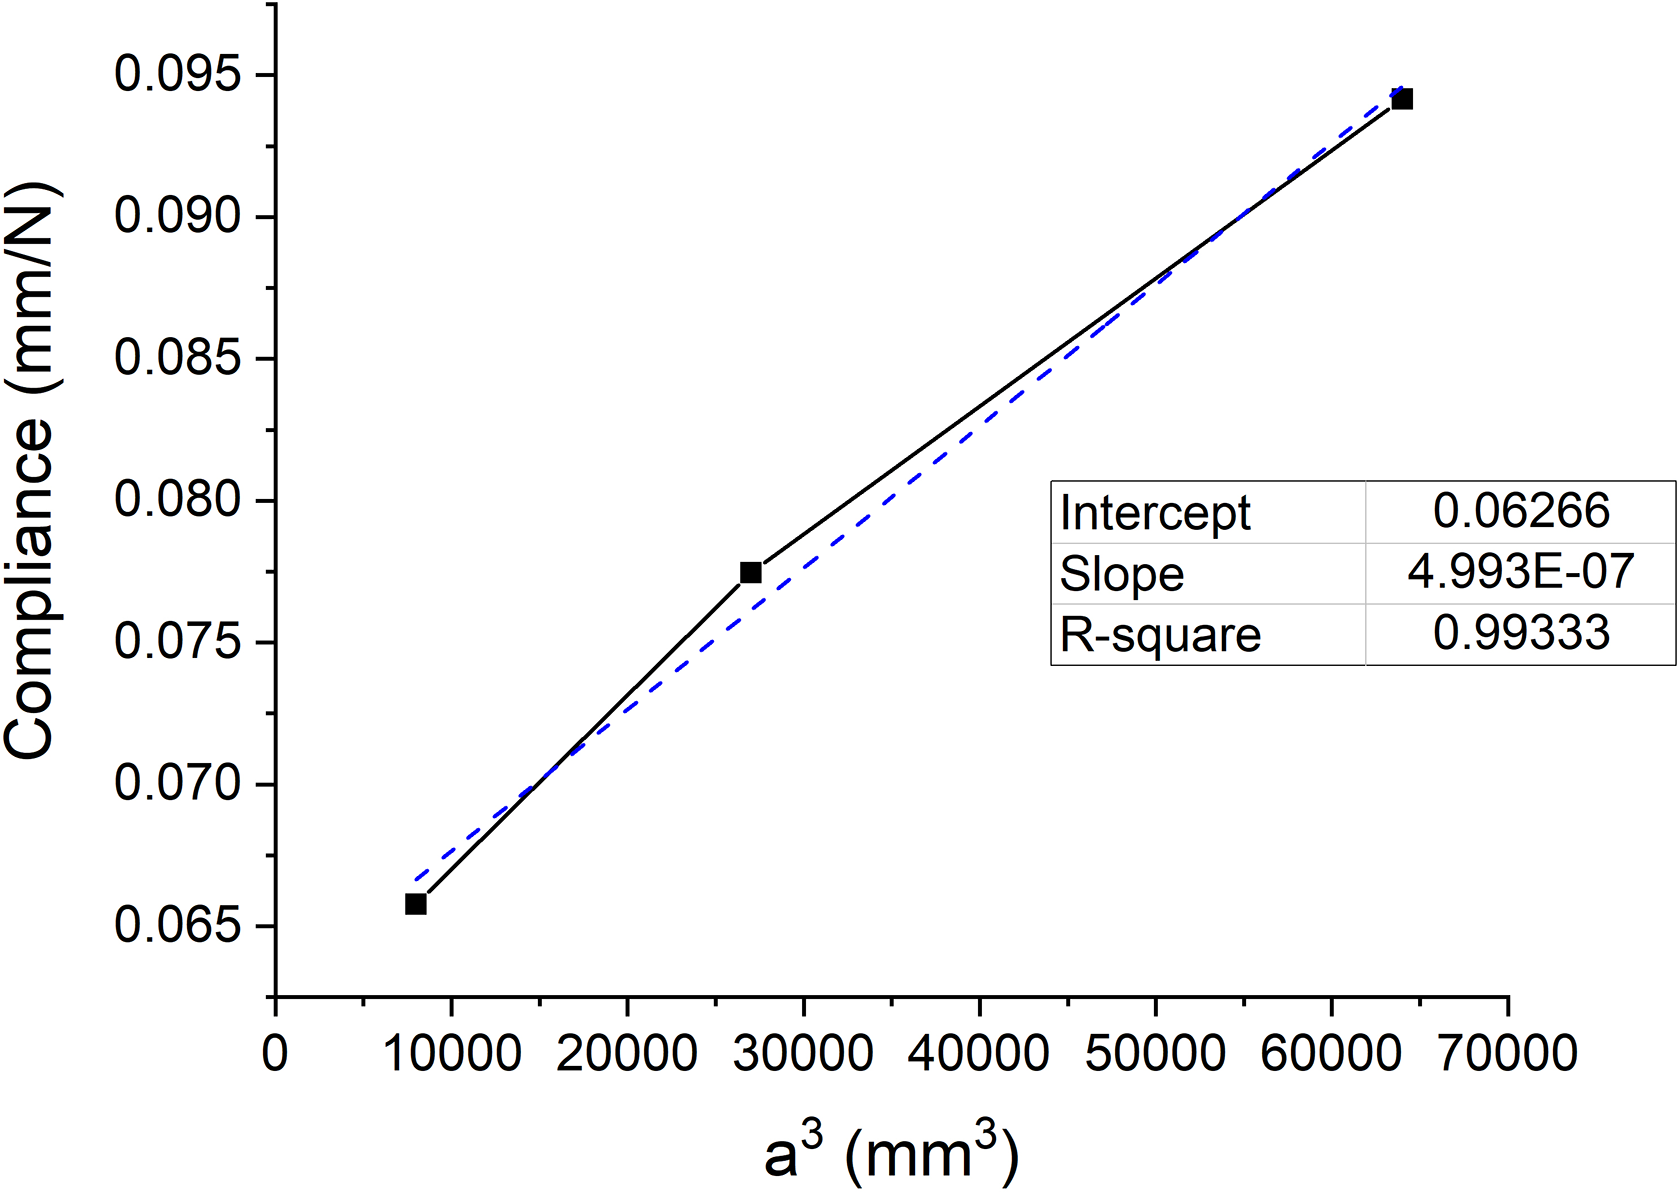
A sample of compliance (C) versus crack length cubed (a3).

where A and m were determined by the linear regression of the plot. Moreover, A is the y-intercept and m is the slope. Rearranging the above equation also gives the relationship (equation 6) of crack length with compliance, which is used to determine the actual crack length propagated during the NPC fracture test as it cannot be determined visually or using the digital microscope:
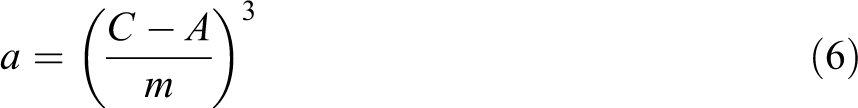
To find the actual crack length after NPC test, compliance of the unloading data curve of the NPC fracture test is used in the above equation to find the primary conditions for the PC fracture test. The procedure for the CC for PC test is similar to that of NPC. The new crack tip was marked on the edge of the specimen from where the two compliance and PC fracture marks were made. In the same manner as in NPC, the newly established A and m values from the CC were then used to determine the PC GIIc.
Interfacial fracture toughness for mode II was determined in terms of CSERR by considering the peak load from load–displacement curve and regarded as GIIc using CCM data reduction. Sample load–displacement curves of specimens at different printing speeds and nozzle temperatures for ABS and CF-PLA are shown in Figure 11 for NPC and Figure 12 for PC fracture test. Average GIIc values for NPC and PC test at different printing speeds and nozzle temperatures are presented in Table 6.
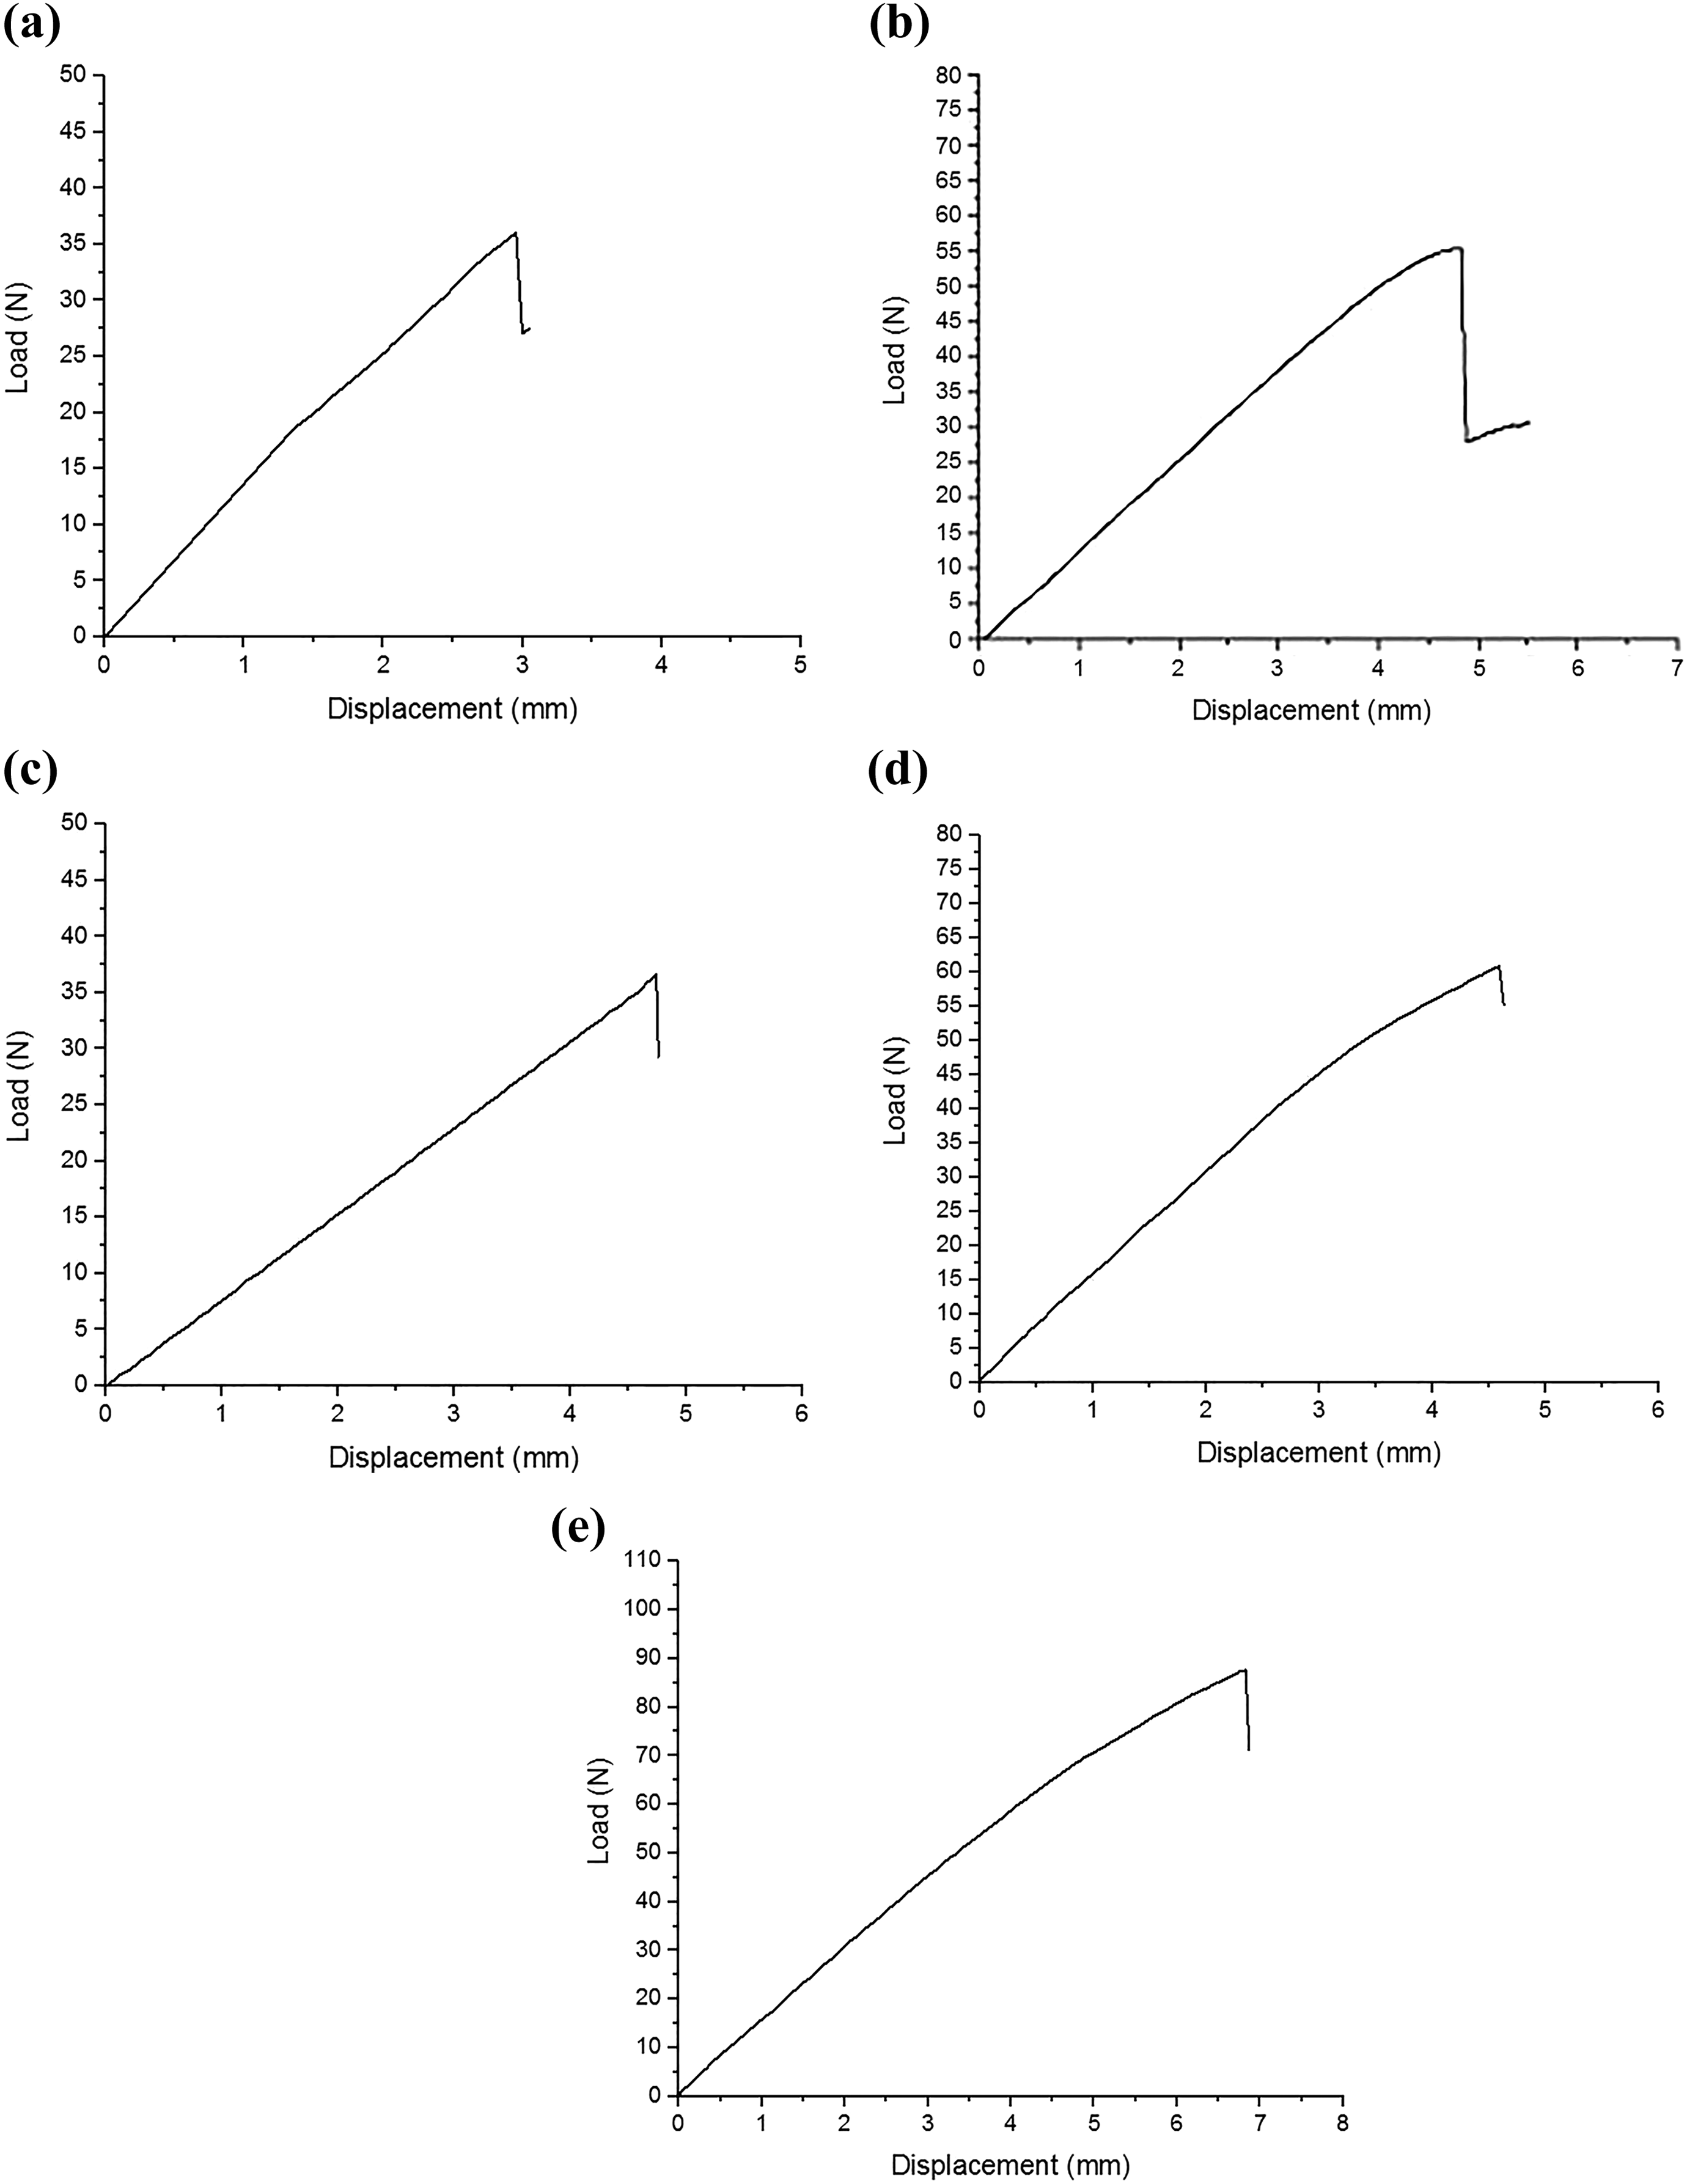
Load–displacement curves for NPC ENF test at various printing speeds and nozzle temperatures for ABS and CF-PLA, respectively. (a) Print speed = 20 mm/s, nozzle temperature 230°C and 195°C. (b) Print speed = 30 mm/s, nozzle temperature 230°C and 195°C. (c) Print speed = 40 mm/s, nozzle temperature 230°C and 195°C. (d) Print speed = 30 mm/s, nozzle temperature 245°C and 210°C. (e) Print speed = 30 mm/s, nozzle temperature 260°C and 225°C.
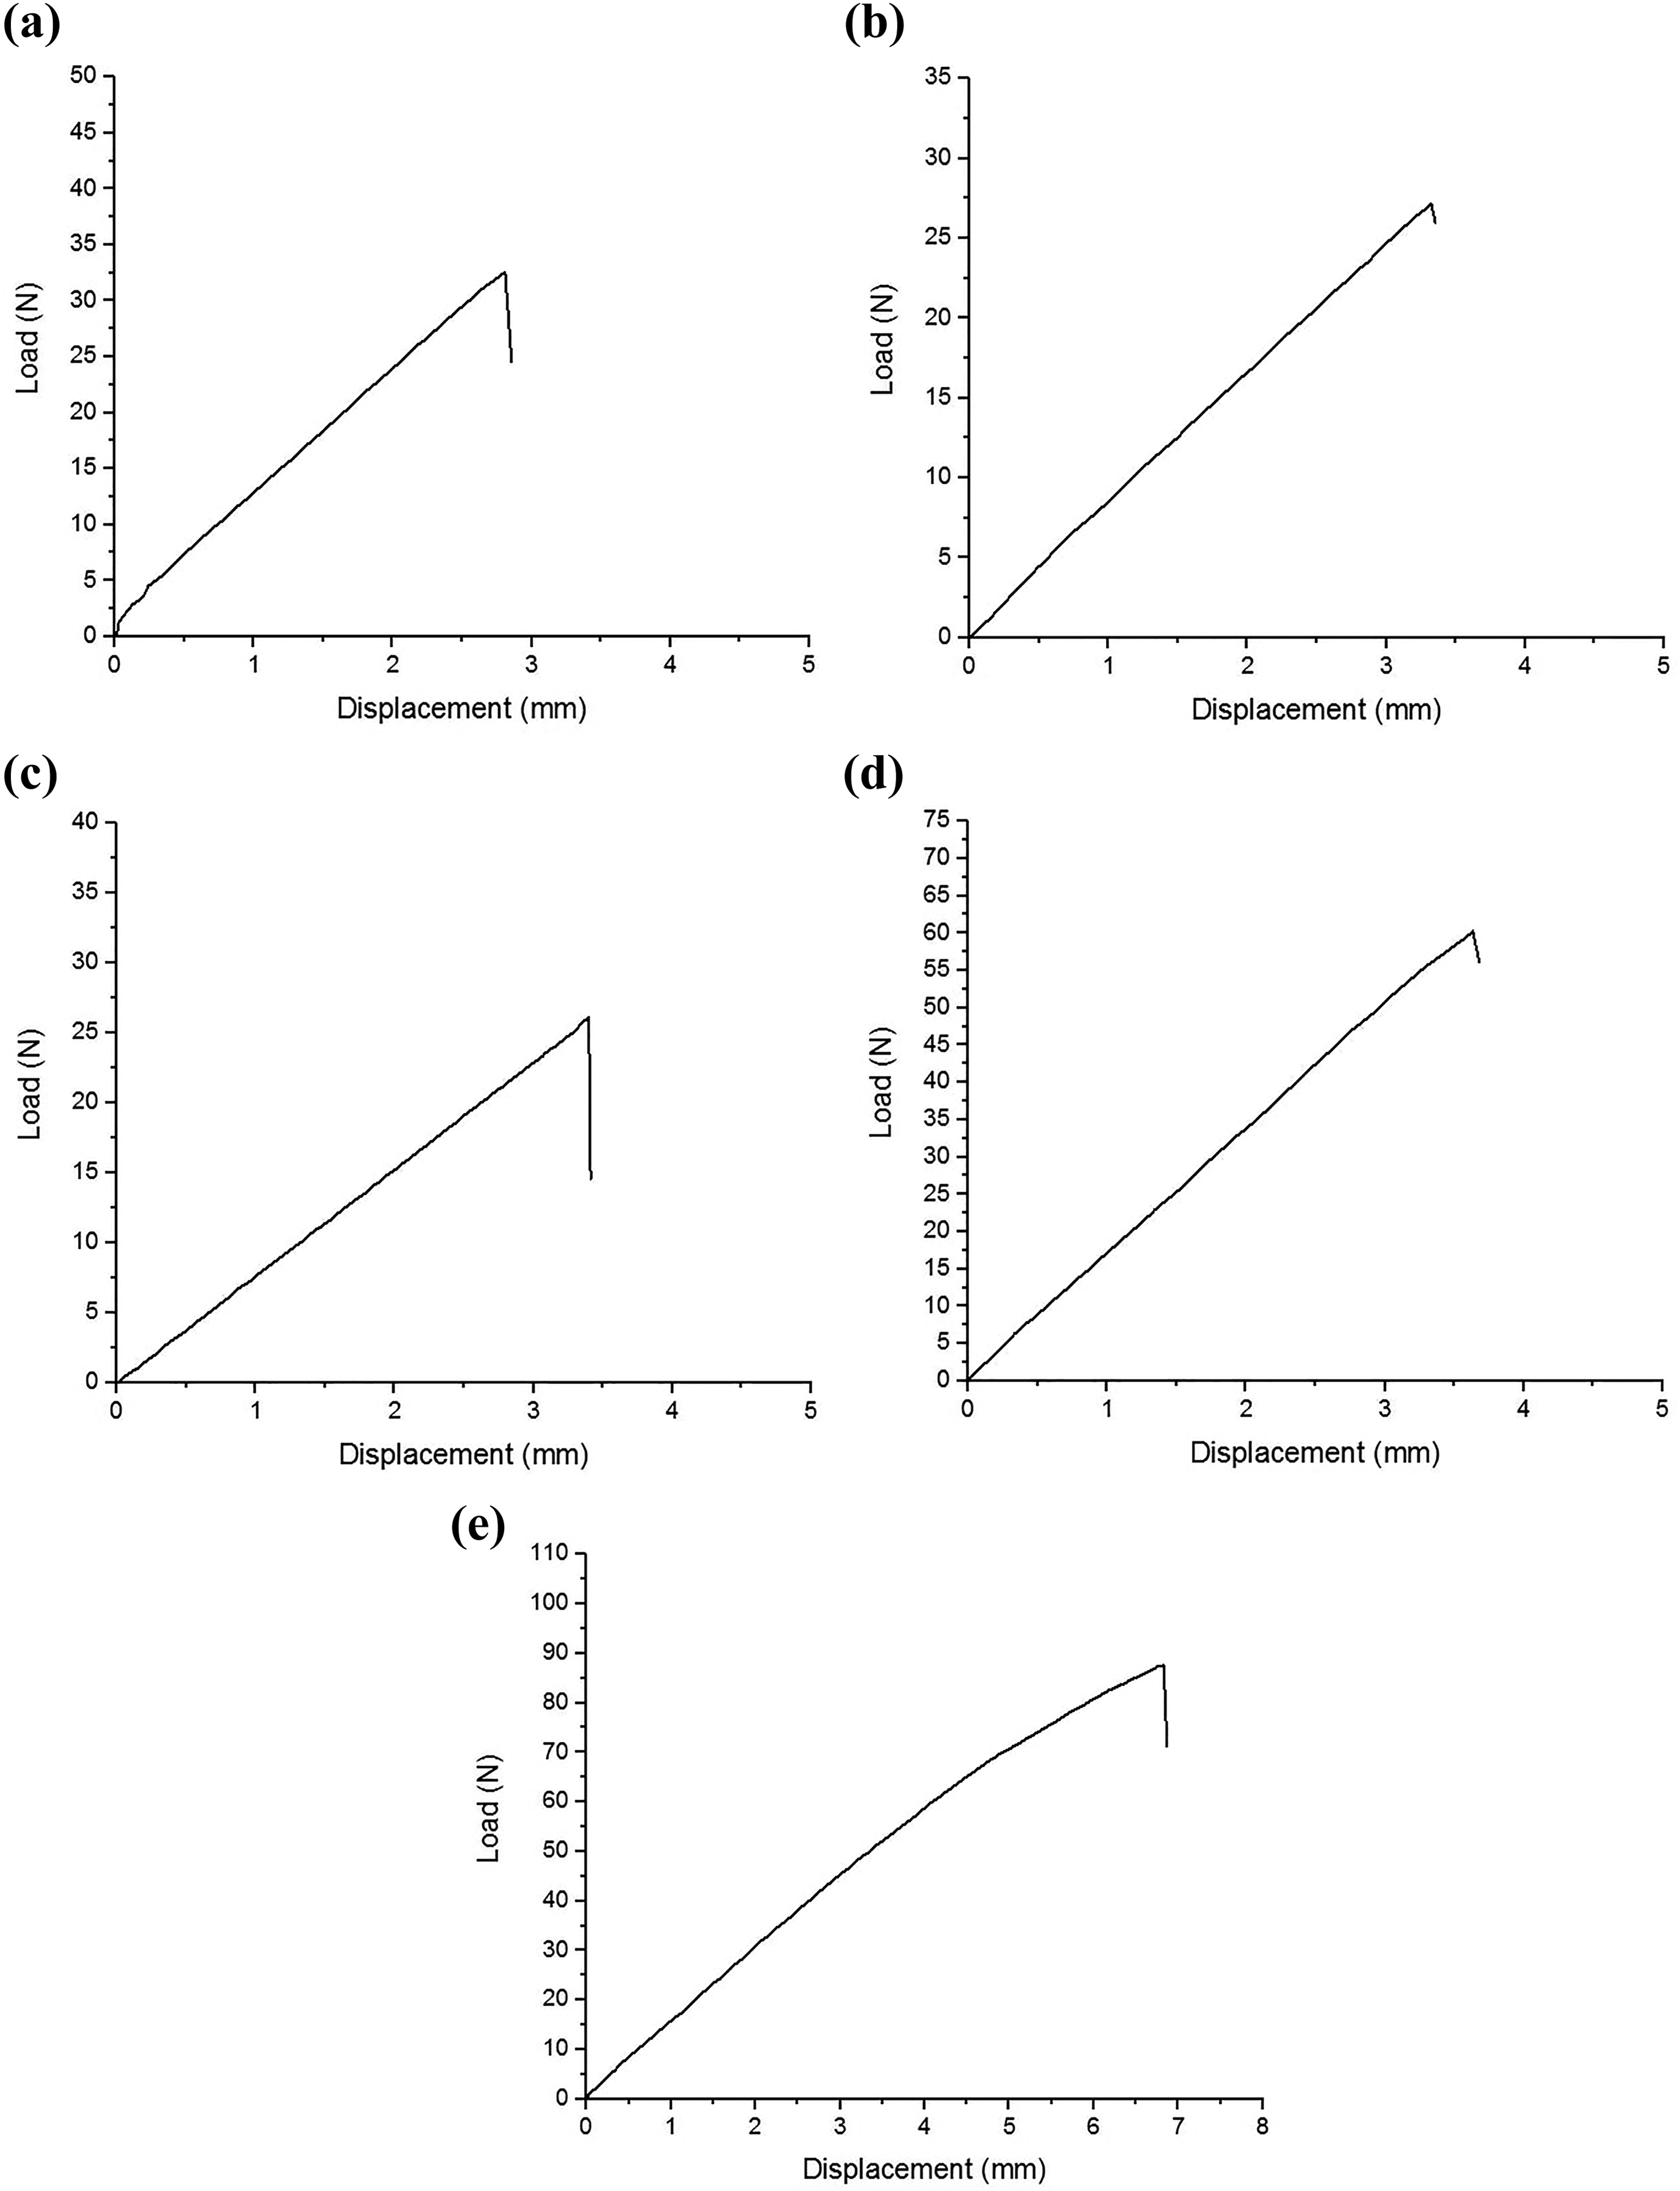
Load–displacement curves for PC ENF test at various printing speeds and nozzle temperatures for ABS and CF-PLA, respectively. (a) Print speed = 20 mm/s, nozzle temperature 230°C and 195°C. (b) Print speed = 30 mm/s, nozzle temperature 230°C and 195°C. (c) Print speed = 40 mm/s, nozzle temperature 230°C and 195°C. (d) Print speed = 30 mm/s, nozzle temperature 245°C and 210°C. (e) Print speed = 30 mm/s, nozzle temperature 260°C and 225°C.
Average values of GIIc (NPC) and GIIc (PC) for different printing speeds and nozzle temperatures.
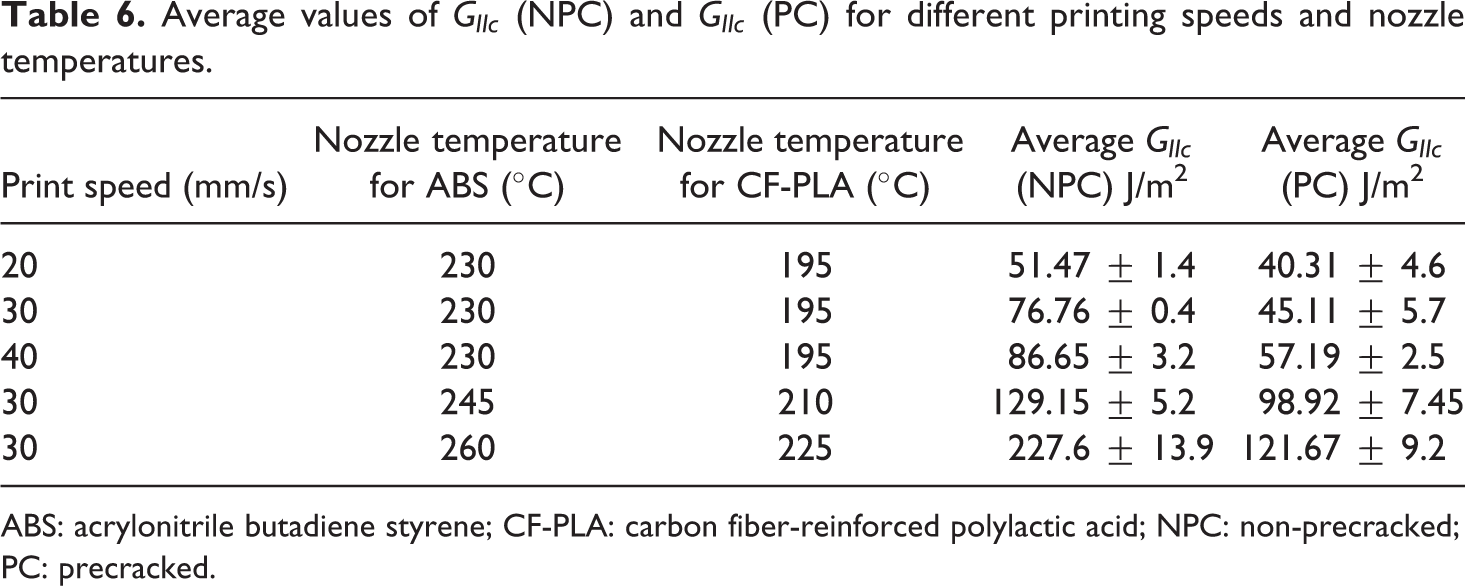
ABS: acrylonitrile butadiene styrene; CF-PLA: carbon fiber-reinforced polylactic acid; NPC: non-precracked; PC: precracked.
Effect of printing parameters on G IIc in mode II
Figures 13 and 14 show the GIIC results for the fracture test from the insert end (NPC test) and shear PC test at different printing speeds and nozzle temperatures. It can be observed that the fracture toughness values for NPC test are always higher than the PC test because the blunt crack in the NPC requires more energy to propagate than the sharp crack in PC test.
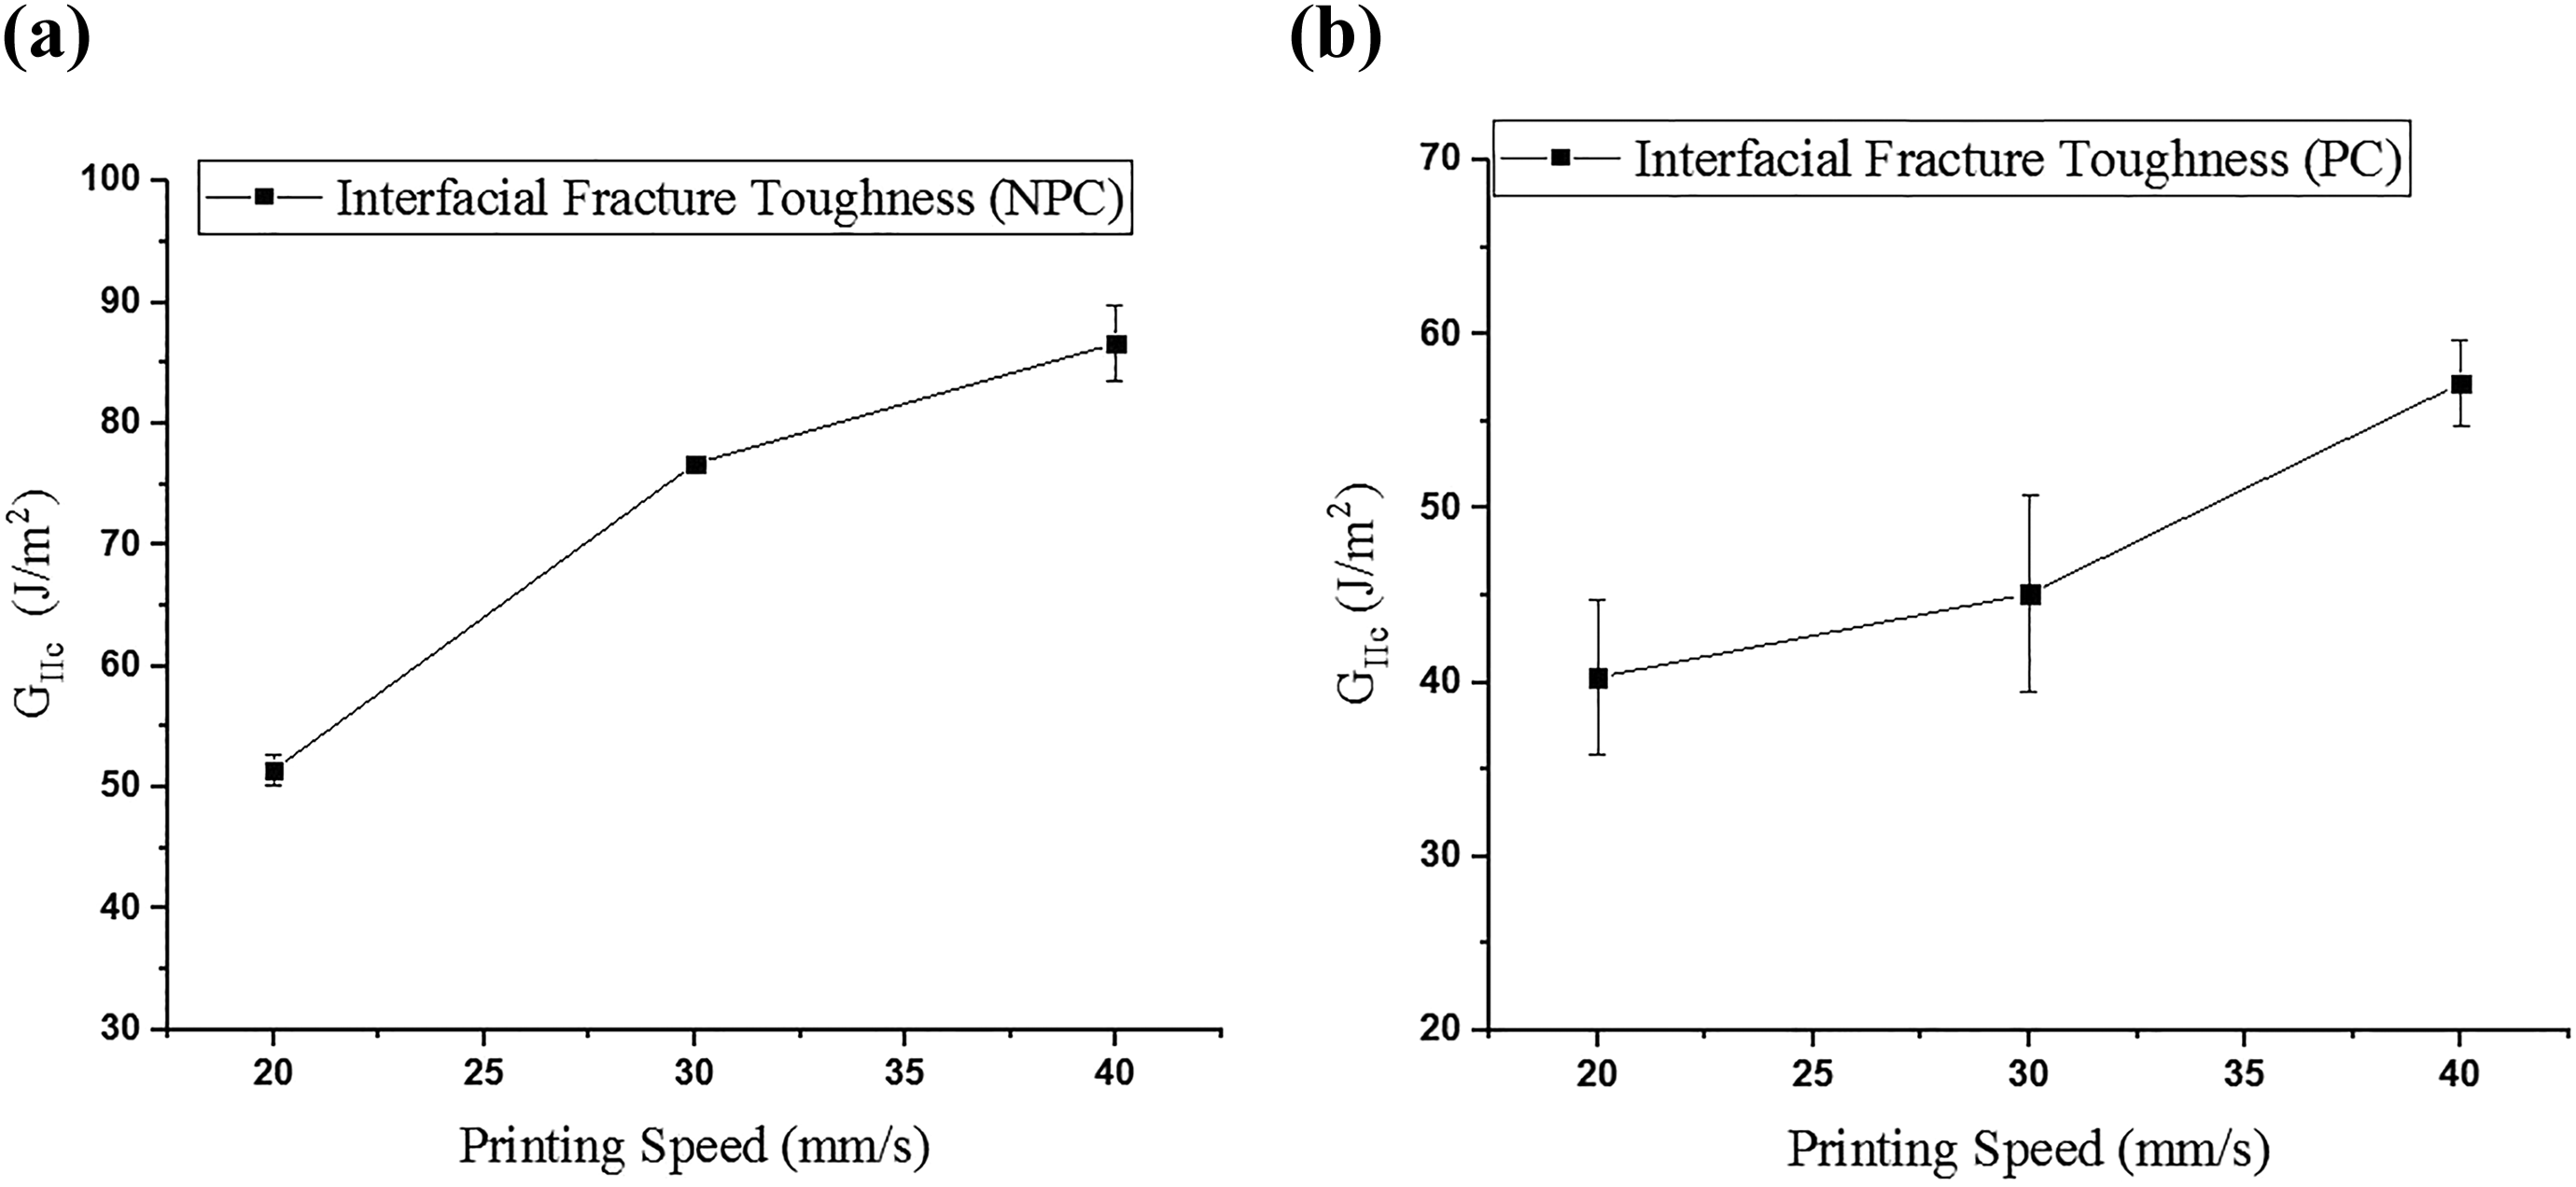
GIIC versus printing speed for (a) NPC test and (b) PC test.
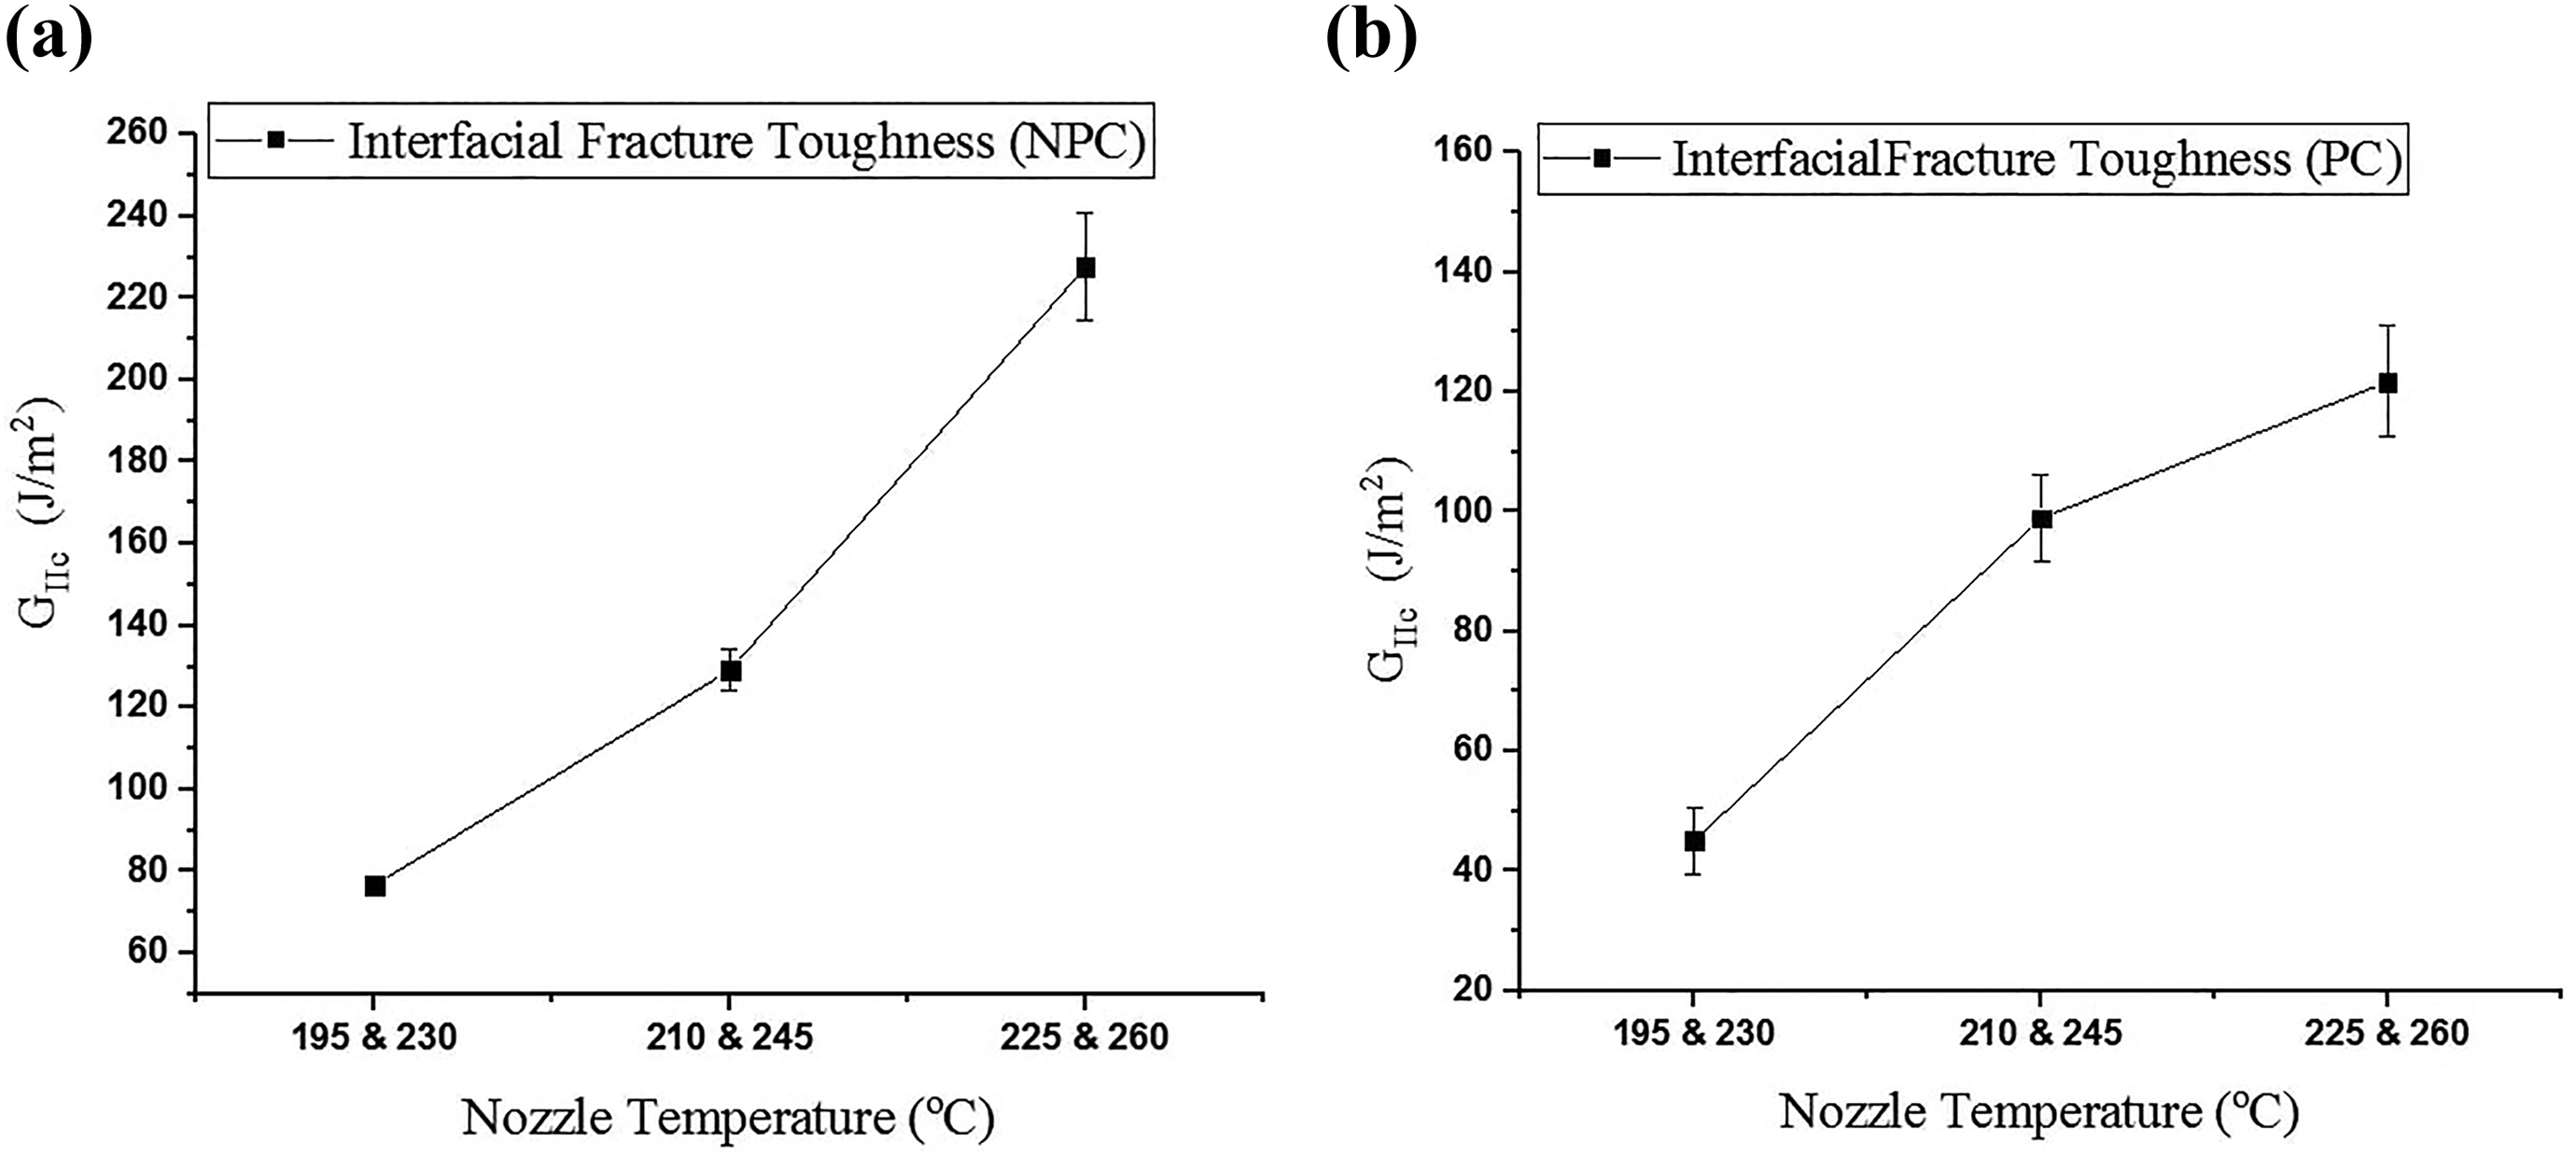
GIIC versus nozzle temperature for (a) NPC test and (b) PC test.
Figure 13 shows the average critical interfacial fracture toughness values with corresponding standard deviations against printing speeds and nozzle temperatures, respectively. The results show that by increasing the printing speed by 100%, NPC GIIC increases by 68% and PC GIIC by 42%, while increasing the nozzle temperature by 13–15%, NPC GIIC increases by 196% and PC GIIC by 170%.
Mixed mode (I/II)
Interfacial fracture toughness, G, of the composite specimen at various mode I to mode II loading ratios was determined using the MMB test, according to ASTM Standard D6671/D6671M-13. 33 For each mode mixture ratio, G at various crack lengths is shown in Figure 15. Furthermore, CSERR Gc against mode mixture ratios is shown in Figure 16. This graph shows the change of strain energy release rate as the ratio of mode II loading increase as compared to mode I. Furthermore, this graph can used to derive the required parameters for the simulation of mixed-mode delamination of the ABS+CF-PLA composite fabricated through FDM.
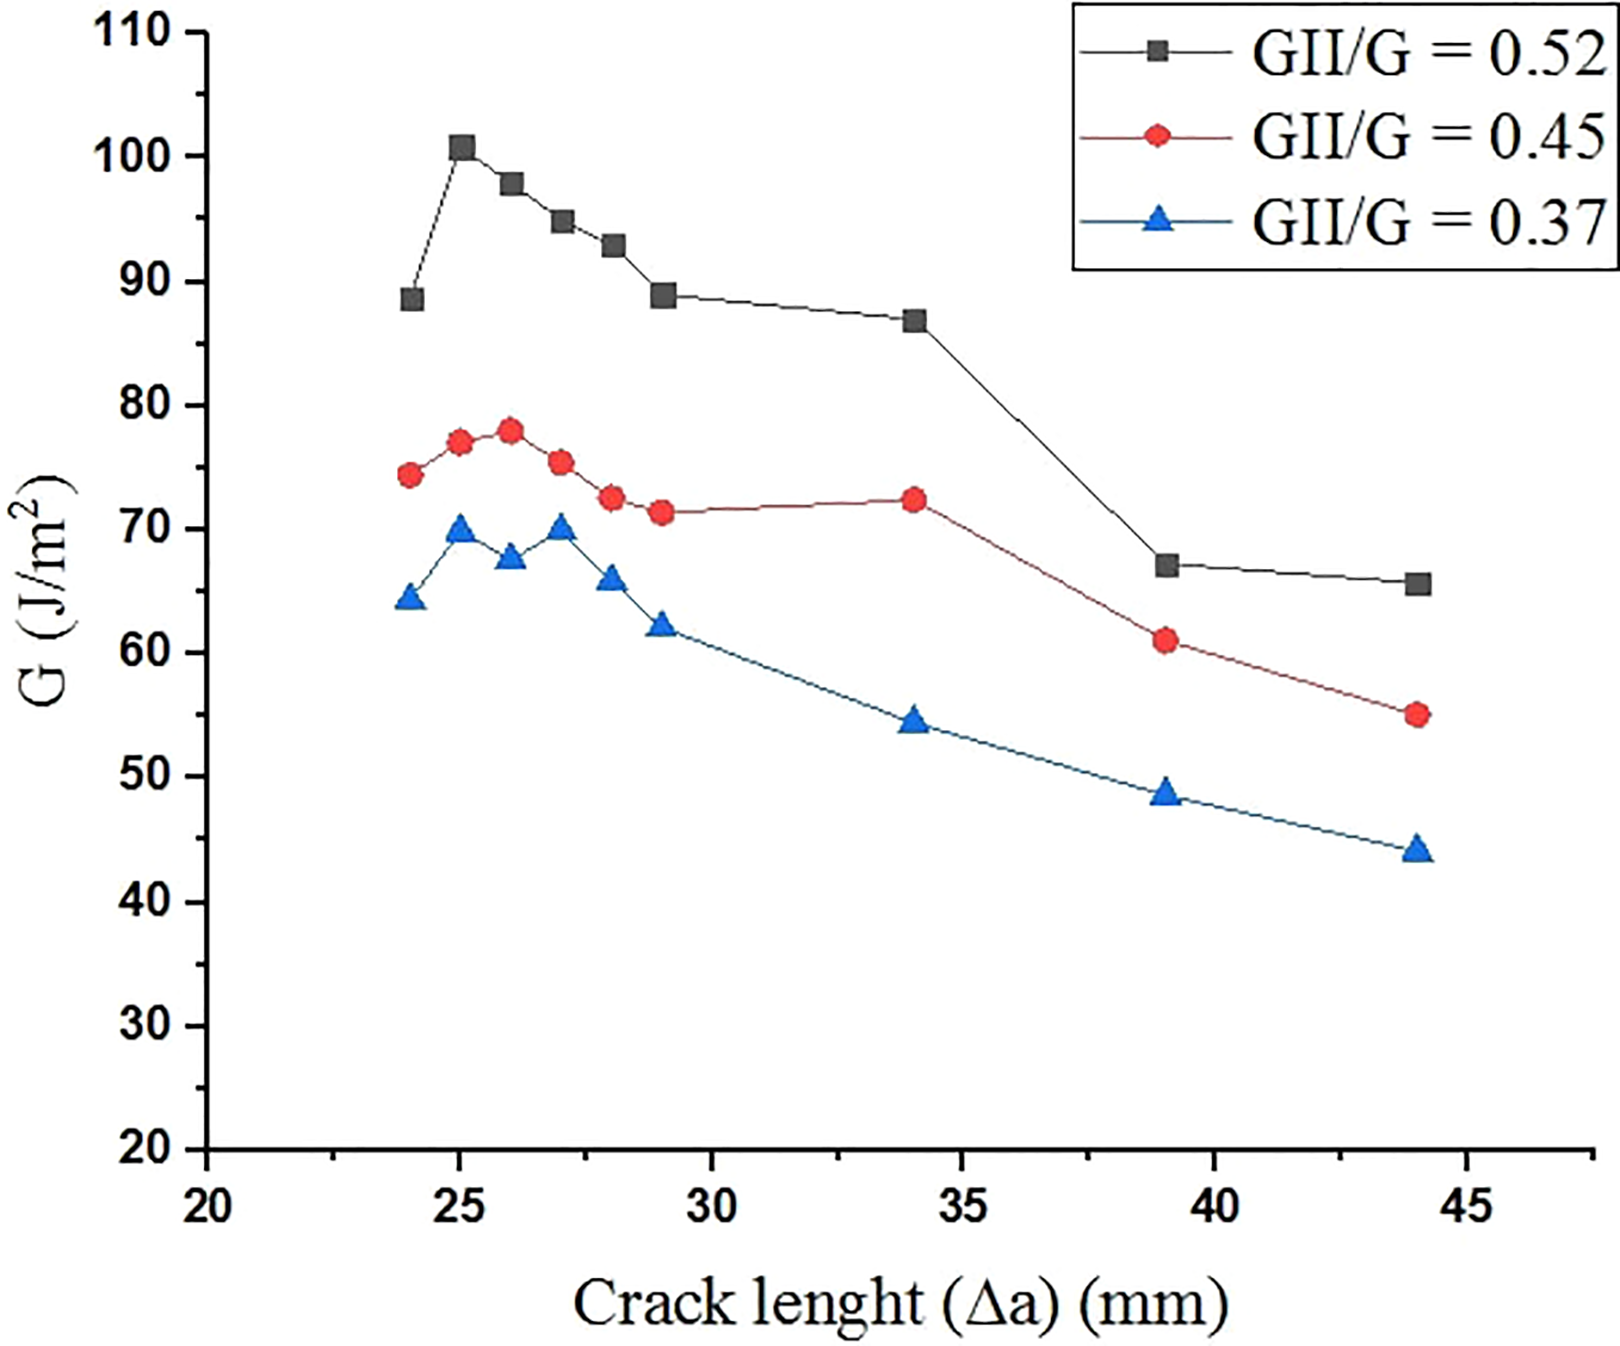
G versus crack length for three-mode mixture ratios.
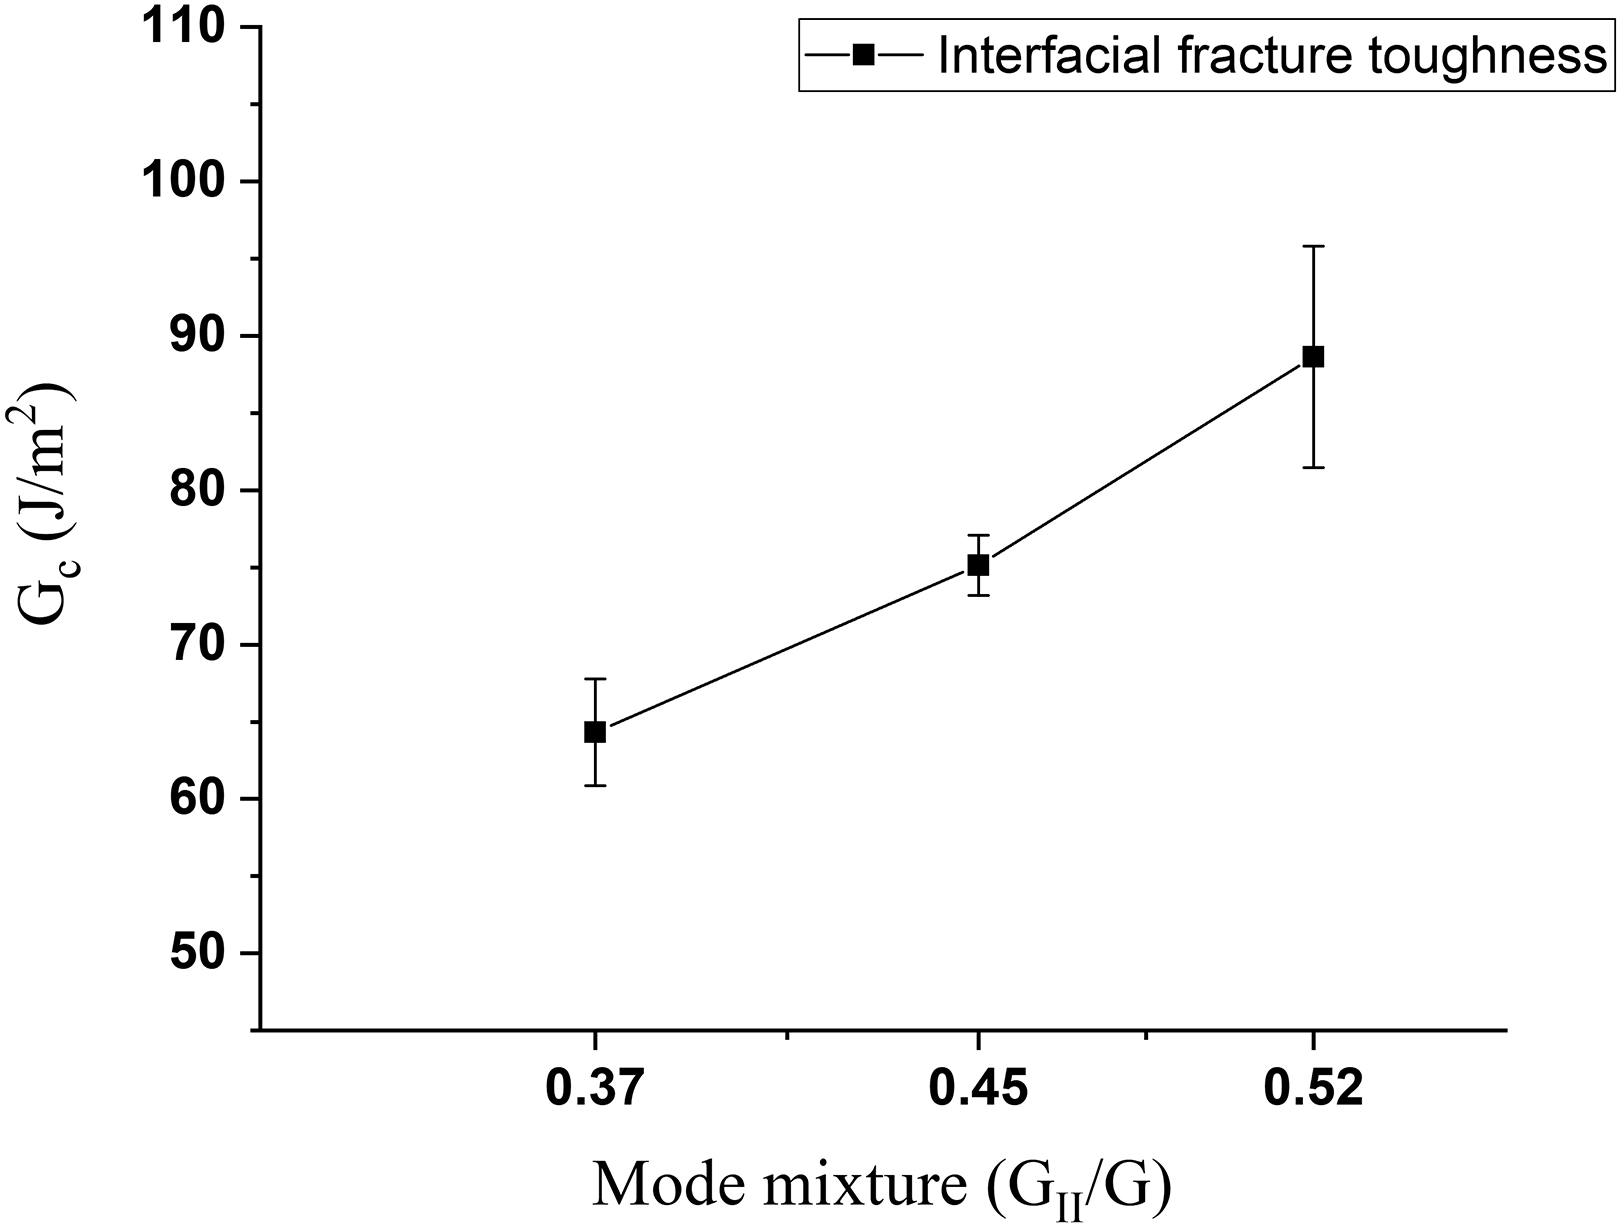
Gc versus mode mixture ratios
Discussion and Conclusions
Modes I and II interfacial fracture toughness of 3D printed hybrid composite of ABS and CF-PLA were studied by varying printing speed and extrusion nozzle temperature. Moreover, the interfacial fracture toughness was also determined under mixed mode loading at three-mode mixture ratios.
The results show that increasing the printing speed and nozzle temperature while keeping other printing parameters constant, the interfacial fracture toughness improves both in mode I and mode II but the effect is more prominent in mode II against increasing nozzle temperature.
At higher printing speed, the time between the subsequent layers is reduced and sublayer has lesser time for cooling and solidification before the next layer is deposited, which results in better thermal fusion and adhesion between the layers (also observed by Kuznetsov et al. 35 ). This can be a possible reason for this increase in interfacial fracture toughness with increasing printing speed. At higher printing speed, irregular surface and geometry (also mentioned by Ebubekir 36 ) are formed, which results in a wavy crack path and may enhance the fracture toughness. Also, at higher printing speed, microvoids are expected to form which are then filled by the material of the subsequent layer, thereby providing better mechanical interlocking between the layers.
The improvement in the interfacial fracture toughness due to nozzle temperature increase can be due to the following reasons. When the melted filament is deposited, local remelting and intermolecular fusion between the new and previous layer occur due to direct thermal contact. The temperature difference between two consecutive layers has a critical effect on interlayer adhesion, also argued by Aliheidari et al. 20 By increasing the nozzle temperature, the interlayer thermal fusion increases due to which the interlayer strength improves. Increasing the nozzle temperature of the filament also decreases the viscosity, increases the flow, 37 and strengthens the inter-road bonds due to which higher interfacial fracture toughness is obtained. This effect by increasing the nozzle temperature was also observed by Barile et al. 38