
Abstract
Carbon fiber (CF)-reinforced thermoplastic composites have been widely used in different structural applications due to their superior thermal and mechanical properties. The big area additive manufacturing (BAAM) system, developed at Oak Ridge National Laboratory’s Manufacturing Demonstration Facility, has been used to manufacture several composite components, demonstration vehicles, molds, and dies. These components have been designed and fabricated using various CF-reinforced thermoplastics. In this study, the dynamic rheological and mechanical properties of a material commonly used in additive manufacturing, 20 wt% CF-acrylonitrile butadiene styrene (ABS), as well as three CF-reinforced high-temperature polymers, 25 wt% CF-polyphenylsulfone (PPSU), 35 wt% CF-polyethersulfone (PES), and 40 wt% CF-polyphenylene sulfide (PPS), used to print molds were investigated. The viscoelastic properties, namely storage modulus, loss modulus, tan delta, and complex viscosity, of these composites were studied, and the rheological behavior was related to the BAAM extrusion and bead formation process. The results showed 20 wt% CF-ABS and 40 wt% CF-PPS to display a more dominant elastic component at all frequencies tested while 25 wt% CF-PPSU and 35 wt% CF-PES have a more dominant viscous component. This viscoelastic behavior is then used to inform the deposition and bead formation process during extrusion on the BAAM system.
Keywords
Introduction
Additive manufacturing (AM), popularly known as three-dimensional (3-D) printing, offers the ability to fabricate structures of complex shapes designed using computer-aided design (CAD) files. In AM, parts are made by adding material in layers, whereby each layer is a thin cross section of the original part derived from the CAD file.1,2 AM techniques have developed over the years and can process common materials such as polymers, metals, and ceramics.2–6 Historically, AM has proven useful for making models and prototypes with the number of applications increasing as the process has developed and improved.
Big area AM (BAAM) is an extrusion-based AM technique developed at Oak Ridge National Laboratory in conjunction with Cincinnati Inc. BAAM can build complex structures that are as large as 6 m long, 2.4 m wide, and 1.8 m tall, which is roughly 10 times larger than the commercial AM systems such as those used in fused filament fabrication (FFF). 7 The system uses a single screw extruder to melt pelletized feedstock and deposit beads of semi-molten thermoplastic along a tool path. The pelletized feedstock allows BAAM to use a wide variety of thermoplastics on the market as feedstock while driving down the production cost since the need for a filament is eliminated.8,9 BAAM has been used to manufacture demonstration vehicles, molds, dies, and autoclave tools that can be used to fabricate Tier 1 composite aerospace structural components with very low void content (i.e. <5%).10,11 Most of these components printed on BAAM have been designed and fabricated using carbon fiber (CF)-reinforced acrylonitrile butadiene styrene (ABS). 12 ABS is the most commonly used thermoplastic in extrusion-based AM because of its excellent processability and dimensional stability.13–16 However, it has a relatively low glass transition temperature (Tg) of 105°C which restricts its use in advanced applications that demand continuous use of printed components at elevated temperatures.
The polymer AM market is growing and for the transition from prototyping to production of end-use parts on AM systems to be realized, the ability to manufacture parts with desired thermomechanical properties needs to be fulfilled. As a result, high-performance thermoplastics as well as their fiber-reinforced composites are of interest as feedstock for BAAM due to their superior thermal and mechanical properties.17–19 Some of these high-temperature polymers include polyphenylene sulfide (PPS), polyphenylsulfone (PPSU), polyetherketoneketone (PEKK), and polyetherimide (PEI). Compared to ABS, the base resins for these high-performance thermoplastics tend to be more expensive and the processing parameters have not been identified for BAAM applications. A method for determining the processability of high-performance polymers as well as their composites on extrusion-based AM systems has been proposed and developed for PPS, PPSU, PEI, and PEKK.17,18,20–22 Currently these high-temperature materials are utilized in AM molds and dies for fabrication of high-temperature composite structures such as autoclave and in-oven cure applications. Composite tooling faces key challenges, such as cost and lead-time, that prevent widespread application of composite materials. The BAAM process provides a smart and cost-effective solution for rapid tooling production.
Rheological studies help to understand the dynamics associated with the AM process for reinforced polymeric materials in areas such as pressure driven flow through the nozzle during extrusion, formation of a freestanding bead of adequate height on the deposition bed, and ability of the bead to support subsequent layers deposited during printing, and obtaining a quality bead with minimal void fraction. 23 Since most of the thermoplastic AM process occurs in the melt state, entanglement dynamics and microstructure can have significant influence on the printability of the feedstock material. Stress relaxation tests are commonly employed to observe the timescales at which polymer chains relax through short-range and long-range thermal motions. 24 When entanglements hinder chain relaxation, a stress plateau or rubbery regime is observed, for which the plateau modulus is defined. The magnitude of this plateau modulus is related to the molecular weight of polymer segments between entanglements; a property unique to the structure of the polymer chain. 25 Beyond the plateau regime, with sufficient time, terminal relaxation results in a total stress reduction. For neat resins, an increase in molecular weight prolongs the stress relaxation to longer timescales. Since time and temperature are proportional, the terminal region may be entered with higher processing temperatures. 26 The added complexity of filler reinforcement can lead to networks which must first be destroyed to sufficiently reduce the stress. However, the buildup of a filler network after flow cessation is much quicker than the buildup of entanglement networks. 27 By controlling temperature, molecular weight, and filler concentration, a polymer can exhibit significant shear-thinning behavior from filler network breakdown to allow extrusion through the nozzle, high zero-shear viscosity within extruder torque limits, and fast filler network buildup to maintain the shape of the deposited bead.
This article surveys the dynamic rheological properties of four CF-reinforced composites used on the BAAM system for tooling applications. The use of fiber-reinforced composites is preferred for BAAM applications as fibers lower the coefficient of thermal expansion by an order of magnitude. 8 This in turn minimizes shrinkage in printed parts as they cool from deposition temperature to ambient temperature. 8 The high-performance materials investigated in this study include two amorphous polymers, 25 wt% CF-reinforced PPSU and 35 wt% CF-PES, and one semi-crystalline polymer, 40 wt% CF-PPS. The rheological behavior of 20 wt% CF-ABS, an amorphous polymer, is also investigated since ABS tends to be the most utilized base feedstock for BAAM.7,8,12 Analysis of the unfilled material for all the systems is incorporated along to highlight the effect that addition of reinforcing fillers have on the neat resin. The viscoelastic properties of the composites at their respective deposition temperatures are used to guide the deposition and bead formation process during BAAM extrusion.
Experimental setup
Materials
Four different resin systems (ABS, PPSU, PES, and PPS) along with their composites reinforced with short CFs with an average length of 0.3 mm (filler loadings as shown in Table 1) were obtained in the form of compounded pellets from Techmer ES (Tennessee, USA) (Figure 1). Note that all four chosen matrix materials have different fiber loadings, which were selected based on the desired end-use properties. Assessing the printability of a wide range of materials is beneficial for capitalizing on the benefits of BAAM for tooling applications.10,16
Thermoplastic composite materials used in the study as well as the CF content.
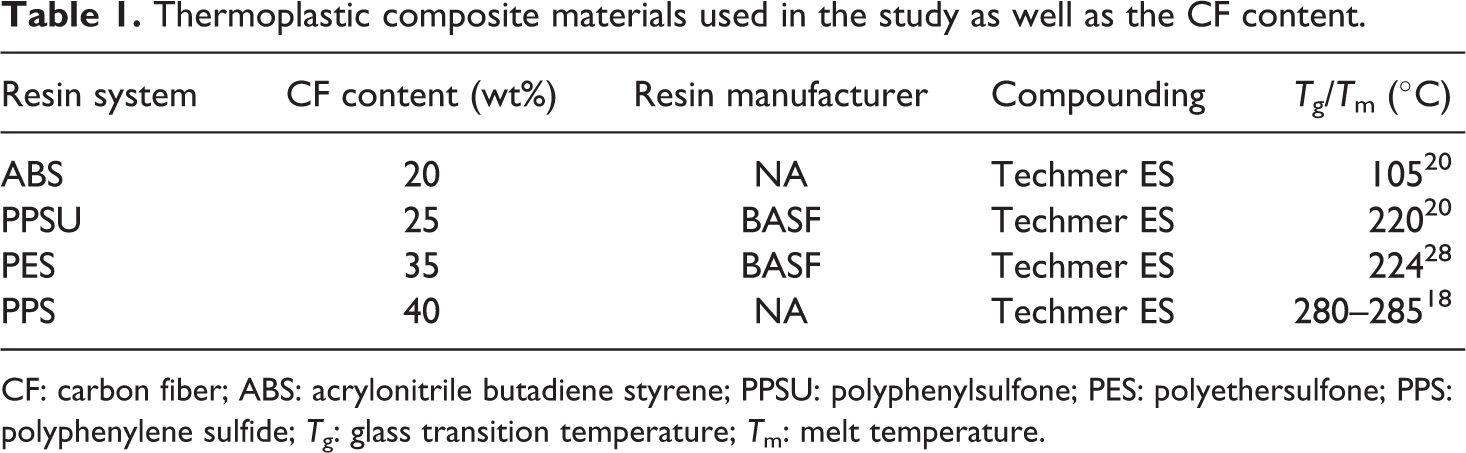
CF: carbon fiber; ABS: acrylonitrile butadiene styrene; PPSU: polyphenylsulfone; PES: polyethersulfone; PPS: polyphenylene sulfide; Tg: glass transition temperature; Tm: melt temperature.
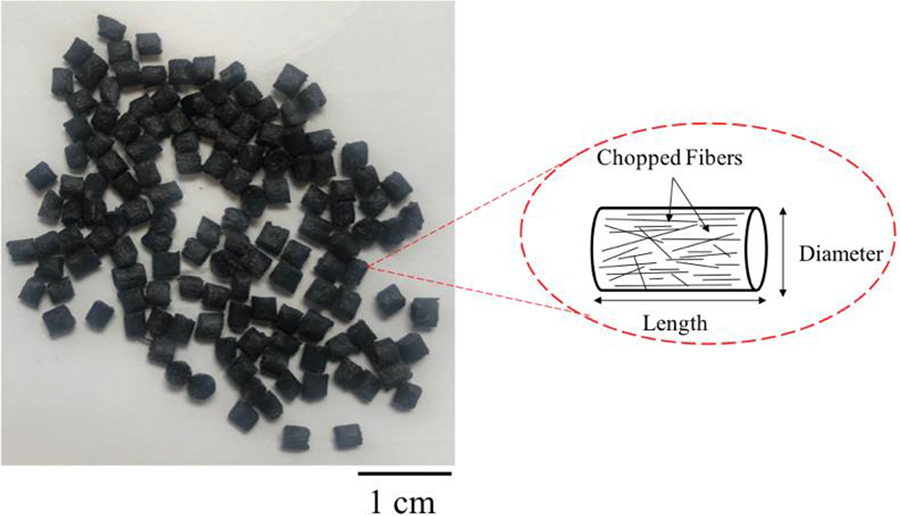
20 wt% CF-ABS pellets used for rheological testing and BAAM extrusion process.
Rheological tests were performed using compression molded 25 mm circular disks with a thickness of 2 mm. The circular disks were water-jet cut from 152.4 mm compression molded square plaques. Compression molding of feedstock pellets was performed on a 100 ton hydraulic press (Beckwood, Missouri, USA), heated to the composites’ melting temperature, and applying a 2.5 MPa pressure. The molded plaque was then cooled to room temperature for 10–15 min.
Dynamic rheological characterization
The dynamic viscoelastic moduli (i.e. storage modulus (G′) and loss modulus (G″)) and complex viscosity (η*) of the neat and CF-reinforced composites were measured using a parallel-plate (25 mm diameter) rheometer (Discovery Hybrid Rheometer (DHR-2), TA Instruments, Delaware, USA). All tests were performed in an environmental test chamber under nitrogen atmosphere to minimize degradation. The processing temperature of each material varied based on the structure of the base polymer recorded in Table 2.17,18 Strain sweeps were performed on each composite at the chosen melt temperature to determine the linear viscoelastic (LVE) regime. In a strain sweep test, the angular frequency (ω) is kept constant while the strain amplitude (%) applied on the material is varied. Frequency sweep tests were then performed from 0.1 to 100 rad s−1 using a strain amplitude, γ0, in the LVE regime and at the selected test temperature. The test gap was maintained between 1.5 and 1.8 mm for all tests. According to Powell, the recommended gap in the rheometer must be 3–10 times larger than the fiber length. 29 Given that the average size of the CFs used in these composites is approximately 0.3 mm, the gap was set within the recommended range to minimize the boundary effect of the rheometer on the fibers, although it is not possible to exclude this effect completely due to the existence of some fibers longer than 0.3 mm. 29 Since the tests are being conducted on parallel plates, it is important to note that the shear rate at each position in the sample is not the same, but changes with radial position. 30 Prior to testing, all samples were dried in a vacuum oven following the drying conditions shown in Table 2.
Dynamic rheological characterization test parameters and drying conditions.
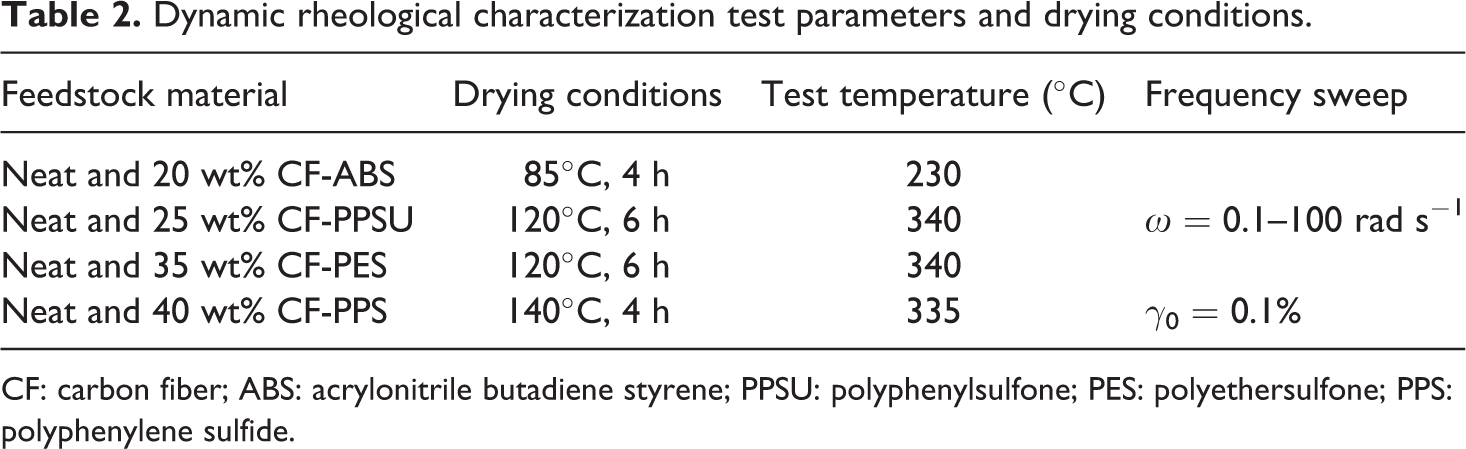
CF: carbon fiber; ABS: acrylonitrile butadiene styrene; PPSU: polyphenylsulfone; PES: polyethersulfone; PPS: polyphenylene sulfide.
Steady-shear viscosity tests
Steady-shear viscosity measurements were carried out on two of the materials, ABS and PPS, as well as their CF composites using a Dynisco LCR 7001 capillary rheometer (Massachusetts, USA) at their respective test temperatures (Table 2). Data were collected at 21 logarithmically spaced apparent shear rates between 10 and 10000 1/s. A capillary die with a length-to-diameter ratio of 20, and a 0.749 mm diameter was used. After the data were collected, the apparent shear rate was corrected using the Rabinowitsch correction (equation (1)) to account for the non-parabolic velocity profile of the polymer melt and obtain the true shear rate at the wall
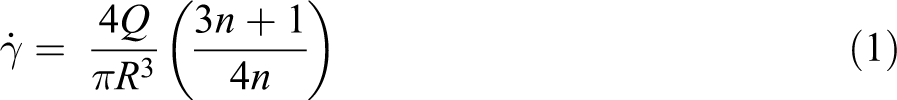
where
Dynamic mechanical analysis
Dynamic mechanical analysis (DMA) is widely used to characterize mechanical properties of a material as a function of temperature, time, frequency, stress, and so on. In this study, DMA tests were performed on the DHR-2 system fitted with a torsion rectangular DMA geometry and tests were done at a ω = 10 rad s−1 and strain of 0.1% (within LVE region). The samples used were cut from BAAM printed parts in two different directions, the xy-direction (parallel to the motion of the extruder) and the z-direction (perpendicular to the plane of the extruded layers) (Figure 2). The DMA rectangular specimen dimensions were approximately 5.0 × 1.2 × 0.3 cm3 for length, width, and thickness, respectively. The test was conducted over a temperature range of 25–170°C for 20 wt% CF-ABS and a temperature range of 25–270°C for the other three high-performance composites using a heating rate of 2°C min−1. Prior to testing, all the materials were dried in a vacuum oven (conditions as shown in Table 2).
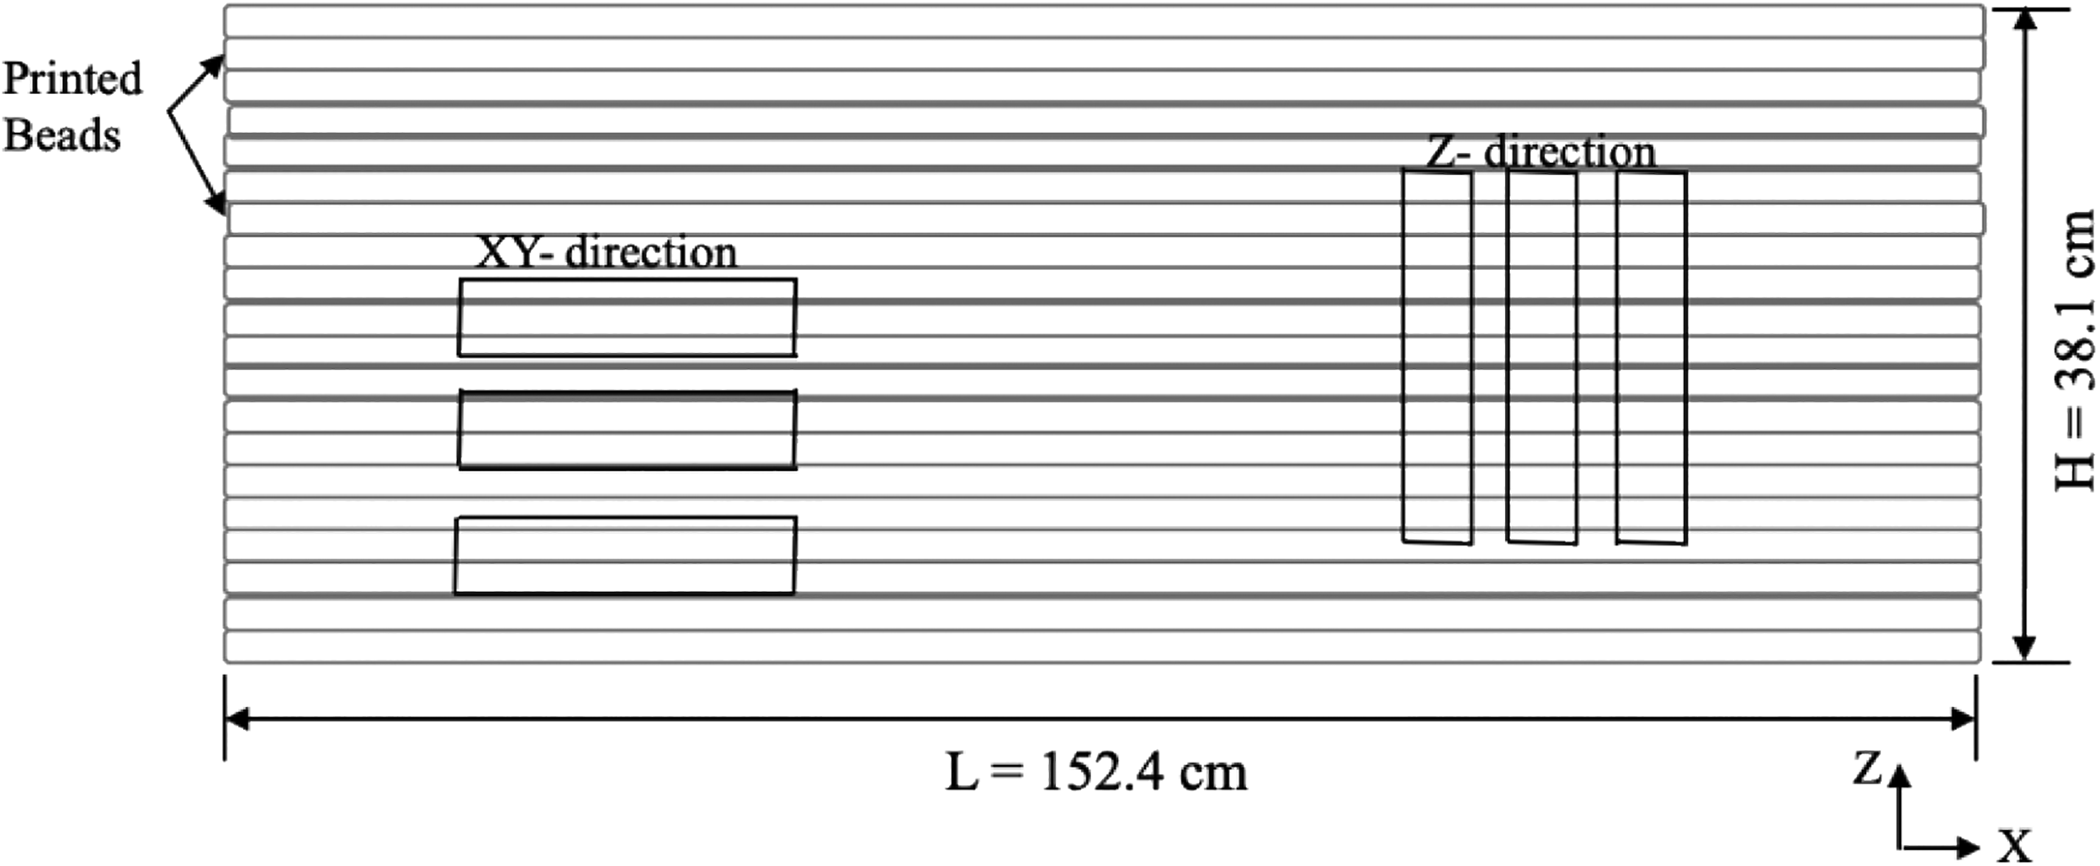
Schematic illustration of a BAAM printed wall showing the positions where rectangular DMA specimen were cut from.
BAAM extrusion and printing parameters
Double-bead walls measuring 152.4 × 38.1 × 1.14 cm3 (Figure 2) were printed using the CF-reinforced materials to highlight some of the challenges faced with print quality on BAAM. The extrusion profiles for the five different zones of the BAAM extruder are shown in Table 3 while Table 4 shows the printing parameters for the composite systems investigated. The bed temperature was maintained between 95°C and 110°C depending on the material to promote initial layer adhesion.
Temperature profile for different zones of the extruder while printing.
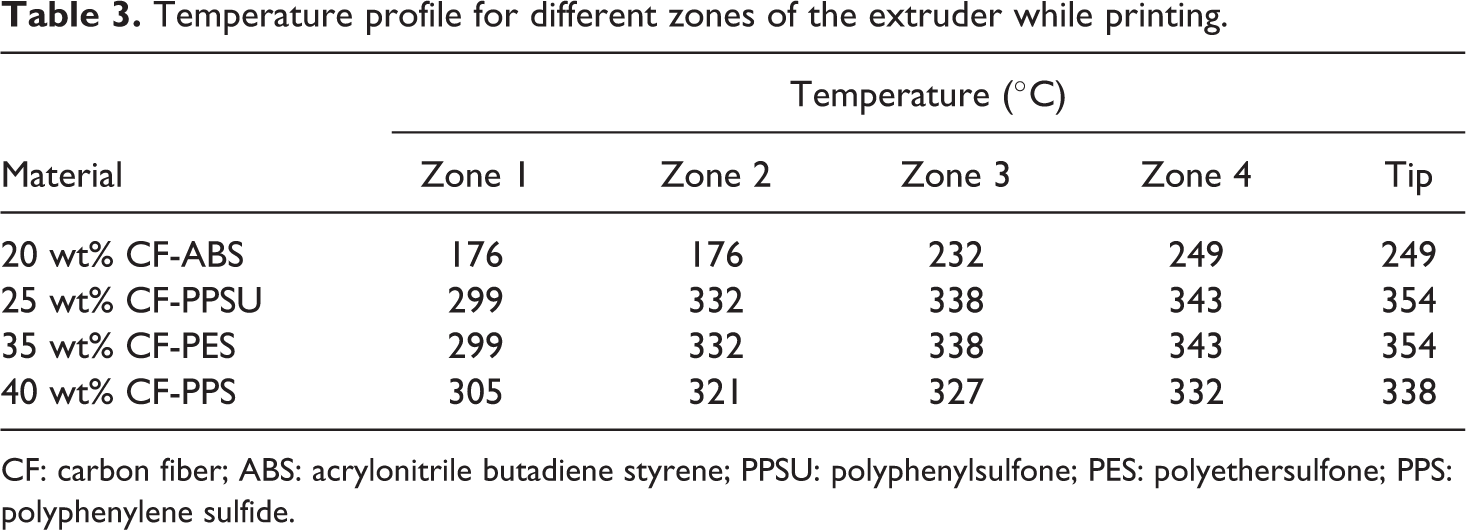
CF: carbon fiber; ABS: acrylonitrile butadiene styrene; PPSU: polyphenylsulfone; PES: polyethersulfone; PPS: polyphenylene sulfide.
Printing parameters for all materials.
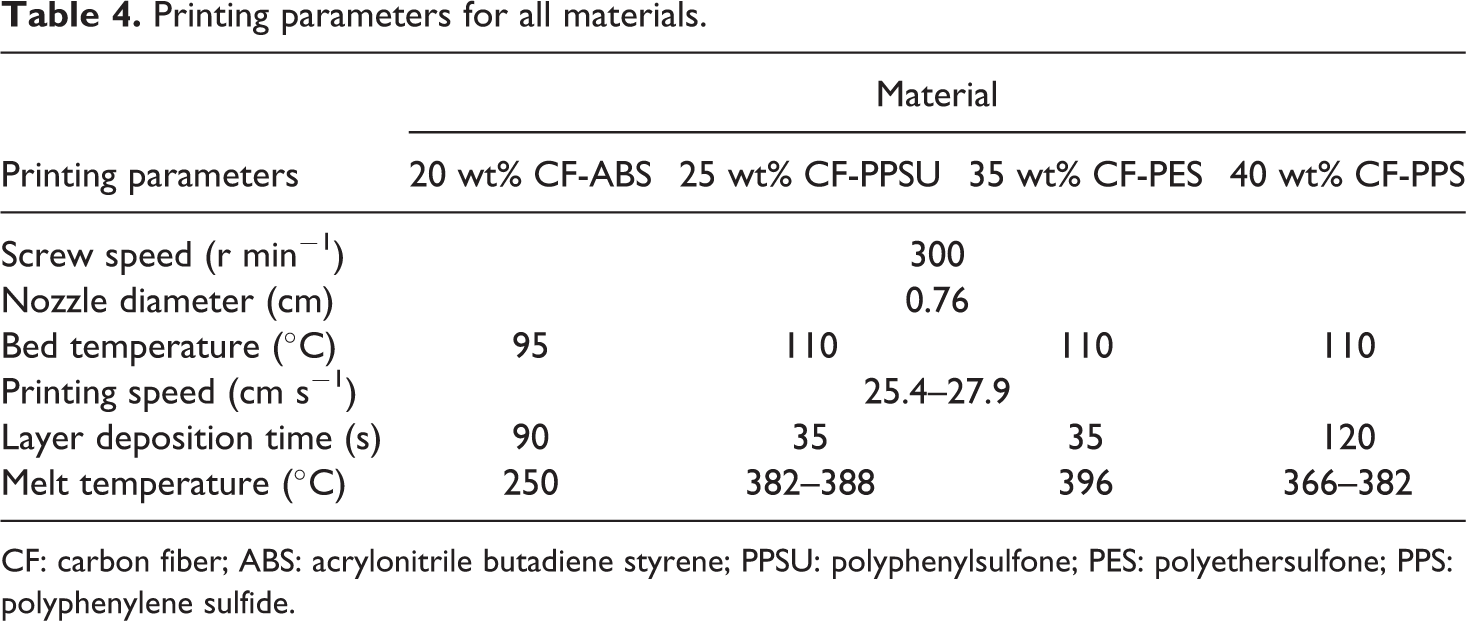
CF: carbon fiber; ABS: acrylonitrile butadiene styrene; PPSU: polyphenylsulfone; PES: polyethersulfone; PPS: polyphenylene sulfide.
Results and discussion
Dynamic rheological characterization
Strain sweep
Strain sweep measurements were used to determine the LVE regime. In the LVE region, applied strain is sufficiently small such that both G′ and G″ are independent of the applied strain amplitude at a fixed frequency of ω = 10 rad s−1. A decrease in G′ with oscillation strain is an indicator of structural breakdown in the polymer system. 31 Figure 3 illustrates the change in G′ and G″ with varying oscillation strain amplitude for all neat resins as well as the CF-reinforced composites tested. As shown in Figure 3, G′ and G″ of all the neat resins are independent of the applied strain amplitude in the range tested. For subsequent tests such as frequency sweeps, any strain amplitude % can be utilized for these neat resins since it will fall within the LVE regime.
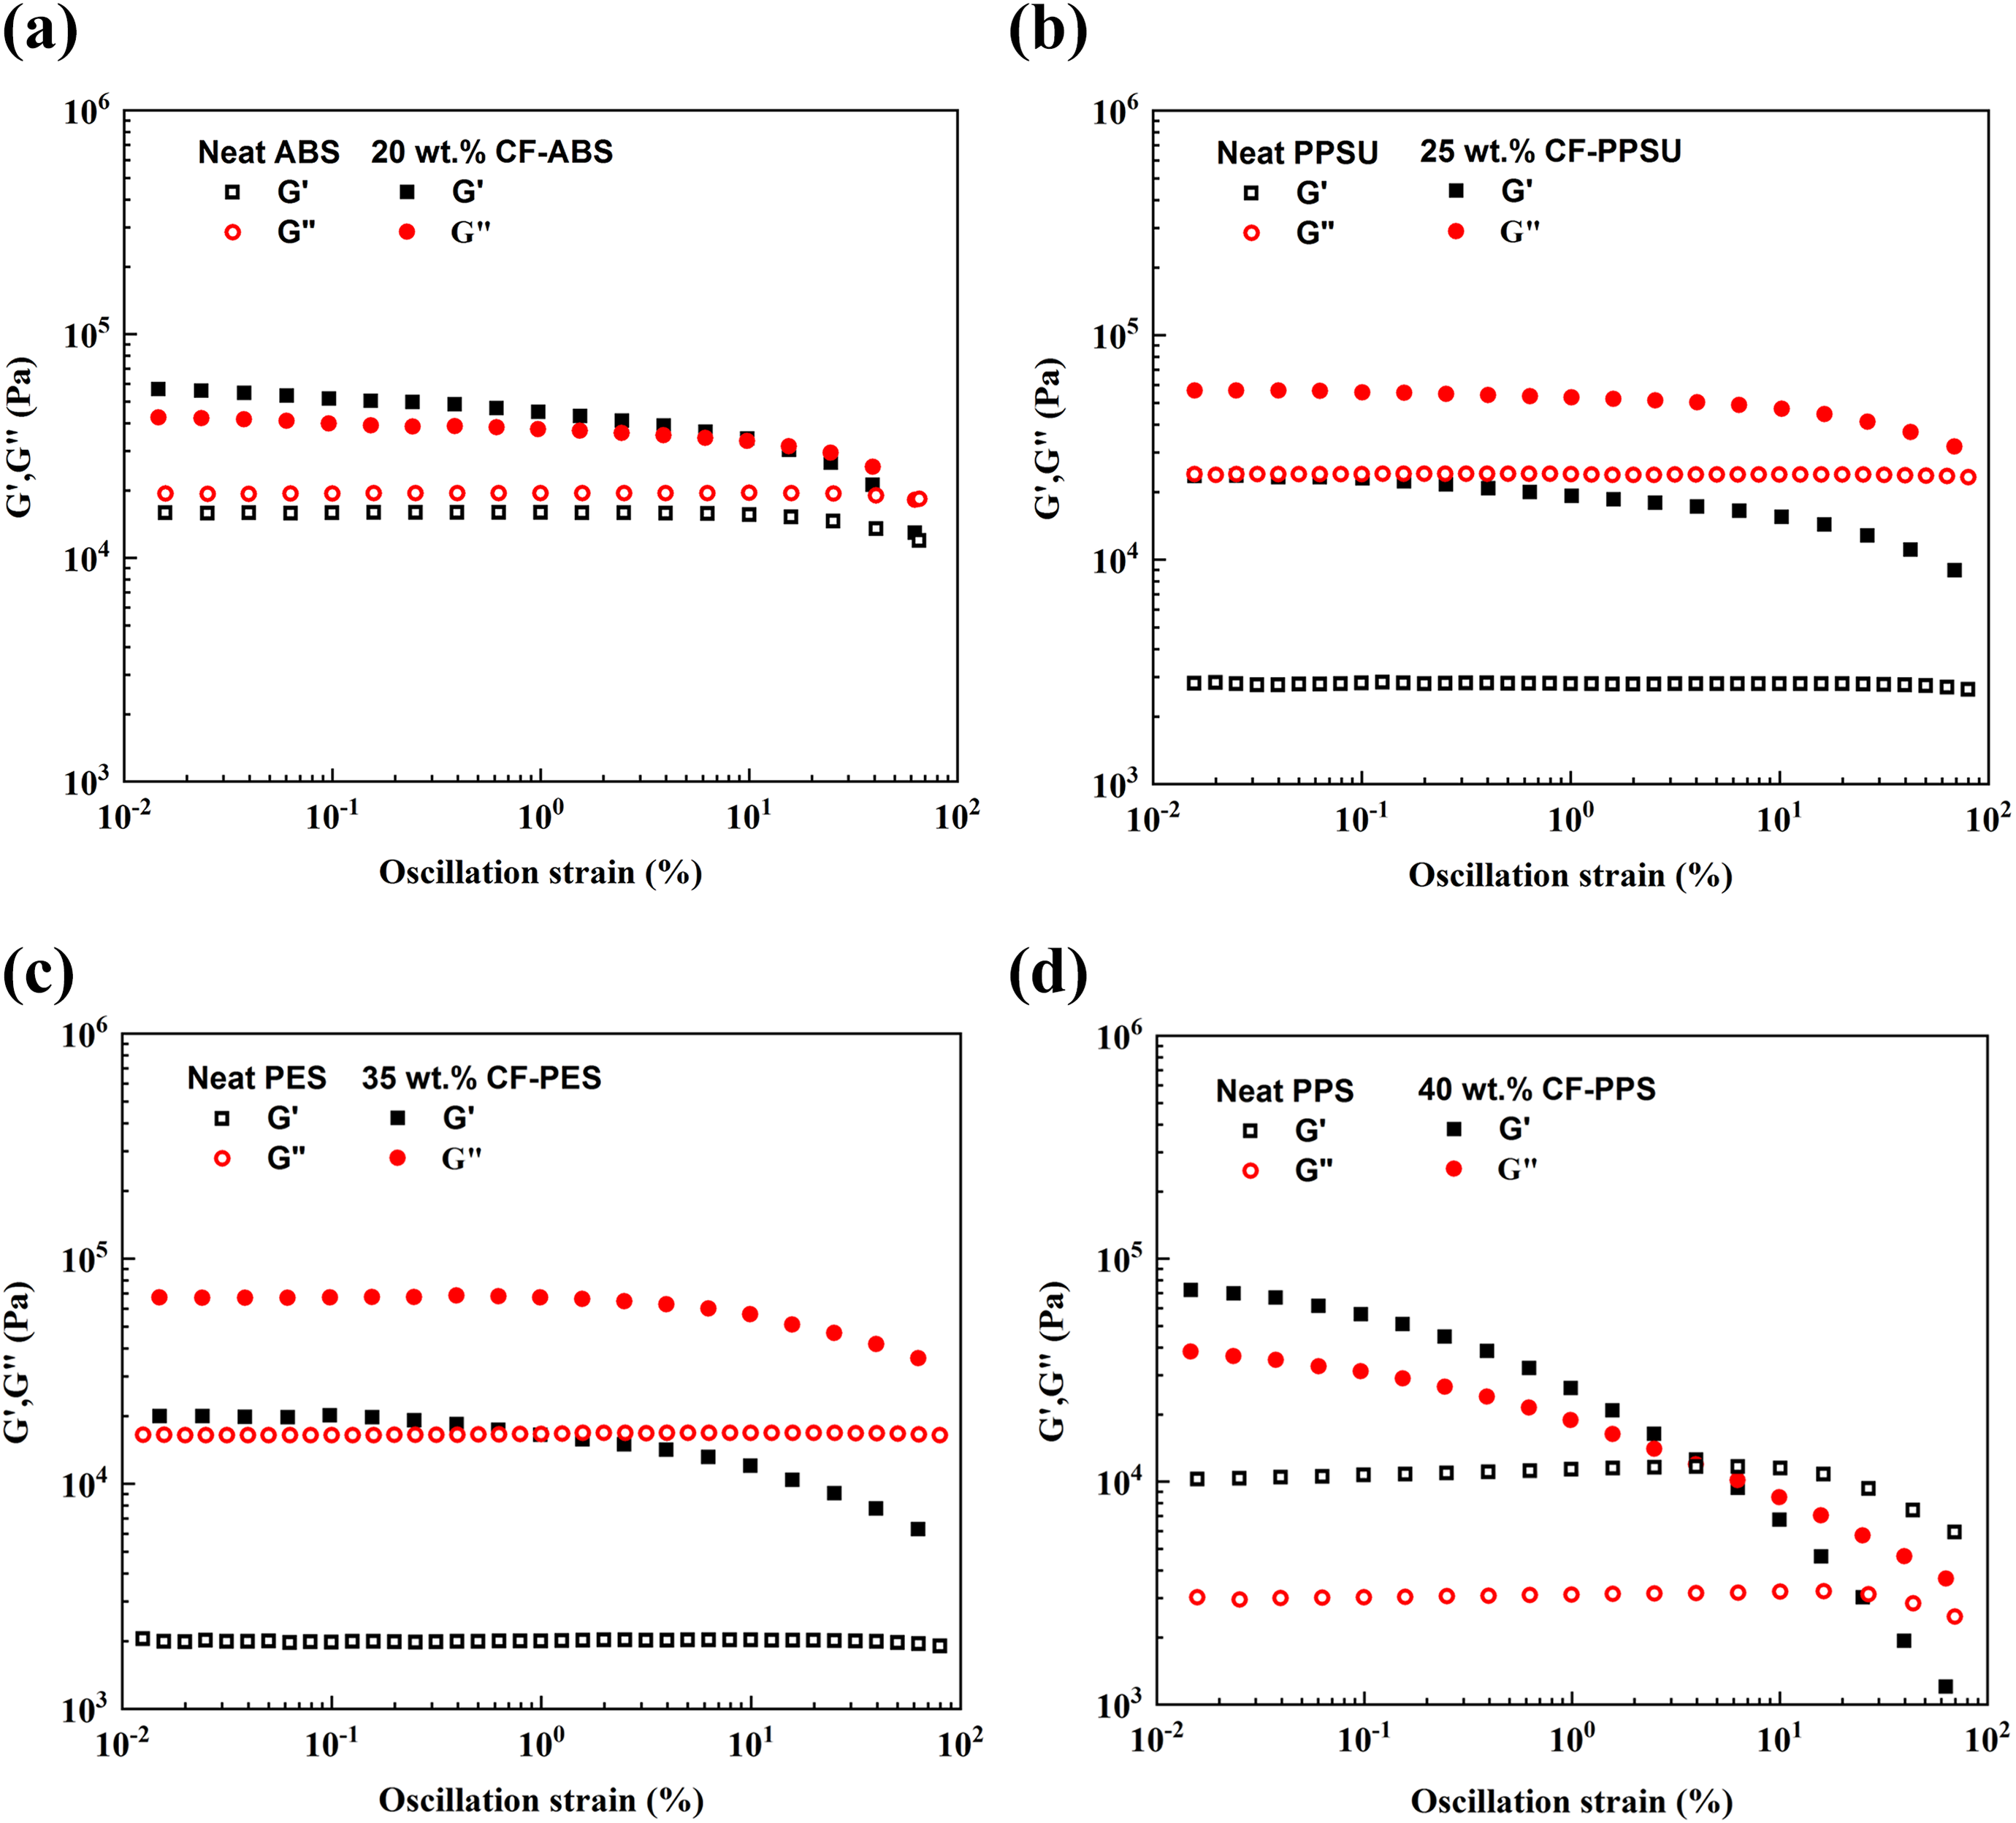
Variation of G′ and G″ as a function of oscillation strain (%) for (a) neat and 20 wt% CF-ABS at 230°C, (b) neat and 25 wt% CF-PPSU at 340°C, (c) neat and 35 wt% CF-PES at 340°C, and (d) neat and 40 wt% CF-PPS at 335°C, ω = 10 rad s−1.
However, addition of CF to the neat resins reduces the LVE regime for the composites and results in an earlier onset of nonlinearity with increasing fiber loading. This suggests that the filler network dominates each of the systems. This behavior is commonly referred to as the Payne effect for filled systems. 32 Similar behavior has been reported in literature for other CF-reinforced thermoplastic composites.17–19,21 As a result, the tolerance range for the linearity limit is taken as 5% deviation for G′ around the plateau value according to ISO 6721-10. 33 The strain sweep accuracy is ±5% based on an average of two strain sweep tests. The rise in G′ of the CF-reinforced composite systems compared to the neat resins is attributed to the increase in effective filler volume fraction, commonly known as the hydrodynamic effect. This phenomenon has been observed in other polymer-filled systems. 34
In 20 wt% CF-ABS (Figure 3(a)), the LVE region extends up to a strain amplitude of 4%. Meanwhile, analysis of the strain sweeps for the high-performance amorphous composites shows that the LVE region for 25 wt% CF-PPSU (Figure 3(b)) extends up to 1% while that of 35 wt% CF-PES (Figure 3(c)) is up to 0.4%. The narrowest LVE region in these composites is observed in 40 wt% CF-PPS (Figure 3(d)), where the maximum strain amplitude that can be used for subsequent tests is 0.1%. After 0.1%, the dependence of G′ for 40 wt% CF-PPS is more pronounced and G′ decreases drastically as this composite contains the highest CF loading. This result is explained by the breakdown of the filler–filler transient network attributed to the Payne effect. 35 For uniformity in testing and reporting, the strain amplitude used for frequency sweep and DMA testing is 0.1%, which is within the LVE region of all the material systems investigated.
Frequency sweep
Frequency sweeps for the neat and CF-reinforced thermoplastics investigated are shown in Figure 4. In all materials investigated, the addition of CF to the neat resin results in an increase in the G′, G″, and η* values and enhances the shear-thinning effect of the CF-reinforced composites.
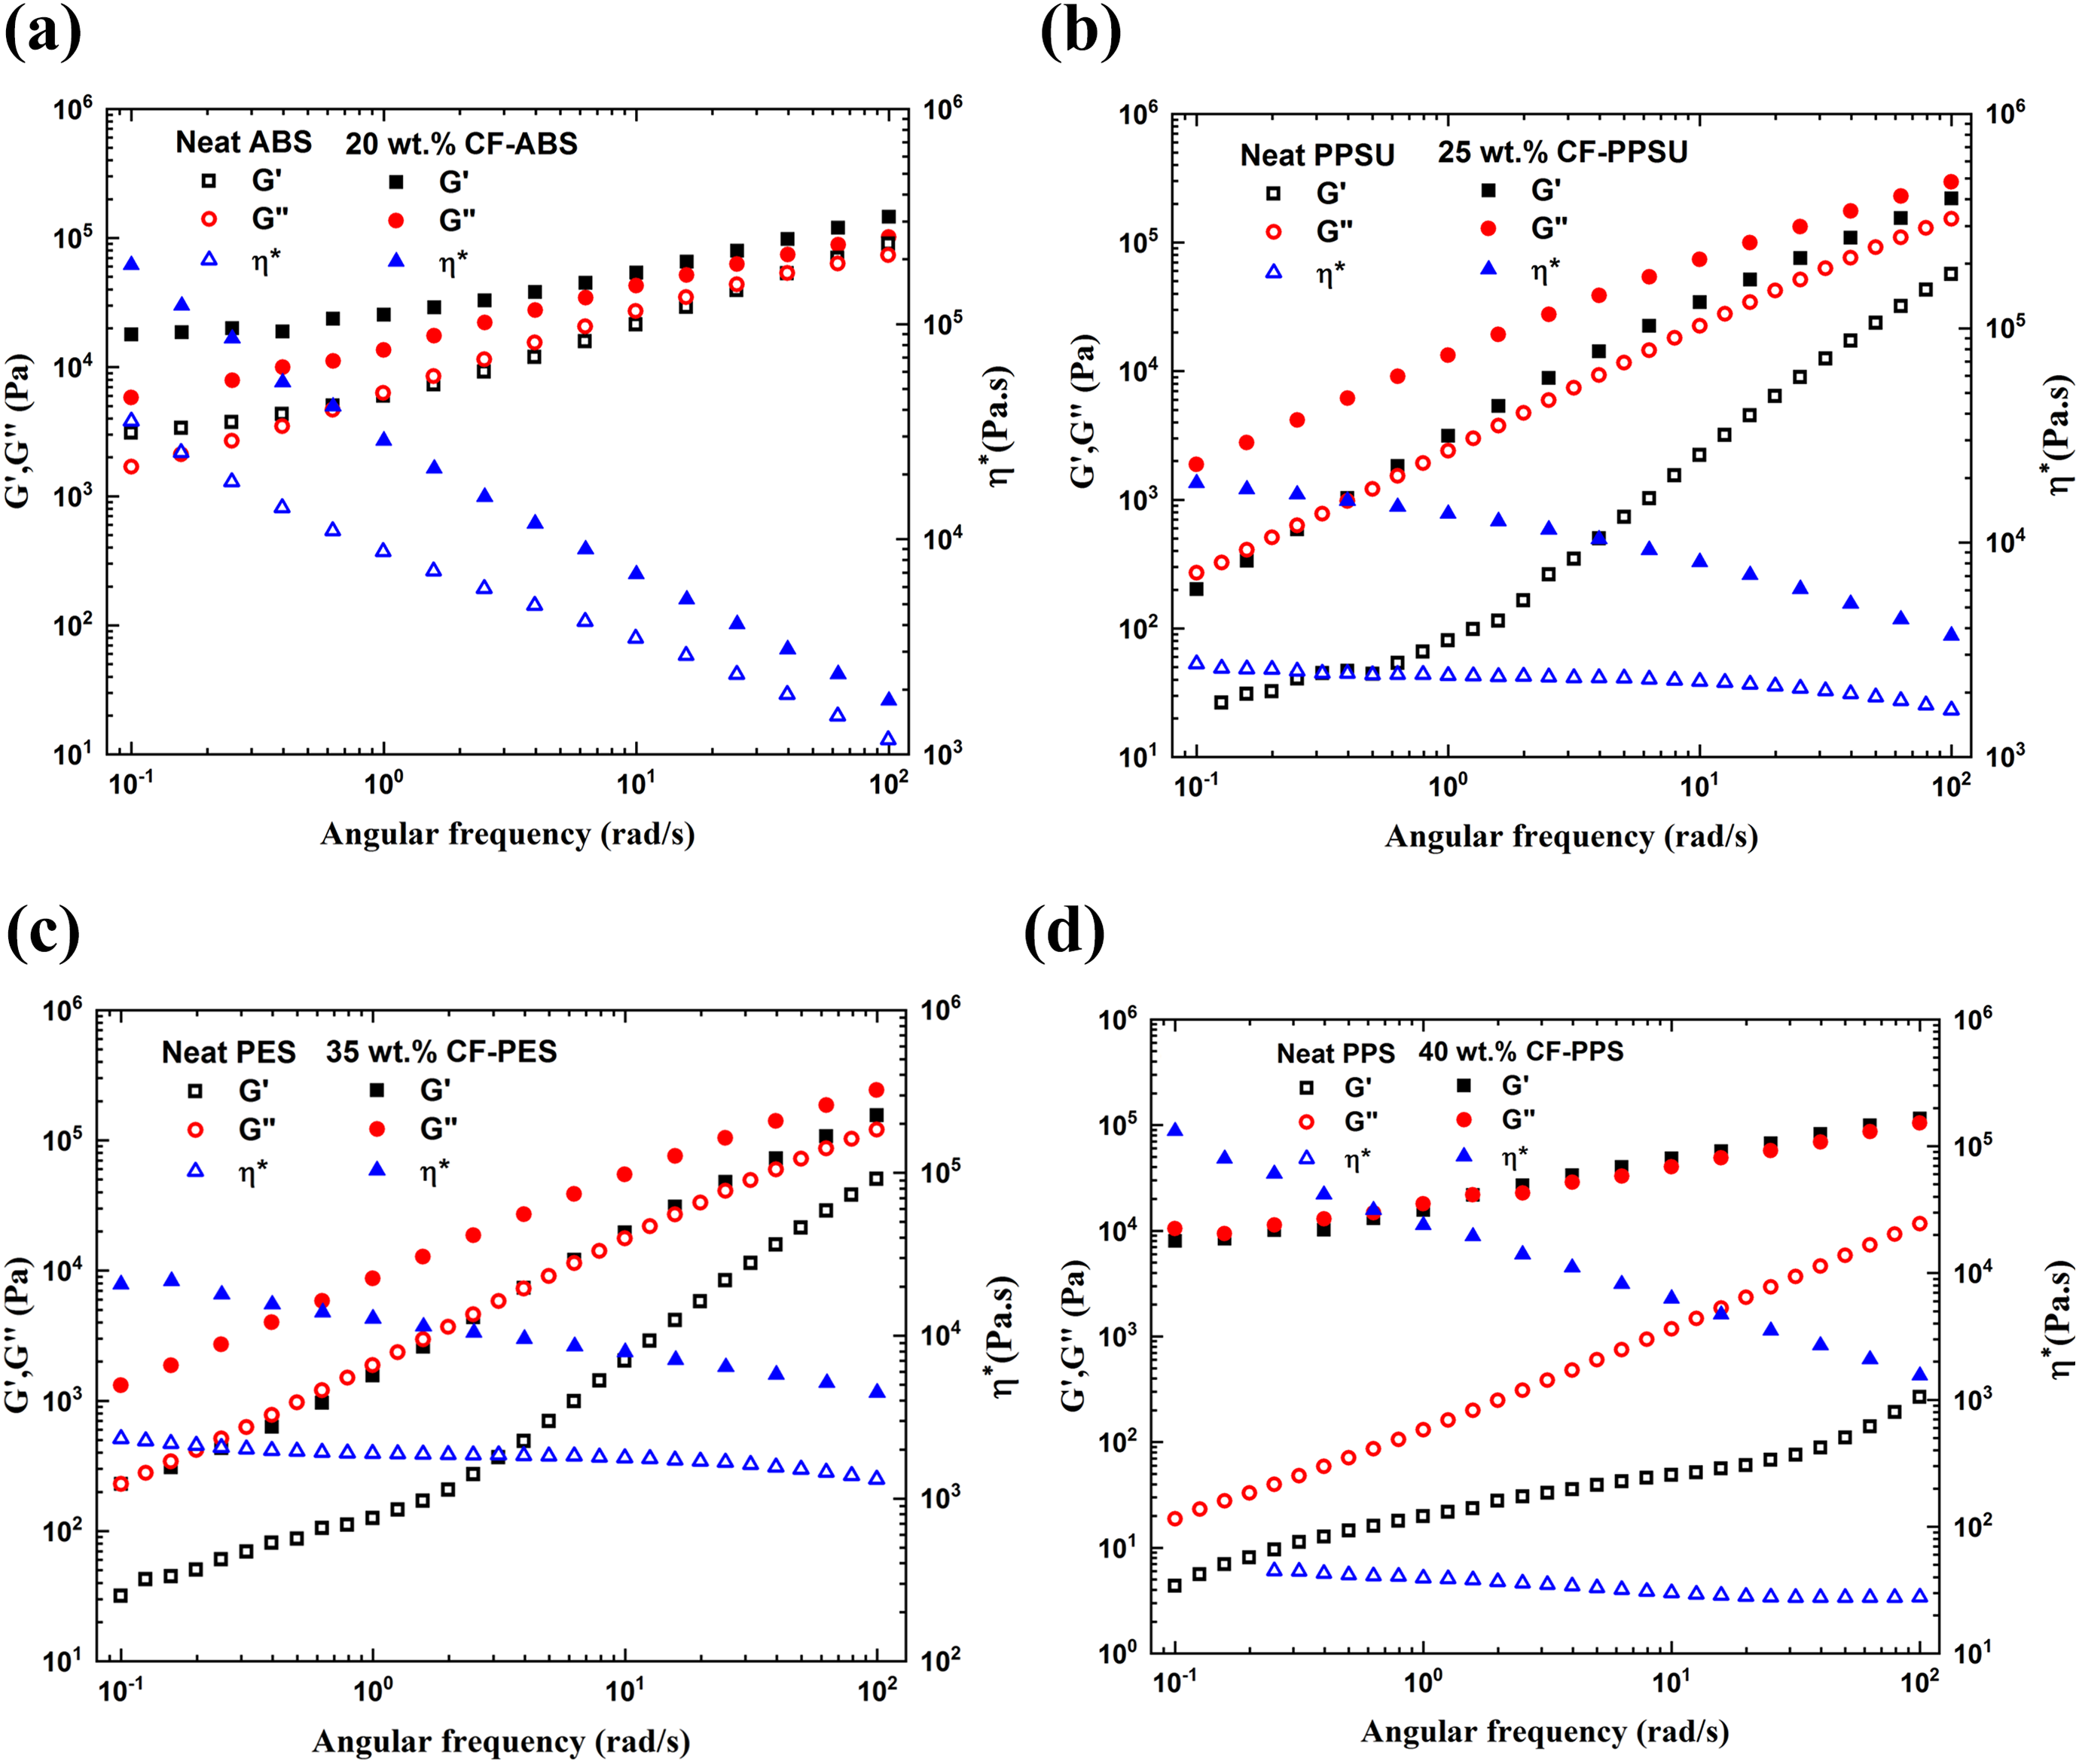
Variation of G′, G″, and complex viscosity (η*) with angular frequency for (a) neat and 20 wt% CF-ABS at 230°C, (b) neat and 25 wt% CF-PPSU at 340°C, (c) neat and 35 wt% CF-PES at 340°C, and (d) neat and 40 wt% CF-PPS at 335°C, γ0 = 0.1%.
For 20 wt% CF-ABS (Figure 4(a)), G′ is higher than G″ across the entire frequency range tested. The dominance of G′ over G″ at all frequencies has also been observed in other studies of CF-ABS at different extrusion temperatures. 17 The decrease in η* with increasing frequency of 20 wt% CF-ABS shows that the composite is shear thinning across the frequency range. In comparison, G′ for the neat ABS resin dominates slightly at ω less than 1 rad s−1, and above that, both viscoelastic moduli are very close in value. On the other hand, η* of the ABS is also shear thinning across the entire ω range tested.
In the case of 25 wt% CF-PPSU (Figure 4(b)) and 35 wt% CF-PES (Figure 4(c)), G″ is higher than G′ across all ω, indicating a dominance of the viscous component over the elastic component. The observed G″ dominance is also present in their respective neat resins.
In 40 wt% CF-PPS (Figure 4(d)), G″ slightly dominates G′ at lower ω values (i.e. <2 rad s−1) indicating that the viscous component is higher in this region. A crossover is observed around 2 rad s−1 and above that, G′ is marginally higher than G″. At this test temperature, neither the elastic component nor the viscous component seems to be dominant. Analysis of the η* of 40 wt% CF-PPS shows that the composite exhibits shear-thinning behavior across the entire ω region. The viscoelastic behavior of neat PPS is different from that of the CF-reinforced composite in that G″ is dominant across the entire ω region and η* does not vary as much with increasing angular frequency.
Overall, the frequency sweeps across all materials are very similar in their stress magnitudes. In BAAM, where the extruder rotation-per-minute (r min−1) may be high, each material will experience a difference in stress growth. However, looking at the high frequency asymptote for each material in Figure 4, it is clear that the operating temperatures chosen result in a similar stress profile. Based on the slope of the elastic modulus, the PPSU and PES matrices are in their terminal region (G′αω2) while ABS and PPS are in the rubbery region (G′αω0.5). 26 Although the results shown here are at one test temperature, previous work by the authors explored the extremes of the processing temperature ranges on the evolution of viscoelastic properties of these composites.17,18 Analysis of the behavior of G′ is in agreement with the findings in this study.
Relating G′, G″, and η* to BAAM bead formation and extrusion process
Forming a bead with a stable geometry is very critical for achieving a successful print in the BAAM system and it is highly dependent on the knowledge of whether G′ or G″ is dominant in the polymer melt. 23 Under the proposed 3-D material printability guidelines by Duty et al., once extruded, the bead must maintain a stable geometry throughout the characteristic processing time. 23 For materials with a dominant elastic component (G′ > G″) such as 20 wt% CF-ABS and 40 wt% CF-PPS, the printability model classifies them as viscoelastic solids with the evolution of strain under a given stress primarily dependent on the zero-shear elastic modulus and zero-shear viscosity. Therefore, in order for the bead to have good sagging resistance, the observed G′ needs to be high especially at the terminal zone. With regard to print quality, parts built with materials that have a dominant elastic component are likely to have cracks between the beads. For instance in CF-reinforced PPS, these cracks appear at the first deposited layer and in the middle of the printed wall as shown in Figure 5. 10
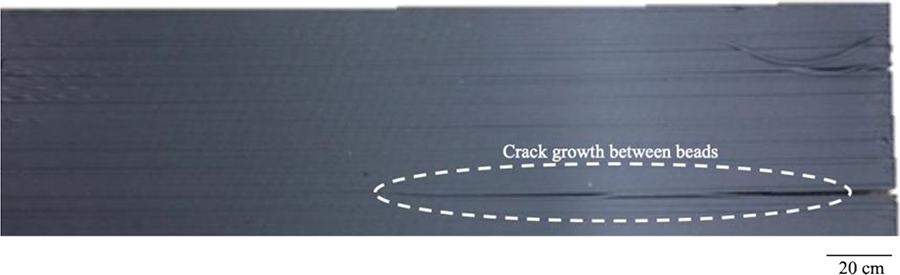
Final BAAM printed CF-reinforced PPS composite wall showing crack initiation and growth in between beads.
On the other hand, polymer melts with a dominant viscous component (G″ > G′) such as 25 wt% CF-PPSU and 35 wt% CF-PES are classified as viscoelastic liquids, with the evolution of strain under a given stress dependent on the characteristic time- and shear-rate-dependent viscosity. For stable bead geometry creation, the elastic deformation is assumed to occur immediately, but the viscous strain evolves over time, based on the Maxwell model. Therefore, the material’s viscosity plays a critical role in stable bead geometry formation. Figure 6 shows the processing defects that arise when printing polymer melts with a dominant viscous component (35 wt% CF-PES). These defects include material irregularities caused by the nozzle tip drooling resulting in local bead dislocation in the final part.
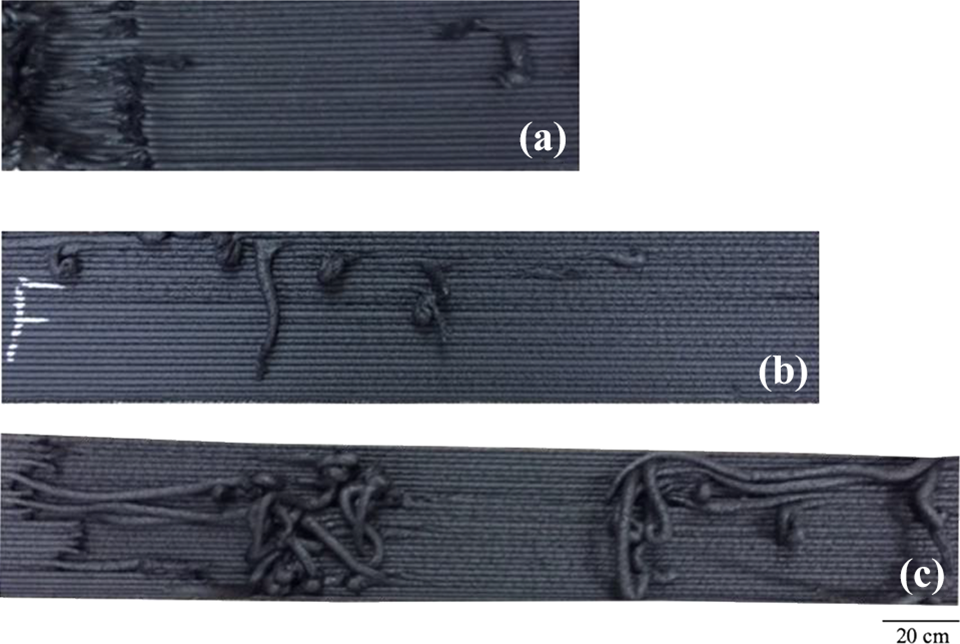
Final printed 35 wt% CF-PES wall showing processing defects caused by material irregularities due to (a) nozzle tip drool and (b) and (c) local bead dislocation.
For successful extrusion of polymer melts through a nozzle on BAAM, it is necessary that the materials exhibit shear-thinning behavior especially at the frequency/shear rate ranges of interest to the BAAM process.23,36 This behavior is characterized by the shear-thinning exponent, (n), and quantified by fitting the complex viscosity versus angular frequency curves to a power law 37

where C is the consistency index and
In order to link the complex viscosities obtained from the small amplitude oscillatory shear measurements on the parallel-plate rheometer to steady-state shear viscosities from a capillary rheometer, the Cox–Merz rule is applied 38

where
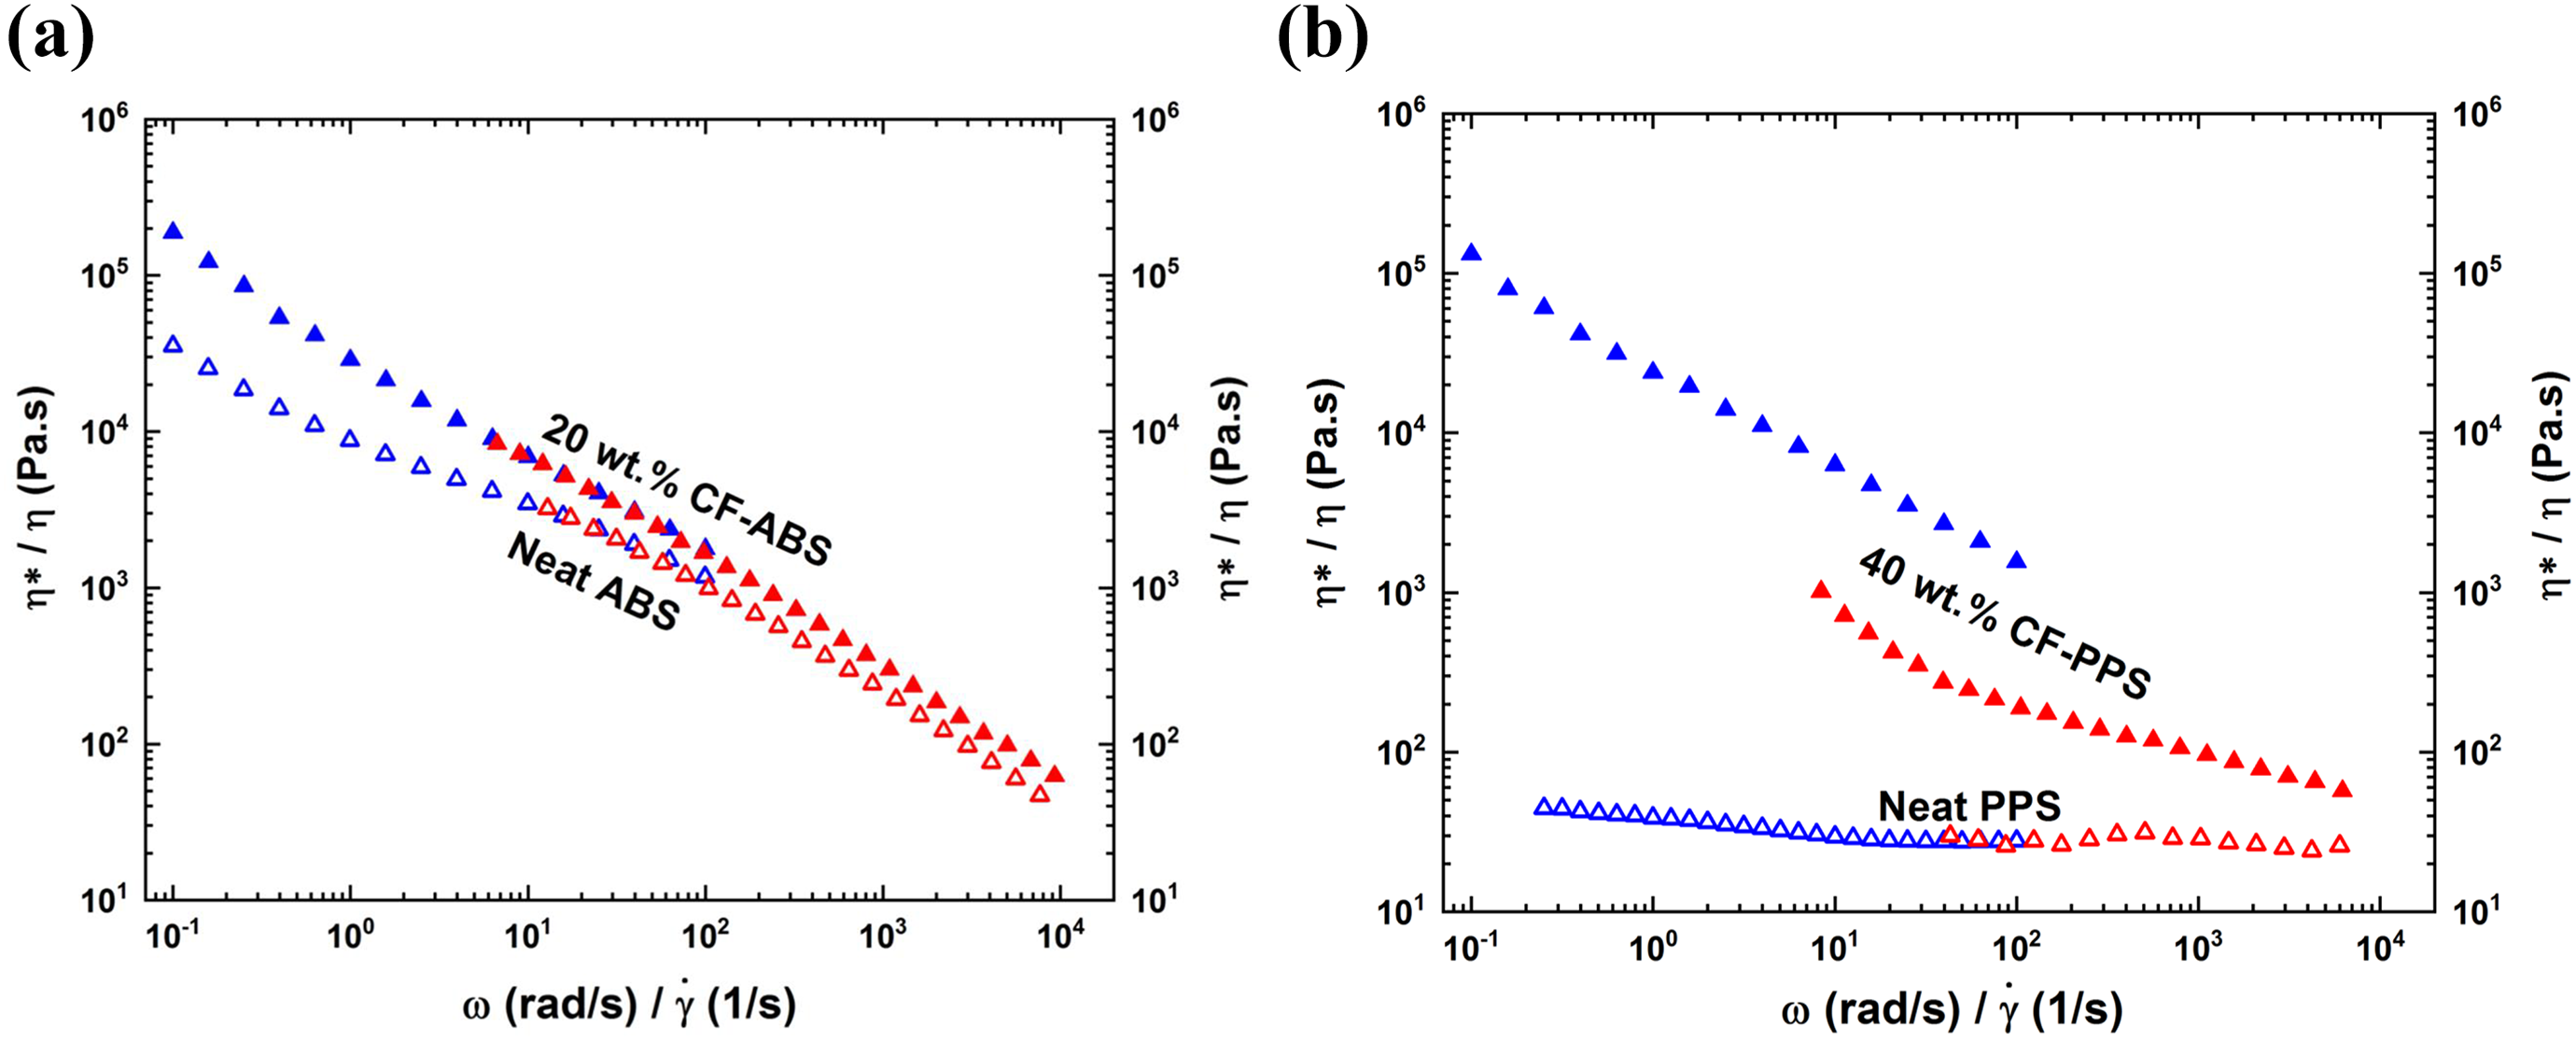
Complex viscosity and shear viscosity curves of neat (unfilled symbols) and CF-reinforced (filled symbols) ABS (a) and PPS (b) at 230°C and 335°C, respectively.
The applicability of the Cox–Merz rule to the fiber-filled composites in this study is an initial approximation. Previous studies on fiber-filled linear low density polyethylene showed higher dynamic viscosity values compared to steady-state shear viscosity values from capillary rheometry. 39 The shear viscosity values measured on the capillary rheometer for 40 wt% CF-PPS are at least 7× lower than the complex viscosity values from the rotational rheometer. The reduction in steady-state viscosity values was attributed to fiber alignment along the flow direction which is a condition more likely to be encountered during printing.14,40–43 Therefore, although the measured complex viscosities may be elevated in the high-performance thermoplastics as demonstrated in Figure 7(b), the relative impact on viscosity due to changes in material composition and processing conditions can still be quantified.
20 wt% CF-ABS and 40 wt% CF-PPS are shear thinning across the ω region tested, between 0.1 and 100 rad s−1, with n values of 0.301 and 0.356, respectively. 25 wt% CF-PPSU and 35 wt% CF-PES exhibit shear-thinning behavior at ω greater than 1 rad s−1. Computed n values for 25 wt% CF-PPSU and 35 wt% CF-PES are 0.714 and 0.707, respectively. These n values corroborate the assertion that CF-PPSU and CF-PES are less shear thinning than 20 wt% CF-ABS and 40 wt% CF-PPS.
20 wt% CF-ABS and 40 wt% CF-PPS materials exhibit shear-thinning behavior at all frequencies, and this provides a wider processing window. This allows for adjustment of a wider range of the flow rates to match the desired output when depositing these materials on the BAAM system. For example, when Hassen et al. had difficulty extruding 60 wt% CF-PPS at the desired screw speed of 200 r min−1 due to material not flowing at the desired throughput, they were able to achieve a homogenous flow of material and optimize their print, by increasing the screw speed to 300 r min−1. 10 In BAAM, the screw speed controls the flow rate of the material out of the extruder and is selected based on print geometry, layer time, and nozzle dimensions. For less shear-thinning materials such as 25 wt% CF-PPSU and 35 wt% CF-PES, the load on the screw can be controlled by either increasing the processing temperature or increasing the screw speed (i.e. increasing the shear rate) to match the desired flow rate (i.e. deposition speed). For instance, increasing the processing temperature of 25 wt% CF-PPSU from 348°C to 393°C decreased the complex viscosity by 35%. 17 Therefore, if the viscosity of CF-reinforced PPSU is too high for BAAM extrusion, increasing the temperature to achieve the desired throughput is a possibility as long as the material is not degraded in the process.
Addition of CF to neat resins increases the complex viscosity and enhances the shear-thinning behavior due to filler network breakup.14,17,18 This behavior is evident in this study where the complex viscosity of 20 wt% CF-ABS is 1.5× higher than of the neat resin while that of 25 wt% CF-PPSU and 35 wt% CF-PPSU are both 2.2× higher than their neat resins at 100 rad s−1. Lastly, the viscosity of 40 wt% CF-PPS drastically increased by 13× due to addition of CF to the neat resin at 100 rad s−1. This increase in melt viscosity directly increases the torque of the BAAM extruder. Viscosity measurements are thus crucial in determining extrusion parameters on BAAM such as screw speed to obtain the desired flow rate when printing a component.
Dynamic mechanical analysis
The dynamic mechanical properties of the four composite feedstocks were characterized to investigate the effect of build orientation on DMA properties. G′ of the polymer composite is proportional to the energy stored and is the most important property to assess when determining the load-bearing capability of a composite material. G′ tends to increase with addition of fibers to the matrix as the stiffness of the specimen is raised by fiber reinforcement, and so most of the stress is transferred to the CF through the fiber–matrix interface.44–46 Loss tangent (tan δ) is the ratio of the loss and storage modulus and it measures the damping properties of the material. The peak of the tan δ curve is used in this study to measure the Tg. At the peak of tan δ there is a large drop in G′, indicating a phase transition from a rigid glassy state where G′ is highest to a rubbery state where the molecular chains have more freedom to move. This is attributed to the promotion of the molecular mobility of the composite due to short-range thermal motions such as vibrational and rotational relaxation mechanisms. A summary of the maximum G′, G″, tan δ, and Tg values is listed in Table 5.
Maximum G′, G″, tan δ, and Tg (°C) of the four composites measured using DMA.
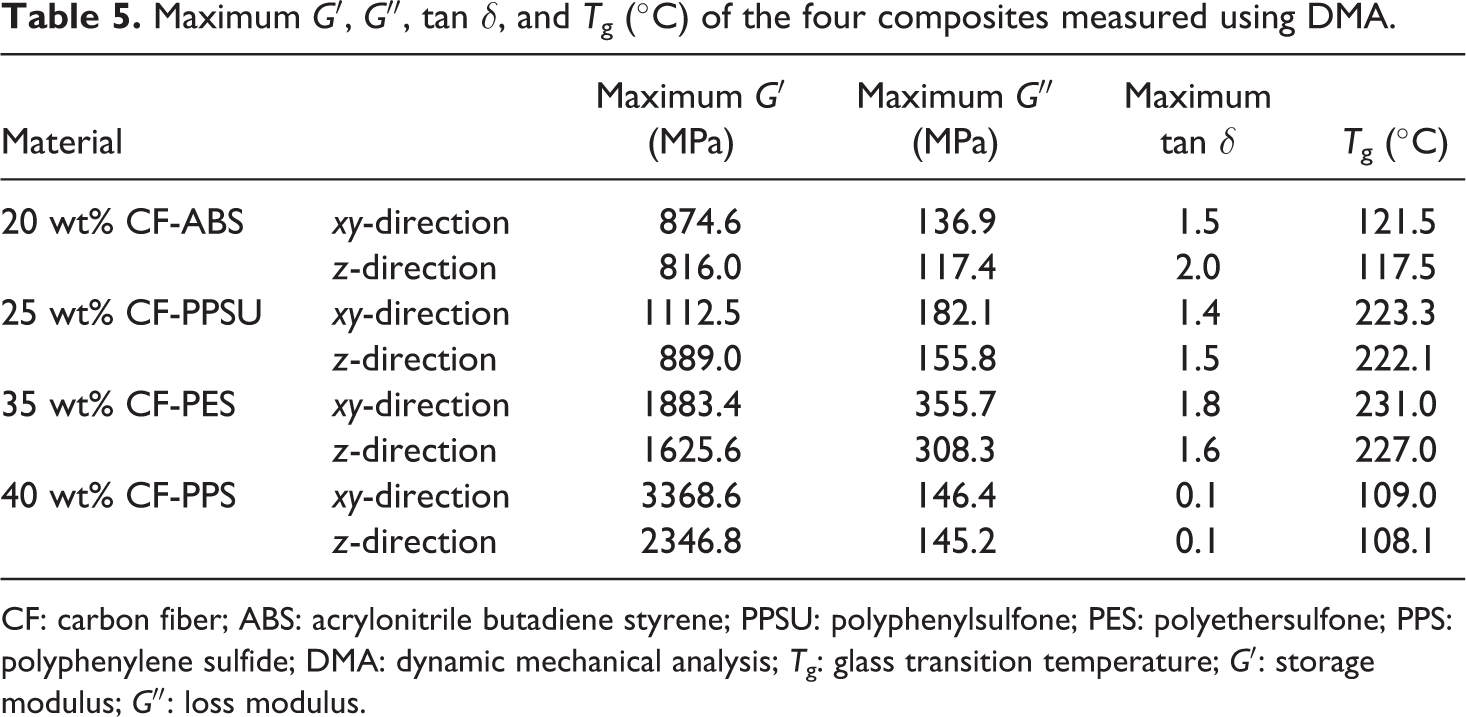
CF: carbon fiber; ABS: acrylonitrile butadiene styrene; PPSU: polyphenylsulfone; PES: polyethersulfone; PPS: polyphenylene sulfide; DMA: dynamic mechanical analysis; Tg: glass transition temperature; G′: storage modulus; G″: loss modulus.
The max G′, G″, and Tg values for 20 wt% CF-ABS (Figure 8(a)) exhibit print directionality. For instance, the xy-direction Tg value is higher than that of the z-direction sample by 4°C while the max G′ and G″ values are higher in xy-direction by 58 MPa and 19.5 MPa, respectively. This could indicate a potential effect of fiber orientation during printing where fibers tend to align parallel to the print direction (xy-direction). 47 A similar observation was made in epoxy-nanoclay ink formulations where Tg measured by DMA in the transverse section was lower by 2–5°C than in the longitudinal section. 40 In general, mechanical anisotropy is magnified in the z-direction in 3-D printed samples, with well-documented reduced strength in the z-direction compared to the xy-direction.13,48,49
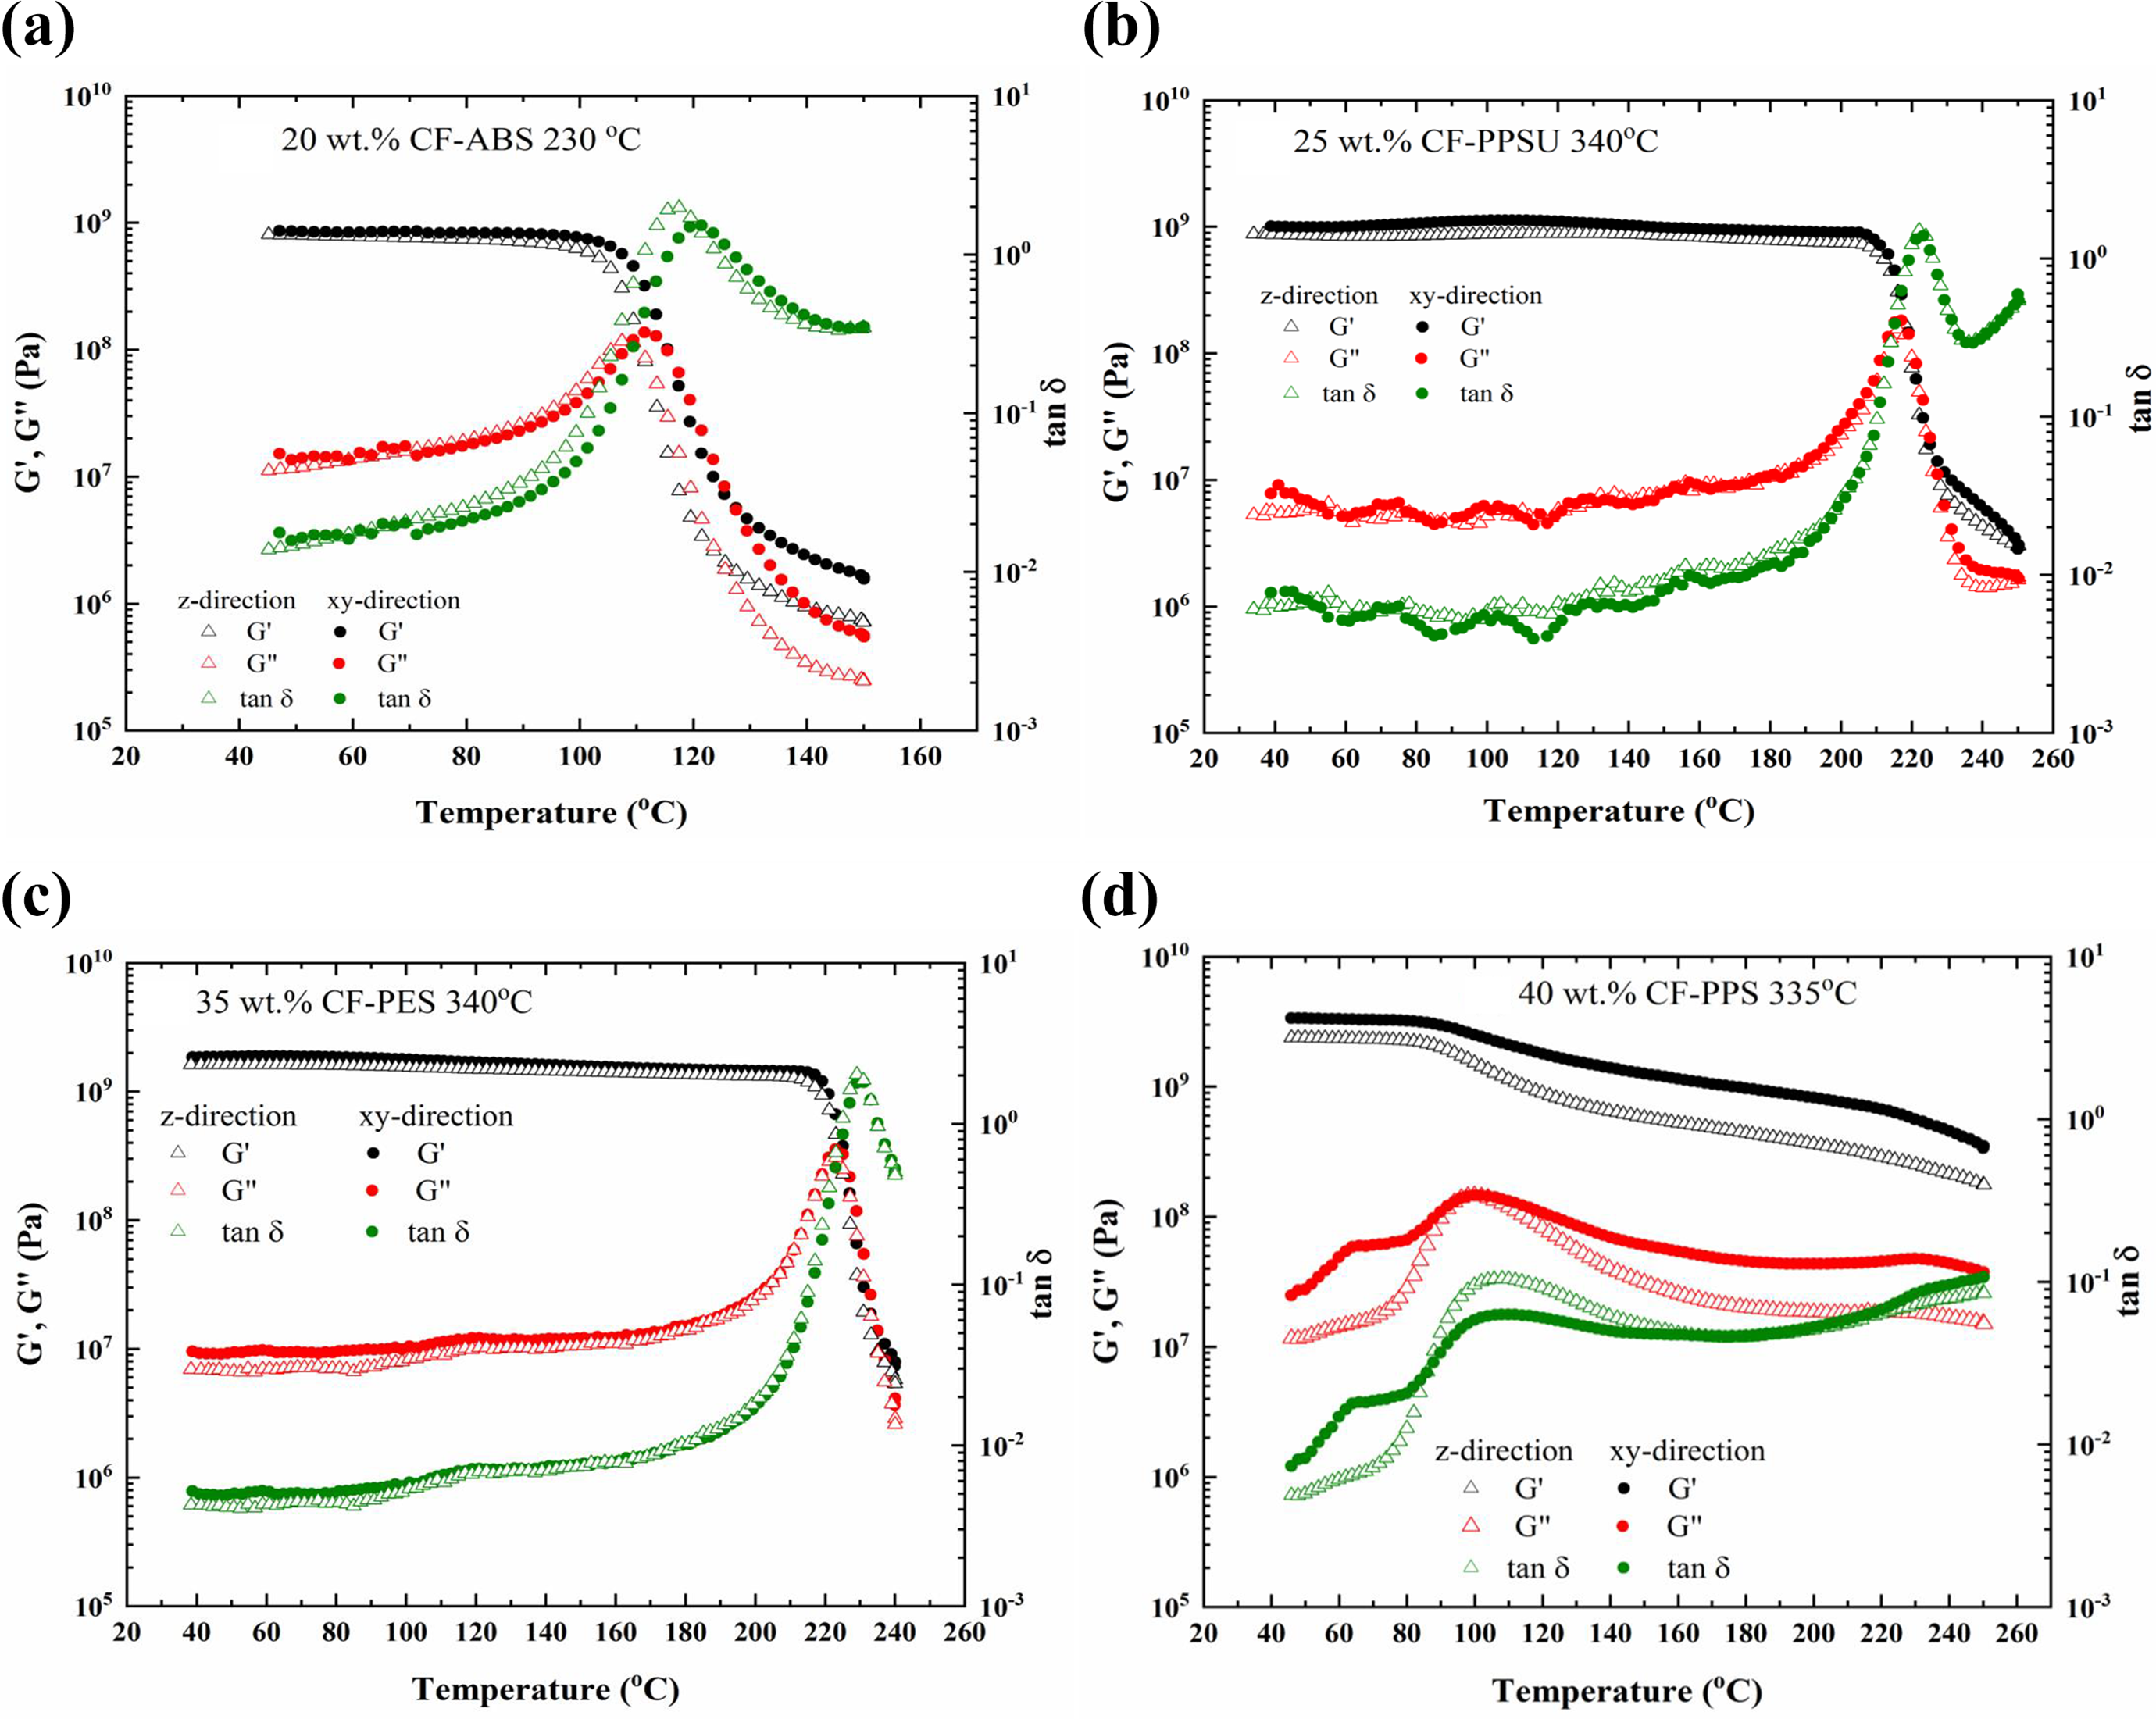
Variation of G′, G″, and tan δ versus temperature for (a) 20 wt% CF-ABS at 230°C, (b) 25 wt% CF-PPSU at 340°C, (c) 35 wt% CF-PES at 340°C, and (d) 40 wt% CF-PPS at 335°C (ω = 10 rad s−1, γ0 = 0.1%).
The Tg values for 25 wt% CF-PPSU (Figure 8(b)) do not seem to vary much with BAAM print directionality. The tan δ peak reported in Table 5 is 222°C for the xy-direction and 223°C for the z-direction. However, the max G′ and G″ for 25 wt% CF-PPSU exhibit BAAM print directionality. The values for max G′ and G″ are higher in the xy-direction than in the z-direction by 25% and 16.7%, respectively.
The max G′, G″, and Tg values for 35 wt% CF-PES (Table 5 and Figure 8(c)) exhibit print directionality. The Tg values for 35 wt% CF-PES are 4°C higher in the xy-direction than in the z-direction, respectively while max G′ and G″ are higher in the xy-direction by at least 15% compared to the z-direction.
The max G′ value for 40 wt% CF-PPS (Figure 8(d)) is 44% higher in the xy-direction than the z-direction, an indication that build orientation influences the viscoelastic response of the composite. 44 However, the Tg indicated by the tan δ peak for 40 wt% CF-PPS does not indicate an influence in print directionality (Table 5).
The few studies in literature that investigate the dynamical mechanical properties of 3-D printed neat ABS and PPSU resins focus on varying FFF process parameters to optimize the dynamic mechanical properties of the printed components.50,51 For instance, while investigating the effect of process parameters on the dynamic mechanical properties of FFF printed polycarbonate-ABS, Mohamed et al. found that the build direction increased the G′ and G″ in addition to enhancing the damping properties of the components. 52 The G′ and G″ values obtained for BAAM printed parts in this study are within 20% of the values reported for neat ABS and PPSU DMA samples fabricated using FFF.50,51 This variation could be attributed to the addition of CF to the base resin which increases their G′ and G″ values. Given the variability of max G′, G″, and Tg values for xy- and z-direction BAAM samples, more studies need to be conducted using various CF loadings to investigate the effect of CF content on the thermomechanical properties of BAAM components in the xy and z build directions.
Conclusions
In this study, the dynamic rheological properties of 20 wt% CF-ABS, 25 wt% CF-PPSU, 35 wt% CF-PES, and 40 wt% CF-PPS, which have been successfully used to print molds on BAAM, were investigated. The LVE properties, namely storage modulus (G′), loss modulus (G″), and complex viscosity, of these composites were studied, and the rheological behavior related to the BAAM extrusion and bead formation process. The results showed that 20 wt% CF-ABS and 40 wt% CF-PPS display a more dominant elastic component and are highly shear thinning at all frequencies tested. While printing with these two composites on BAAM, the dominant elastic component of these composites ensures good bead sagging resistance while the shear-thinning behavior allows for a wider range of flow rates that match the desired throughput to be used. 25 wt% CF-PPSU and 35 wt% CF-PES exhibited a more dominant viscous component and were shear thinning at higher angular frequencies. To deposit with these composites on BAAM, the load on the screw can be varied by increasing the deposition temperature or increasing the screw speed to match the desired flow rate. DMA results for all BAAM printed parts showed that the G′, G″, and tan δ are influenced by build direction to a certain extent. More studies need to be conducted on various fiber loadings of these composites in order to draw stronger conclusions about the effect of build directionality on BAAM printed samples.
Footnotes
Acknowledgements
The authors thank Techmer ES and BASF for providing all the materials used in this research. The authors also acknowledge the partial support of the Center for Materials Processing, a Tennessee Higher Education Commission (THEC) supported Accomplished Center of Excellence, for the use of various processing equipment to conduct parts of this research.
Funding
The author(s) disclosed receipt of the following financial support for the research, authorship, and/or publication of this article: This research was sponsored by the US Department of Energy, Office of Energy Efficiency and Renewable Energy, Advanced Manufacturing Office, under contract DE-AC05-00OR22725 with UT-Battelle, LLC.