
Abstract
This article reports the experimental investigations for tensile, compressive and morphological properties of 3D printed functional prototypes composed of polylactic acid (PLA) reinforced with poly ether ketone ketone (PEKK), hydroxyapatite (HAp) and chitosan (CS). The PLA-PEKK-HAp-CS composite has wide applications as scaffolds in orthopaedics and clinical dentistry. The tensile and compressive specimens were printed (as per ASTM D638 type IV and ASTM D695) with in-house prepared feedstock filament on commercial fused deposition modelling setup by following Taguchi-based design of experiment. The results are also supported by hardness data and photomicrographs.
Introduction
In past two decades, the use of polylactic acid (PLA)-based composites has increased manifold especially as scaffolds in orthopaedics and clinical dentistry. It has been reported that the tensile strength of PLA is inversely proportional to layer thickness of functional prototype. 1 Some studies have reported different types of reinforcement in PLA. For example, when a composite of PLA and Samarium-doped magnesium-aluminate-phosphor (MgAl2O4: Sm3+) is prepared a dip in melting, glass transition and crystallization temperatures of PLA was observed, while the mechanical properties were improved. 2 The composite of PLA and carbohydrate (cHA) particles shows an increase in roughness as cHA content increases. However, there was degradation in mechanical properties. 3 It is well known that recycling a polymer degrades its mechanical performance, but taking into account the effects on environment and the economics, recycling needs to be considered as one of the good alternatives. The reported literature outlines that when recycled PLA is coated with polydopamine and 3D printed, it shows an improvement in mechanical performance. 4 The chitosan (CS)-based composite materials have acquired attention due to their biocompatibility, antimicrobial activity, low toxicity, biodegradability and natural abundance. 5 When a comparison is made between carbon fibre-reinforced PLA (PLA/CF) and treated basalt fibre-reinforced PLA (PLA/BF) then it is found that flexural properties of PLA/BF composite are better while tensile properties are just comparable to PLA/CF. 6 Halloysite nanotubes (HNTs) coating on PLA is found to increase the hydrophilicity, growth and adhesion of cells on PLA surface. 7 In one of the studies, it has been found that when a forced air-cooling set-up is attached to the print head then it has a marked influence on the performance of 3D printed specimen. Forced air-cooling results in better dimensional accuracy while the mechanical performance is deteriorated. A fourfold difference of mechanical strength is found when one sample is force-cooled at 5 ms−1 and the other is not subjected to force-cooling. 8 The recycling of PLA in a closed loop, that is, by using the printed PLA again for 3D printing is considered to be environment friendly when compared against landfill and incineration. However, closed-loop recycling process has limitations like – it can be effective for only two printing cycles because there is degradation in the properties of polymer. The rheological properties are severely affected while mechanical performance is reduced up to a limit. However, rheological properties can be improved by addition of virgin PLA in recycled PLA. 9 The hydroxyapatite (HAp) when added to PLA in 4% by weight can be used for producing filament for fused deposition modelling (FDM) process as it gives a good melt flow index and sufficient tensile strength. 10 The composite of keratin and CS with PLA shows good in vitro behaviour. Also, the hardness value and Young’s modulus are good enough when compared to PLA. But there is a slight decrease in tensile strength. 11 The composite of PLA with nanofibres of ZnO shows a decrease in thermal stability and increase in crystallinity. 12 The composite of chitin and PLA is also a potential candidate for use in biomedical field as it gives favourable results in terms of cytotoxicity and antimicrobial activity. Also, an improvement in mechanical performance is observed as compared against PLA. 13 The micro-particles of PLA have advantages of intramuscular injection while nanoparticles can be injected directly into the blood. However, the nanoparticles possess a potential immune-toxicity effect. 14 PLA can be used effectively as a scaffold to counter a small fracture where there is no requirement of very heavy load to carry, but for knees, ankles and so on, implants should be titanium based. 15 Ethylene-vinyl-acetate material possess about 500% more elongation as compared to PLA. 16 Some studies reported that when HAp is added to epoxy, it shows an improvement in flexural strength of composite. 17 The helical carbon nanotubes once added to PLA matrix give a boost to ductility of PLA as well as its impact strength. 18 The nanoparticles of ZnO if added to PLA matrix results in improvement of tensile strength and also the composite shows a good barrier property to UV light as well as to water vapour. 19 The flame-resistant property of PLA becomes appreciably high when phosphorus is used as an intrinsic component in PLA. 20 The half-life of PLA is about 30 weeks, but it can be increased or decreased according to patient specific needs. 21 The degradation products of PLA are carbon dioxide and water or it can be lactic acid. These are safe and can be excreted through breath and urine. 22 These properties makes PLA good candidate as scaffolds for biomedical applications. On addition of wood flour and poly-methyl-methacrylate to PLA, it is found that bending strength and tensile strength gets increased and hydrolysis rate comes out to be higher when compared against PLA. 23 The composite of silver-HAp nanoparticles shows an excellent antibacterial activity. 24 Graphene oxide and HAp nanoparticles also show an excellent biocompatibility which can be used in dentistry, orthopaedic and drug-delivery applications. 25
The literature review reveals that a lot of work has been reported on use of PLA matrix material as scaffolds in orthopaedic and clinical dentistry. Some studies have reported in-house development of PLA-poly ether ketone ketone (PEKK)-HAp-CS-based composite feedstock filament for FDM. But hitherto, no study has reported the use of PLA-PEKK-HAp-CS composite as 3D printed functional prototype. This work is an extension of previous reported studies conducted in Manufacturing Research Lab, Department of Production Engineering, GNDEC, Ludhiana (India) for in-house development of PLA-PEKK-HAp-CS composite as feedstock filament. 26 The tensile and compressive specimens were printed (as per ASTM D638 type IV and ASTM D695) with in-house prepared feedstock filament on commercial FDM set-up for further investigations.
Materials and methods
The composition/proportion of PLA-(PEKK-Hap-CS)* as 95-(5)* by wt% has been selected for printing on FDM. The reinforcement of 5% by weight has been fixed as *(PEKK-Hap-CS): (94-4-2) by wt%. The selection of reinforcement and matrix material weight proportion is based upon pilot experimentation and previous reported studies at Manufacturing Research Lab (Department of Production Engineering, GNDEC, Ludhiana (India). 26 In the present study, commercial FDM set-up (Make: Divide by zero, India) was used for printing of prototypes. Three parameters namely infill density ratio (in %), infill speed (mm s−1) and number of perimeters with three levels were selected based upon initial trial runs. Table 1 shows design of experiment (DOE) based upon Taguchi L9 orthogonal array (OA).
DOE based upon Taguchi L9 OA.
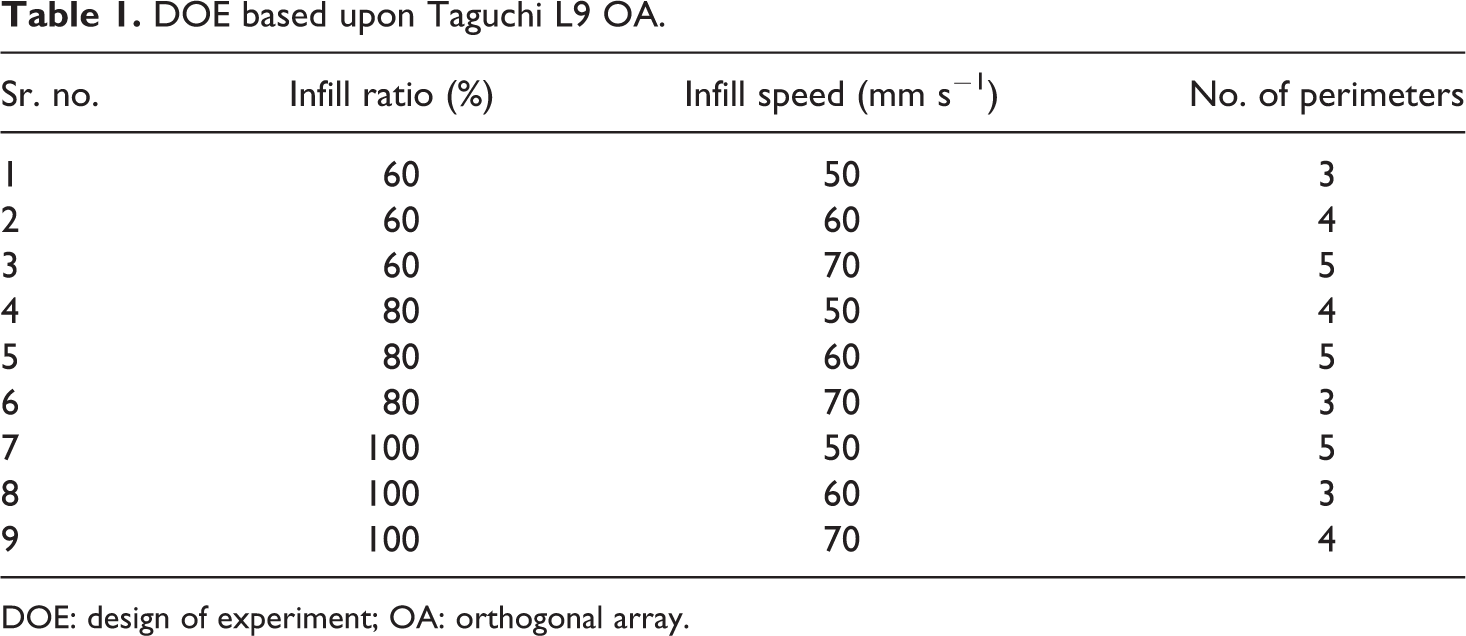
DOE: design of experiment; OA: orthogonal array.
Figure 1 shows scheme for 3D printing of test specimen. The methodology for complete experimentation is shown in Figure 2.
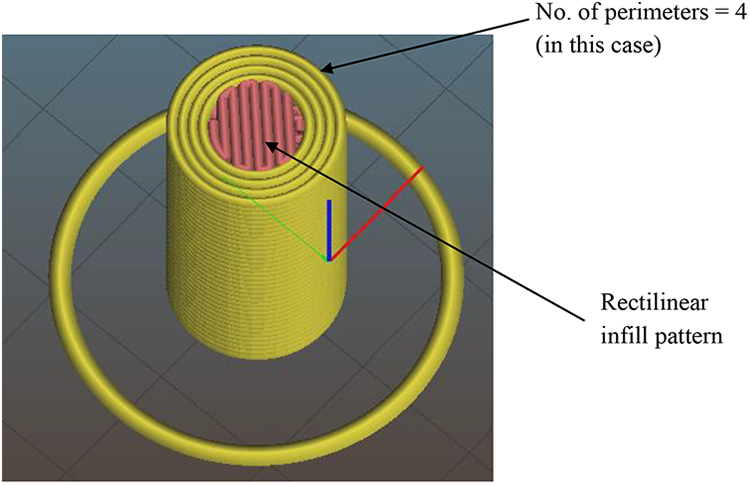
FDM printing process for compressive test specimen.
Methodology for experimentation.
Experimentation
Tensile testing
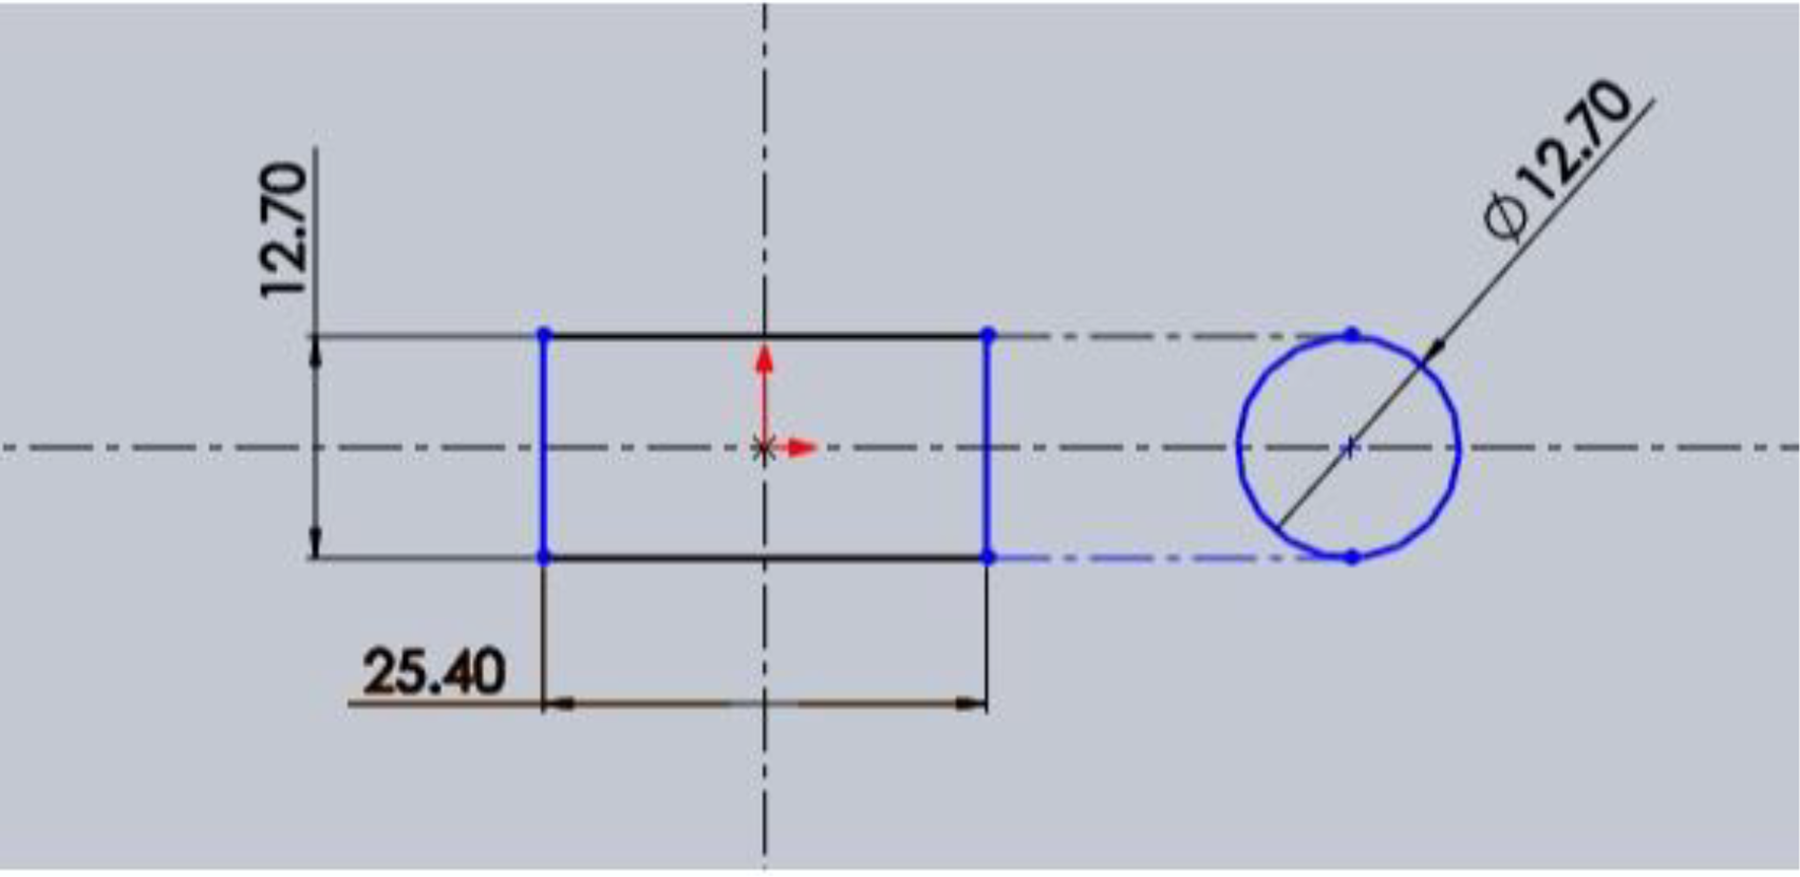
The tensile test specimens have been prepared according to ASTM D638 type IV (see Figure 3).
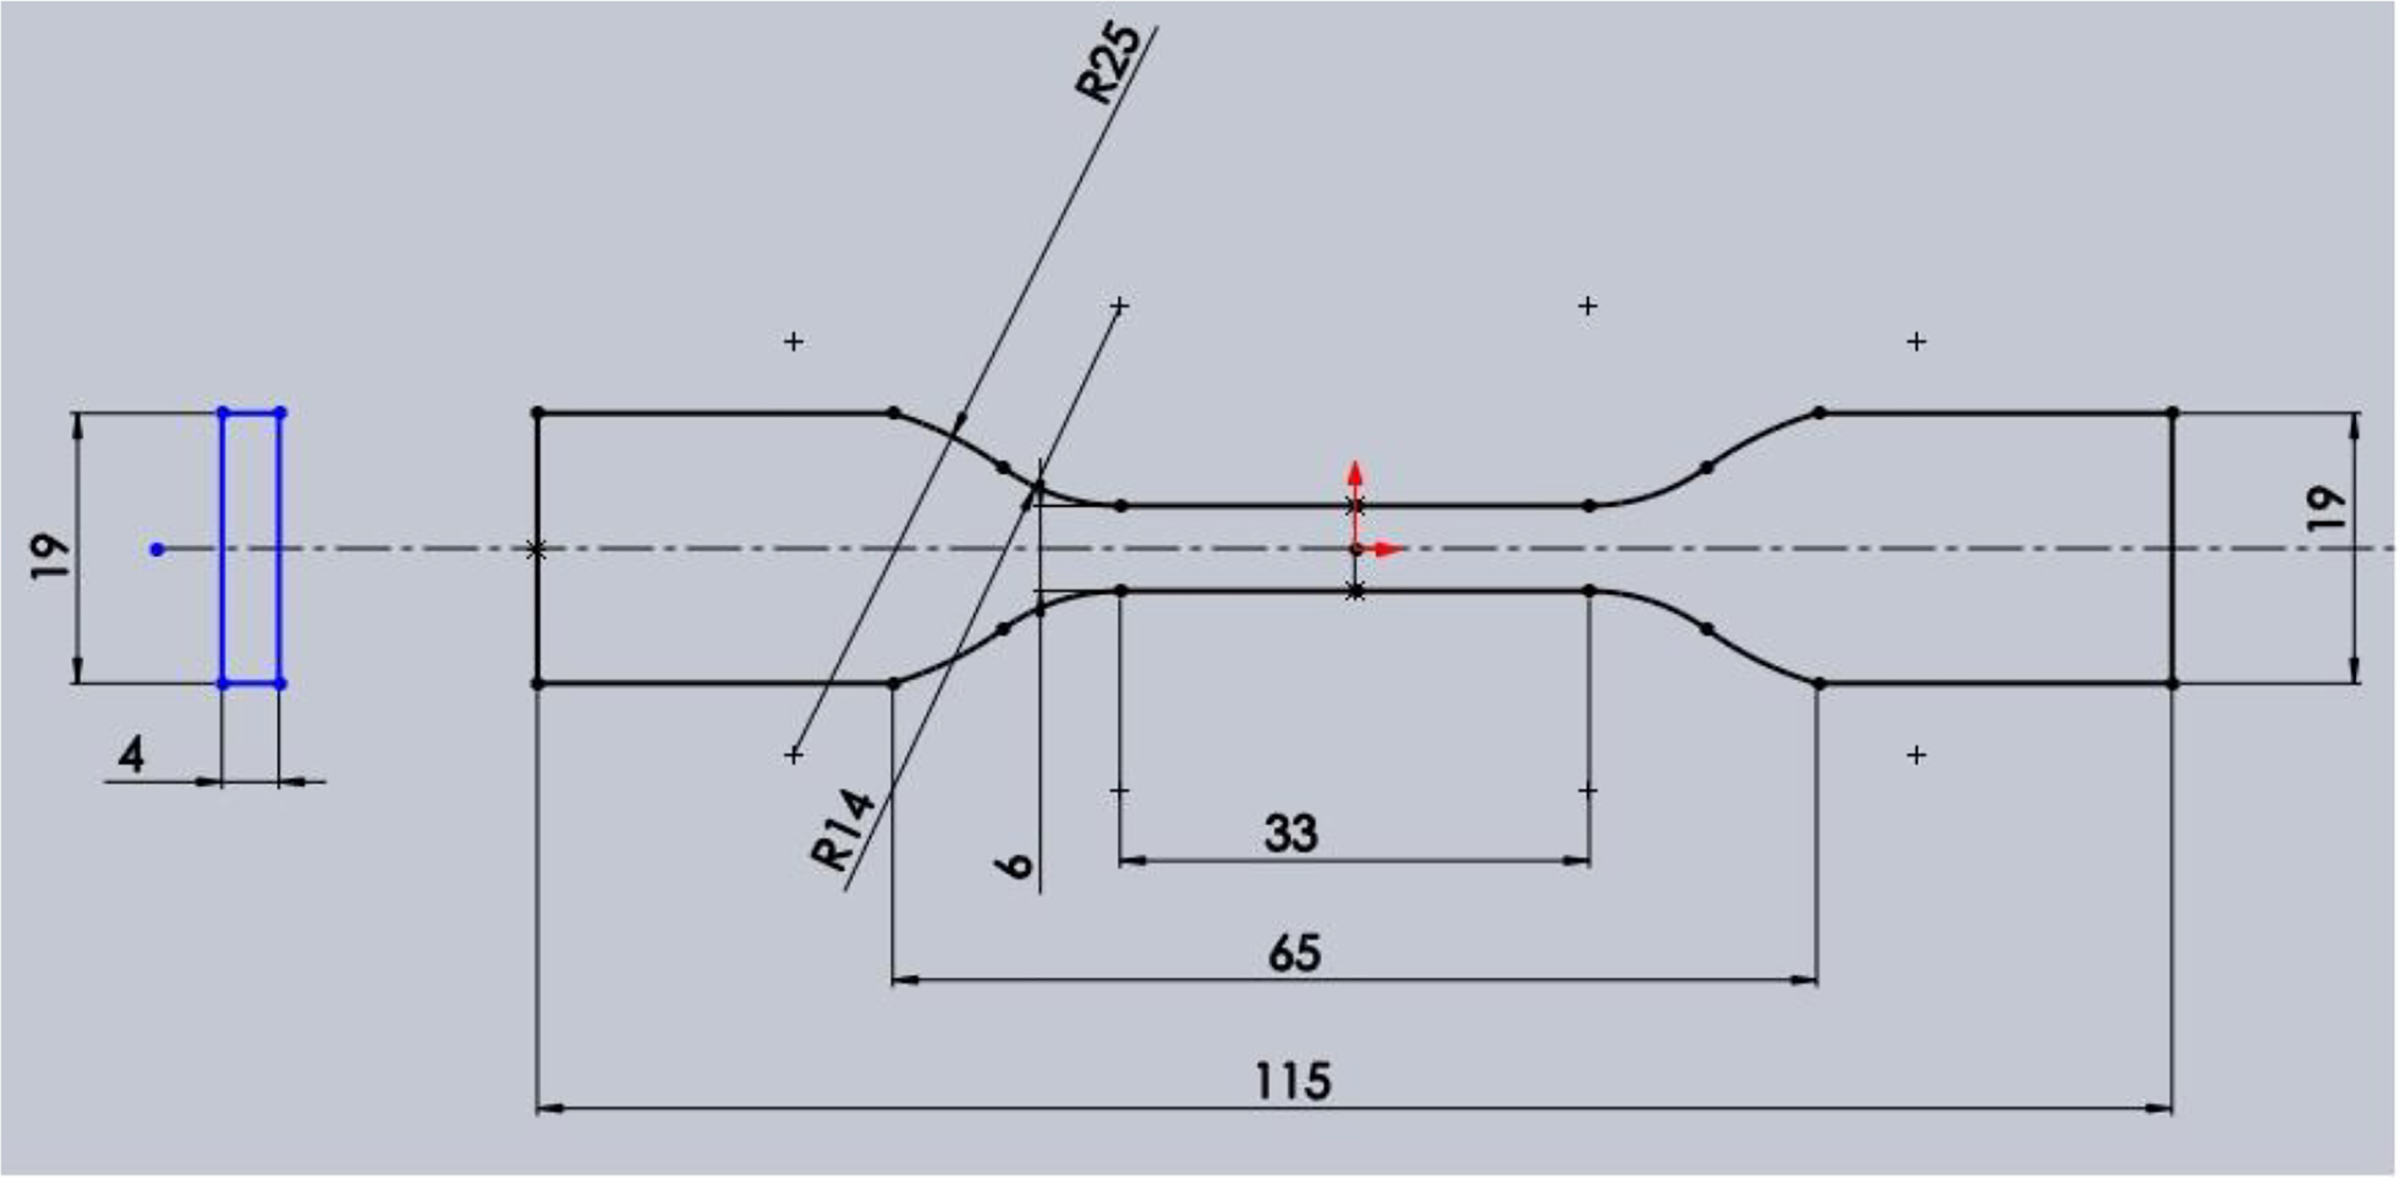
ASTM D638 type IV specimen (all dimensions in mm).
Based upon Table 1, Figure 4 shows 3D printed FDM samples. The samples so prepared were subjected to tensile testing. Table 2 and Figure 5 respectively show observations for peak strength and stress strain curves (as per Table 1).
Observations for peak strength (tensile testing).a
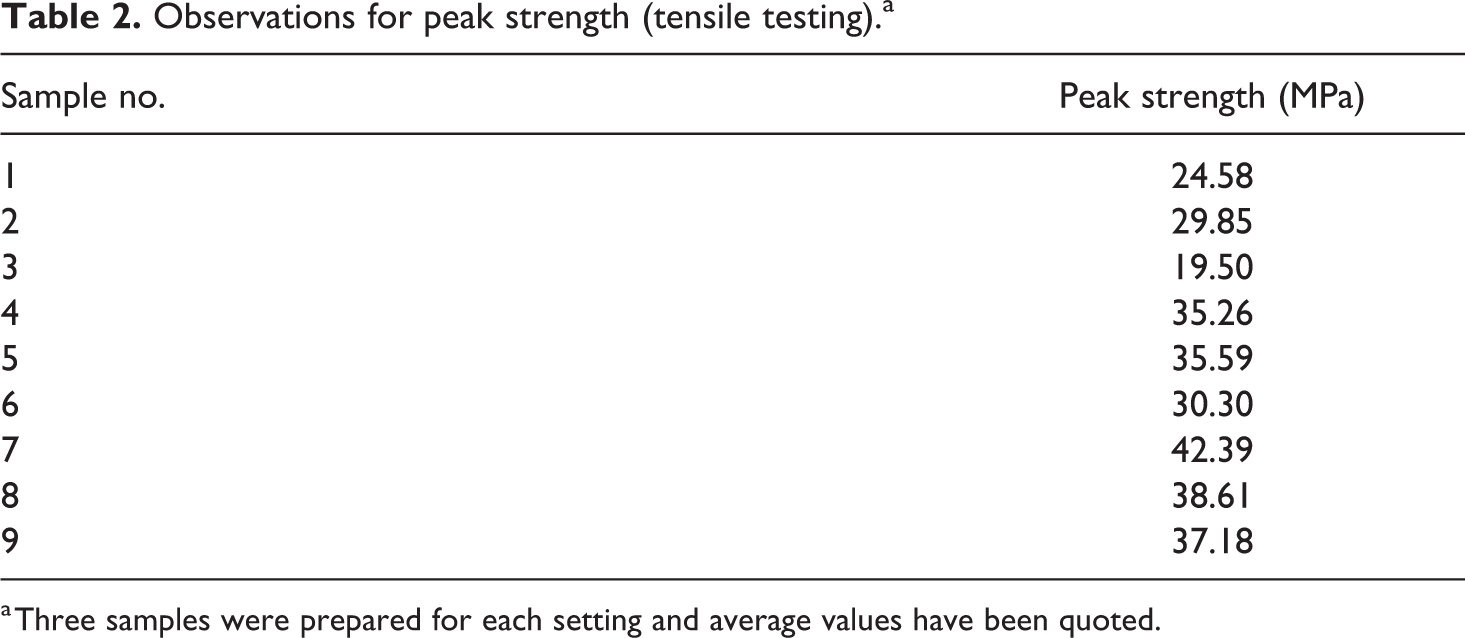
a Three samples were prepared for each setting and average values have been quoted.
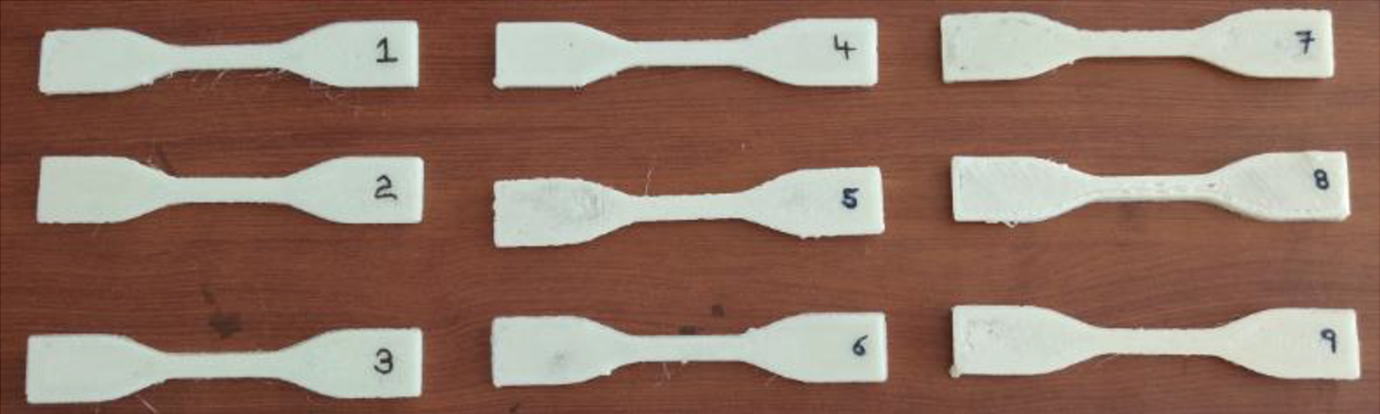
3D printed samples prepared by FDM.
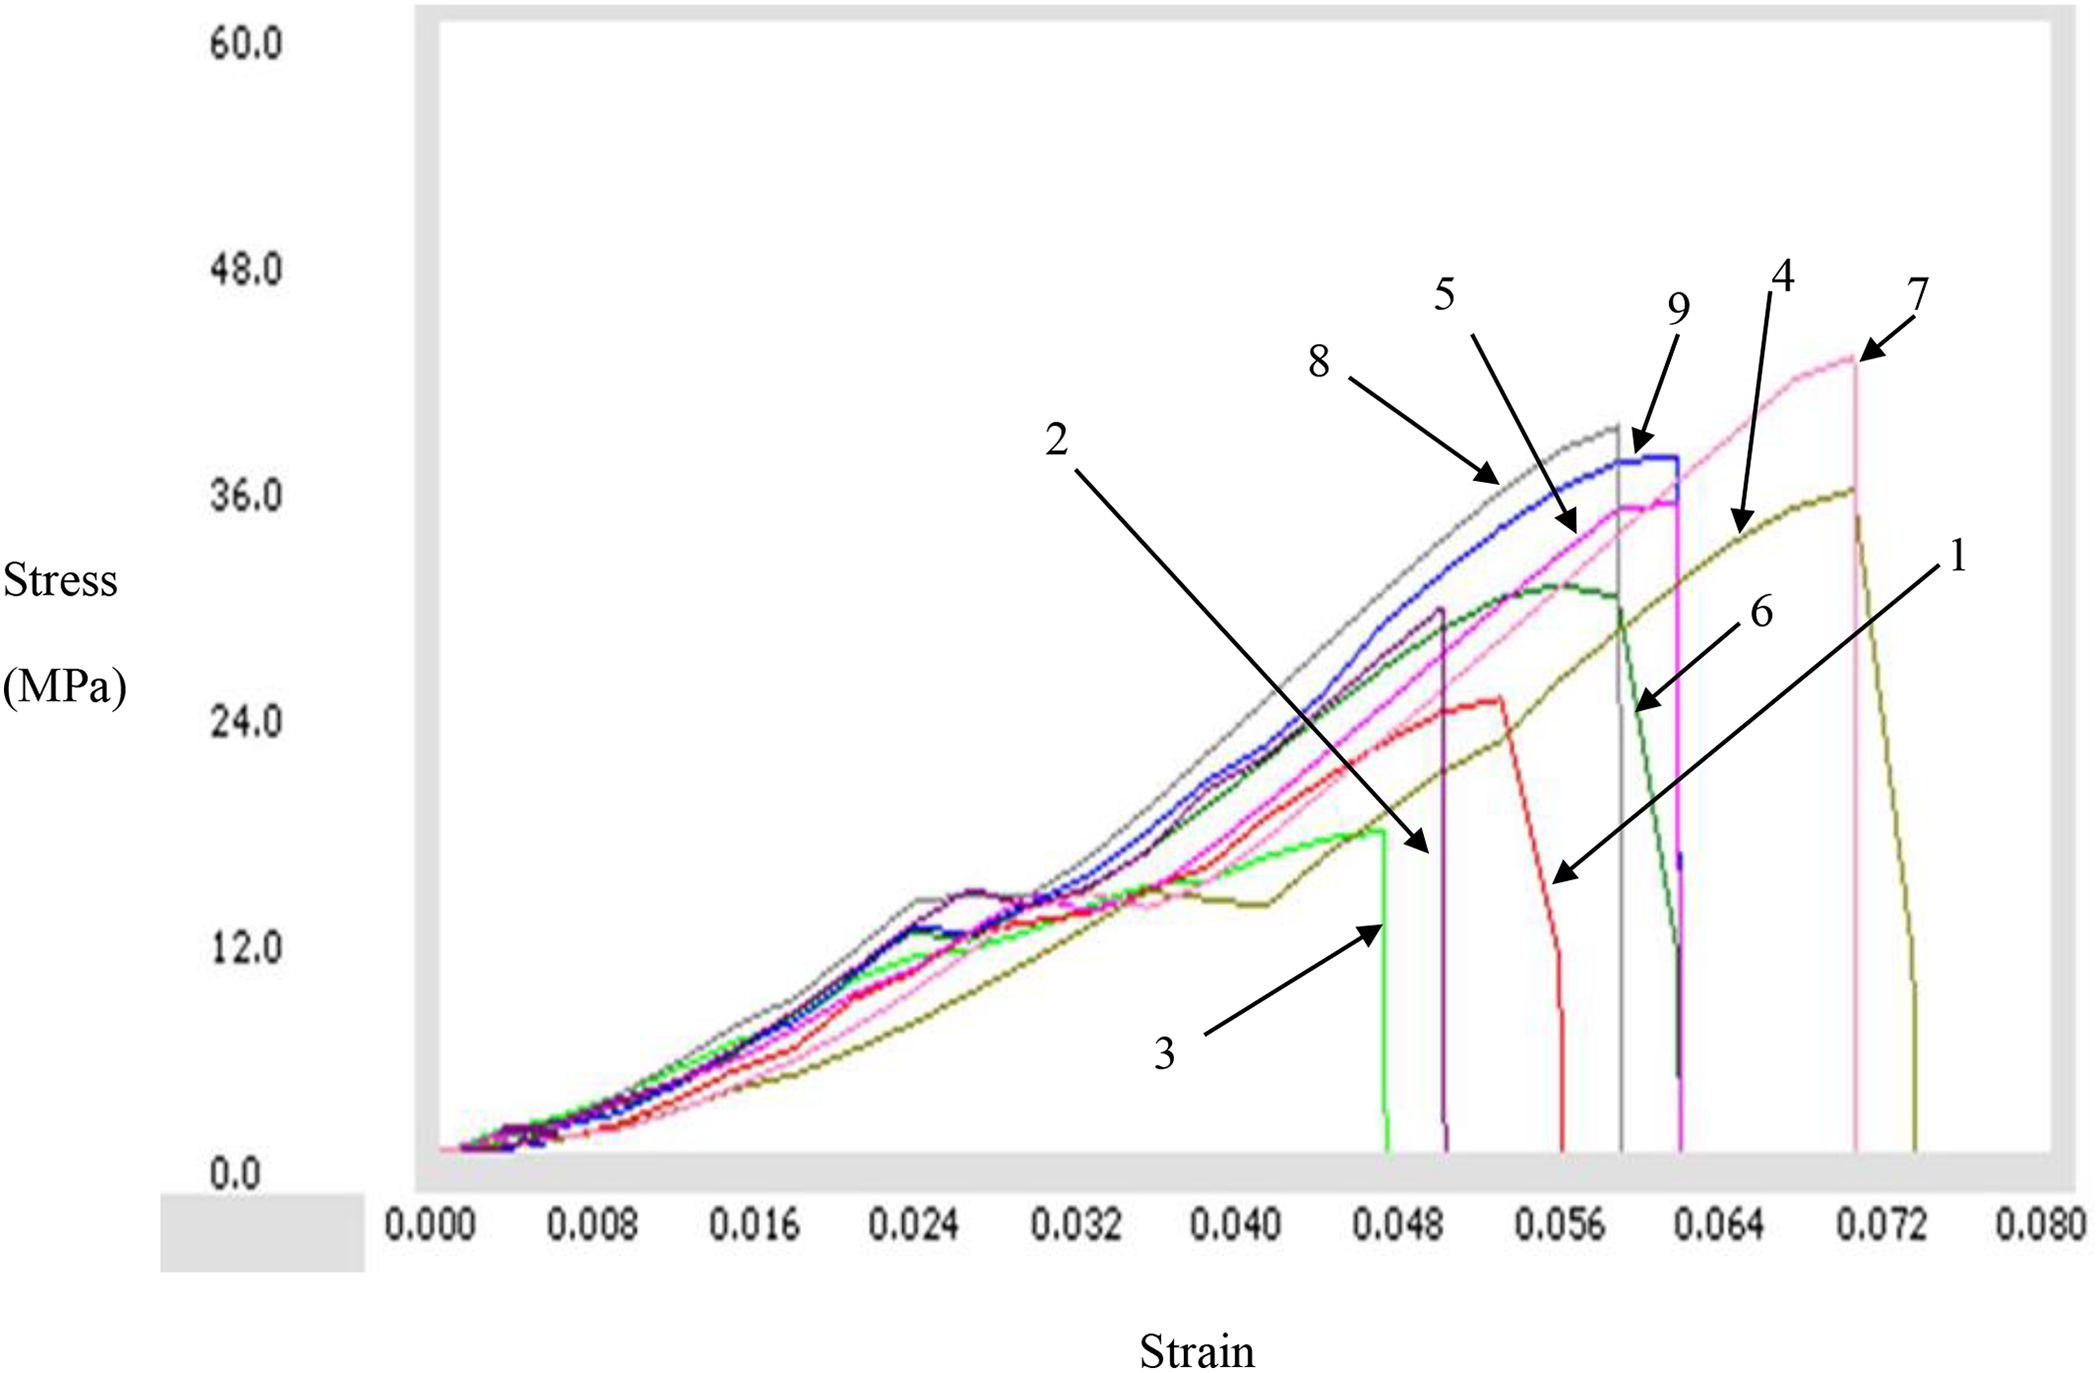
Stress versus strain diagram of tensile test.
It has been observed from Table 2, sample no. 7 has maximum peak strength and sample no. 3 has minimum peak strength. Figure 6 shows tensile test specimen after fracture/breakage.
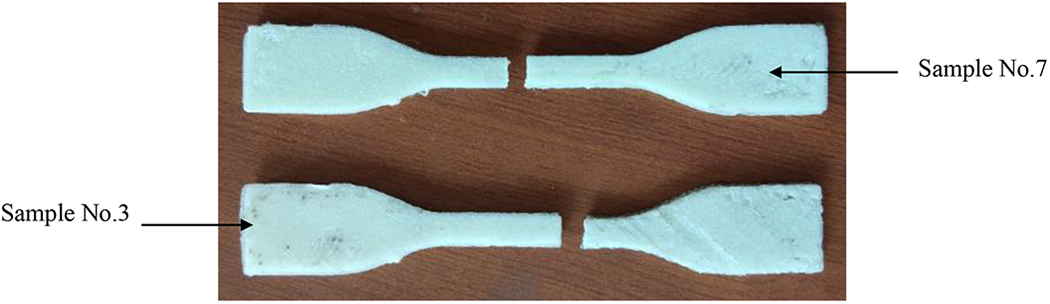
Broken tensile test specimens.
Compressive testing
Figure 7 shows compressive strength test specimens prepared according to ASTM D695.
ASTM D695 specimen (all dimensions in mm).
Based upon Table 1, Figure 8 shows 3D printed specimens for compressive strength.
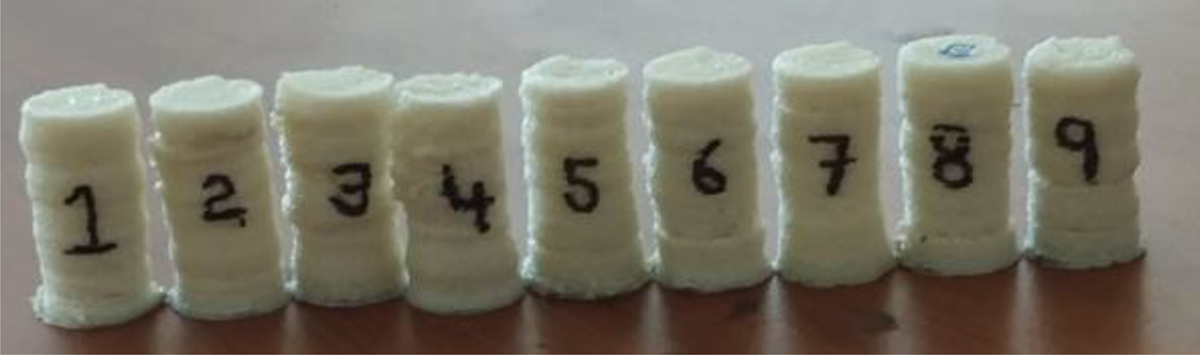
Compressive strength samples prepared by FDM.
In the present study, the specimens in compression test have been assumed to be failed when length gets reduced by 20%, that is, it becomes 20 mm from 25 mm initial. The values of peak strength are shown in Table 3. As observed from Table 3, best values for peak strength are observed for sample no. 7 and worst for sample no. 3. Figure 9 shows the 3D view of specimens after compression test.
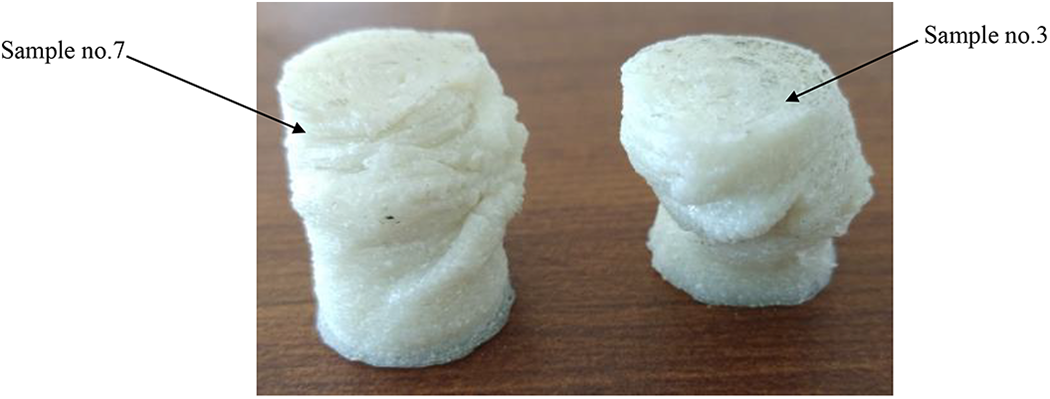
Specimens after compression test.
Observations for peak strength (compressive testing).a
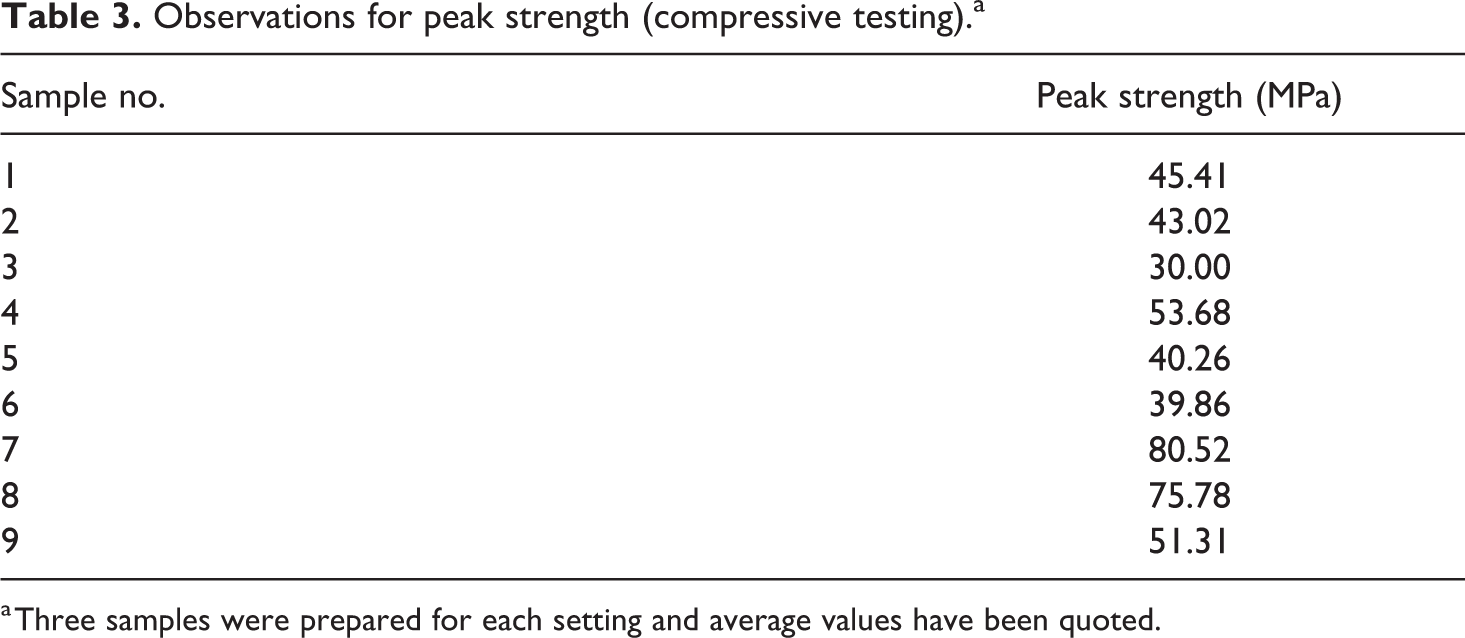
a Three samples were prepared for each setting and average values have been quoted.
Hardness test
Further based upon Table 1, hardness of the specimens has been determined with the help of Shore D hardness tester (see Table 4).
Observations for hardness.a
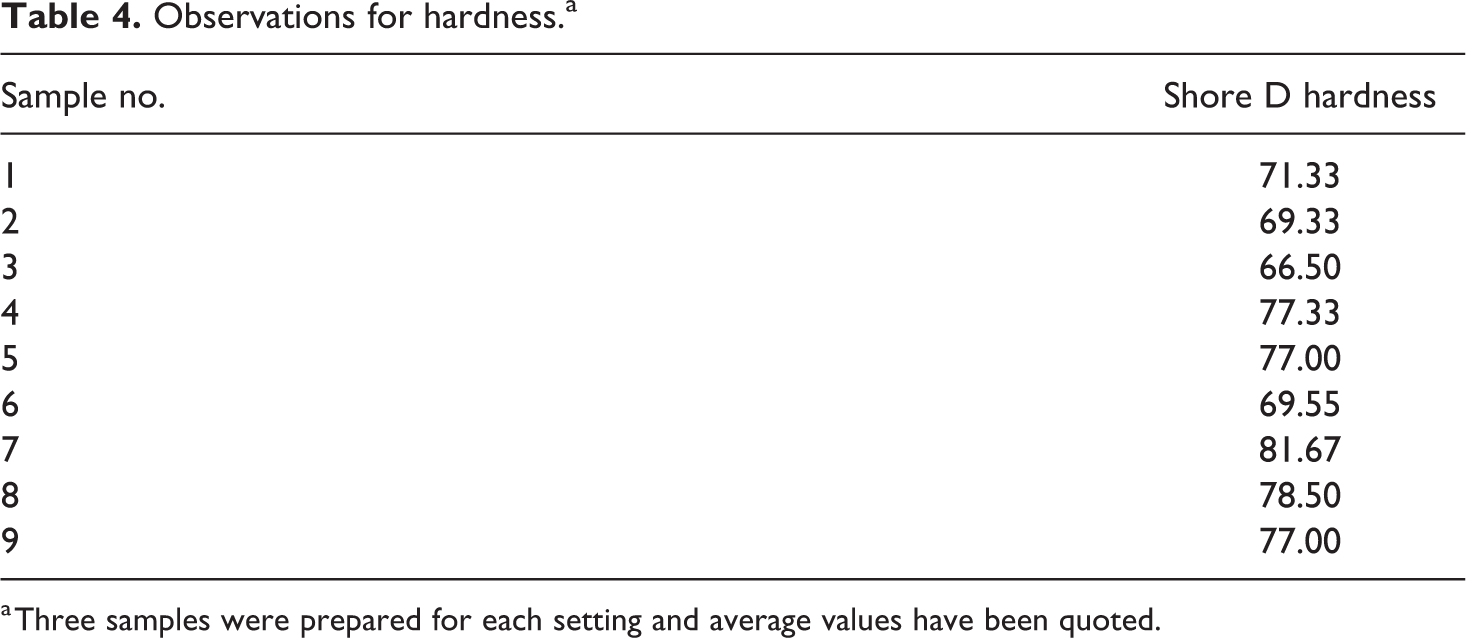
a Three samples were prepared for each setting and average values have been quoted.
Discussion
Process optimization of input variables
Based upon Tables 2 to 4, process optimization of input variables has been conducted by using analysis of variance (ANOVA) approach and signal to noise (S-N) ratios were computed for maximum the better type case (see Table 5) by using following formula:
S-N ratio analysis for selected outputs.
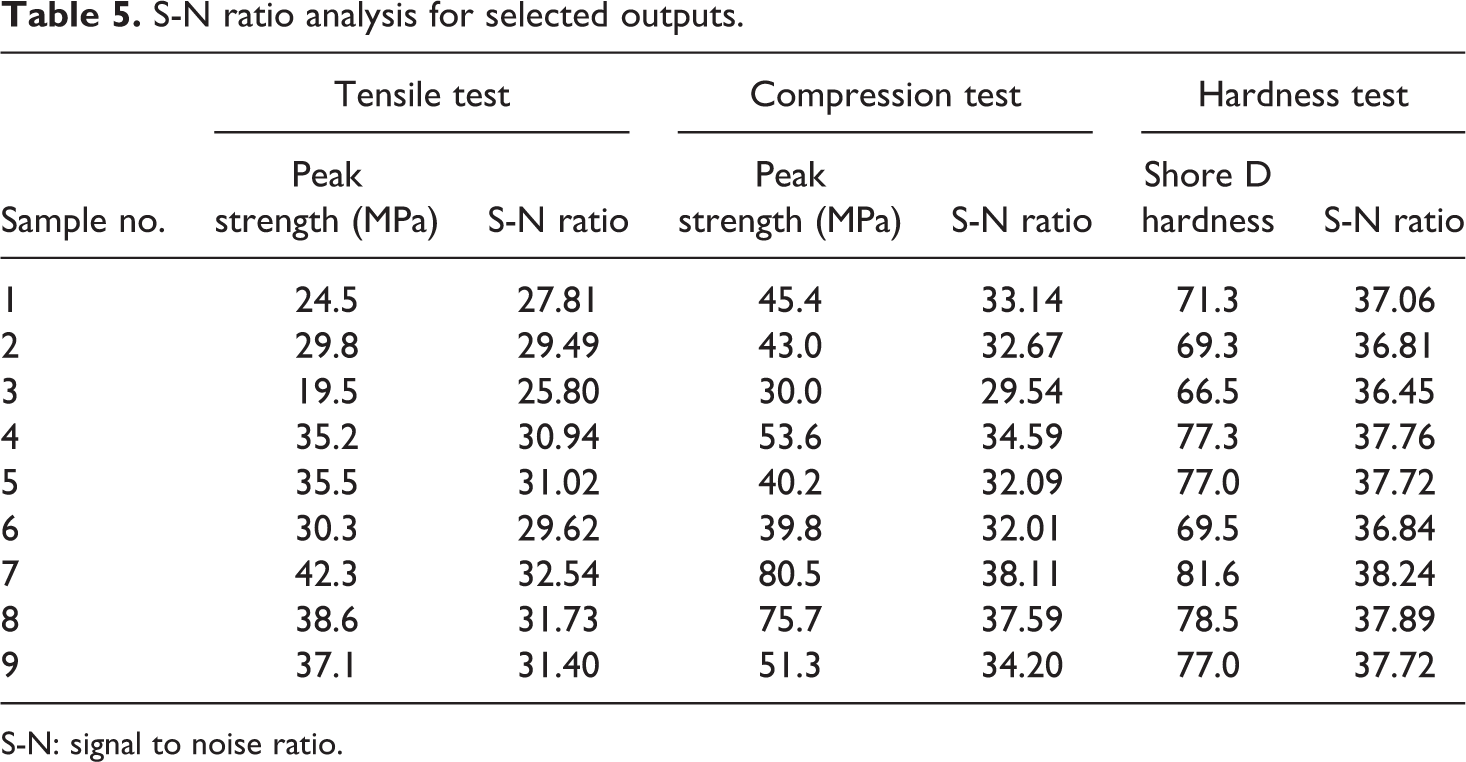
S-N: signal to noise ratio.
where
Analysis of peak strength in tensile test
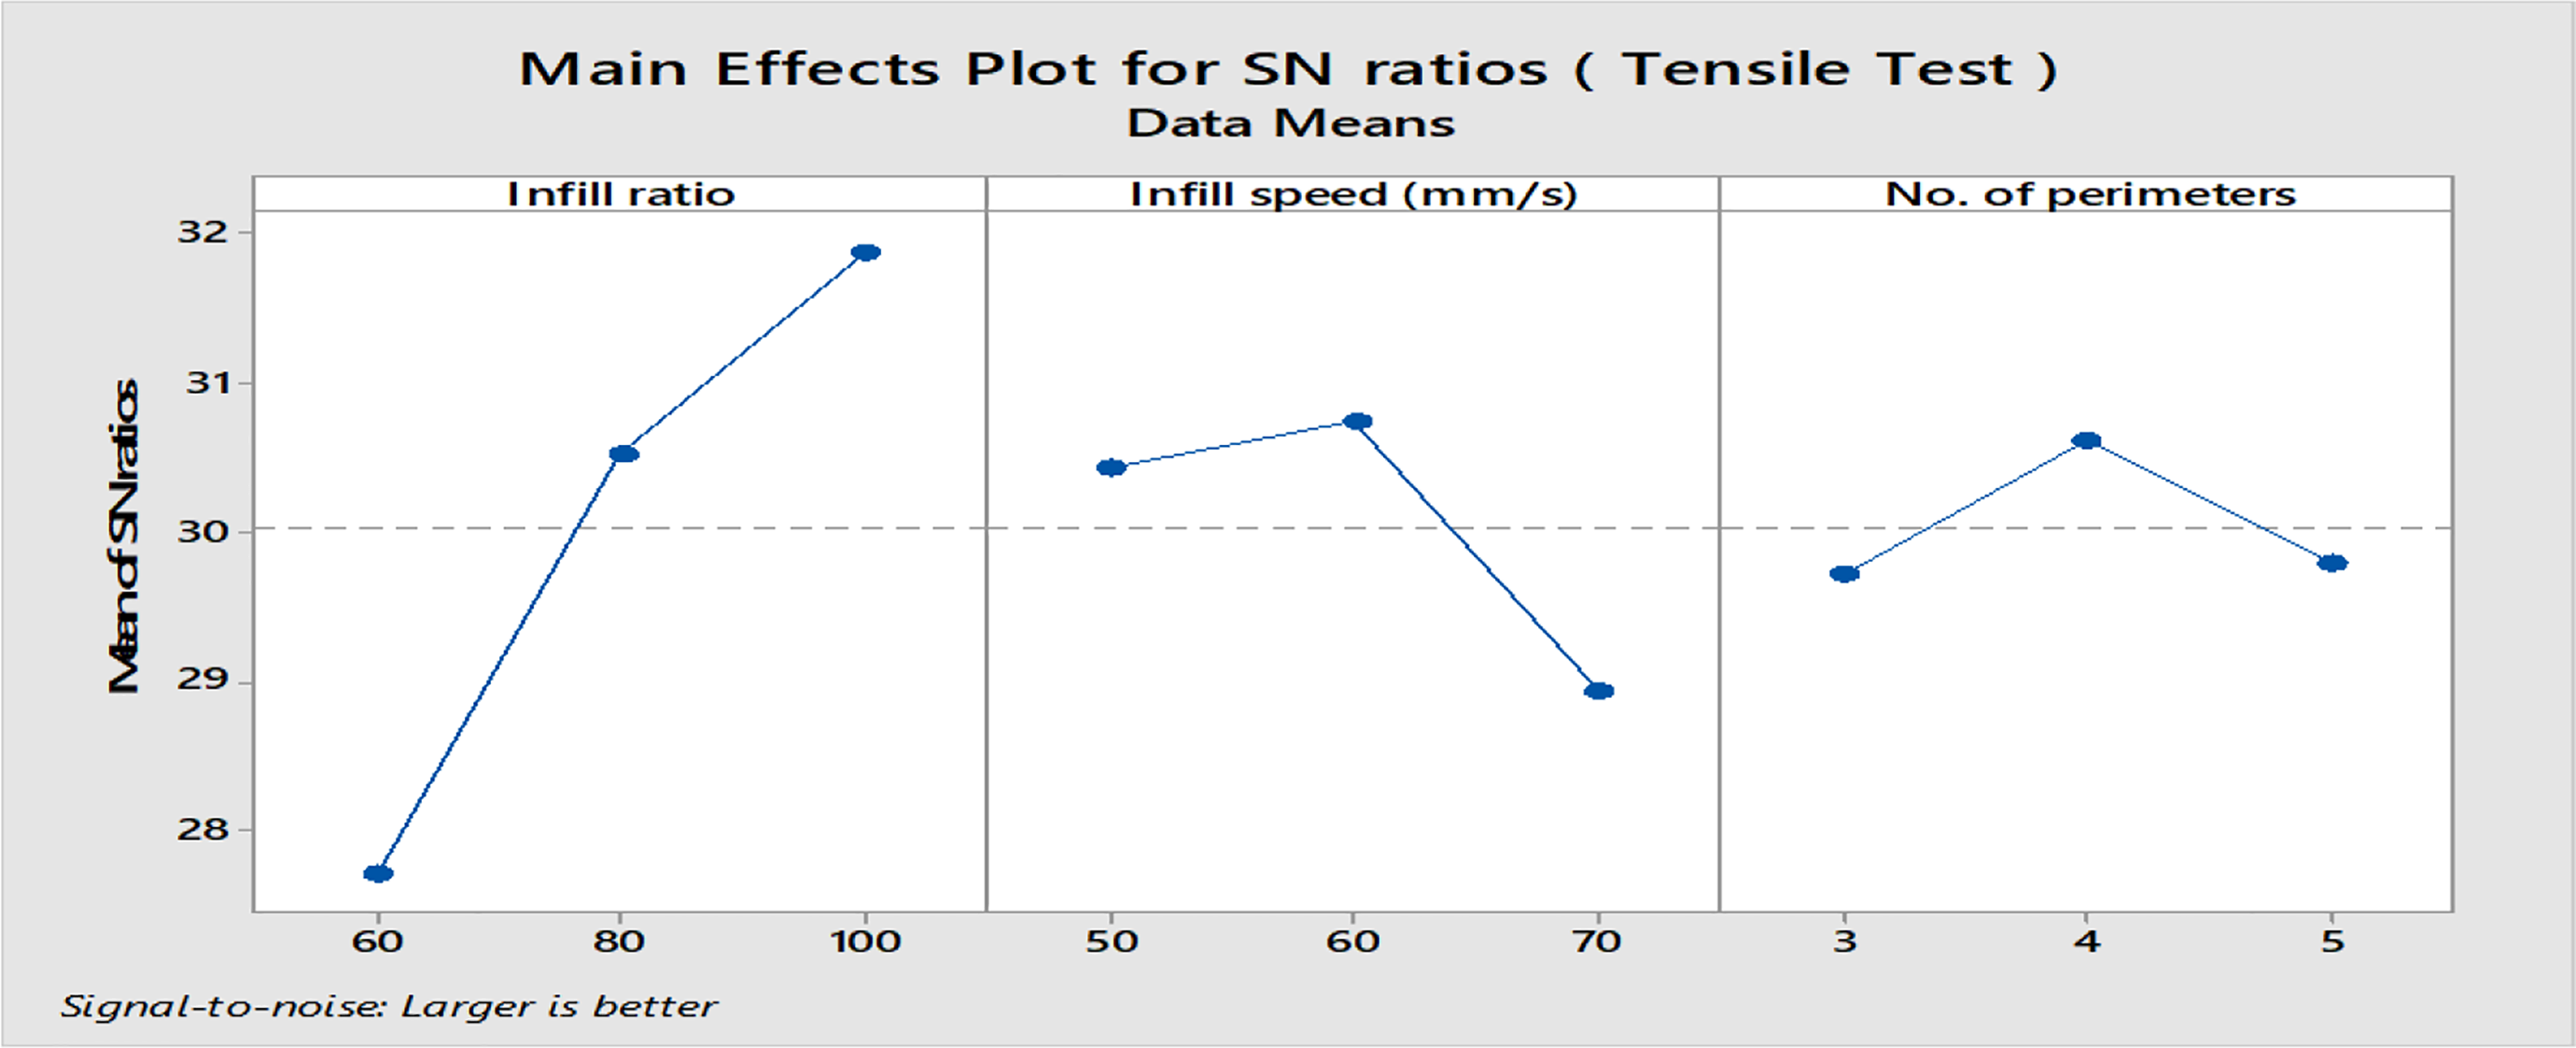
Based upon Table 5, Figure 10 and Table 6 respectively show main effect plot for S-N ratio for peak strength (while tensile testing) and ANOVA for percentage contribution.
Main effects plot for S-N ratios (peak strength in tensile test).
ANOVA for peak strength (tensile testing).
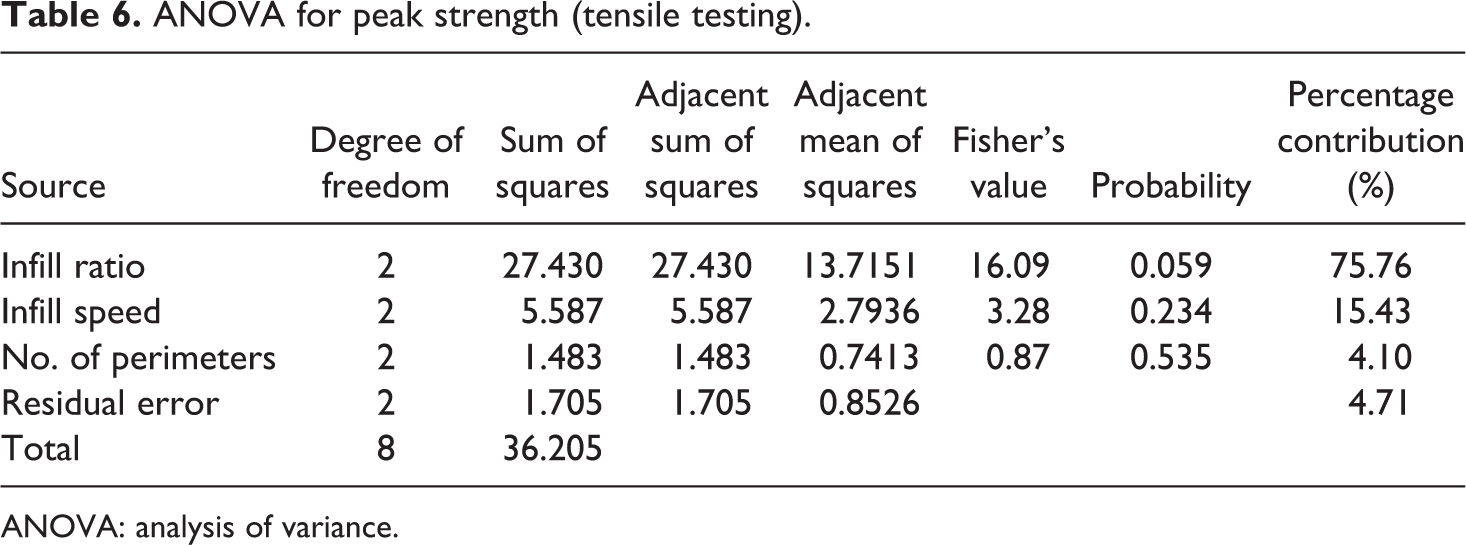
ANOVA: analysis of variance.
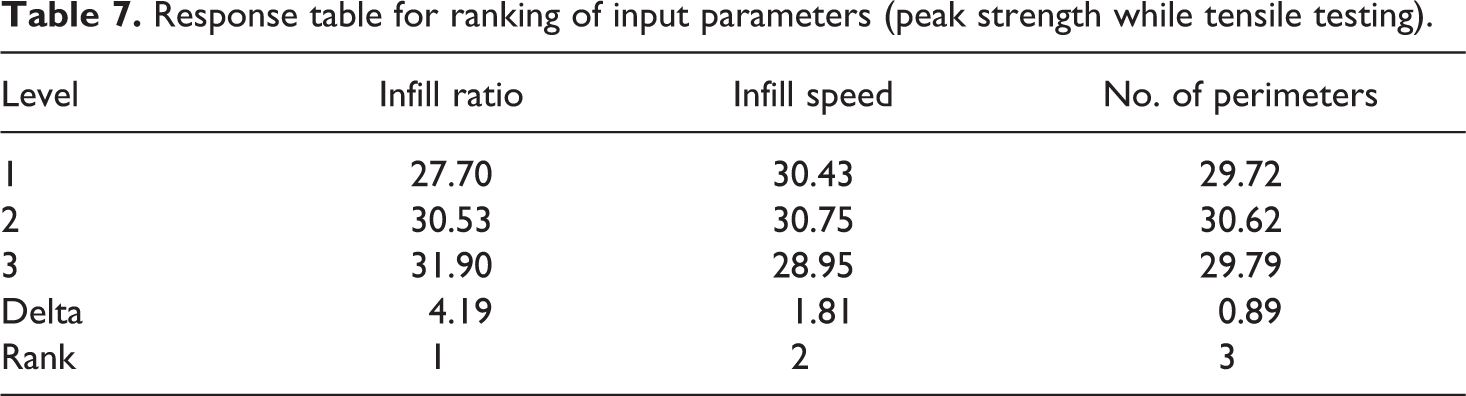
As shown in Figure 10, infill ratio is 100%, infill speed as 60 mm s−1 and number of perimeters is 4 are the best settings for peak strength. The best setting of input parameter as maximum infill ratio/density is but obvious as because high density will lead to better resistance for deformation. The reason for best setting parameters for infill speed as 60 mm s−1 and number of perimeters as 4 may be that these settings have contributed for better/uniform layer deposition with more compactness and controlled rate of heat transfer for the selected PLA composite matrix. For understanding the behaviour of infill speed and number of perimeters, ANOVA was conducted (Tables 6 and 7), which highlights that percentage contribution of infill speed and number of perimeters is quite low as compared to infill ratio (density).
Response table for ranking of input parameters (peak strength while tensile testing).
The residual error comes out to be 4.71% which depicts a reasonable accuracy in predicted model.
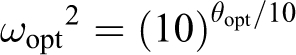
Optimization of peak strength (in tensile test)
For optimization of peak strength, the following formula has been used:

where θ opt = optimum S-N ratio value (for peak strength in tensile test), λ = overall average of S-N data, λ A3 = average of S-N data for infill ratio at level 3, λ B2 = average of S-N data for infill speed at level 2 and λ C2 = average of S-N data for no. of perimeters at level 2.

substituting the following values: λ = 30.04 dB, λ A3 = 31.90 dB, λ B2 = 30.75 dB, and λ C2 = 30.62 dB:


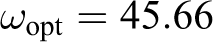

The confirmatory experiment was conducted as per proposed settings infill ratio is 100%, infill speed as 60 mm s−1 and number of perimeters 4 and experimental value for tensile strength achieved was 46.32 MPa which is very close to the predicted value.
Analysis of peak strength in compression test
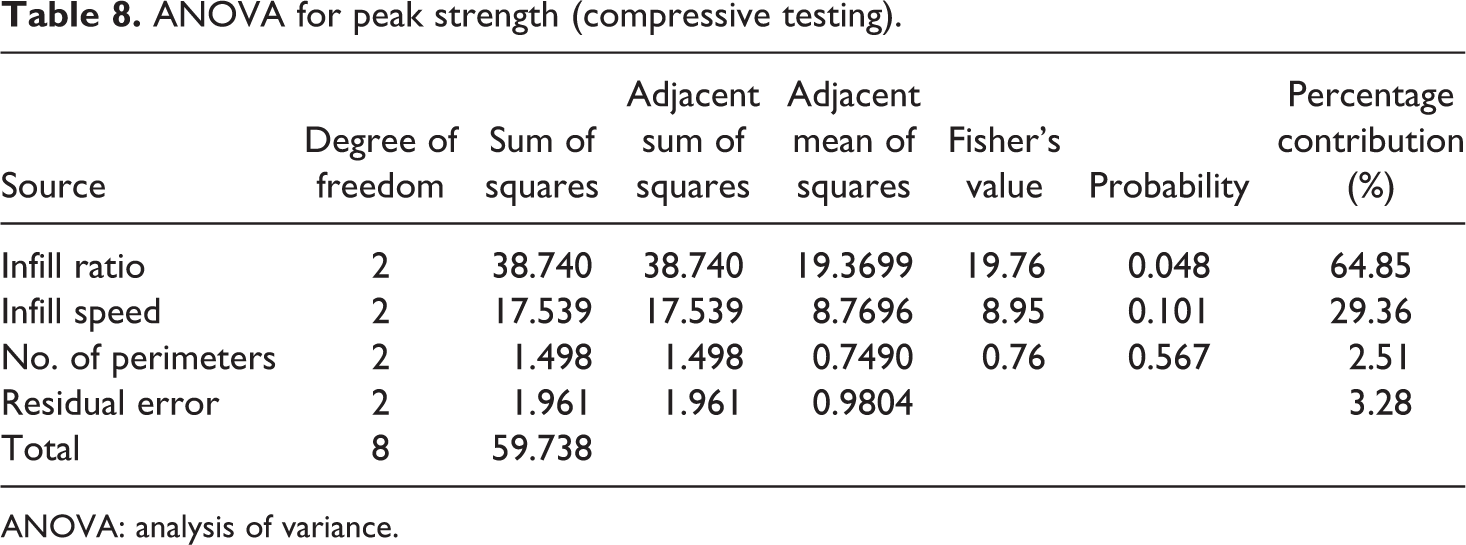
Based upon Table 5, Figure 11 and Table 8 respectively show main effect plot for S-N ratio for peak strength (while compression) and ANOVA for percentage contribution.
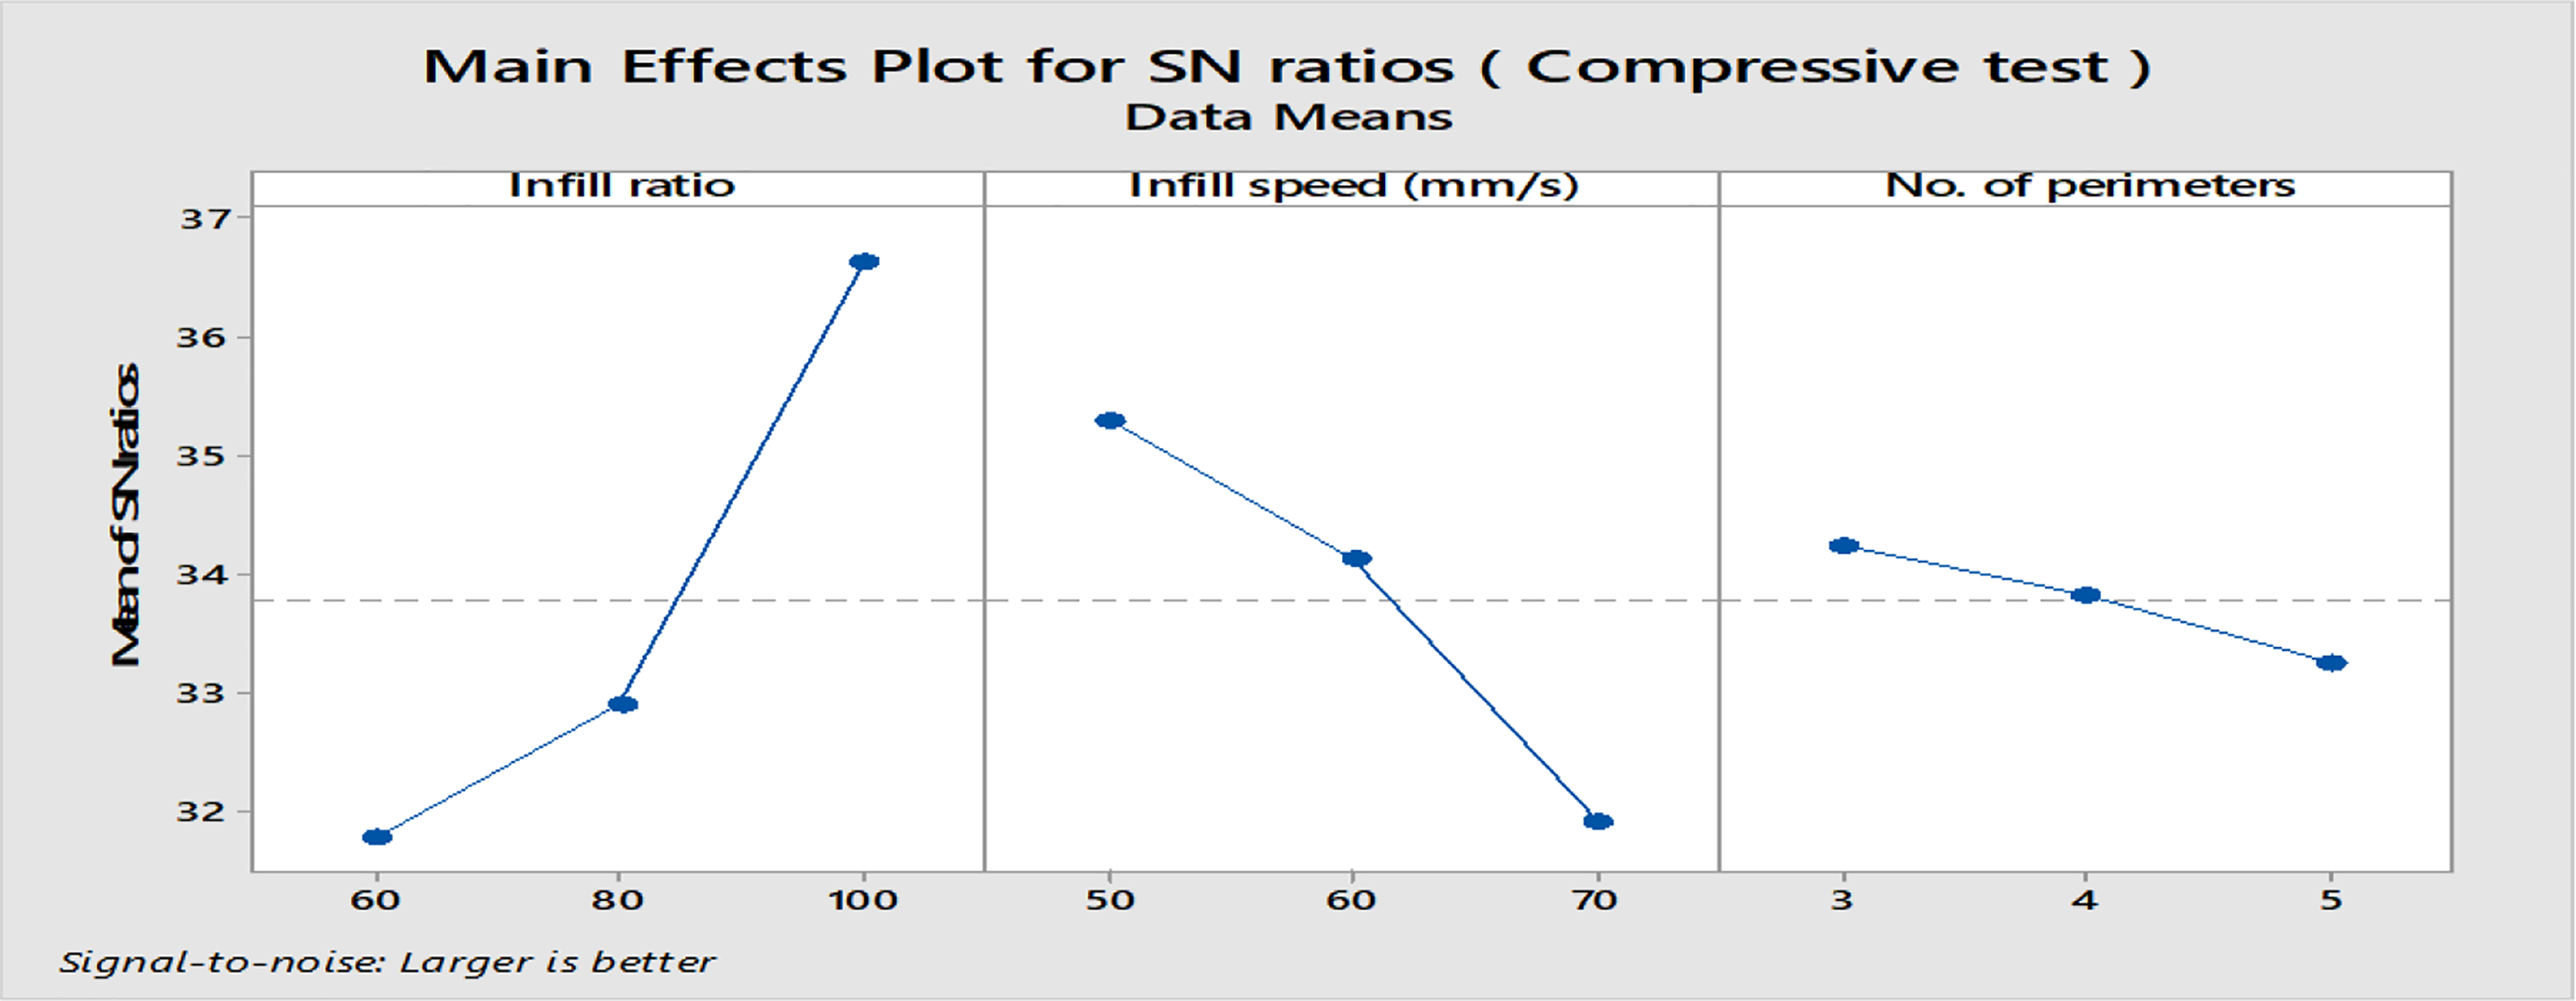
Main effects plot for S-N ratios (peak strength in compression test).
ANOVA for peak strength (compressive testing).
ANOVA: analysis of variance.
Influence of input variables (on peak strength in compression test)
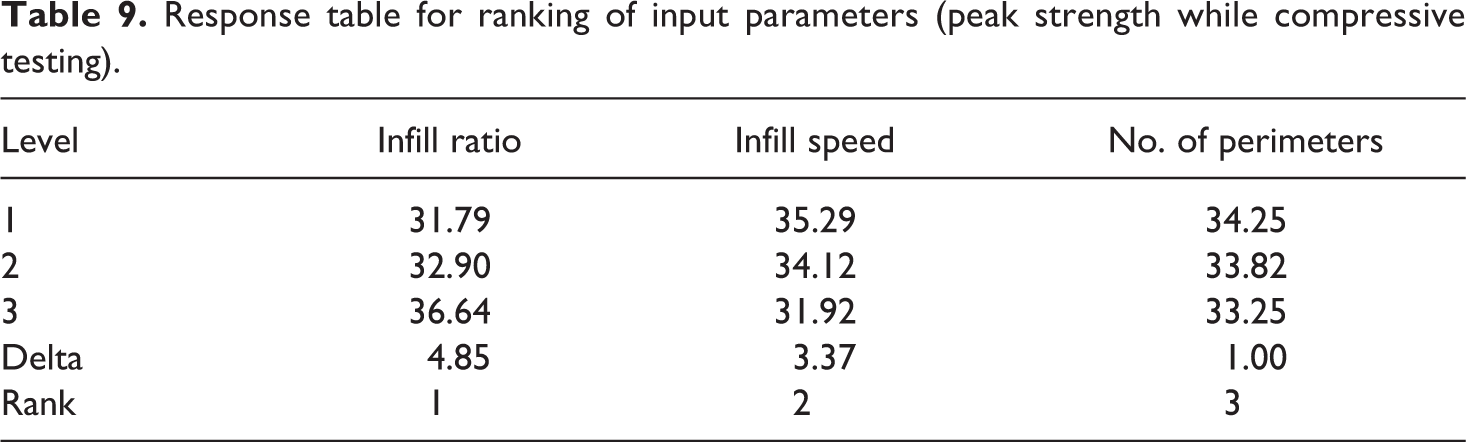
As shown in Figure 11, infill ratio 100%, infill speed is 50 mm s−1 and number of perimeters 3 are the best settings. The reason for high infill ratio is but obvious as this will lead to better packing factor; low infill speed and minimum number of perimeters may contribute for better spread of layers resulting into better compressive strength. The residual error comes out to be 3.28% which depicts a reasonable accuracy in predicted model. Further based upon Table 8, Table 9 shows the ranking of input parameters for compressive strength.
Response table for ranking of input parameters (peak strength while compressive testing).
Optimizing peak strength in compression test

where θ opt = optimum S-N ratio value (for peak strength in compression test), λ = overall average of S-N data, λ A3 = average of S-N data for infill ratio at level 3, λ B1 = average of S-N data for infill speed at level 1 and λ C1 = average of S-N data for no. of perimeters at level 1.

substituting the following values: λ = 33.78 dB, λ A3 = 36.64 dB, λ B1 = 35.29 dB, λ C1 = 34.25 dB:


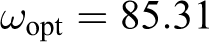

The confirmatory experiment was conducted as per proposed settings infill ratio is 100%, infill speed as 50 mm s−1 and number of perimeters 3 and experimental value for compressive strength achieved was 86.12 MPa which is very close to the predicted value.
Analysis of hardness in Shore D test
Based upon Table 5, Figure 12 and Table 10 respectively show main effect plot for S-N ratio hardness and ANOVA for percentage contribution.
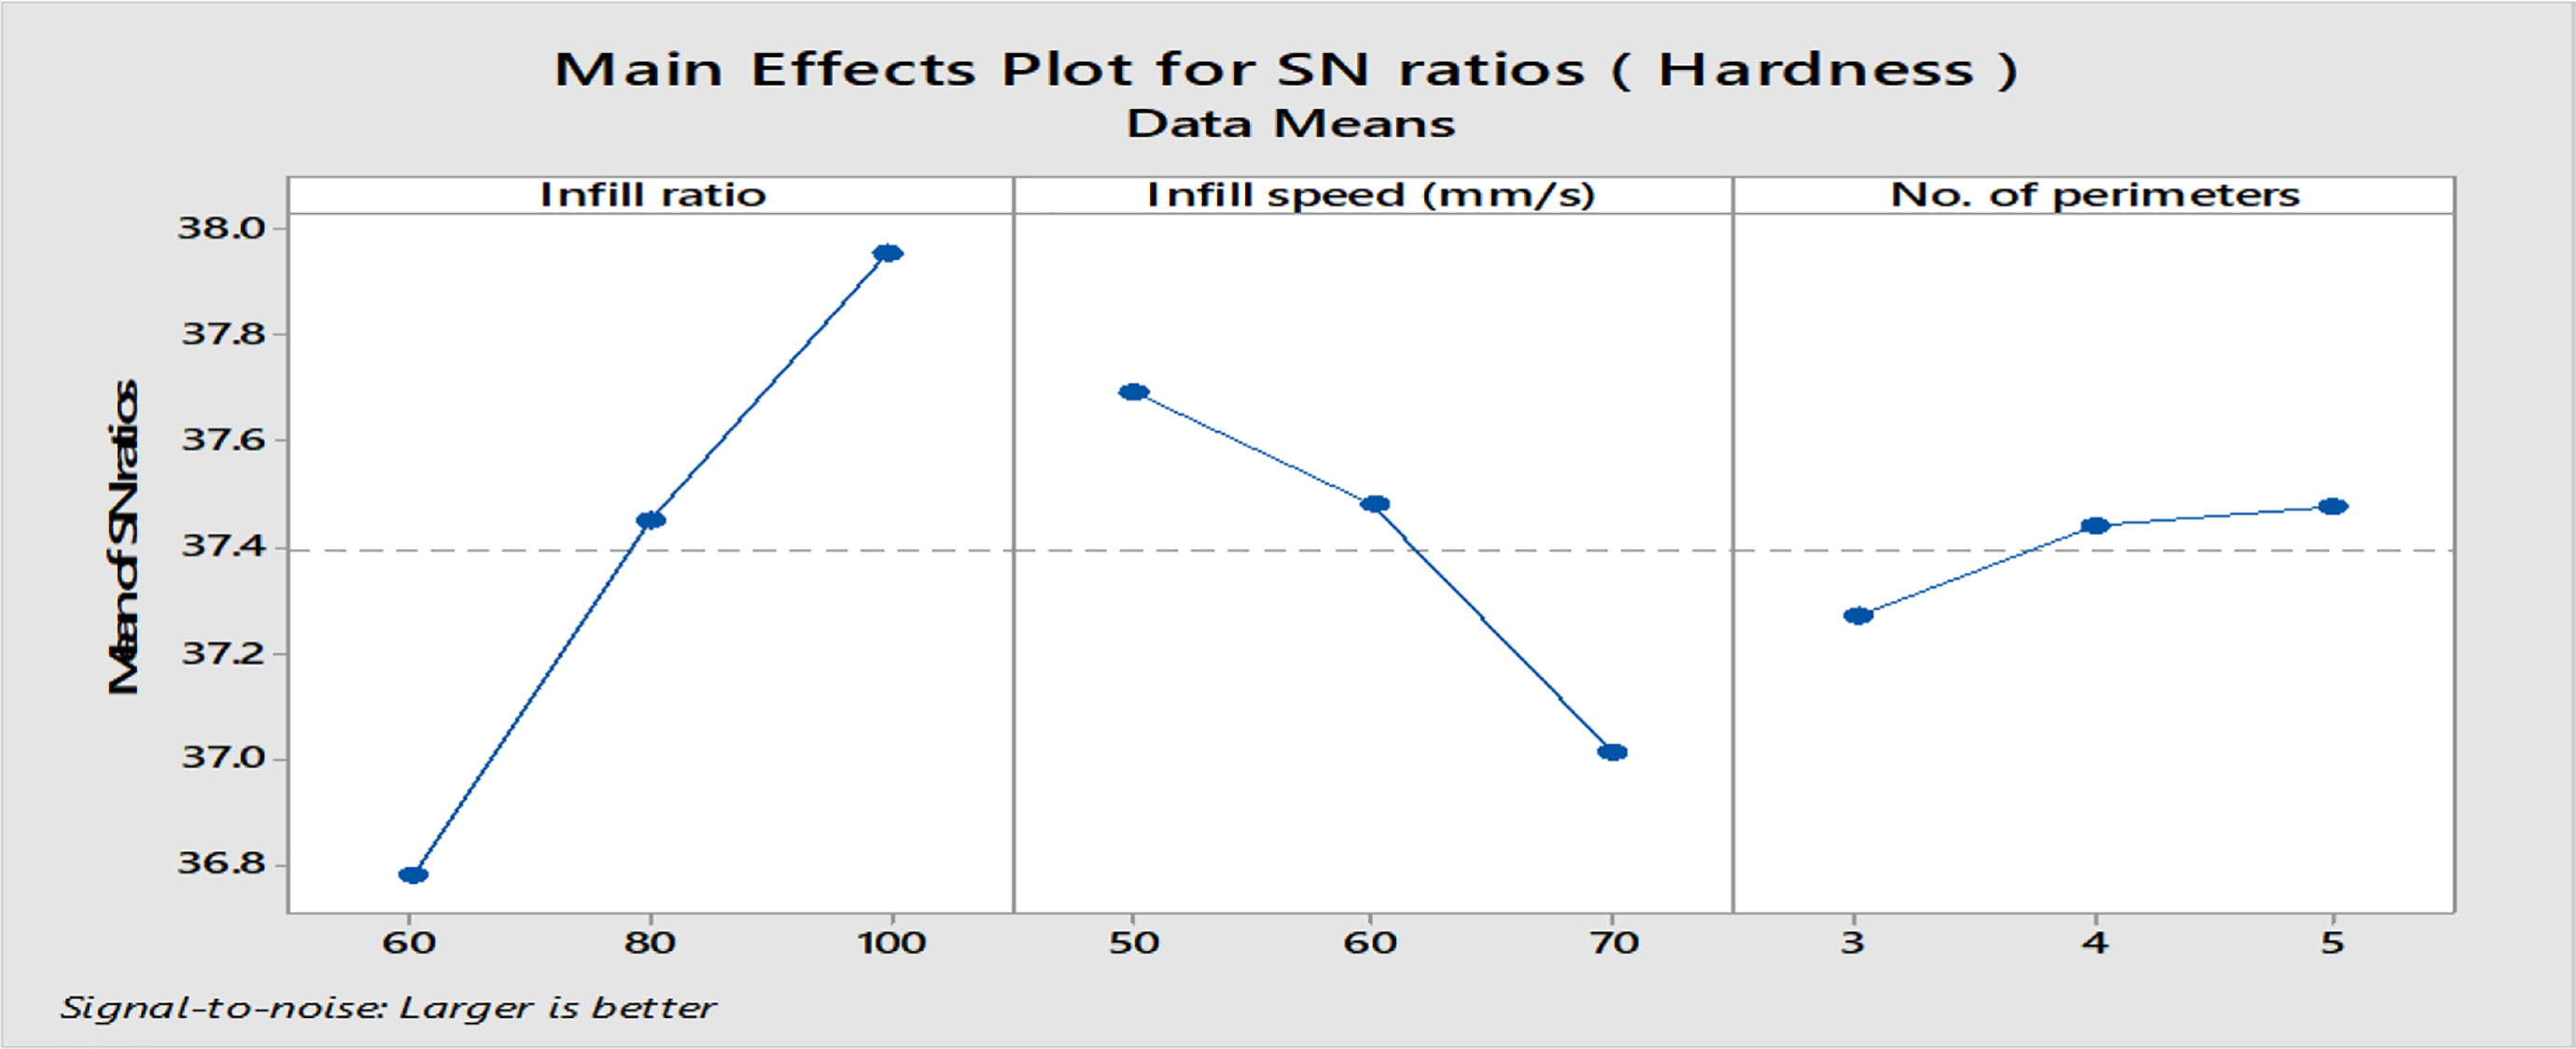
Main effects plot for S-N ratios (hardness in Shore D Test).
ANOVA for hardness.
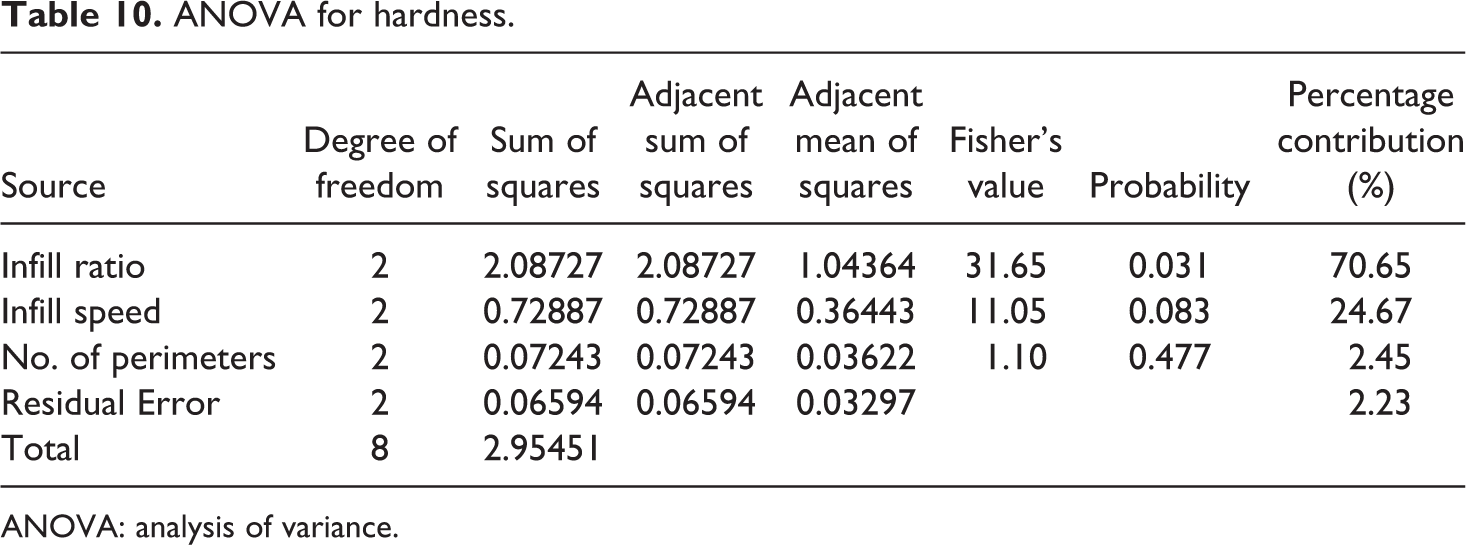
ANOVA: analysis of variance.
Influence of input variables (on hardness in Shore D test)
As shown in Figure 12, infill ratio 100%, infill speed 50 mm s−1 and number of perimeters 4 are the best settings. The reason for high infill ratio is but obvious as this will lead to better packing factor; low infill speed and highest number of perimeters may contribute for better spread of layers resulting into better hardness.
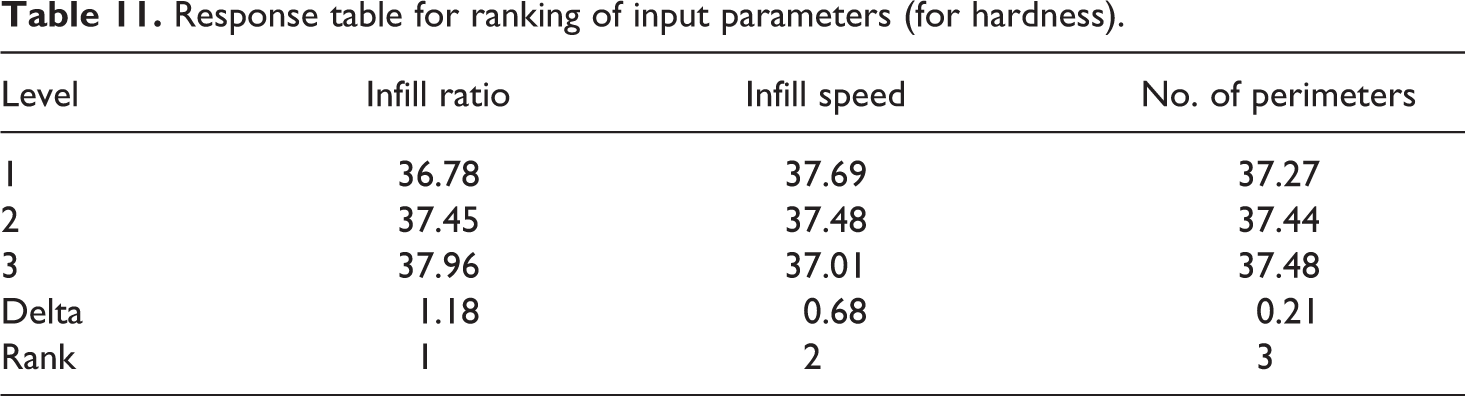
The residual error comes out to be 2.23% which depicts a reasonable accuracy in predicted model. Further based upon Table 10, Table 11 shows the ranking of input parameters for hardness.
Response table for ranking of input parameters (for hardness).
Optimizing hardness in Shore D test

where θ opt = optimum S-N ratio value (for Hardness in Shore D test), λ = overall average of S-N data, λ A3 = average of S-N data for infill ratio at level 3, λ B1 = average of S-N data for infill speed at level 1 and λ C3 = average of S-N data for no. of perimeters at level 3.

substituting the following values: λ = 37.39 dB, λ A3 = 37.96 dB, λ B1 = 37.69 dB, λ C3 = 37.48 dB:


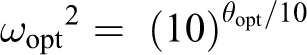

Optimum hardness in Shore D test = 82.70 Shore D
The experimental observed value at proposed settings is 81.6 (see sample no. 7, Table 5), which is very close to the predicted value.
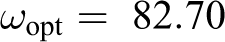
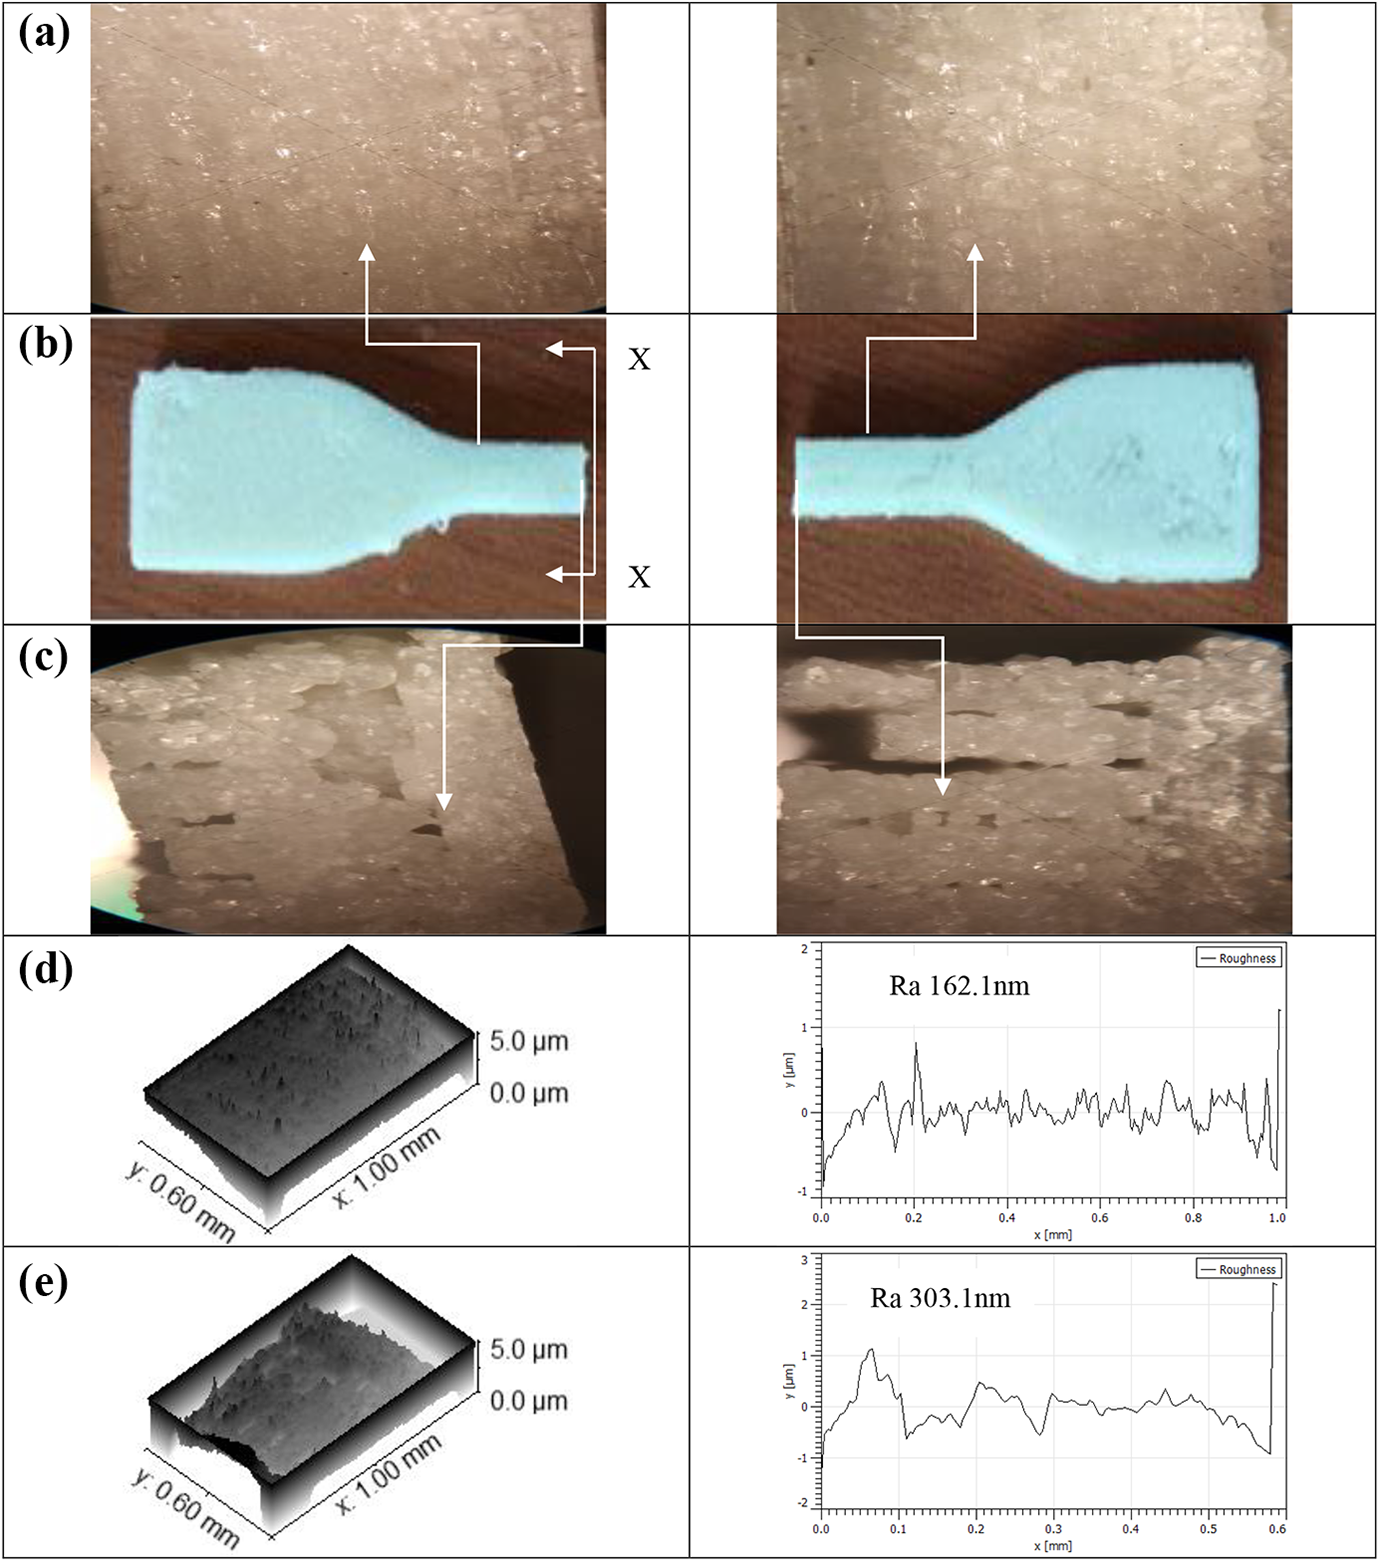
After parametric optimization it has been ascertained (from tensile, compressive and hardness observations, see Table 5), sample no. 7 has better mechanical properties and sample no. 3 posses poor one. For better understanding morphology of samples after destructive testing, photomicrographs were compared at 30× magnification (see Figures 13 to 15). As shown in Figure 13, photomicrograph at fractured surface shows less layer separation (as plucked surface) in comparison to Figure 14 where more layer separation and breakage was observed. However, on surface away from the fractured zone, layer deposition is still uniform. It has been observed that surface roughness (Ra) at cut-off length of 0.04 mm for section perpendicular to fractured zone as well as at fractured zone for sample no. 7 is less than sample no. 3, thus justifies the better topological features resulting into better mechanical properties. The same has been counter verified by 3D rendered images, which shows more uniform layer deposition in sample no. 7 as compared to sample no. 3.
Morphology of tensile sample no.7: (a) Section perpendicular to fractured zone, (b) 3D view of tensile specimen after fracture, (c) fractured zone, (d) 3D rendered image (surface topology) of section perpendicular to fractured zone and Ra profile and (e) 3D rendered image (surface topology) of fractured zone and Ra profile.
Morphology of tensile sample no. 3: (a) Section perpendicular to fractured zone, (b) 3D view of tensile specimen after fracture, (c) fractured zone, (d) 3D rendered image (surface topology) of section perpendicular to fractured zone and Ra profile and (e) 3D rendered image (surface topology) of fractured zone and Ra profile.
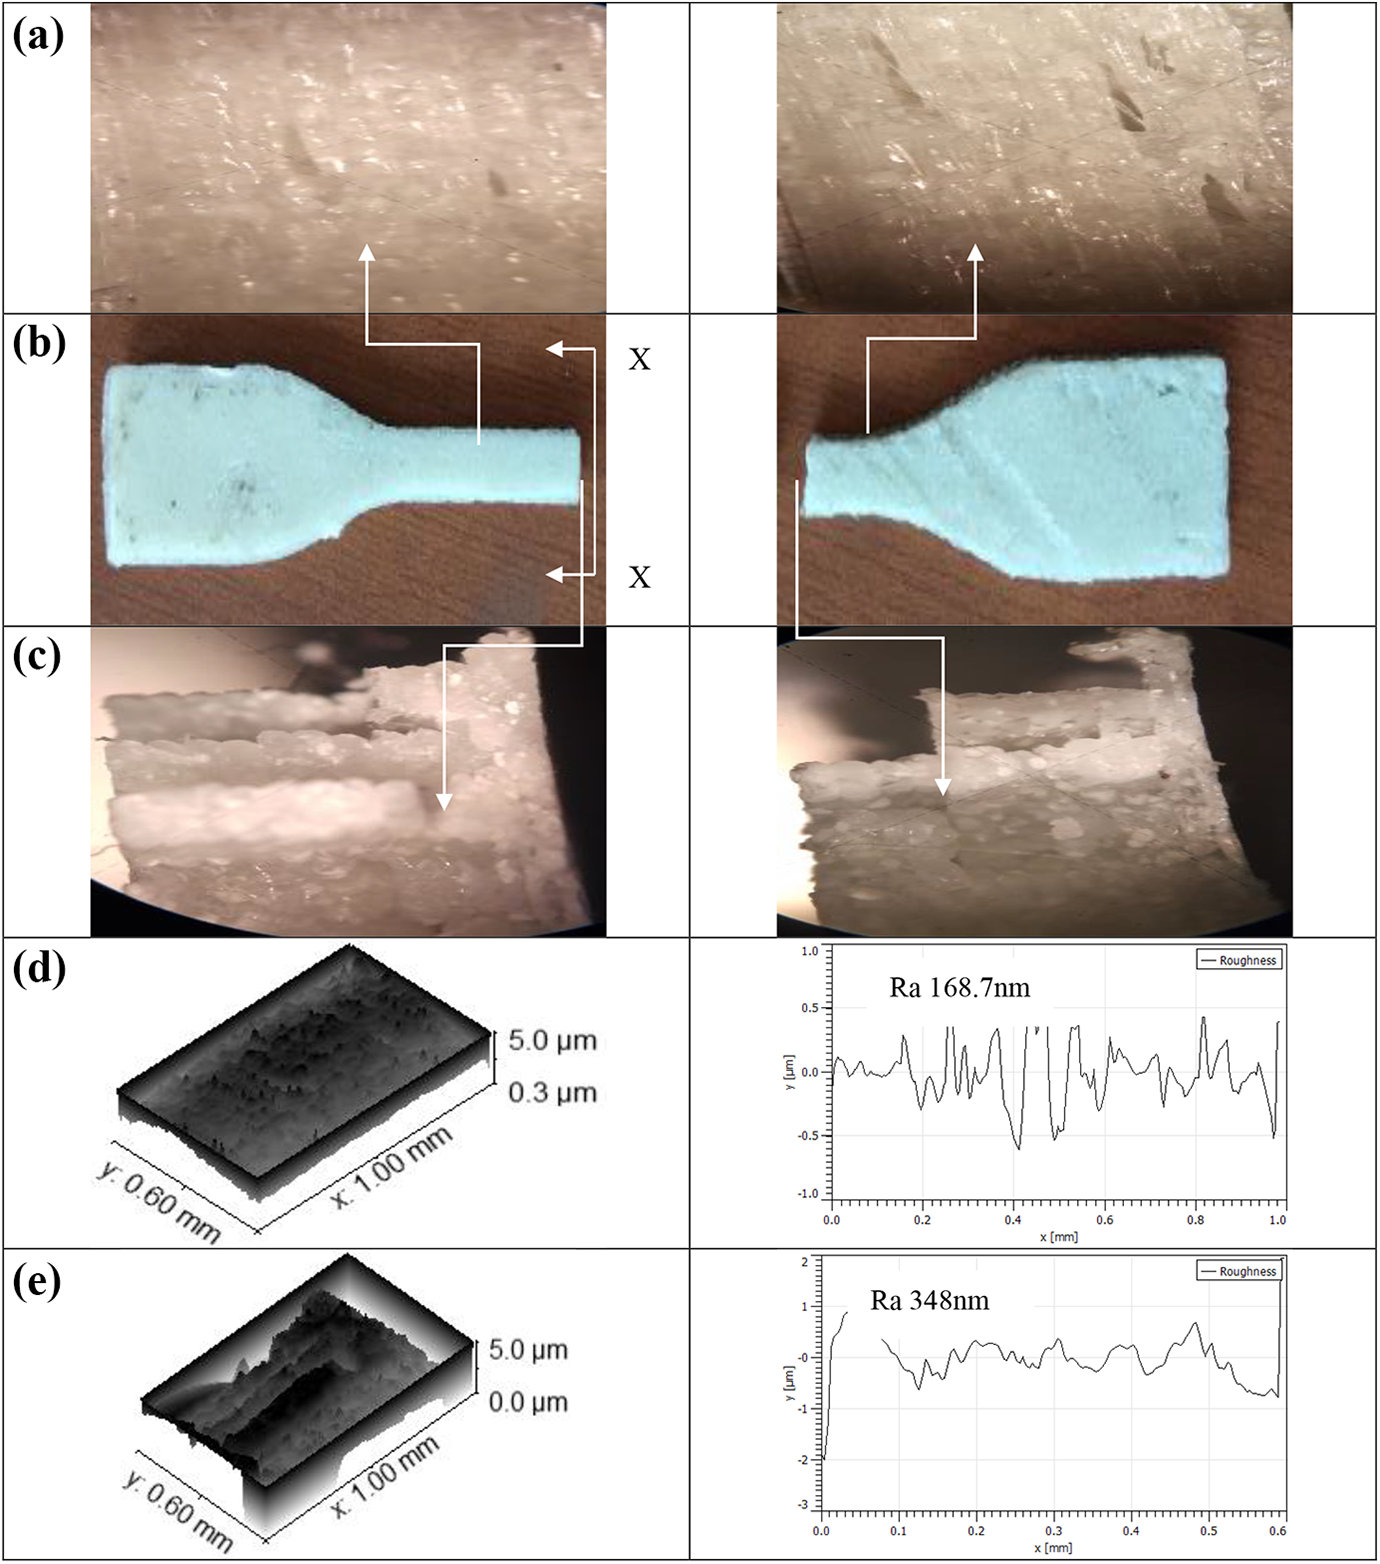
Morphology of compressive samples: (a) Top surface of sample no. 7, (b) top surface of sample no. 3, (c) 3D view of compressive specimens (sample no. 7 and sample no. 3) after fracture, (d) fractured zone of sample no. 7, (e) fractured zone of sample no. 3, (f) 3D rendered image (surface topology) of top and Ra profile of sample no. 7, (g) 3D rendered image (surface topology) of top and Ra profile of sample no. 3, (h) 3D rendered image (surface topology) of fractured zone and Ra profile of sample no. 7 and (i) 3D rendered image (surface topology) of fractured zone and Ra profile of sample no. 3.
Figure 15 shows change in morphological features while compressive testing. It has been observed that sample no. 7 has shown overlapping of deposited layers where as sample 3 resulted into air gaps thus contributing for poor compressive properties. The 3D rendered images captured through photomicrographs shows better layer distribution in sample no. 7 as compared to sample no. 3 (both at top surface and fractured zone). Also corresponding Ra values are lower for sample no. 7 in comparison to sample no. 3, thus justifies better mechanical strength while compressive testing for sample no. 7. These results are in line with the observations made by other investigators. 27 –34
Conclusions
Following conclusions may be drawn from the present study: The PLA-PEKK-HAp-CS composite has been successfully 3D printed with in-house prepared feedstock filament for tensile and compressive specimens (as per ASTM D638 type IV and ASTM D695). For optimizing tensile properties, the best settings are infill ratio is 100%, infill speed as 60 mm s−1 and number of perimeters is 4, whereas for compressive properties, the best settings are infill ratio is 100%, infill speed as 50 mm s−1 and number of perimeters is 3. As regards to hardness, infill ratio is 100%, infill speed as 50 mm s−1 and number of perimeters 5 are the best settings. The ANOVA analysis based predicted observations have been counter verified with confirmatory experiments and results are at 95% confidence level. As regards to the morphology is concerned at fractured surface/zone, layer plucking/pealing mechanism was prominent among successive layers to root up/splitting action, which was observed more in sample no. 3 as compared to sample no. 7.