
Abstract
The use of ferro/ferri/paramagnetic materials for self-assembly is quite common, but the use of superparamagnetic materials has not been explored for such applications. In the present study, polylactic acid (PLA) matrix has been reinforced with polyvinyl chloride (PVC), wood dust, and Fe3O4 particles (as superparamagnetic material) with twin screw extrusion (TSE) for the preparation of fused deposition modeling feedstock filament. The filament was tested for magnetic and mechanical properties whose results were analyzed and optimized for TSE parameters, and the regression model was used to find the effect of input parameters. The results of study suggest that the proportion as PLA 52.5 wt%, Fe3O4 25 wt%, PVC 15 wt%, and wood dust 7.5 wt% with TSE torque of 0.12 Nm, screw temperature of 165°C, and load of 5 kg are the optimized condition for the magnetization property. From vibration sample magnetometer analysis, it has been observed that all the samples having Fe3O4 in the matrix are of superparamagnetic character. Further, the magnetic and mechanical properties are not in correlation with each other for the blended samples which were counter verified by scanning electron microscopy and energy-dispersive spectroscopy analysis.
Keywords
Introduction
Polylactic acid (PLA) is a biodegradable thermoplastic polymer which has been widely used with various reinforcements for different applications. In the past, magnetic microspheres of PLA in different ratios have been prepared by chemical (emulsion solvent extraction) method. The particles were tested for biodegradability and it has been found that these magnetic microspheres were hemocompatible. Further, when large percentage (up to 60%) of magnetite was mixed chemically with PLA, there was an agglomeration of magnetite which was not good for composite mixture, and 40% of magnetite in the composite mixture was found optimum.
1
PLA coated with magnetite powder (30 wt%) is biocompatible, as researchers have found that magnetic and nonmagnetic microspheres led to equal growth of cell when tested for cell growth assay through in vitro and in vivo analyses.
2
PLA polymer coated with magnetite powder composite has been prepared for magnetic field responsiveness and for efficient drug delivery system. A comparative analysis of surface property, structure, and chemical nature has been performed to know the effectiveness of the prepared composite, and it has been found that the prepared composite behaves intermediate of the parent material in terms of chemical nature, such as electrophoresis value and surface thermodynamic property (surface free energy).
3
Study reveals that maximum 40 wt% of magnetite can be added to the polymer matrix with a chemically established method, such as emulsification and mini-emulsion polymerization. Weight ratio plays a vital role in administering the magnetite content in magnetic polymer latex.
4
Polyurethane polymer, which holds shape memory property, has been reinforced with magnetite powder up to 40 wt% and has been tested for magnetic, thermal, and electrical properties. Results have shown that electrical resistivity is in negative relation with magnetite concentration whereas thermal conductivity is in positive relation. Shape recovery time also got increased (approximately 4 min) with the reinforcement.
5
The polyethylene-co-vinyl acetate (EVA) reinforced with Fe3O4 by two-layer compress molding shows improvement in hardness, but reduction in strength at break and elongation at break. The composite has shown good flame resistance also. Moreover, the composite was thermally stable.
6
Composite of poly(methacrylic acid) reinforced with magnetite powder has been tested for its characteristics, such as magnetic properties and chemical bondage, using various techniques, such as transmission electron microscopy (TEM), X-ray diffraction (XRD), and vibration sample magnetometer (VSM) testing, and it has been found that the prepared composite holds lattice constant (by XRD) value of 0.838, which means the sample is magnetic as this value is close to the lattice value of magnetite (0.839) and particles occupied nearly spherical shape (TEM results) and magnetic moment (VSM results) of composite particle was 40 emu/gm.
7
A low-cost three-dimensional (3-D) printer is used to examine mechanical properties of PLA printed with different settings of printing parameters, such as varying layer numbers, nozzle angle, and build orientation. The feed rate of 3-D printer affects the mechanical strength and behavior which signifies that mechanical nature of printed parts is straight forward depends on the thickness of the layer and is inversely proportional to the feed rate.
8
Researchers have shown that printed PLA parts using fused deposition modeling (FDM) shows the ultimate tensile strength (UTS) of 42.28–53.59 MPa, and modulus of elasticity varies from 2799.43–3497.63 MPa.
9
PLA when reinforced with nanoclay (cloisite C30B) (1–5% by weight) and nanocellulose (1–5% by weight) exhibits excellent barrier properties which are necessary for food packaging application. Thus, PLA being a biocompatible polymer can easily be used for food packaging industry when a suitable nanoclay and cellulose nanofibers are mixed in the matrix of PLA. This PLA hybrid material reduces 90% of oxygen transmission rate and 70% of water vapor transmission rate, thus showing excellent barrier properties with biocompatibility
10
Different concentrations of chitin (1–20%) in addition of PLA-based matrix by using solvent casting method and laminated composite of chitin-based PLA (LCP) using the hot press method show the excellent biocompatibility and open biomedical application for such composites, such as bone and dental implants. At 500°C, thermogravimetric analysis shows that chitin gets 100% of degradation, PLA sheet gets 95% of degradation, 5% chitin-based PLA parts get 87% of degradation, and LCP made via hot press method gets 97% of degradation. LCP polymer composite shows ductility of 25 MPa, which is greater than the pure PLA (18 MPa).
11
PLA reinforced with magnetite powder and polyethylene glycol (PEG) has been tested for drug delivery application and it has been found that drug loading and efficiency of encapsulation were higher with the increase in magnetite and PEG contents in the composite. The magnetite nanoparticles prepared by coprecipitation method were tested for crystal structure and magnetic properties. Magnetite was mixed from 5% to 25% in the PLA composite matrix and it has been found that sample containing 25% of magnetite has shown the maximum magnetization and sample with 5% of magnetite was poor in magnetization.
12
PLA composite reinforced with polylactid-co-glycolic acid (PLGA) and interferon α-2B has shown potential for efficient drug delivery application. Researchers have reinforced 10–30% of Fe3O4 for this purpose and it has been found that PLGA microspheres have shown better magnetization than PLA, and 20% reinforcement of magnetite have shown best results and almost required properties have been obtained with this percentage reinforcement.
13
Polyvinyl alcohol reinforced with magnetite powder have shown changes in the crystal, magnetic, and chemical structure when irradiated. It has also been found that polymeric composite having magnetite in matrix was of superparamagnetic nature; no coercivity and retentivity have been shown by resulted polymer composite. XRD results of samples have shown that magnetite particles were of spherical shape distributed all over the surface and agglomeration of particles was absent.
14
Magnetite particles prepared with different methods have a critical impact on the magnetic properties. Magnetite particle prepared with coprecipitation and hydrolysis methods has shown different magnetic ranges which clearly indicated that the preparation of magnetite particles could have an important role to play in required property range. Polyvinylidene fluoride reinforced with magnetite particles has shown that with an increase of the magnetite content in the matrix, magnetic properties get improved. Hydrolysis method has shown better magnetization of magnetite particles in comparison to the coprecipitation method.
15
PLA reinforced with rayon (viscose) fibers by the process of filament winding for hollow structure and by stacking of films method enhances the mechanical properties specifically break elongation and improves the mechanical strength of fibers. Thus, PLA reinforced with rayon fibers can be used for textile application.
16
PLA-based matrix reinforcement with Posidonia oceanic (PO), a seagrass, reduces the mechanical properties, such as flexural and tensile strength, but flexural and tensile modulus are positively related with reinforcement.
17
PLA when reinforced with plasticizers, nanocellulose, and cellulose nanocrystal gives high break elongation which is necessary for food packaging application. Pure PLA has large size of spherulites, while the composite has less sized spherulites which give better nucleation and better density of crystal, thus showing better break elongation.
18
The PLA matrix when reinforced and coated with natural fibers of sisal and with the resin of polyester gives enhancement in strength at break, flexural strength, and modulus of flexural strength.
19
Polycaprolactone (PCL/PLA), when reinforced with hydroxyapatite (HAp) of nanosize, increases the thermal response of composite at 55°C. Thermal response means the smart material can be actuated by temperature and the part can be coded for any mid shape from which it can acquire its original shape when the same temperature is given at some point of time which is suitable for food packaging as well as biomedical industrial application as the smart material is biodegradable.
20
The PLA matrix, when reinforced with ethylene-co-vinyl acetate the composite obtained, is thermally stable. Damping parameter of the composite is enhanced and there is a small increase in viscosity and modulus of storage of composite. The miscibility of PLA and ethylene-co-vinyl acetate is not good but testing results has shown that PLA and ethylene-co-vinyl acetate particles slightly interact with each other.
21
FDM parameters, such as infill percentage, layer thickness, and infill speed, play a vital role in printed material property. polyvinyl chloride (PVC)/polypropylene (PP)/HAp composite printed using the FDM technology has shown that printing parameters have important effect on mechanical properties, such as elongation at break, strength at break, and peak elongation.
22
PVC/PP/HAp/chitosan composite is biocompatible thermoplastic which can be used in medical applications. The mechanical properties of PVC/PP/HAp/chitosan composite depend over the parametric set of conditions of extrusion. It has been found that 200°C screw temperature (ST), 20 kg load, and 50 r/min of screw rotations are the best conditions of extrusion.
23
PLA when reinforced with nanosize HAp particles decreases the melt flow index as well as other mechanical properties, such as elongation, break strength, and ultimate strength. Further, 3-D printed part is treated externally with vapor smoothing process which improves 80–87% surface finish of printed part.
24
Polyamide 6 (PA6) can be recycled with good mechanical properties by recycling it with twin screw extrusion (TSE) and thus recycled PA6 can be further used with good mechanical strength. Parametric optimization of TSE was reported in this research, which gives the best setting of TSE for recycling the PA6 polymer.
25
Poly (
From the literature survey, it has been figured out that the polymer composite containing magnetic particles has not been fully explored in 3-D printing for self-assembly applications (especially for superparamagnetic materials). Therefore in the present work, an effort has been made to prepare magnetic feedstock filament for FDM and the optimization of magnetic properties has been performed to get the best conditions for extrusion. For this study, the PLA matrix has been reinforced with PVC, wood dust, and Fe3O4 particles (as superparamagnetic material) with TSE for the preparation of FDM feedstock filament. It should be noted that the PVC has been reinforced into the PLA matrix for improving the flowability, wood dust for controlling heat dissipation rate, and Fe3O4 particles for enhancing the self-assembly characteristics. The major advantage of the present work lies in the development of magneto-sensitive polymeric feedstock filament for 3-D printing in nonstructural application. The filament was tested for magnetic and mechanical properties whose results were analyzed and optimized for TSE parameters and the regression model was used to find the effect of input parameters. The VSM, scanning electron microscopy (SEM), energy-dispersive spectroscopy (EDS), shore D hardness, and porosity testing have been performed to conceptualize the relation between input parameters and output results with analysis of variance (ANOVA) and regression analysis.
Materials
The reported literature reveals that the PLA polymer can behave as smart material when reinforced with some suitable polymer or metal powder. In this present work, PLA was reinforced with Fe3O4 powder, commercially known as magnetite (of 44 μm size), wood dust collected from woodworking industry (available locally), and flexible PVC purchased from the local market. Wood dust collected was of big size, so sieve shaker was used to segregate particle of 50 μm. Table 1 represents the mechanical properties of PLA and PVC used in the present study. 34 –37
Properties of the pure PLA.
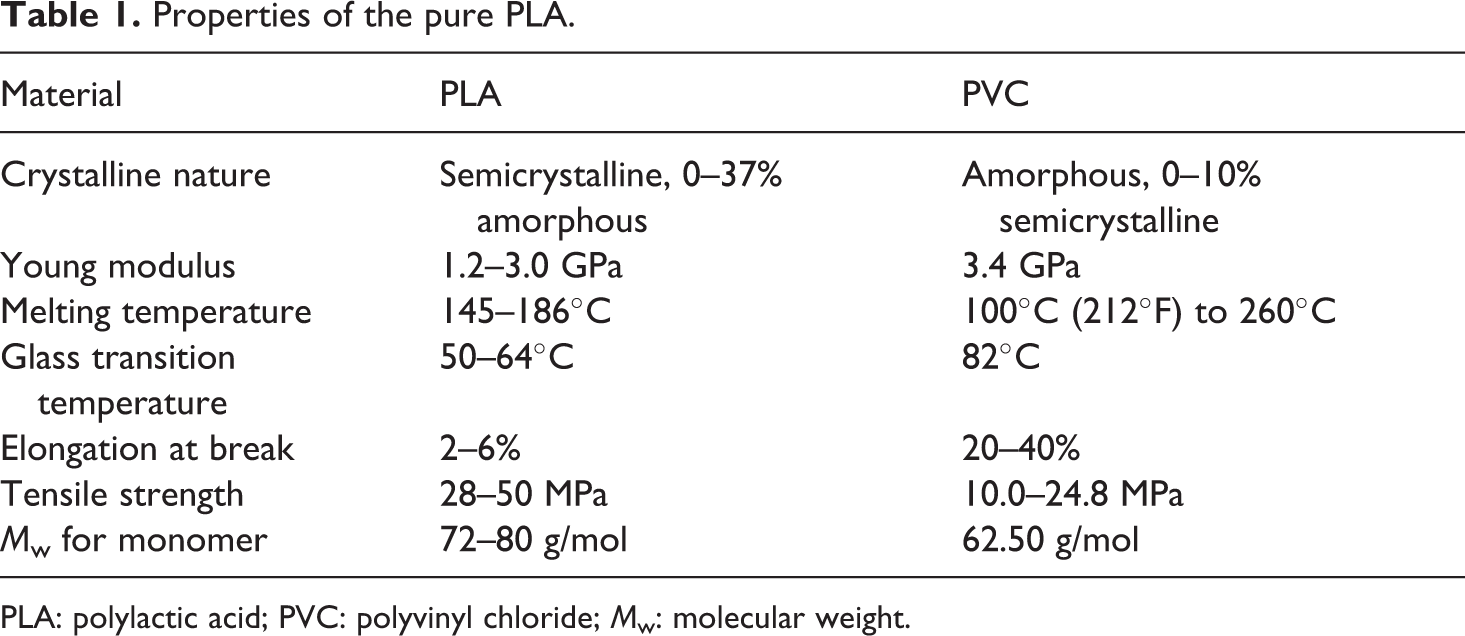
PLA: polylactic acid; PVC: polyvinyl chloride; Mw: molecular weight.
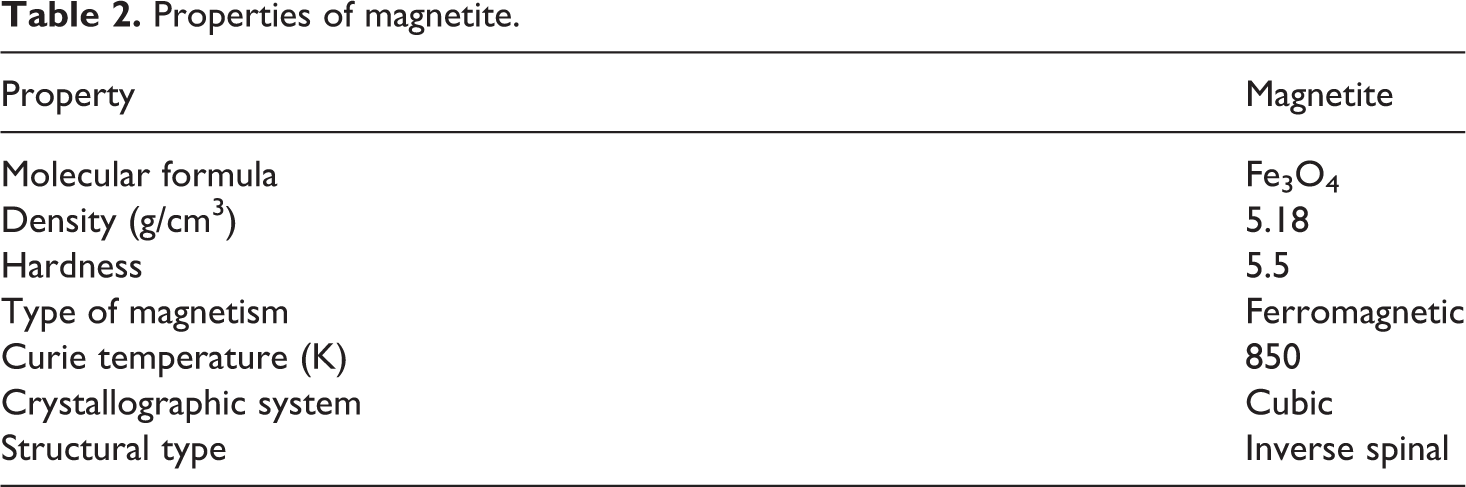
Table 2 shows the nature and properties of magnetite powder which is used for the research purpose. 38,39
Properties of magnetite.
Experimentation
Figure 1 shows the methodology adopted for the present research work.
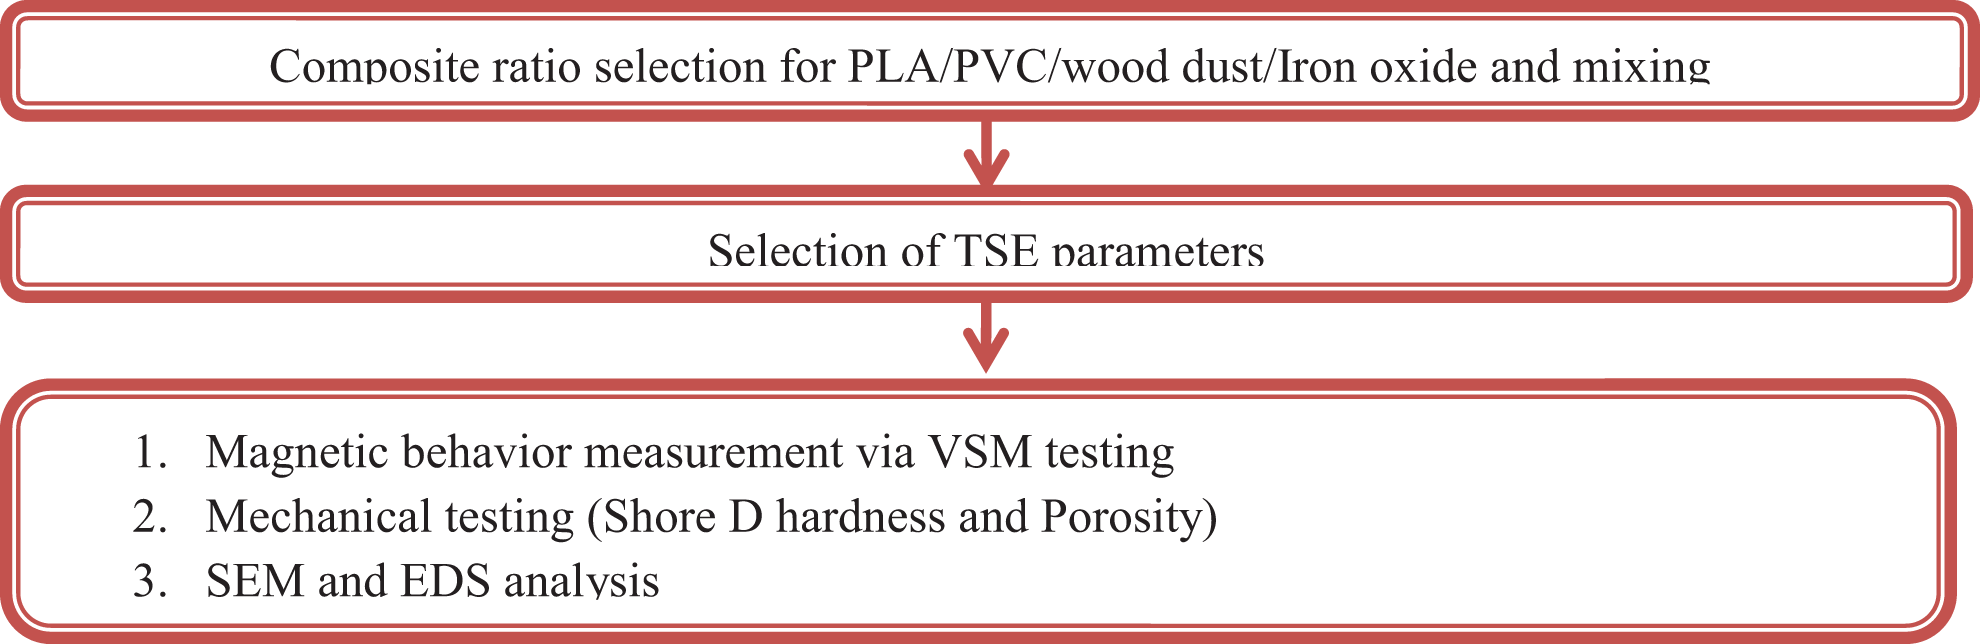
Methodology adopted for feedstock development.
PLA, PVC, wood dust, and magnetite powder were mixed mechanically and trials were performed on TSE machine for the feedstock development. Three compositions of polymers and reinforcement were prepared for sample runs. By changing the parametric conditions of TSE, Taguchi-based L18 orthogonal array (OA) approach has been adopted as the design of experiment technique, so that behavior of changing input conditions can be analyzed.
Blending of PLA/PVC/wood dust/ and Fe3O4 powder
From the literature survey, it has been observed that Fe3O4 up to 30 wt% has given the optimum results for magnetic property and large amount of Fe3O4 in composite has shown agglomeration of magnetite particles, whereas wood powder is voluminous in nature and the addition of wood powder above 10 wt% was difficult, and PVC being a polymer may be added into the matrix of PLA without any difficult. So considering these constraints, PLA has been taken as the base matrix and the other three were taken as reinforcement in the base matrix of PLA. PVC from 5–25 wt%, Fe3O4 from 5% to 25%, and wood powder from 0% to 10% have been varied in the base matrix for the investigation of these ratios on magnetic property. Table 3 shows the composition/proportion of composites which were selected for the trail run of TSE.
Composition of composite selected for the extrusion.
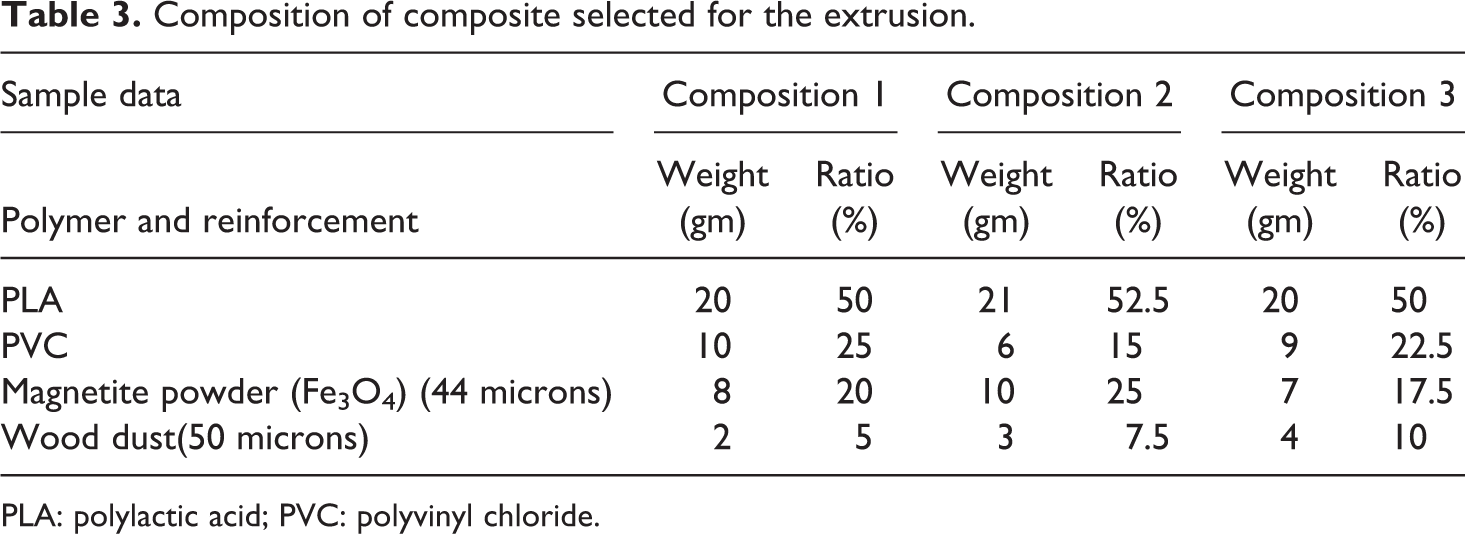
PLA: polylactic acid; PVC: polyvinyl chloride.
TSE of composite polymer
Once the mechanical mixing of PLA/PVC/wood dust/magnetite powder was over, the selected three compositions were processed on TSE machine with varying the running conditions of TSE. Table 4 shows the parametric condition of twin screw extruder which was selected for the present research work. Trails were performed on these conditions and uniform conditions were obtained, and feedstock filaments were successfully obtained with these sets of conditions. Table 5 shows the L18 OA for input parameters (based on Table 4).
Selected parametric conditions of TSE.
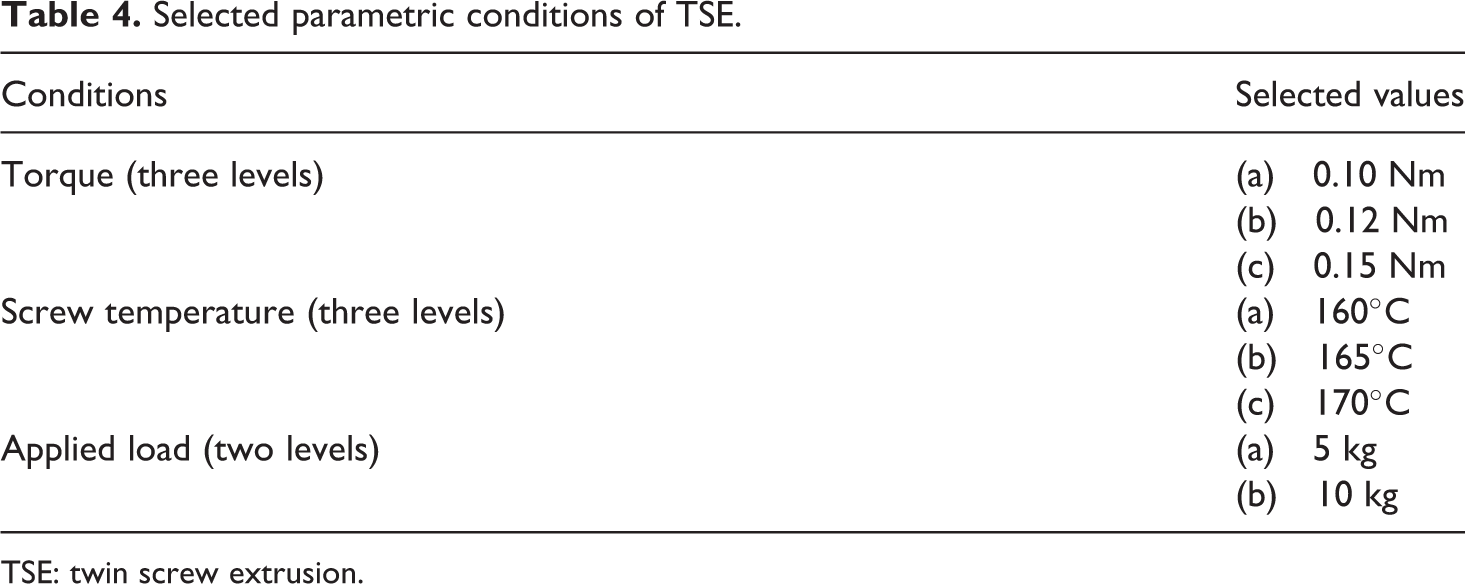
TSE: twin screw extrusion.
DOE used for extrusion.
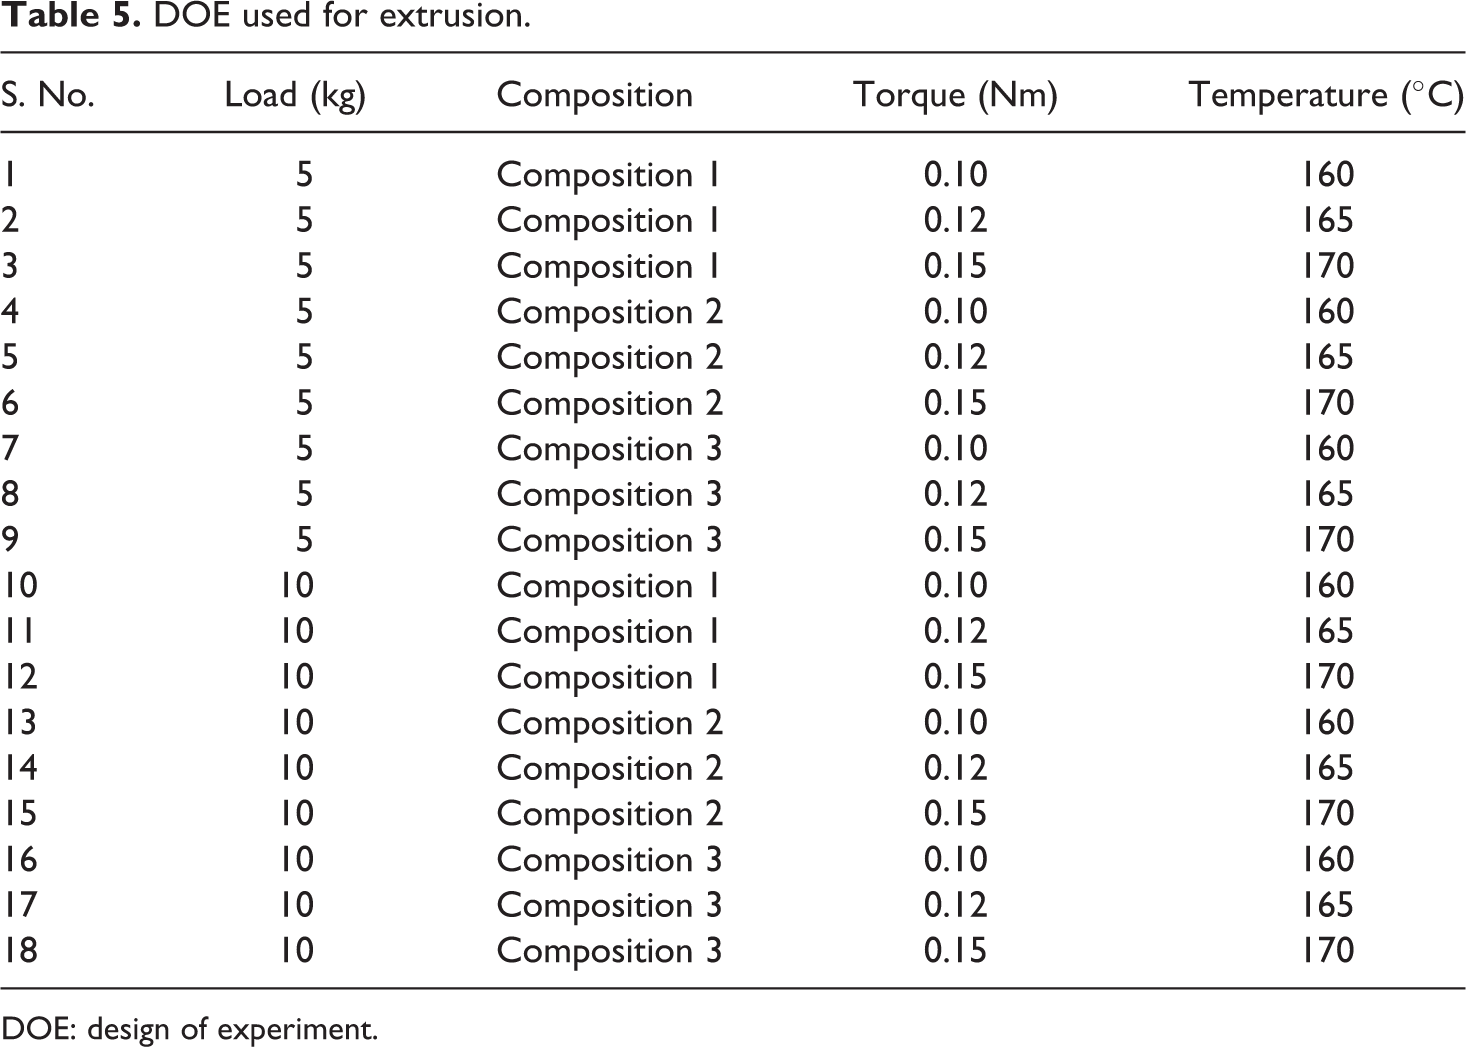
DOE: design of experiment.
Vibration sample magnetometer testing
All 18 samples of wires, which were prepared by TSE, were tested for their magnetic properties with VSM (Lakeshore 7404 VSM) by giving it an external applied field of 1 Tesla. Optimization of magnetic properties, such as magnetization, coercivity, and retentivity, was performed so that optimized extrusion conditions can be obtained for maximum is a better case for all the properties.
Result and discussion
VSM analysis
Table 6 provides results of magnetic properties which were obtained from VSM testing. Magnetization, coercivity, and retentivity were taken as important properties for any magnetic sample; therefore, only these properties were used for the optimization of extrusion condition. Figure 2 shows the hysteresis loop for the best and the worst samples, which are samples 2 and 8, respectively, which clearly shows that the samples obtained by extrusion behave as magnetic material, but very fewer retentivity values are obtained which clearly show that the samples were of superparamagnetic characteristics. As observed from Figure 2, sample 2 possesses the maximum value of magnetization (0.2283 emu) and sample 8 with the least magnetization value (0.1524 emu). All of the samples which were tested for VSM had 0.00785 gm of weight, so for standard units for moment (emu/gm); magnetization can be divided with a unit weight of the sample. On performing the calculation of moment (emu/gm), it has been found that the maximum value of moment comes out to be for the second sample which is 28.66 emu/gm and the lowest magnetization was for eighth sample which was 19.40 emu/gm. It has been found that there is a 31.35% decrease in magnetization for eighth extrusion condition.
Magnetic properties value table.
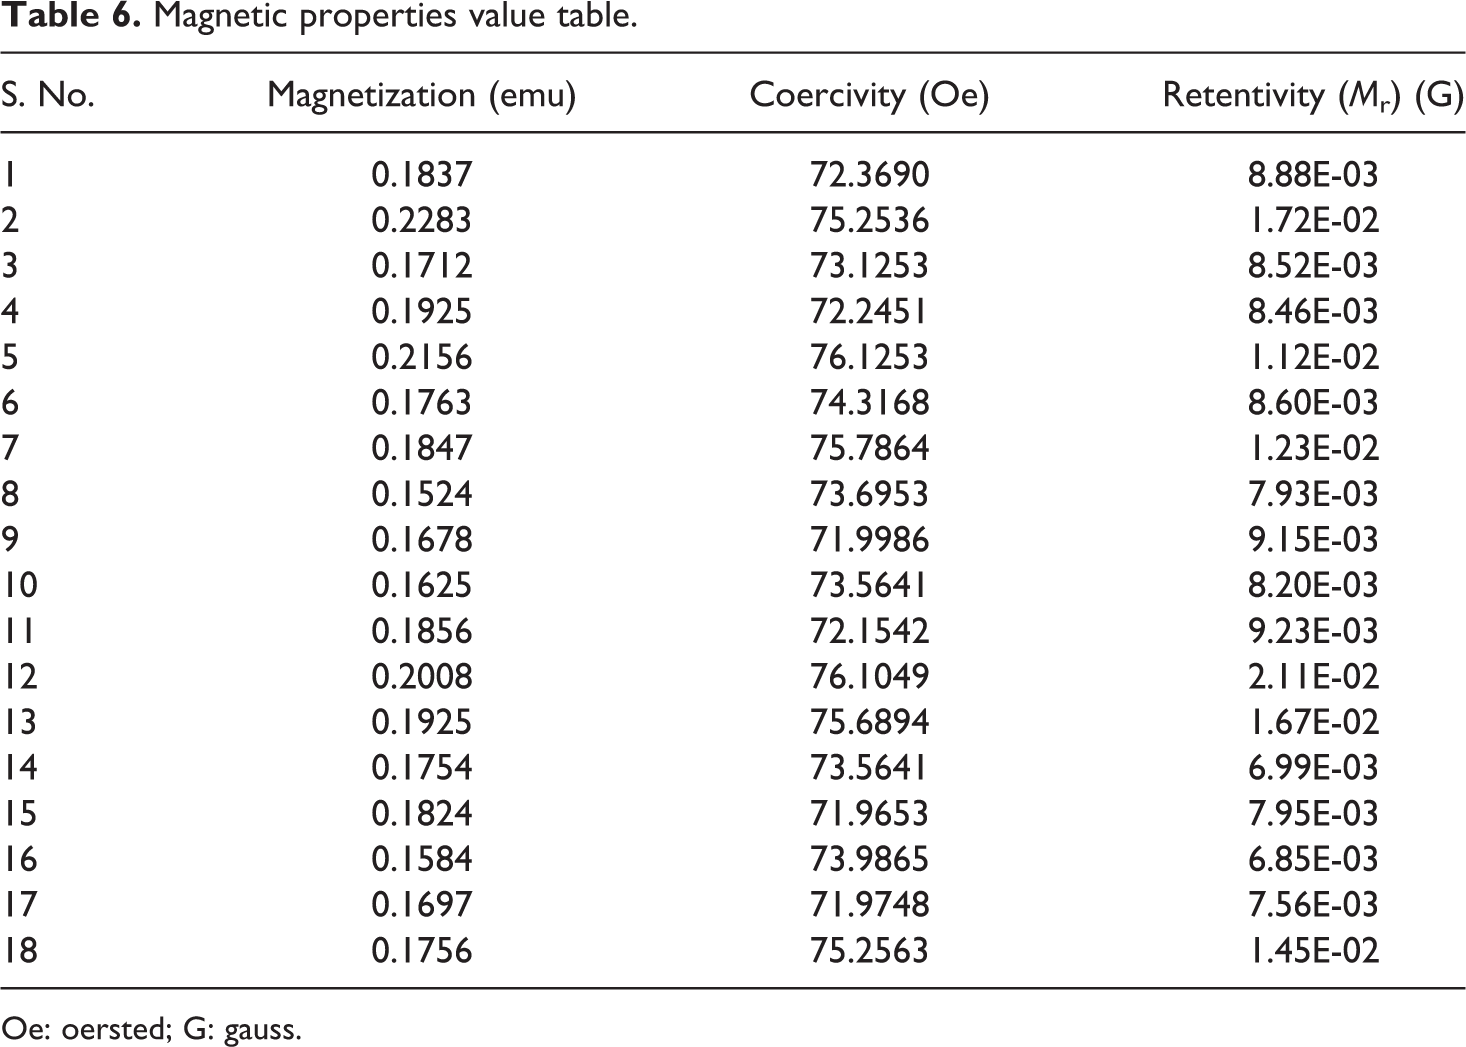
Oe: oersted; G: gauss.
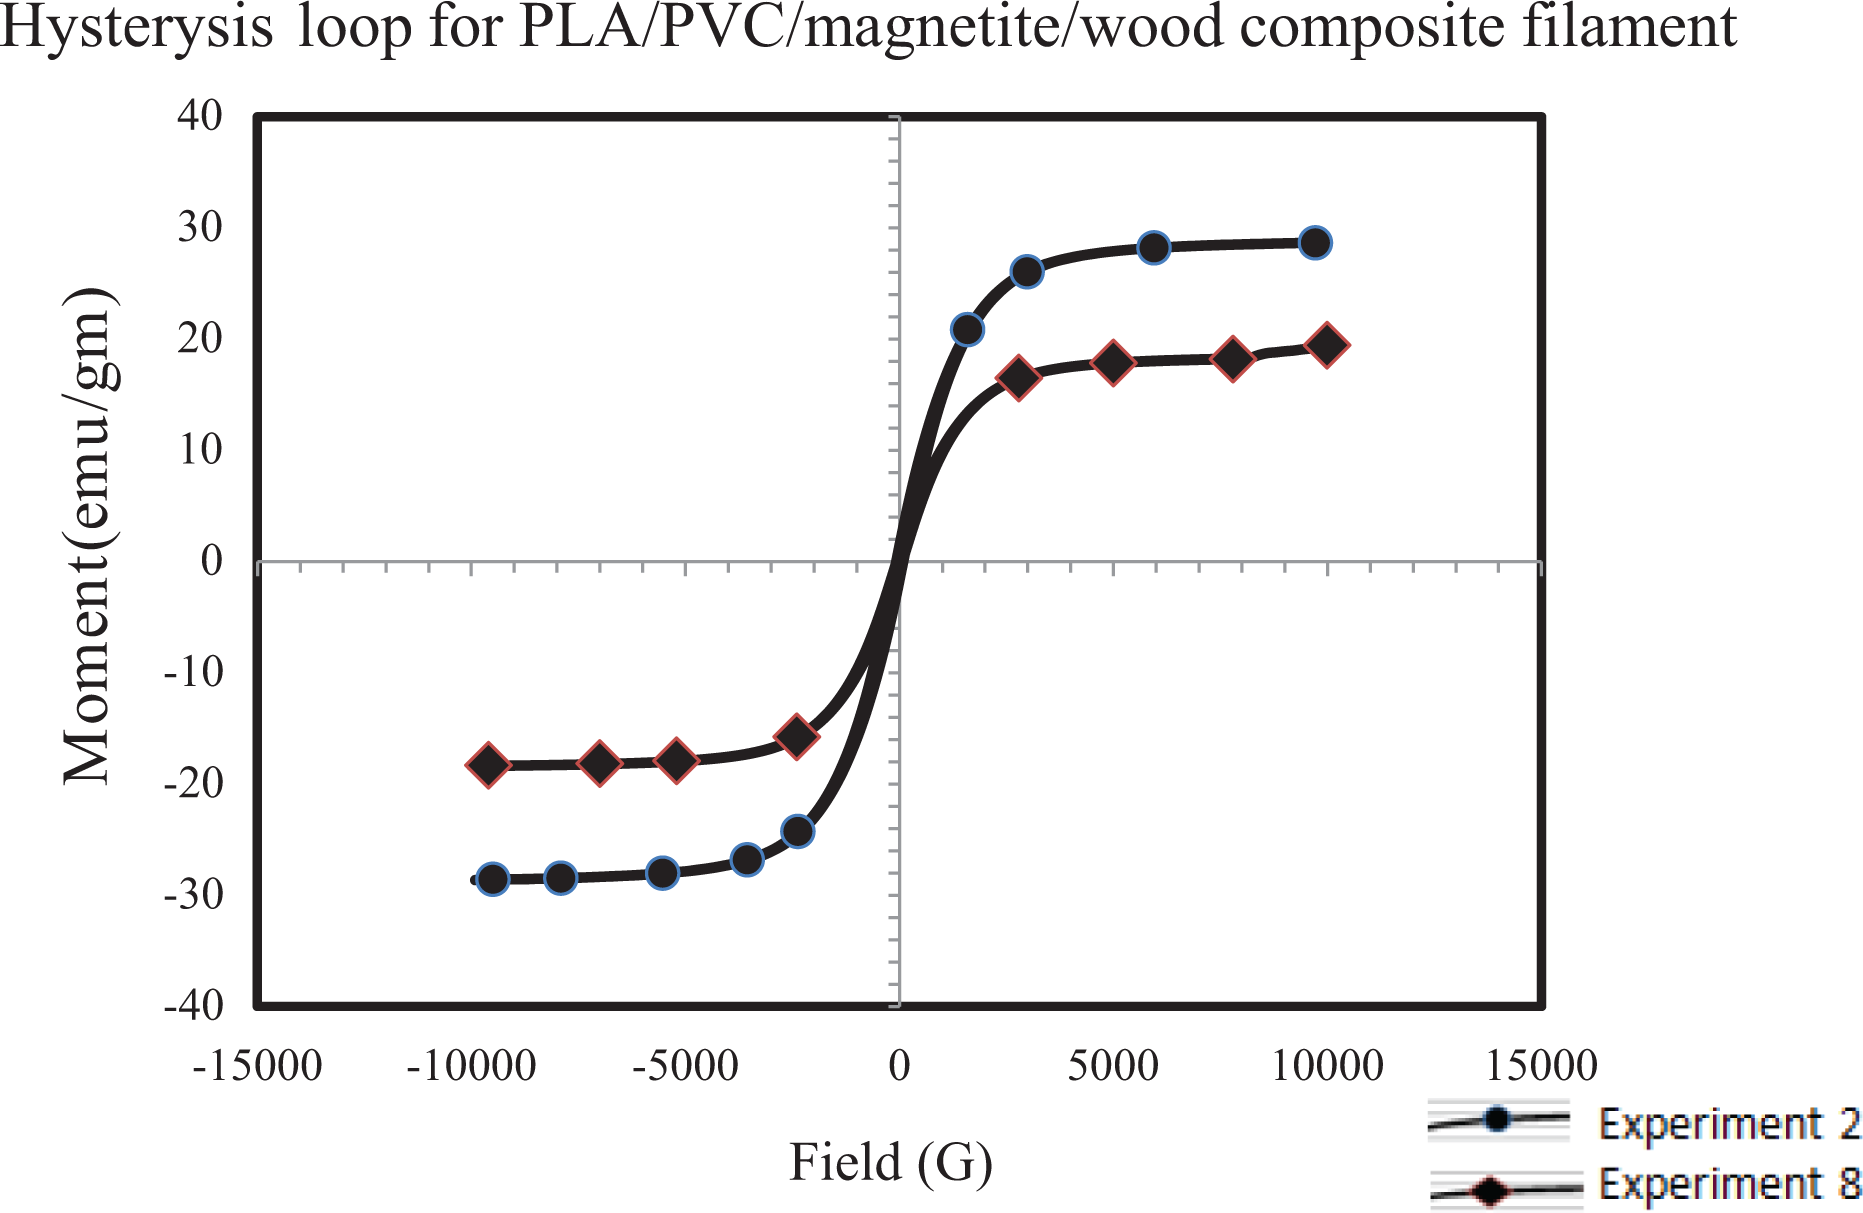
Hysteresis loop for experiments 2 and 8.
From Table 6, it can be interpreted that 20 wt% loading of Fe3O4 powder has given the maximum magnetization and 17.5 wt% of Fe3O4 as reinforcement has given poor magnetic property. It has been observed that the loading of 25 wt% was ineffective in comparison to the loading of 20 wt% for magnetic properties. This may be because of the fact that a high proportion of Fe3O4 resulted in agglomeration. Another reason may be composition 1 (PLA 50%, PVC 25 wt%, Fe3O4 20 wt%, and wood powder 5 wt%) was reinforced with minimum quantity of wood powder, whereas for other compositions, proportion of wood dust was higher, which resulted in hindrance to flow of magnetic field.
Optimization of extrusion conditions for magnetic properties
Based on Table 6, all the properties were optimized using Minitab 18.1 software package. Basic ANOVA was used for optimization. Table 7 provides the ANOVA for signal-to-noise (SN) ratios for magnetization property and it clearly shows that the p-value for composition and ST is less than 0.05 which means these parameters are significant for the purpose of extrusion from magnetic properties viewpoint. It has also been found that ST contributes maximum toward the magnetization property which is 55.39% and composition also contributes significantly with 29.35% as shown in Table 7. Table 8 shows the response table which is useful in finding the rank of the input parameters for the output result. From this rank Table 8, it is clear that ST, which gives a maximum contribution toward extrusion, is given the first rank. Figure 3 shows the main effect plot for magnetization, which clearly indicates that for magnetization, ST of 165°C, torque of 0.12 Nm, second composition, and load of 5 kg play the important role, for larger is the better case. Figure 4 shows the matrix plot of all the input parameters with the output result which is magnetization. As it can be seen from Figure4 when the load is 5 kg, magnetization value is more, and composition 1 has provided maximum magnetization of 0.2283 as it can be seen from Table 6 that ST of 165°C gives the maximum magnetization value. Figure 5 gives residual plots for SN ratio which show that our output results are independent as they do not follow any trend in residual versus order graph. Similarly in the normal probability plot, the values are very much near to the line, thus our data follow normal properties. Similarly in residual versus fit graph, one can clearly see that most of the values are near to the center line. Only some values distract from center which shows that our data are homogeneous and very less scattered.
ANOVA for SN ratios for magnetization.
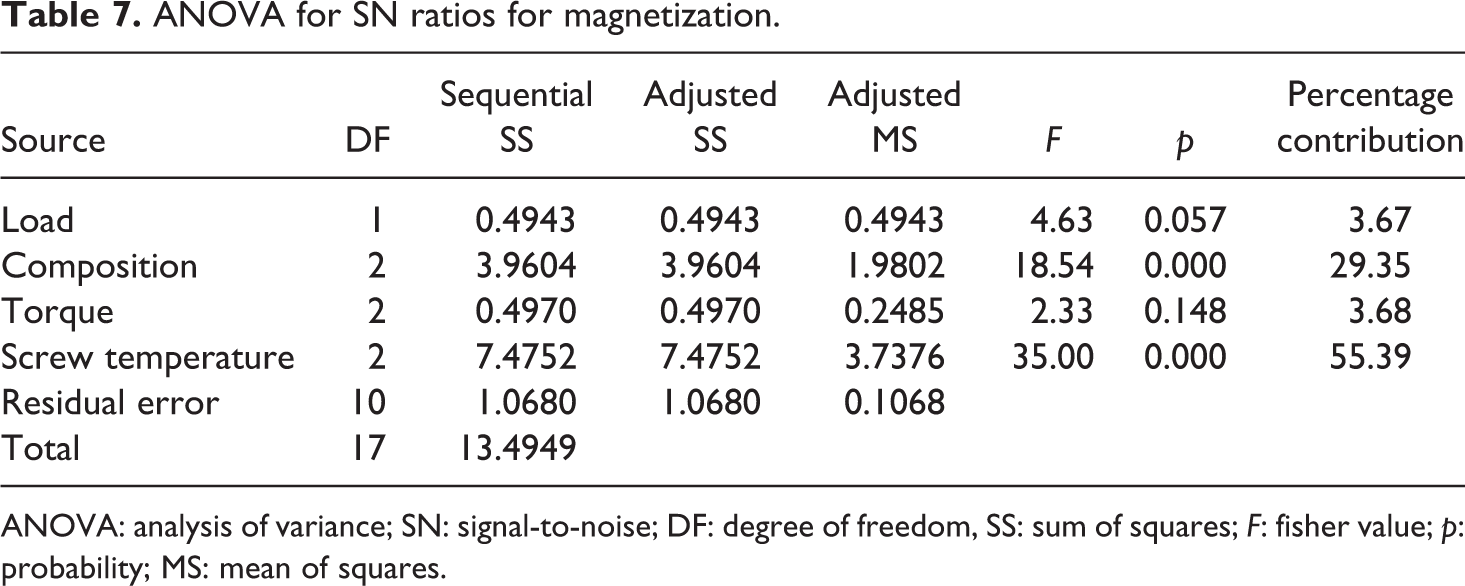
ANOVA: analysis of variance; SN: signal-to-noise; DF: degree of freedom, SS: sum of squares; F: fisher value; p: probability; MS: mean of squares.
Response table for SN ratio.
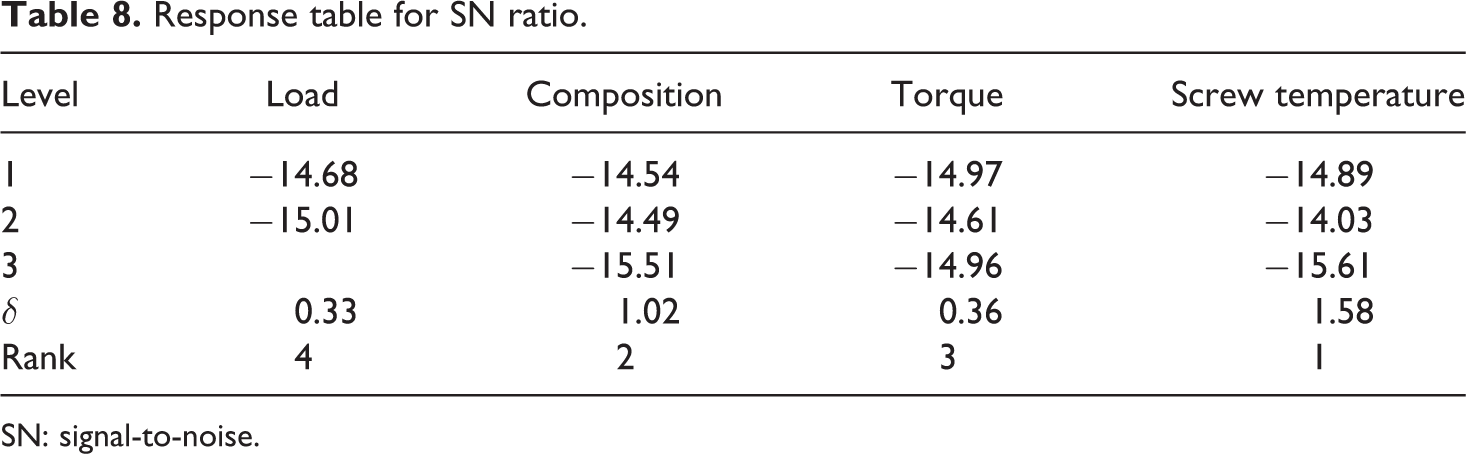
SN: signal-to-noise.
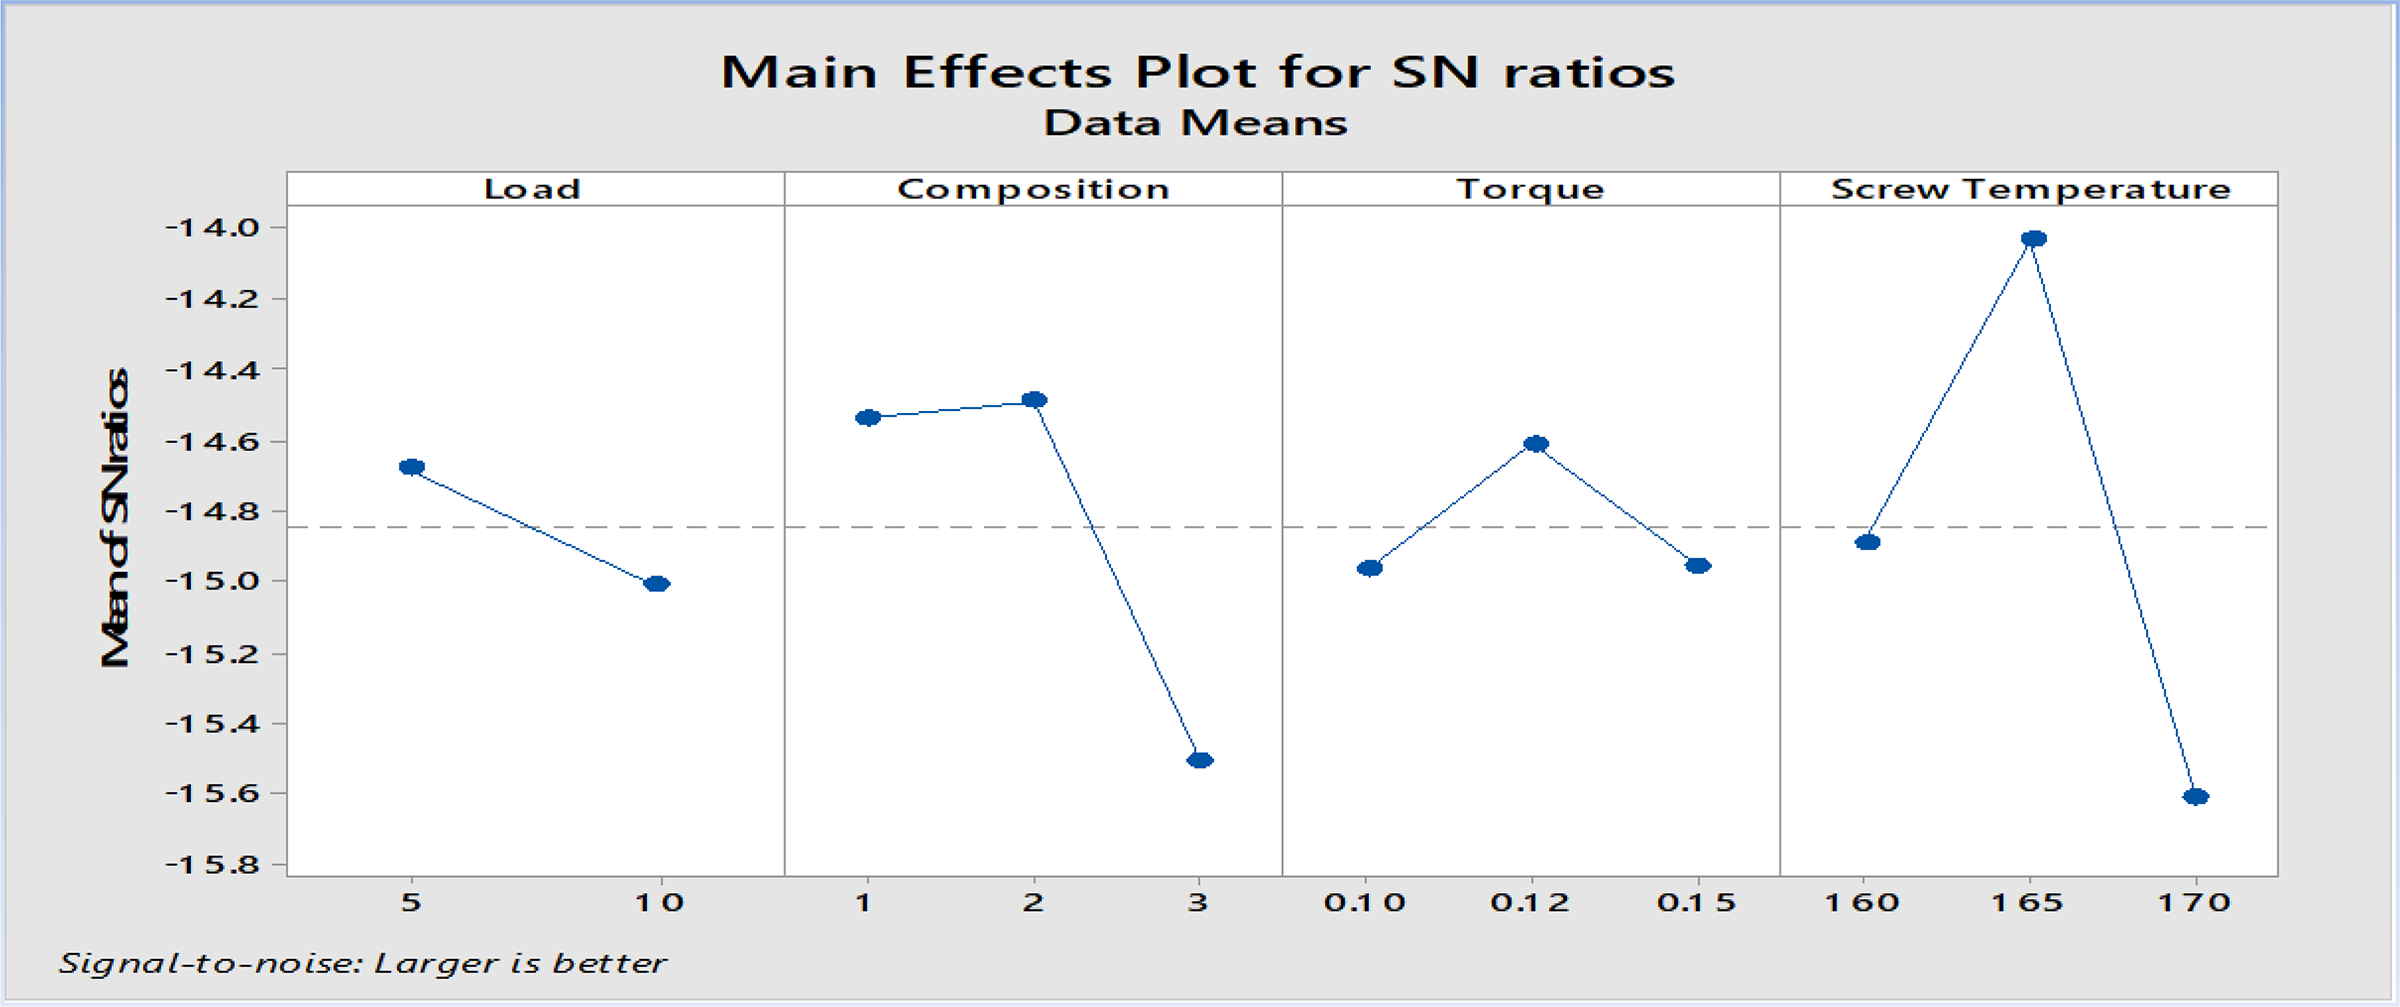
Main effect plot of magnetization for SN ratio.
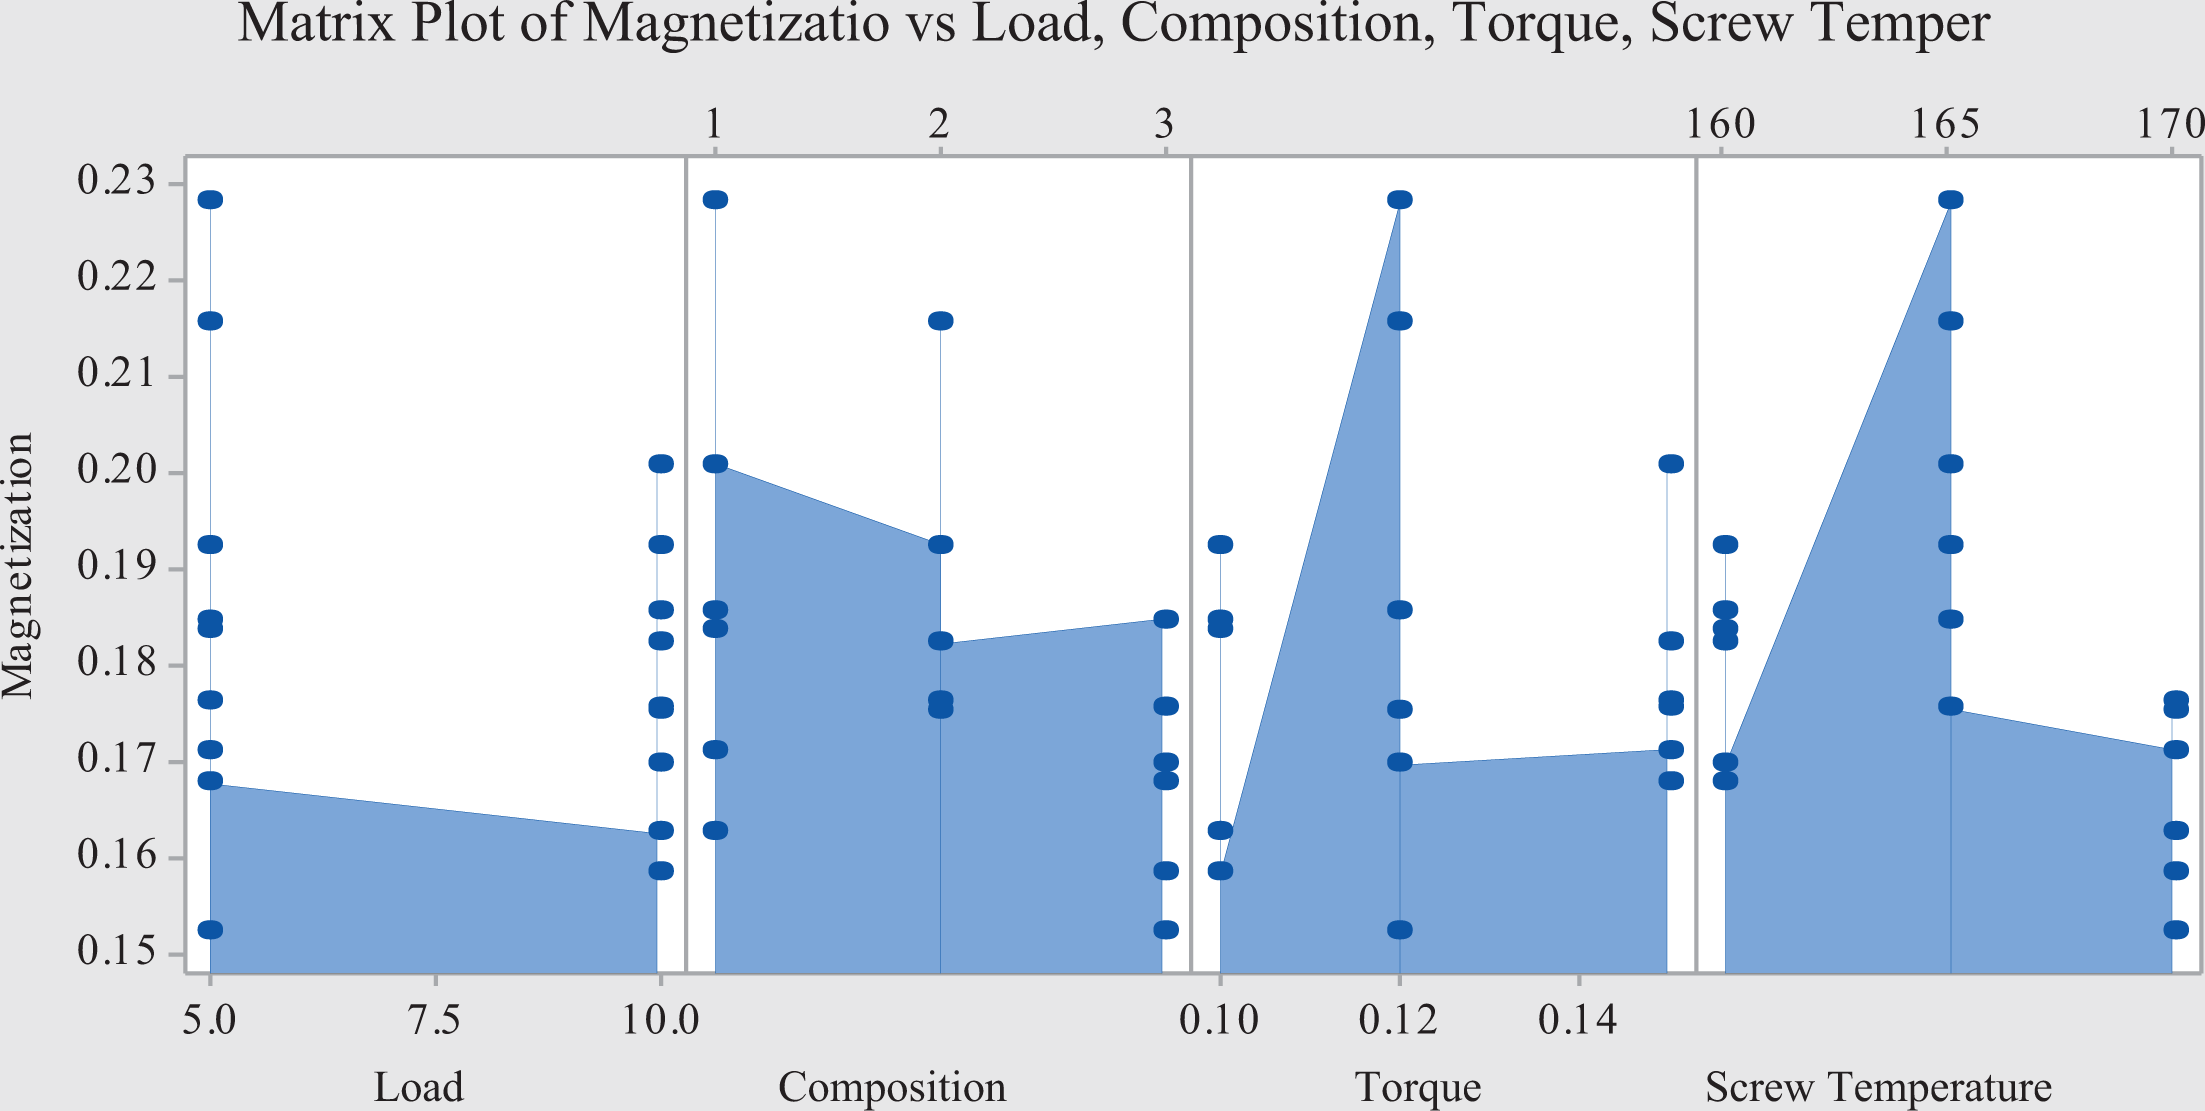
Matrix plot of all the input parameters with magnetization.
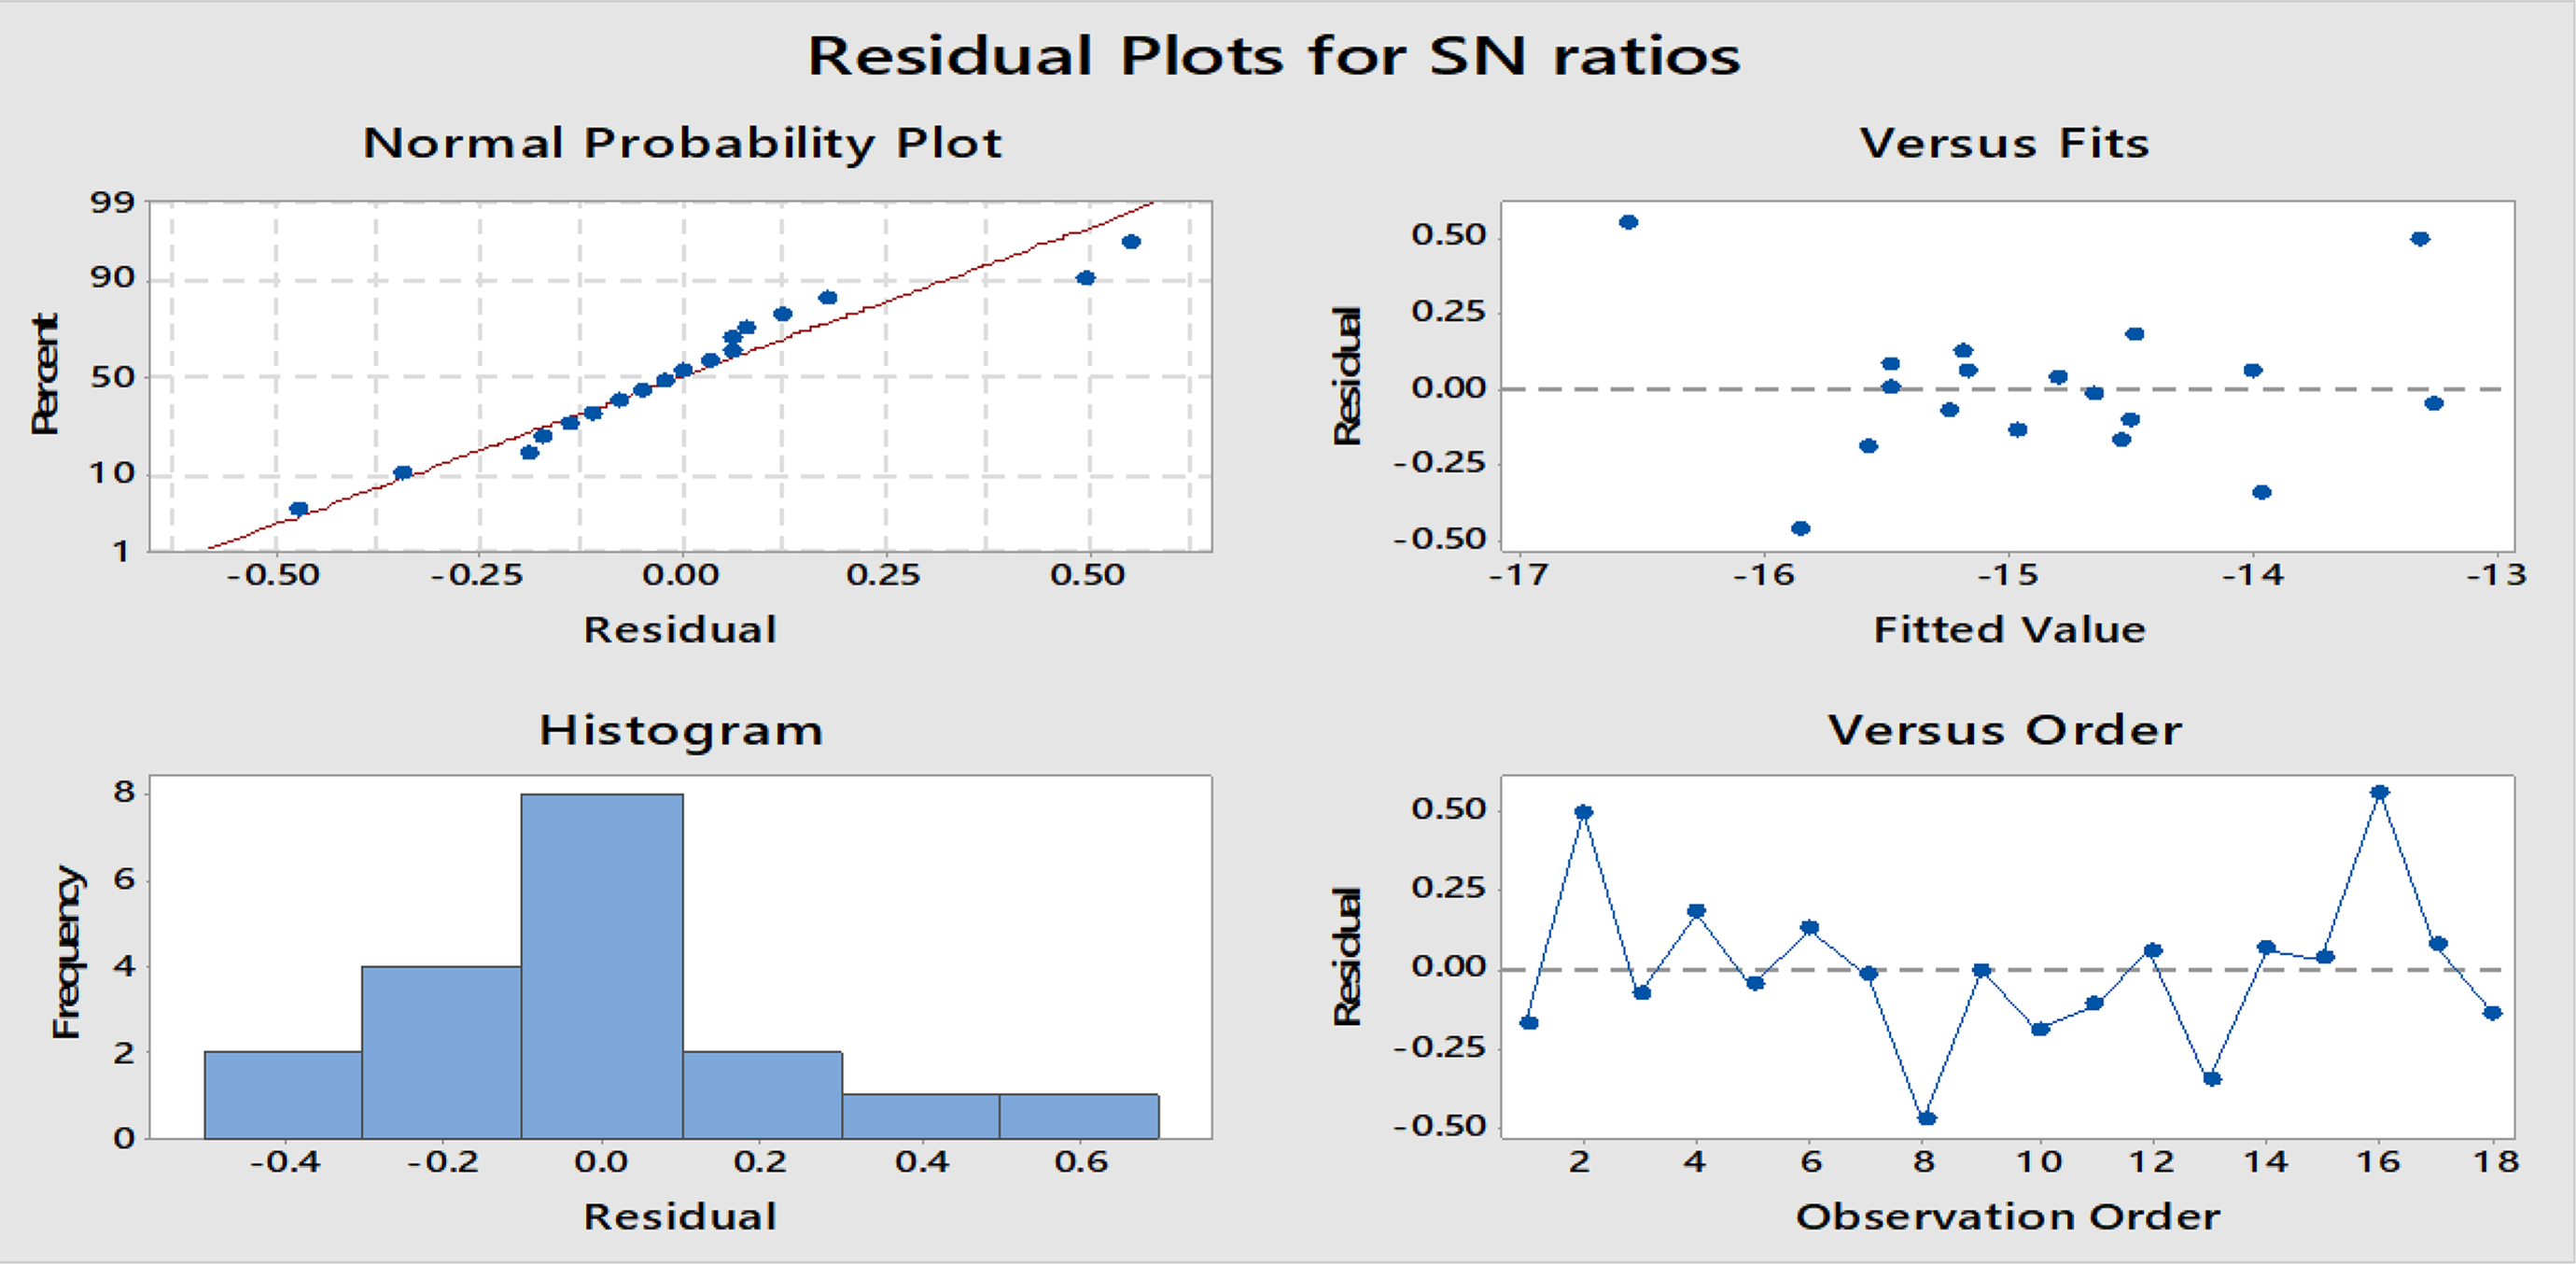
Residual plot for magnetization.
Optimization of magnetic properties

Where N = SN mean for magnetization = −14.84, NA = max load value from rank Table 8 = −14.68, NB = max composition value from Table 8 = −14.49, NC = max torque value from Table 8 = −14.61, and ND = max temperature value from Table 8 = −14.03.
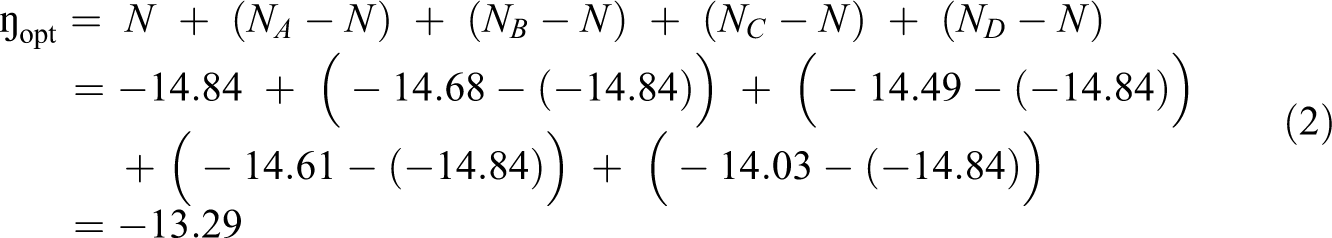


The optimized result for the magnetization property is 0.2165 emu. On running the optimized condition for load of 5 kg, torque of 0.12 Nm, temperature of 165°C, and composition 2, which is our fifth running condition in Taguchi orthogonal assay as seen in Table 5, our magnetization value comes out to be 0.2156, which is equal to the predicted result. In the same manner, the other two properties were optimized; the optimized and actual results are shown in Table 9. Figure 6(a) shows the optimized condition for the coercivity from which we get to know that load of 5 kg, composition second, torque of 0.10 Nm, and ST of 165°C provide the optimized results, but this condition was outside the L18 array so we again extruded sample for this optimized condition, and actual value also came very near to the predicted value. Whereas Figure6(b) shows the main effect plot for the retentivity of samples which show that load of 10 kg, first composition, 0.15 Nm of torque, and 165°C of ST give the optimized result.
Optimized and actual results for the optimized condition.
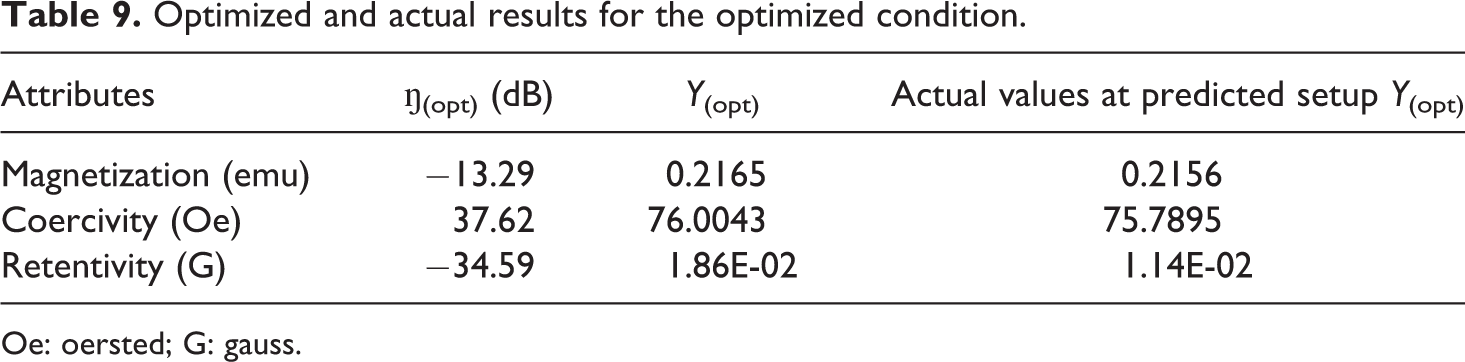
Oe: oersted; G: gauss.
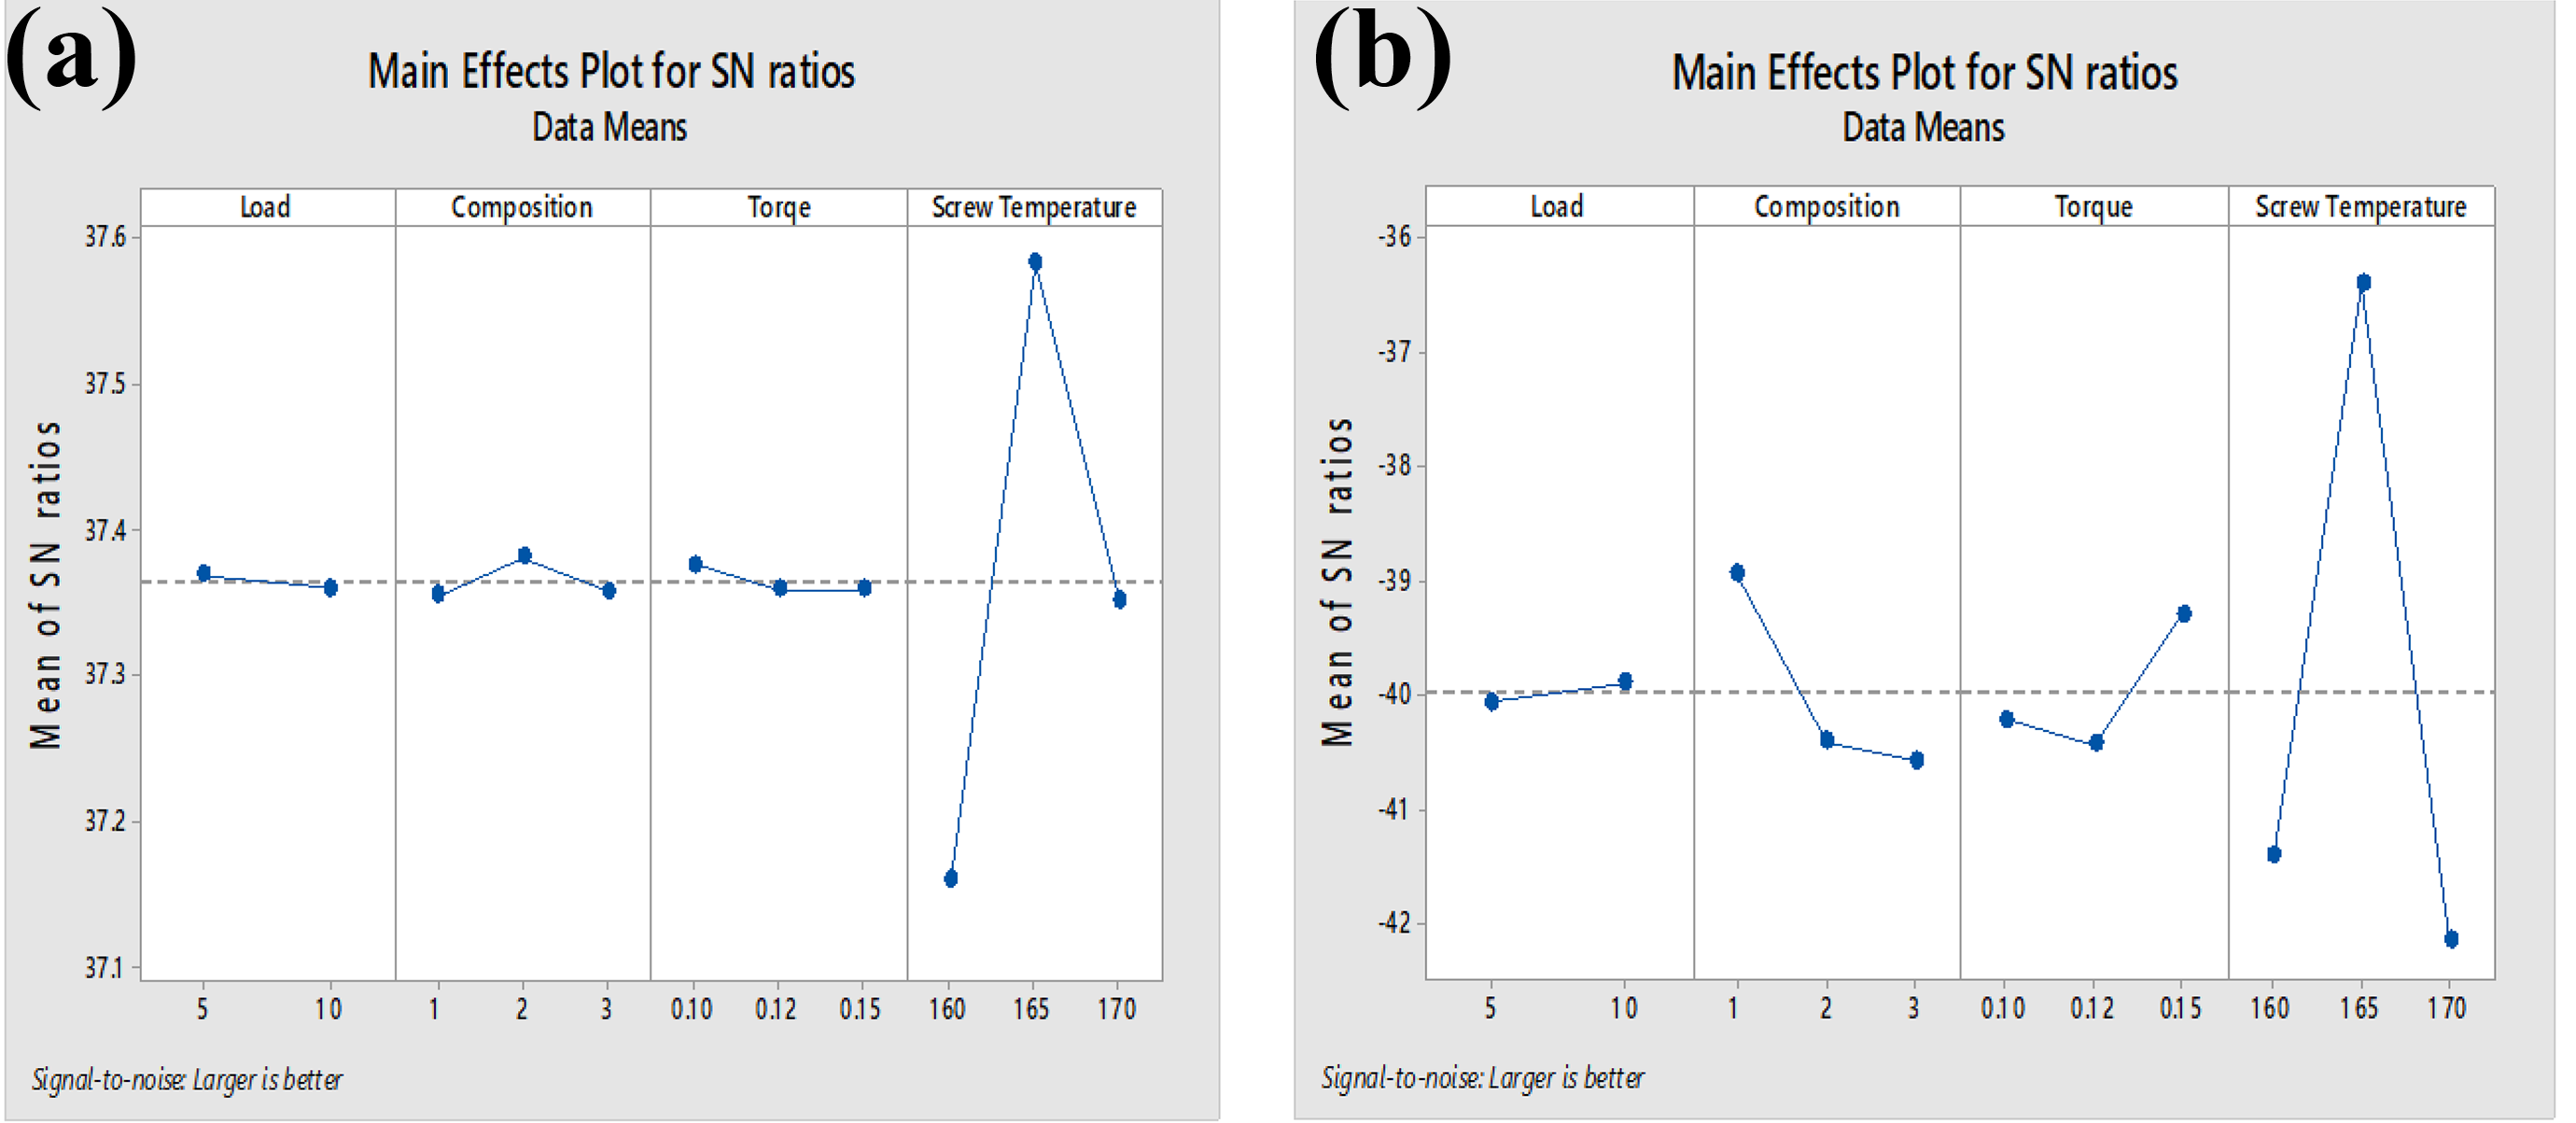
(a) Main effect plot for coercivity and (b) main effect plot for retentivity.
Interaction of input parameters with output
To know the effect of input parameters over the output properties, regression analysis has been done and contour plots have been taken to explain the actual interactions of the different input parameters with the output. As ST and composition are giving the maximum contribution and have been ranked as first and second for each property, therefore, for contour plotting, composition has been taken on y-axis and ST has been taken on x-axis; output properties are shown with different color coding in plot as in Figures 7, 8, and 9 for magnetization, coercivity, and retentivity, respectively. Whereas torque and load play the least role in extrusion conditions, therefore are fixed with 0.123 Nm and 7.5 kg of load which are average values of the torque and load for every set of condition for extrusion. Equations 5, 6, and 7 give the regression interaction equation for magnetization, coercivity, and retentivity, respectively, which is used for making contour plots in MiniTab 18.1 software package in which four levels of interaction are selected as we have four input parameters.
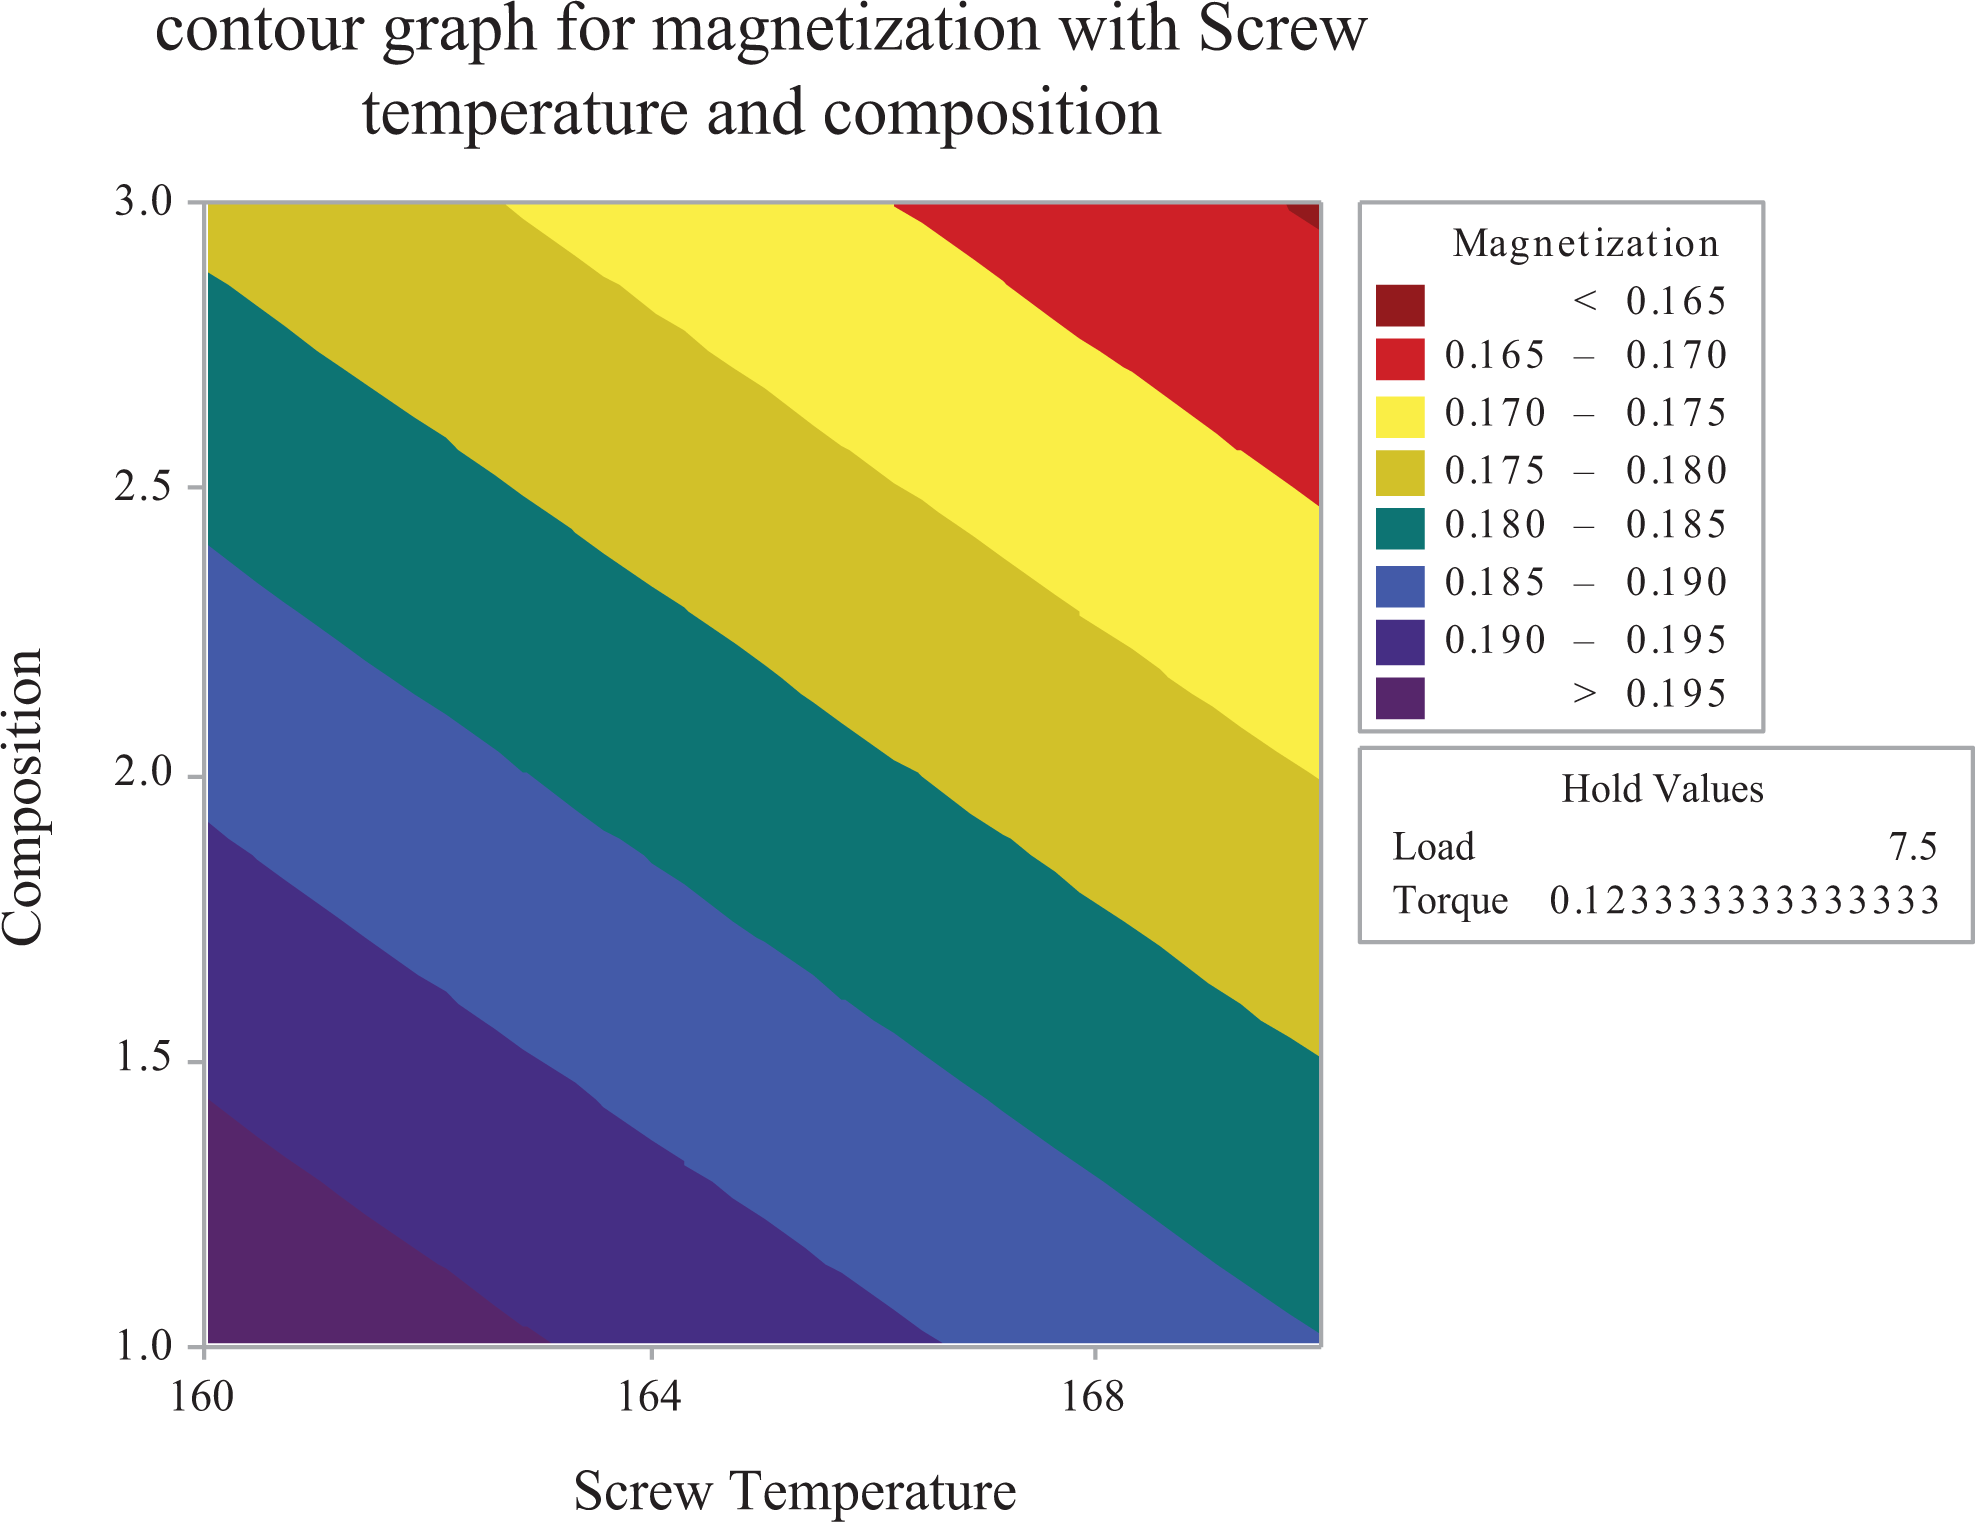
Contour plot for magnetization.
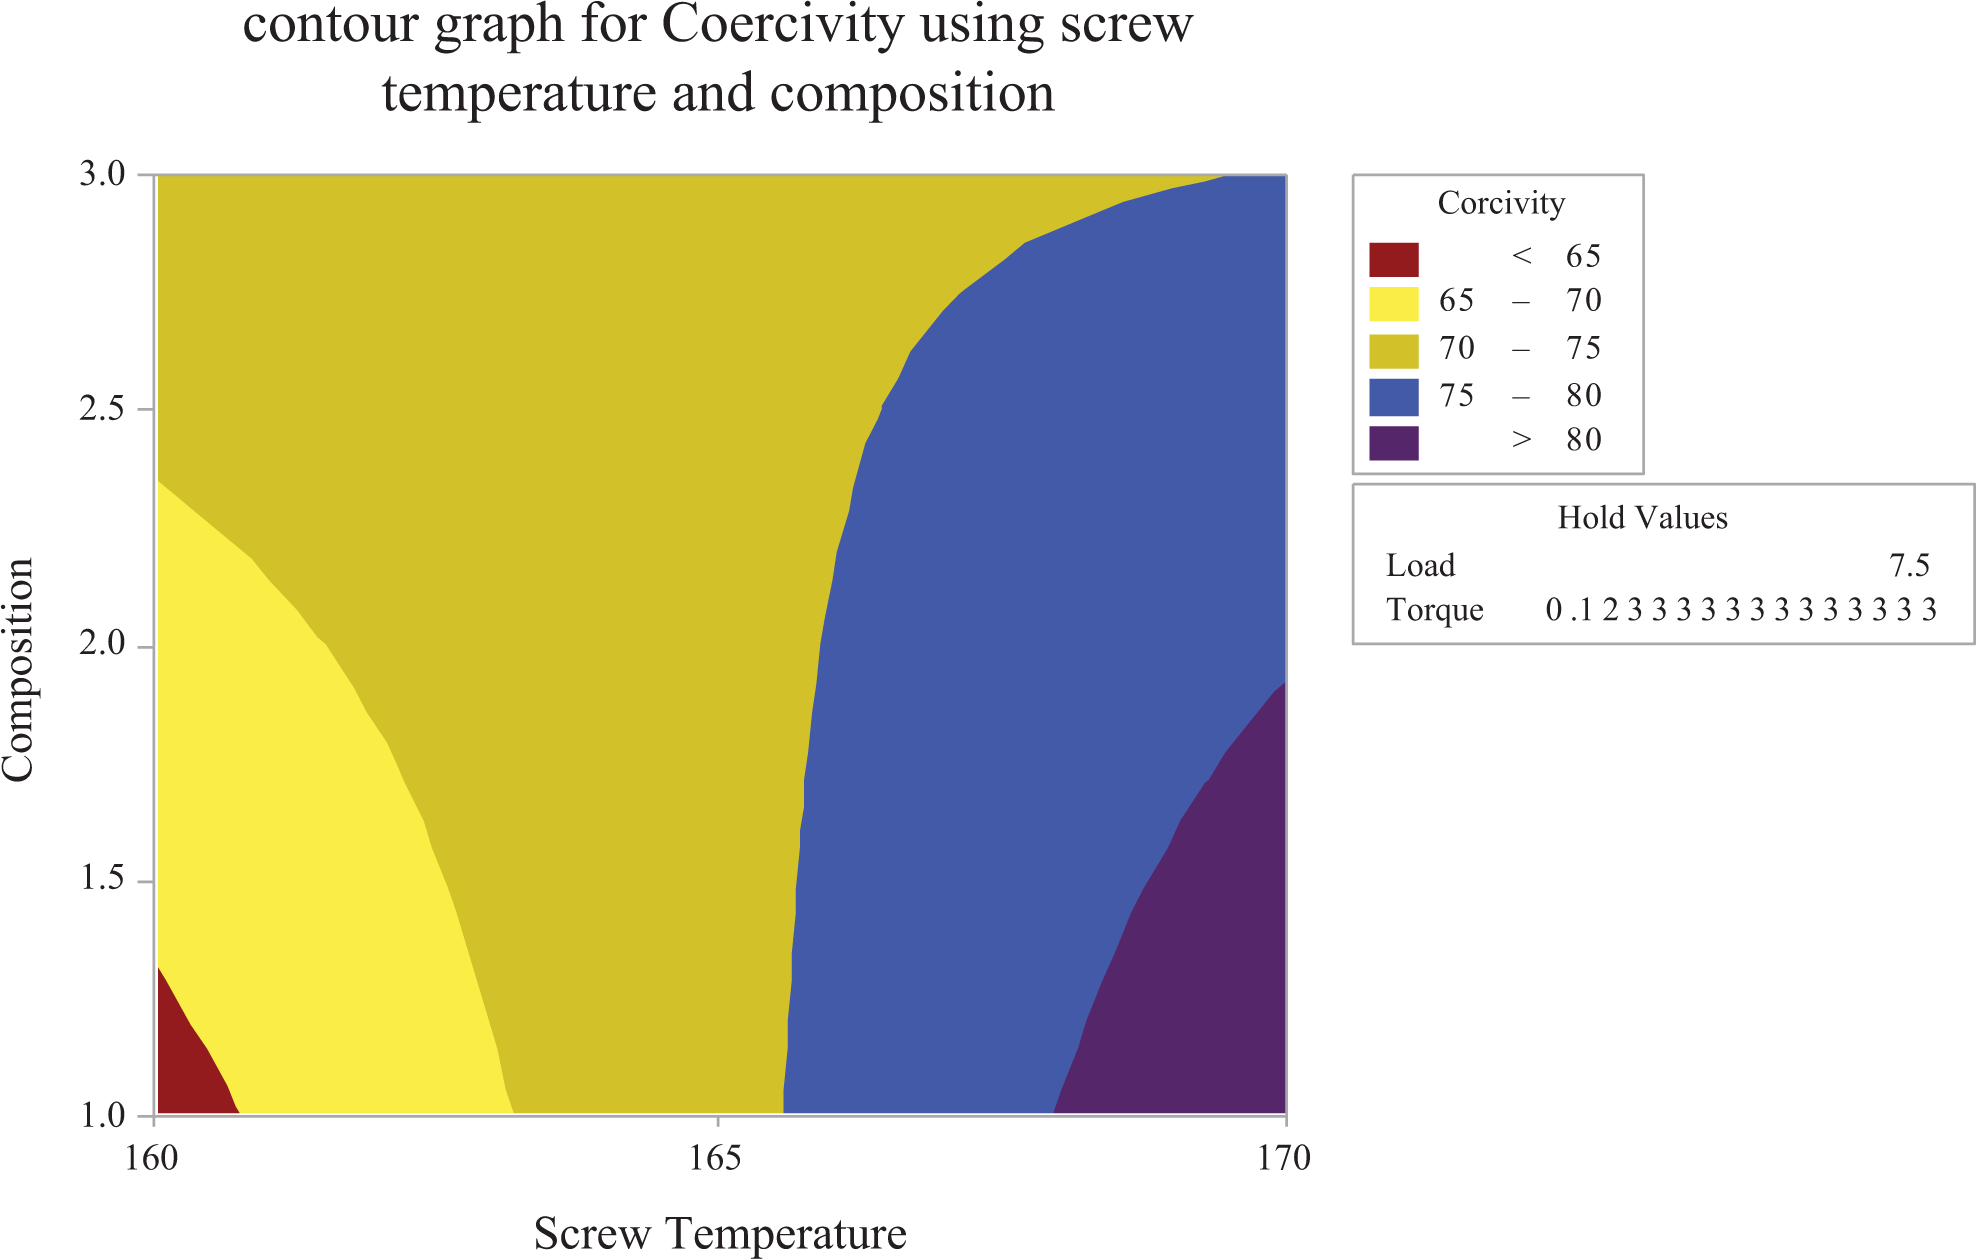
Contour plot for coercivity.
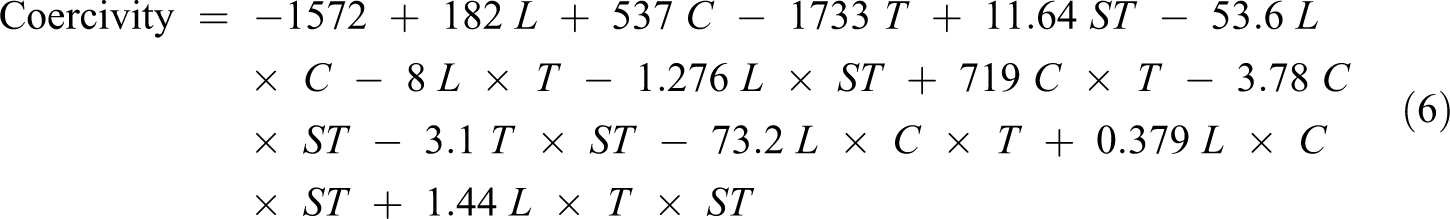
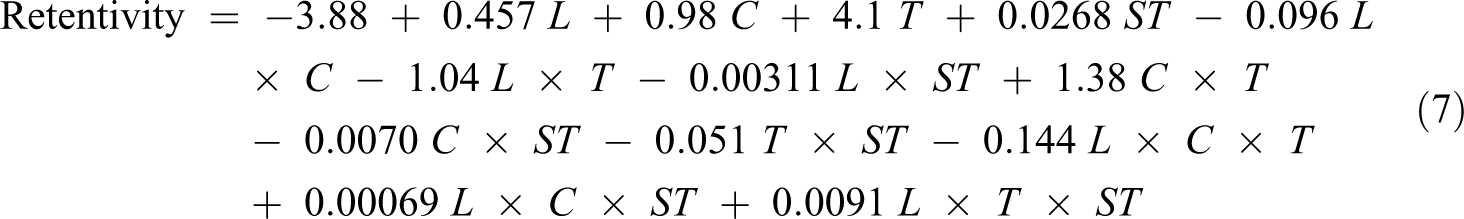
Regression equations for magnetization, coercivity, and retentivity:
(L = load, T = torque, and C = composition, and ST = screw temperature)
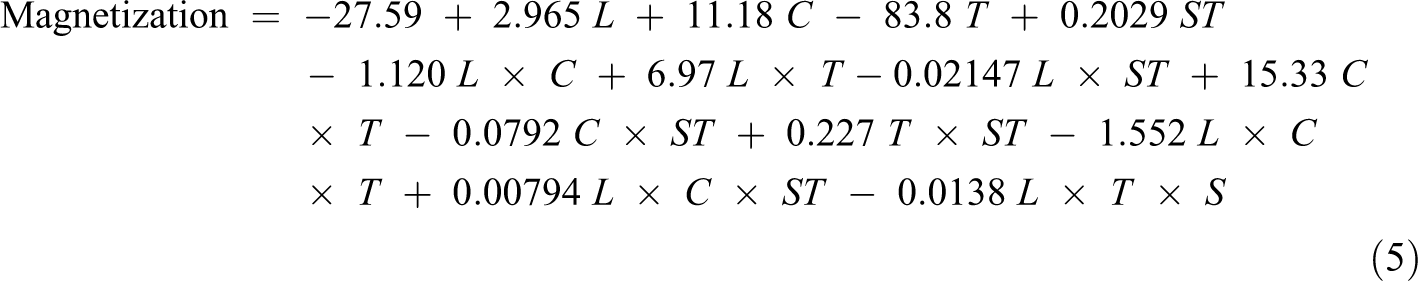
As observed from Figure7, the contour loop for magnetization shows that when torque at 0.123 Nm and load at 7.5 kg were fixed, magnetization decreases with increase in temperature and also low magnetization value was obtained for composition 3 in which 17.5% of Fe3O4 powder was blended with the PLA matrix. Whereas when the temperature was low about 160°C, the maximum magnetization value was obtained for composition 1 in which 20 wt% of Fe3O4 powder was mixed, whereas composition 2 in which the maximum amount of Fe3O4 powder 25 wt% was mixed gives intermediate results for magnetization. This may be because, in composition 2, PLA is 52.5 wt% and wood dust is 7.5 w%, which is higher than composition 1, in which 50 wt% of PLA and 5 wt% of wood dust were mixed. So it may be ascertained that while preparing blend of different compositions when there is a large amount of wood dust present inside the matrix, it reduces magnetization as one can see from trends that in sample 1, only 5 wt% wood dust was mixed, thus having the highest magnetization, and as the proportion of wood dust increases from 5 wt% to 7.5 wt% in sample 2, magnetization decreases and similarly when wood dust was 10 wt% in the composite matrix, the magnetization value was least.
Similarly from Figure 8, the contour graph for coercivity (when torque at 0.123 Nm and load at 7.5 kg are fixed) gives that the coercivity is low (<65 Oe) when the temperature is low and as the temperature increases, coercivity also increases (>80 Oe). Similarly for the third composition in which magnetite powder (17.5 wt%) is mixed in the composite matrix, the value of coercivity found to be low, whereas composition 1 in which 20 wt% magnetite powder is mixed holds maximum coercivity and follows the same trend as followed by magnetization property as seen in Figure 7.
It has been clear from Figure 9, the contour graph for retentivity (when torque at 0.123 Nm and load at 7.5 kg are fixed) gives that the retentivity is low (<0.00) when the temperature is low and as the temperature increases, retentivity also increases (>0.03). Similarly for the third composition in which magnetite powder (17.5 wt%) is mixed in the composite matrix, the value of retentivity found to be low, whereas composition 1 in which 20 wt% magnetite powder is mixed holds maximum retentivity and follows the same trend as followed by magnetization and coercivity as seen in Figures 7 and 8.
Contour plot for retentivity.
Correlation of morphological properties and hardness with magnetic properties
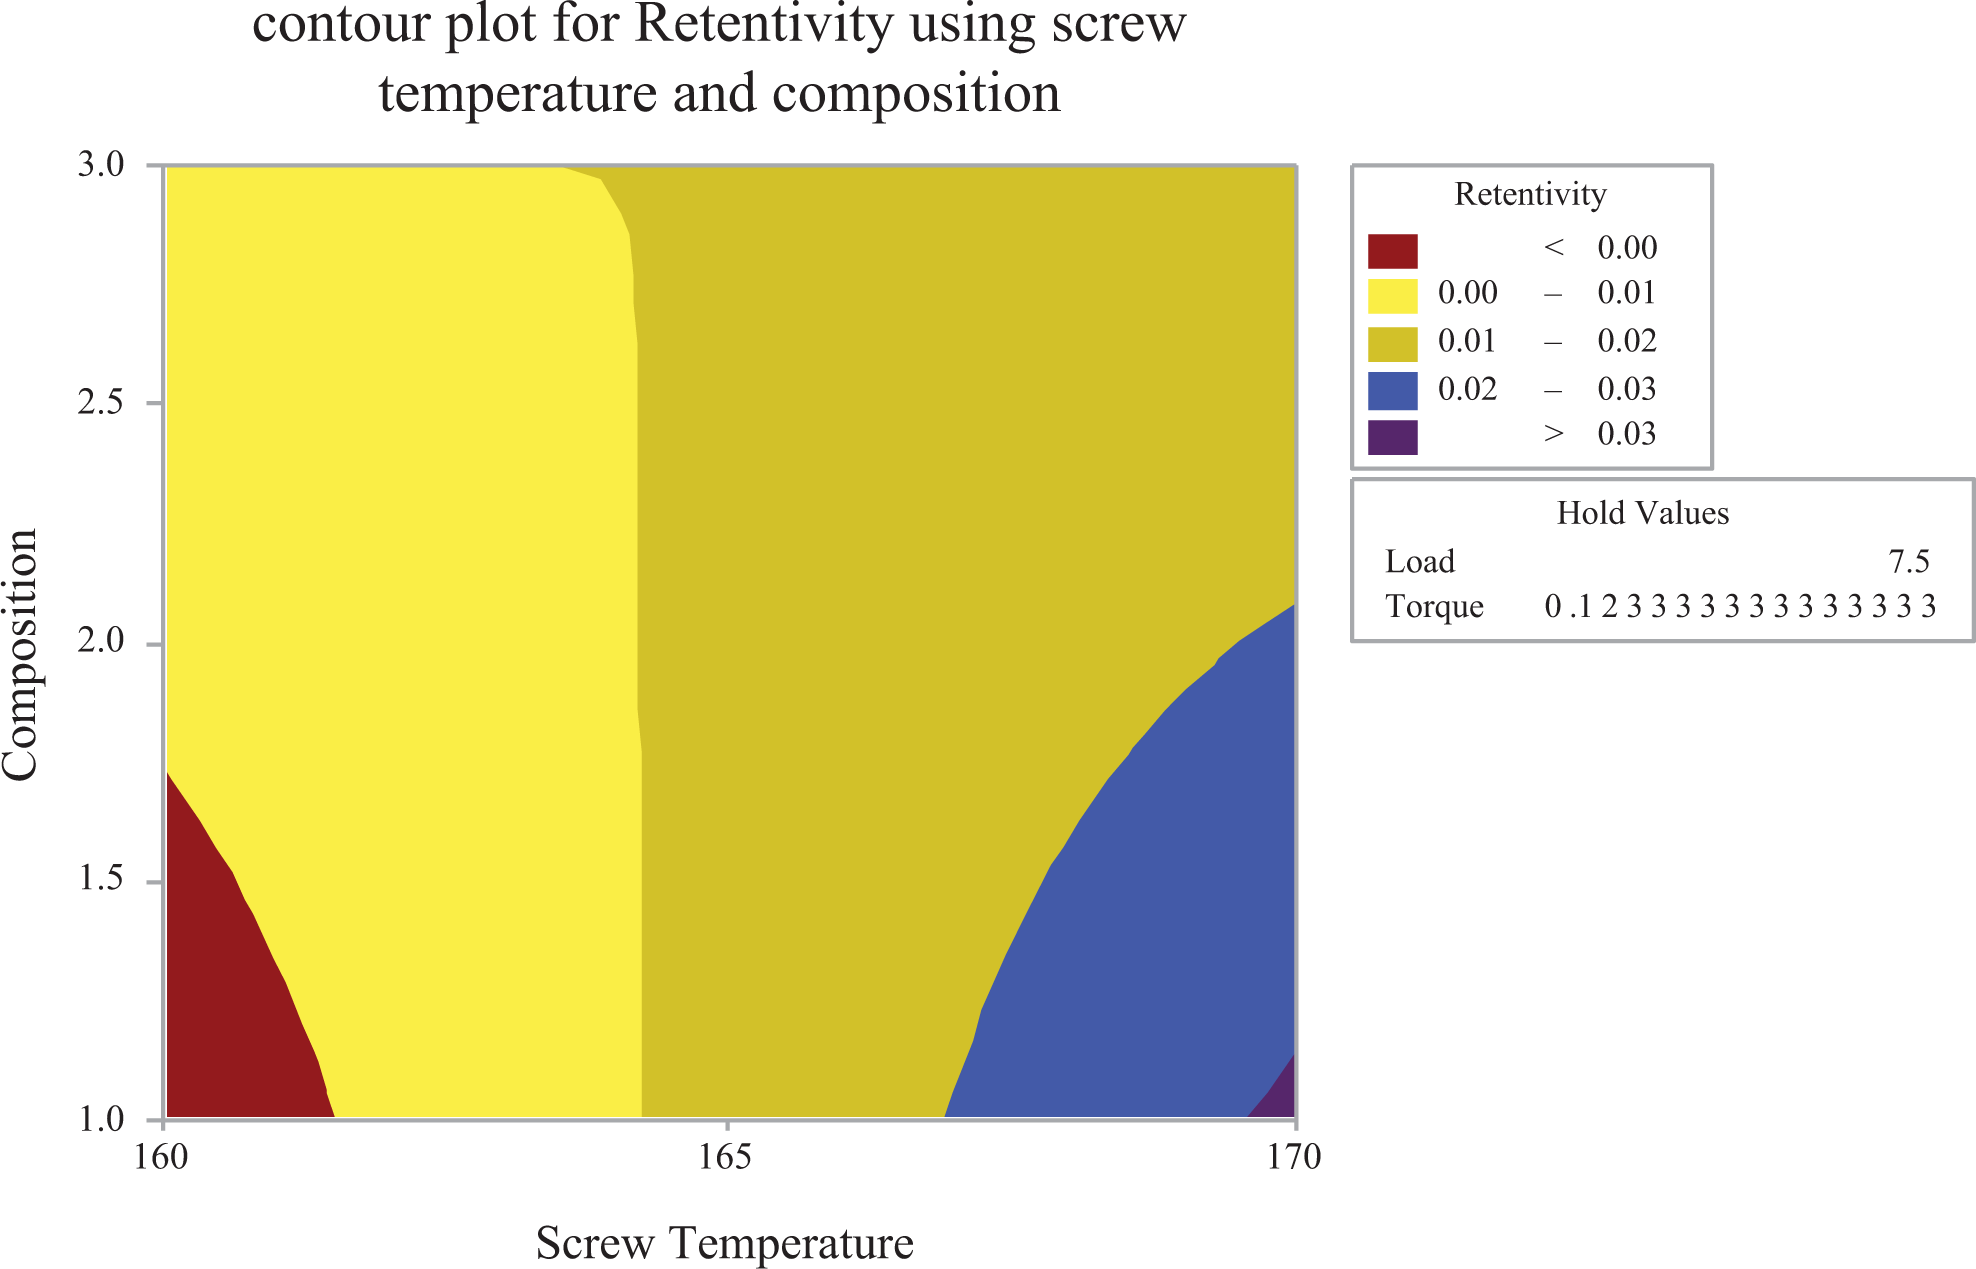
From Table 6, one can clearly see that the magnetization for sample 2 is maximum (0.2283 emu) and sample 8 has a minimum magnetization value (0.1524 emu). For these samples, porosity results are shown in Figure 10(a) and 10(b) which were obtained through metallurgical image analysis software (MIAS) using ×100 magnification. Sample 2 posses less porosity which is 10.03% in comparison to sample 8 which is having a porosity value equal to 12.6%. Figure10(c) shows the histogram for magnetization and Figure 10(d) shows the graph for shore D hardness. Figure10(e) shows the porosity graph for all the samples in which it is clear that porosity values are independent to the magnetic properties as there is no corelation observed between magnetic properties and porosity, similar is the case with shore D hardness. Thus, it is ascertained that porosity values and shore D hardness contribute toward the mechanical properties, but not significantly for magnetic properties (as seen in this present study). This may be attributed to the fact that magnetite powder in the composite may not be present in large amount on the surface but deep into the matrix of composite thus leading to a contradiction in results of surface properties with that of magnetic properties. As to the fact that wherever magnetite powder is more, there should be more hardness, but in the present case as one can see from Figure10(d), sample 8 possess maximum hardness (>66 shore D), but magnetization (>0.15 emu) is not maximum that means this behavior is due to intermixing of magnetite particles into the inner matrix of composite. Magnetite particles are present in less percentage on the surface and have moved into the inner matrix, thus leading to contradictory results. Thus to have a correlation between magnetic and mechanical properties, multimaterial printing may be one of the solutions in which different layers of different materials can be printed in a single object, thus leading to required results.
(a) Sample 2 porosity 10.03%, (b) sample 8 porosity 12.6%, (c) graph for magnetization, (d) graph for shore D hardness, and (e) graph for porosity hardness.
Scanning electron microscopy
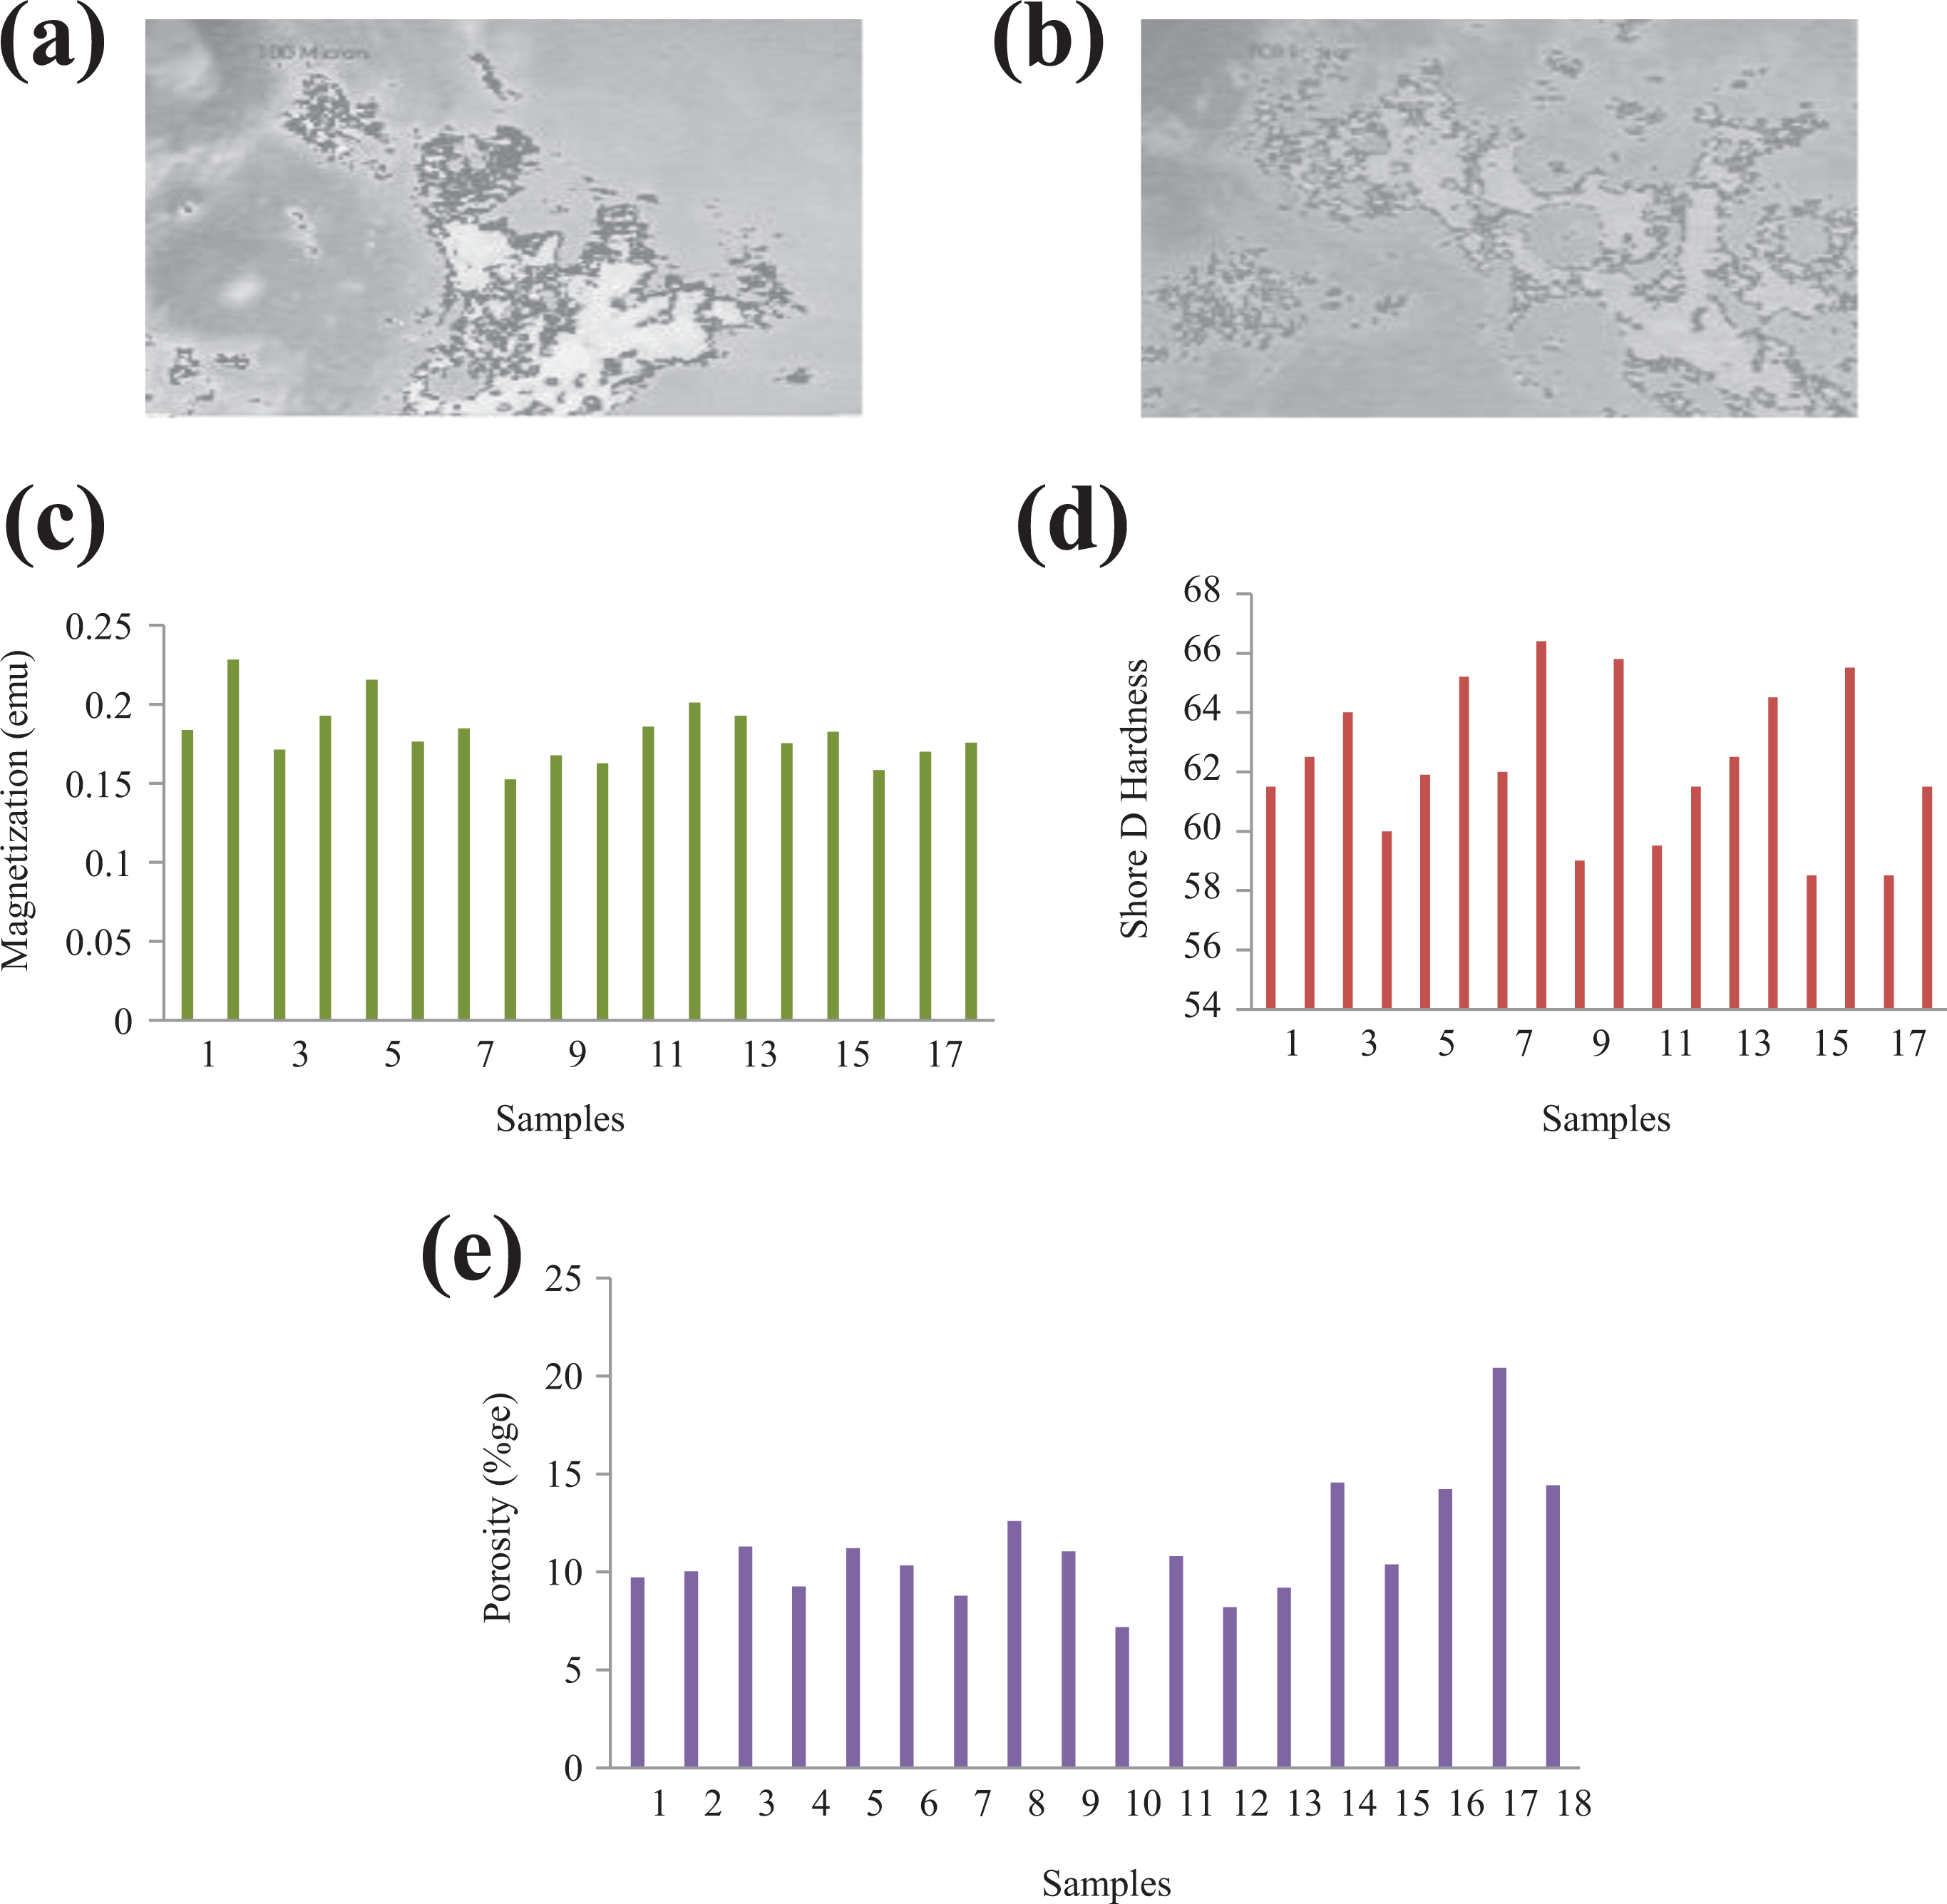
As observed from Table 6, sample 2 has shown maximum magnetization 28.66 emu/gm or 0.2281 emu and sample 8 has shown minimum magnetization 19.40 emu/gm or 0.1524 emu; therefore, these two samples have been taken as the best and worst sample, respectively, and have been tested for SEM which clarify the contradictory behavior of magnetic properties with that of mechanical property, such as shore D hardness and porosity. Figure 11(a) shows the SEM images of sample 2 and Figure11(b) of eighth filament in which it is clear that the magnetite particles are not present over the surface of the sample and rather they get mixed into the inner matrix of composite due to which on surface, magnetite particles do not contribute toward hardness. Further from the comparative analysis, it is clear that the surface texture of sample 8 is nonuniform, therefore has high porosity and low value of hardness than sample 2.
(a) SEM image of second filament and (b) SEM image of eighth filament.
Energy dispersive spectroscopy
EDS of samples 2 and 8 has been performed to know the elements present on the surface of filaments. Figure 12(a) shows the EDS images of samples 2 and 8 with their spectrum graph which shows the element present on the composite surface with their contribution on the surface. As one can see from Figure12(c) for spectrum 4 of EDS (for full selection of image) for sample 2, Fe element is just 1.15% (maximum of the four spectra selected) of the total elements’ composition on the surface of selection, thus has clearly shown that magnetite particles mixed thoroughly and have moved deep inside of the matrix due to which magnetic properties are not in correlation with mechanical properties. Thus to have the impact of magnetite particles on the surface, multimaterial printing is a better option. Moreover, carbon element is present in a huge percentage on the surface (>55%) which contributes toward the mechanical properties of the composite. Similarly from Figure12(d) for spectrum EDS image of eighth sample, it has been found that for Fe content on surface is 1.59% (maximum of the four spectra selected) of the total element present on surface which is higher than the Fe content in the case of filament 2, therefore having more heterogeneous surface texture as it can be seen in figure 11(b) and thus having high surface hardness and presence of more Fe content and oxygen element on surface lead to more porosity (12.60%) as shown in Figure 10(d) in porosity graph.
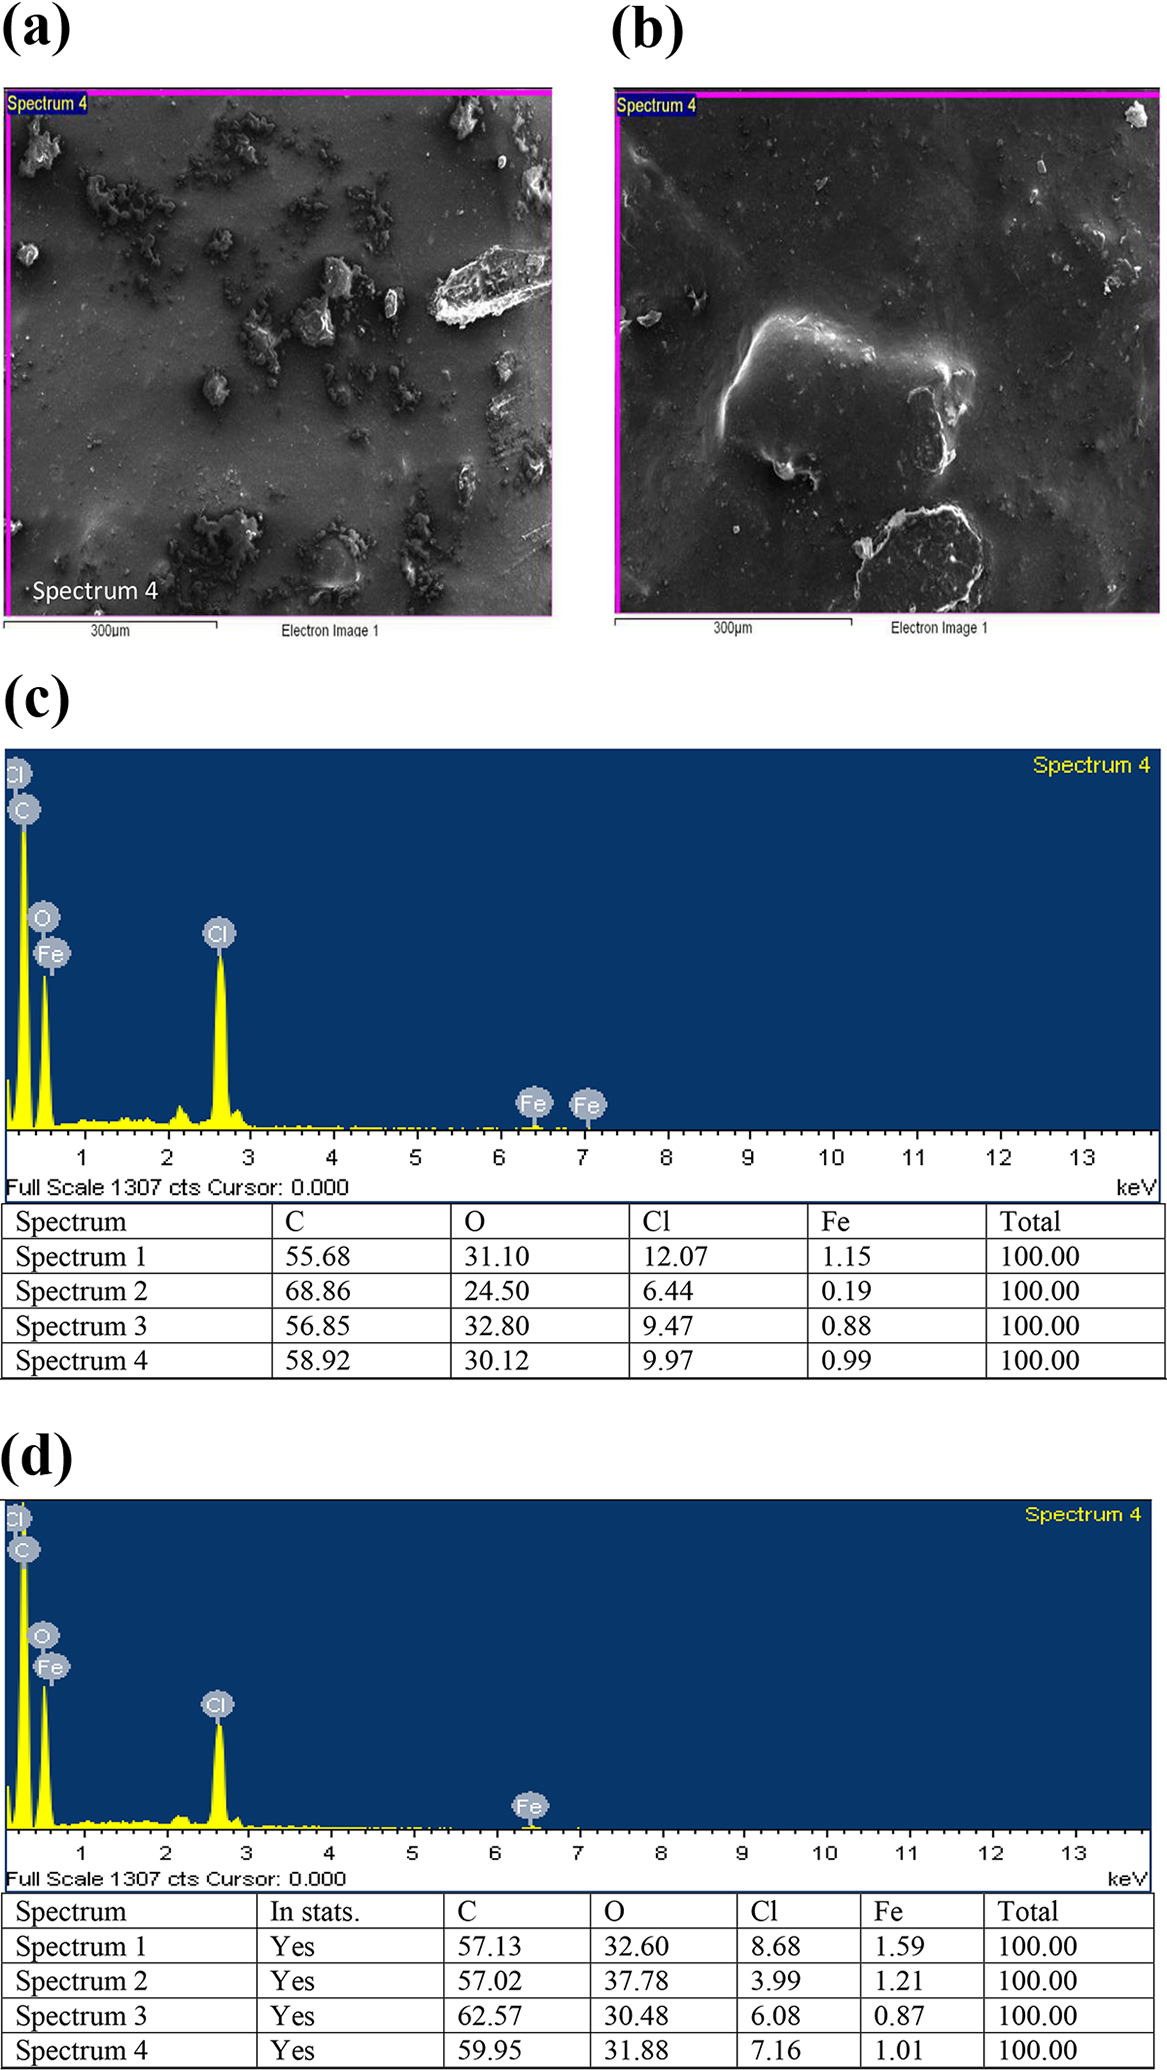
(a) EDS spectrum image for second filament, (b) EDS spectrum image for eighth filament, (c) EDS spectrum and element composition present on surface for second filament, and (d) EDS spectrum and element composition present on surface for eighth filament.
Conclusions
In the present study of magnetostrictive polymer, composite for 3-D printing applications has been prepared. Following are the conclusions from the present study: Extrusion condition 5 (as per Table 5) in which sample composition 2 (Fe3O4 25 wt%, PLA 52.5 wt%, PVC 15 wt%, and wood particles 7.5 wt%), torque of 0.12 Nm, screw temperature of 165°C, and load of 5 kg play a crucial role and are the optimized conditions for the magnetization, whereas maximum magnetization has been obtained in experiment 2 which contained composition 1 in which 20% of Fe3O4 is present. Regression analysis of all the input parameters with output for different properties has shown that the magnetization is maximum when screw temperature is less than 165°C and composition lies between samples 1 and 2. Lowest magnetization is found for the highest temperature and sample having the lowest Fe3O4 content (sample 3; Fe3O4 = 17.5%). From VSM analysis, it has been found that all the samples having Fe3O4 in the matrix are of superparamagnetic nature which is clear from its hysteresis loop (see Figure 2) and can be gainfully used for self-assembly applications. Magnetic and mechanical properties are not in correlation with each other as verified from SEM and EDS analyses, and it is clear that few Fe3O4 particles are present on the surface of filament which means that magnetite particles get mixed into the inner matrix of the surface. As magnetic properties are dependent solely on the presence of Fe3O4 powder in the composite which is inside the composite matrix, therefore, it is hard to find any correlation between magnetic and mechanical properties of the composite. It has been ascertained that multimaterial printing can be a better alternative to print objects/functional prototypes having the maximum Fe3O4 content on one of the surface, thus producing a required result and a correlation may be formulated between mechanical and magnetic properties for future applications.
Footnotes
Acknowledgements
The authors are highly thankful to Manufacturing Research Lab, Department of Production Engineering, Guru Nanak Dev Engineering College, Ludhiana, India, and Thapar Institute of Engineering and Technology, Patiala, India, for providing lab facilities and continuous support.
Funding
The author(s) received no financial support for the research, authorship, and/or publication of this article.