
Abstract
Due to increasing demand for flexibility and individualization, additive manufacturing (AM) is increasingly finding its way into industrial production processes. However, especially for the AM of polymers, the application possibilities are strongly limited by the achievable mechanical properties. One approach to overcome this disadvantage is the integration of reinforcing fibers. For easy handling and to decouple the time-consuming impregnation step from the AM process, it is advisable to use already impregnated semifinished products. Since the reliability of the AM process hardly depends on the quality of the semifinished products used, this study presents a quality analysis process for continuous fiber reinforced thermoplastic strands. The analysis procedure consists of 20 different quality criteria relating to geometry, fiber-matrix composite and mechanics. For easy comparability, the criteria can be calculated to a single quality index. The weighting of the criteria allows a simple transfer of the analysis process to various applications.
Introduction
Additive manufacturing (AM) processes allow fully automated and digitalized manufacturing of individualized and almost arbitrarily complex components without the need for tools. In industry, AM processes are becoming increasingly important, especially in the fields of rapid prototyping, direct tooling, and direct manufacturing. In 2017, the global AM market sales increased by 21% to € 7.3 billion. By the year 2021, sales of even € 26.5 billion are expected. 1 Another study 2 states that by 2030, 10% of all products manufactured will be produced by AM. However, a major disadvantage of AM processes, especially those available for polymer materials today, is the low stiffness and strength. Therefore, applications for additive manufactured polymer parts are highly limited.
Fiber reinforced polymer composites (FRPC) combine low density with very high mechanical performance, making it an ideal lightweight construction material for automotive, aerospace, medical, and sports industries. The length and direction of the fibers in the component are most relevant for the reinforcement effect. Fibers exert the highest possible reinforcing effect when they are continuous, non-crimped, homogeneously distributed, and aligned in the direction of loading. However, there is a lack of automated processes to produce geometrically complex components with load-specific and thus economically used fiber reinforcement.
This led to the concept of combining AM with FRPC in a new process called fiber integrated fused deposition modeling (FIFDM) to overcome the respective disadvantages and thereby enable a flexible and automated manufacturing process for complex structures with high specific mechanical properties. In this study, a method is presented to analyze continuous fiber reinforced thermoplastic strands (FRTS) which are required as semifinished product for this process. This should allow the quality of the strand to be determined and compared so that a suitable semifinished product can be selected.
State of the art
The quality analysis method for continuous FRTS, which is presented in this article, is developed exemplarily based on an AM method for FRPC. Therefore, the AM of FRPC and in particular the FIFDM method are described in the state of the art. In addition, existing quality analysis methods for semifinished products of FRPC are reviewed.
AM of continuous fiber reinforced thermoplastics
There already exist possibilities to reinforce 3-D printed polymer parts with short 3 –6 and long fibers. 7,8 Parallel to the development of the FIFDM process, initial efforts have been made to integrate continuous fiber reinforcement into the FDM process. Most of them are based on the extrusion process fused deposition modeling (FDM), shown in Figure 1. Within the FDM process, a thermoplastic polymer strand is squeezed through a nozzle, where it is heated-up above melting temperature before it is placed on a printing bed layer by layer. In contrast to other AM methods like sinter, binder or light curing, extrusion processes have the advantage that continuous thermoplastic strands are processed. This facilitates the integration of continuous and oriented fibers. Methods for the integration of continuous fibers can be differentiated depending on when fibers and matrix are merged:
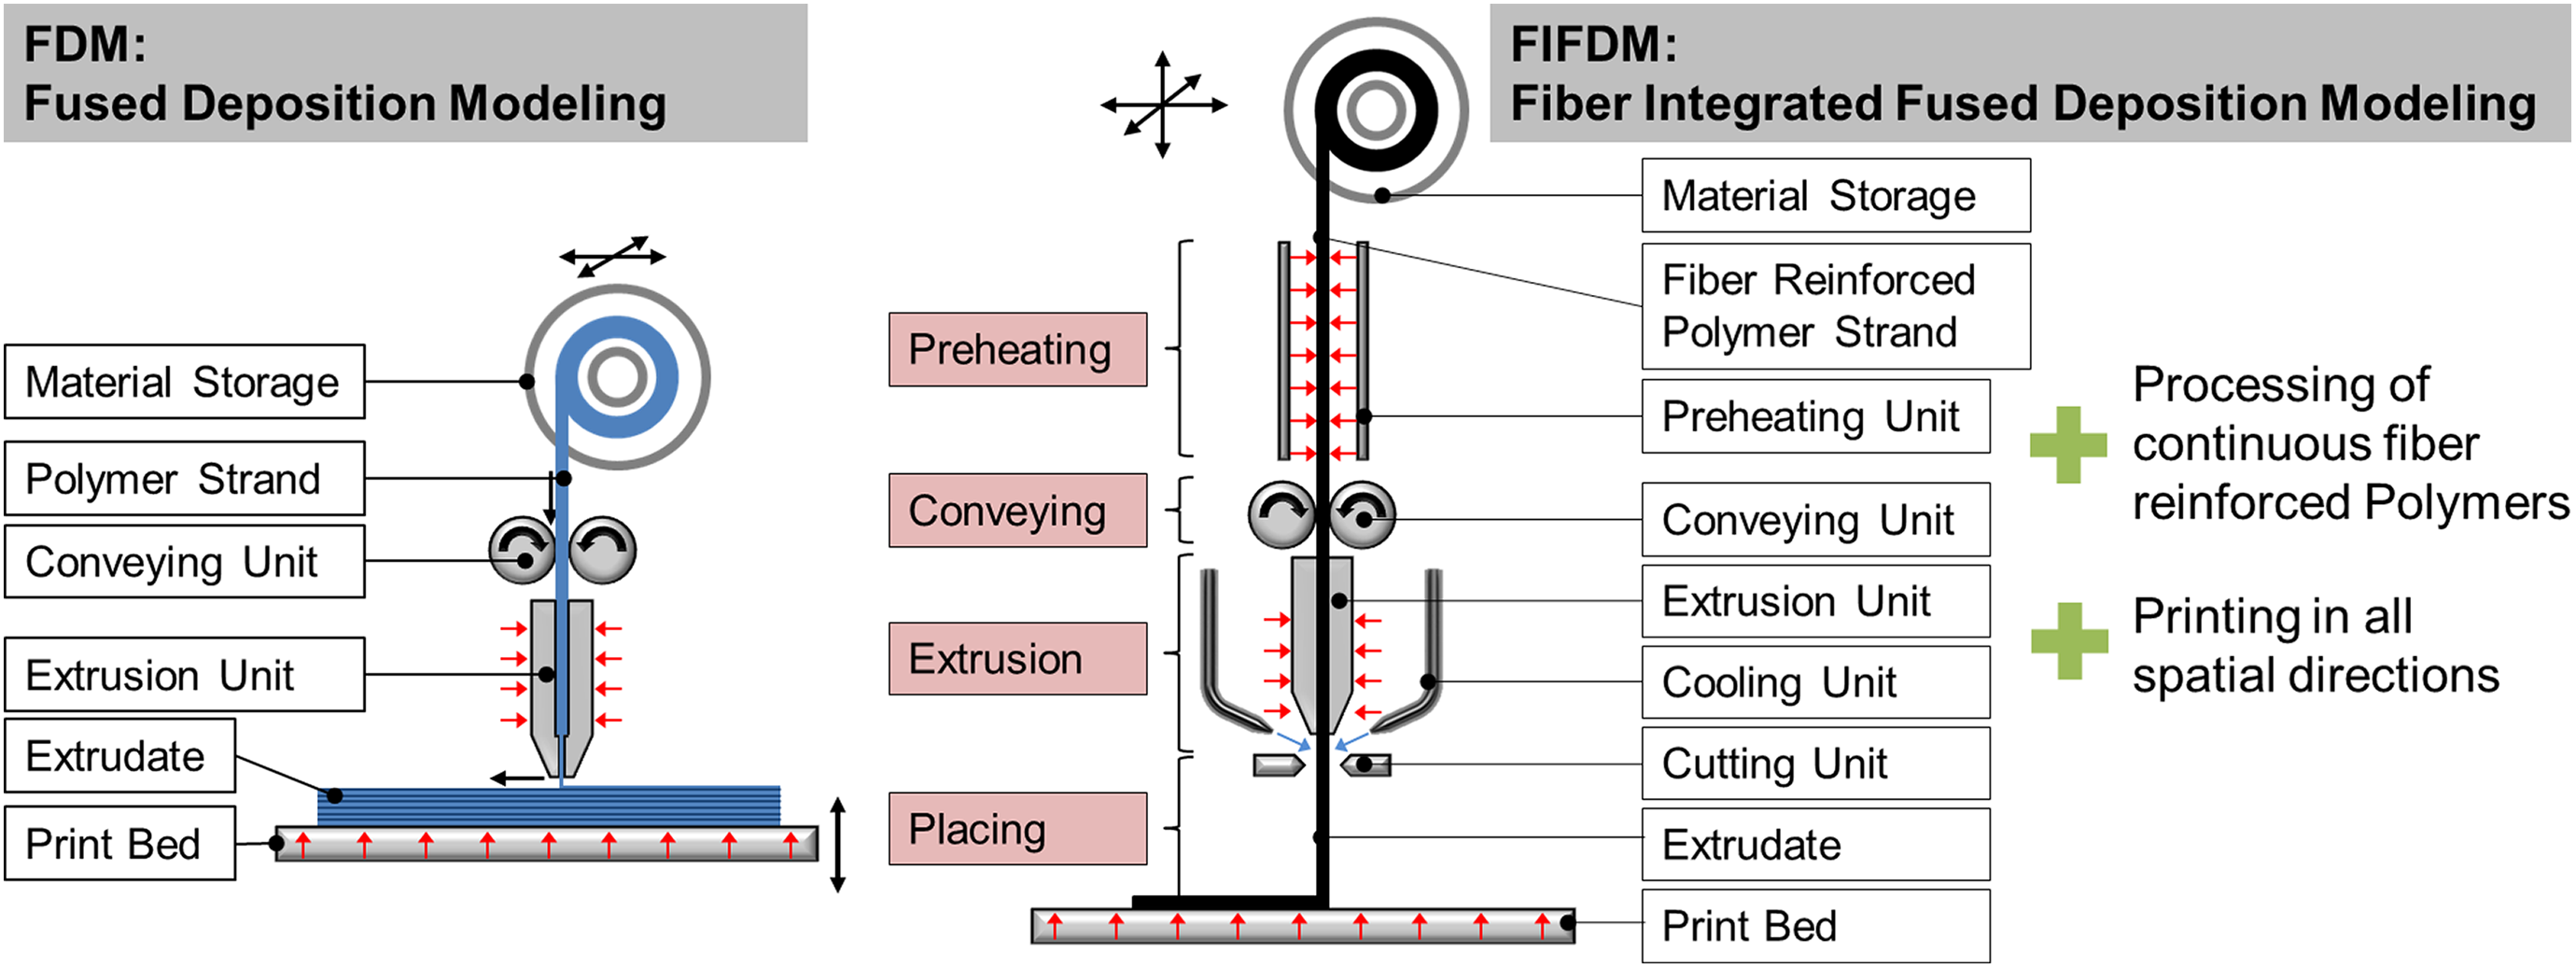
Schematic of FDM (left side) and FIFDM process (right side).
Two companies already sell FDM-based 3-D printers with continuous fiber reinforcement. 21,22 Except for the study by Eichenhofer et al., 17 the screened processes are only able to place the extruded material in-plane.
Preliminary work regarding the FIFDM process
A concept for AM of continuous fiber reinforced thermoplastics was developed, the FIFDM.
23,24
This concept has two main features: Processing of continuous fibers: Almost fully impregnated and continuous FRTS are used as semifinished product for the process. Compared to the separate supply of fibers and polymer or commingled yarns, no impregnation step is required during the printing process. This allows high process speeds, high material output, and a high fiber volume content. Aligning of the reinforcement fibers not only in-plane, but in all directions of space. This is achieved by fast cooling of the polymer after leaving the print nozzle to prevent the structure from collapsing when placed into free space.
The FIFDM is also based on the FDM process. Figure 1 compares both processes schematically. The new approach requires fundamentally new developments of existing FDM technology. The extruder unit must allow the processing of continuous fiber reinforced semifinished products. To enable the printing into free space, a cooling unit is necessary. Due to the continuous reinforcement fibers, a cutting unit is also required for discontinuous placing. With a preheating unit, the heating time can be extended, increasing the process speed and material output.
For development of the FIFDM process, a 3-D printer from German RepRap, which is shown in Figure 2 on the left side, was rebuilt. To enable the processing of the FRTS, the extrusion unit was replaced by a newly developed extrusion unit, Figure 2, right side. It includes a print nozzle with a conical inner bore and a cylindrical outlet zone of 1.9 mm in diameter as well as a pressurized air-cooling system consisting of four cooling nozzles. The pressurized air (max. 6 bars) can be set by a throttle valve. With this setup and a FRTS consisting of continuous glass fiber reinforced polypropylene (GF-PP), the feasibility of the FIFDM process could be shown by printing a first demonstrator. 23
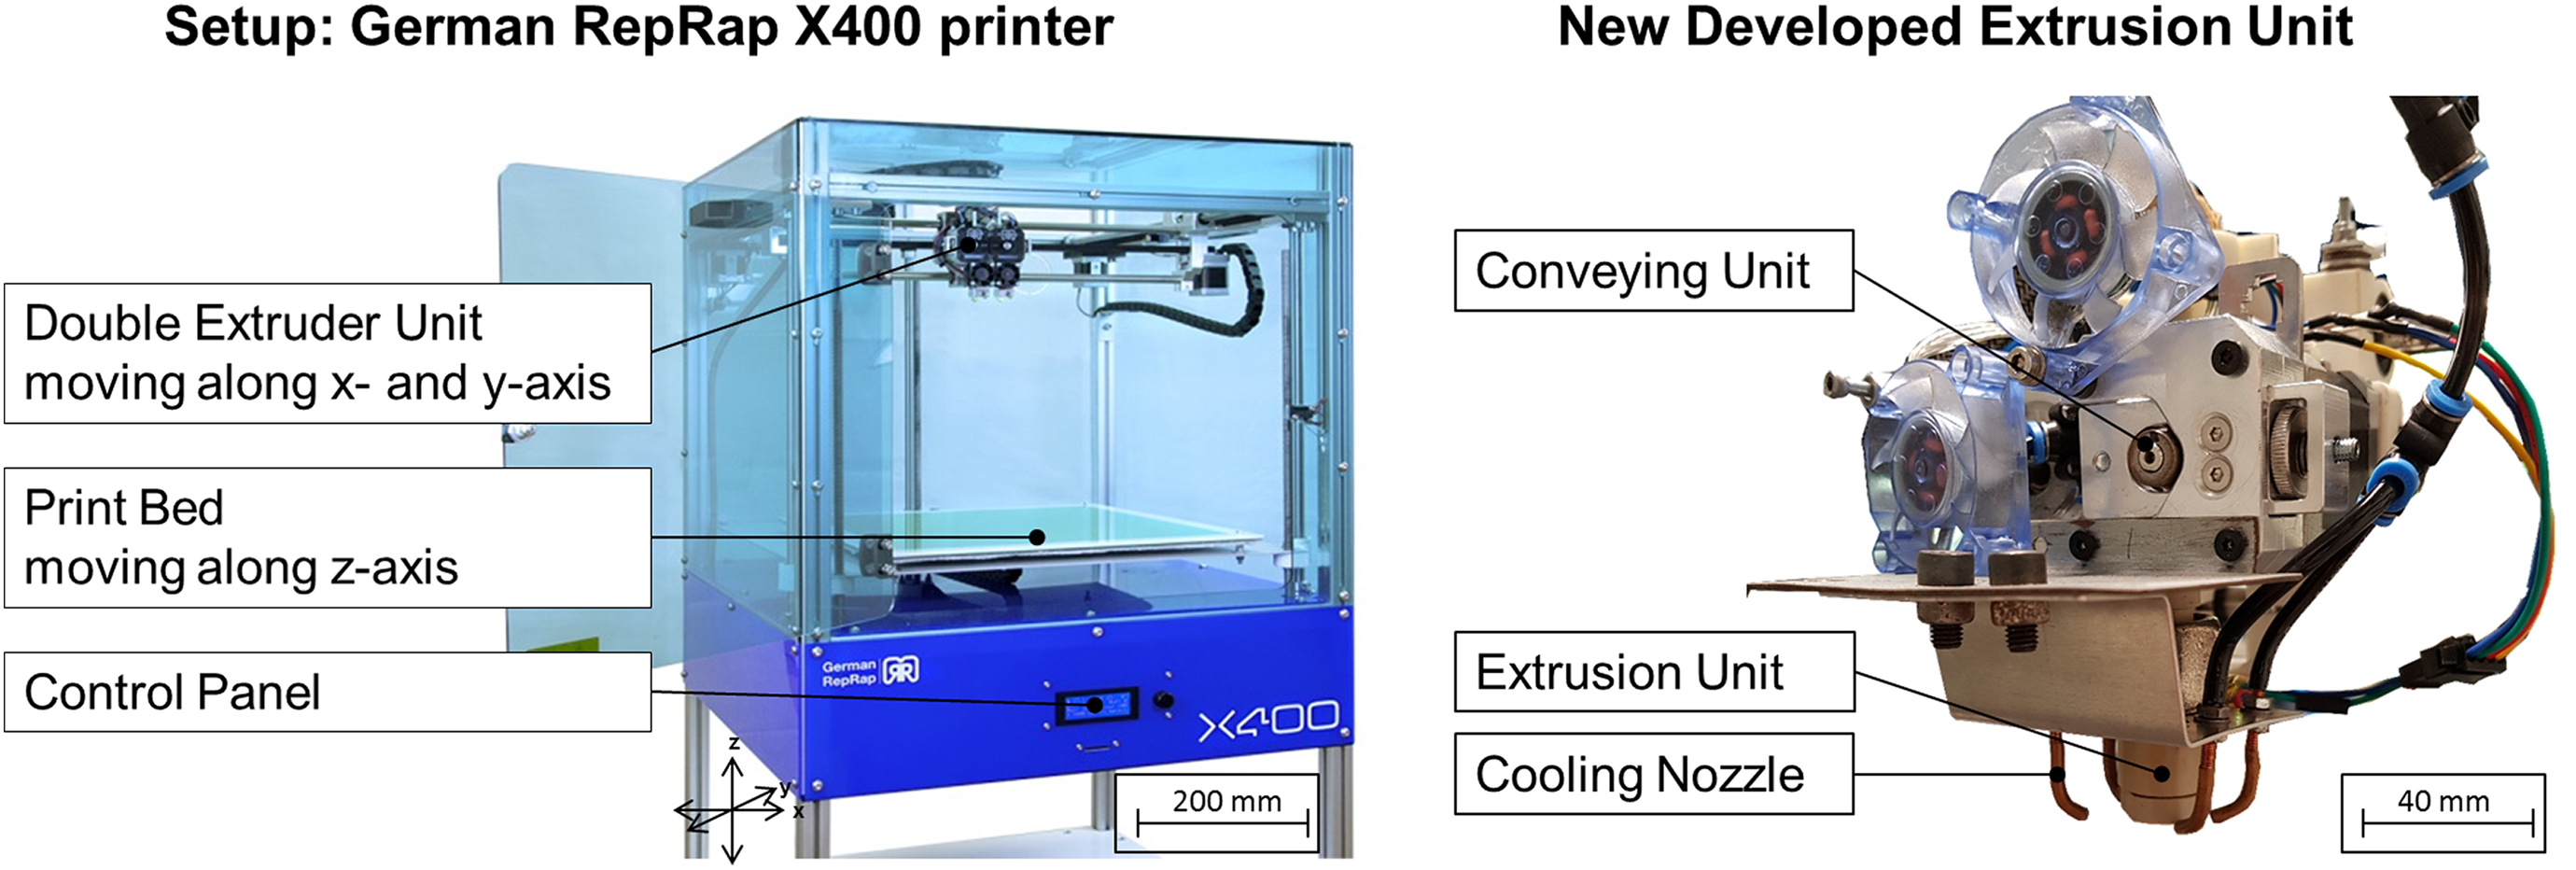
Experimental setup: 3-D printer (left side) and new developed extrusion unit (right side).
Principally, any thermoplastic polymer can be processed with the FIFDM concept. However, the maximum extruder temperature for the current FIFDM setup is limited to 300°C. A reasonable range for processable FRTS diameters is between 0.3 and 5 mm.
It was found that the biggest challenge of the process is the temperature control of the FRTS. To be able to simulate the temperature profile of the strand material for process design, a thermal finite elements model was built up. 23 Also, first mechanical characterizations of FIFDM printed samples were determined. 24
Quality analysis process for semifinished FRPC products
Quality management is an important tool for the planning, control, and constant improvement of the quality of processes, services, and products. This also includes the quality analysis of semifinished products used as input material for subsequent processing. 25 Even if certain defects can be compensated in downstream process steps, the quality of the semifinished product usually has a major influence on the quality of the final component. The quality analysis of the semifinished product can therefore play an important role for various process phases such as process development, the selection and qualification of semifinished products, and incoming material inspection during the running process. To ensure good comparability between semifinished products, it is advantageous to define general standards. Since many companies in the FRPC sector shy at this comparability for reasons of competition, such standards only exist for very isolated areas of the FRPC sector. Usually, only individual company-internal quality analysis procedures are used. Standardized methods for determining the quality of FRPC semifinished products are available, for example, for textile semifinished products such as glass mats, 26,27 woven fabrics, 28,29 and multiaxial fabrics, 30,31 or ready-to-mold materials such as sheet molding compound, bulk molding compound, 32,33 and glass-mat-reinforced thermoplastics. 34,35
However, especially for thermoplastic semifinished products with orientated, continuous fiber reinforcement such as tapes and organic sheets, there are almost no standards or approaches for standardized quality processes. An exception is the quality index for thermoplastic tapes (QITT) 36 which is used to compare thermoplastic tapes with regard to their application in automated fiber placement (AFP) processes. Various quality criteria were identified and divided into the quality clusters macroscopic, microscopic, and mechanical, see Figure 3. For each quality criterion, a quantified quality value is determined using different methods of material analysis. The different quality values are finally mathematically linked to a single value, the QITT, according to Figure 3. The reduction to one numerical value allows a quick comparison of the quality and suitability of the tapes for the use in an AFP process.
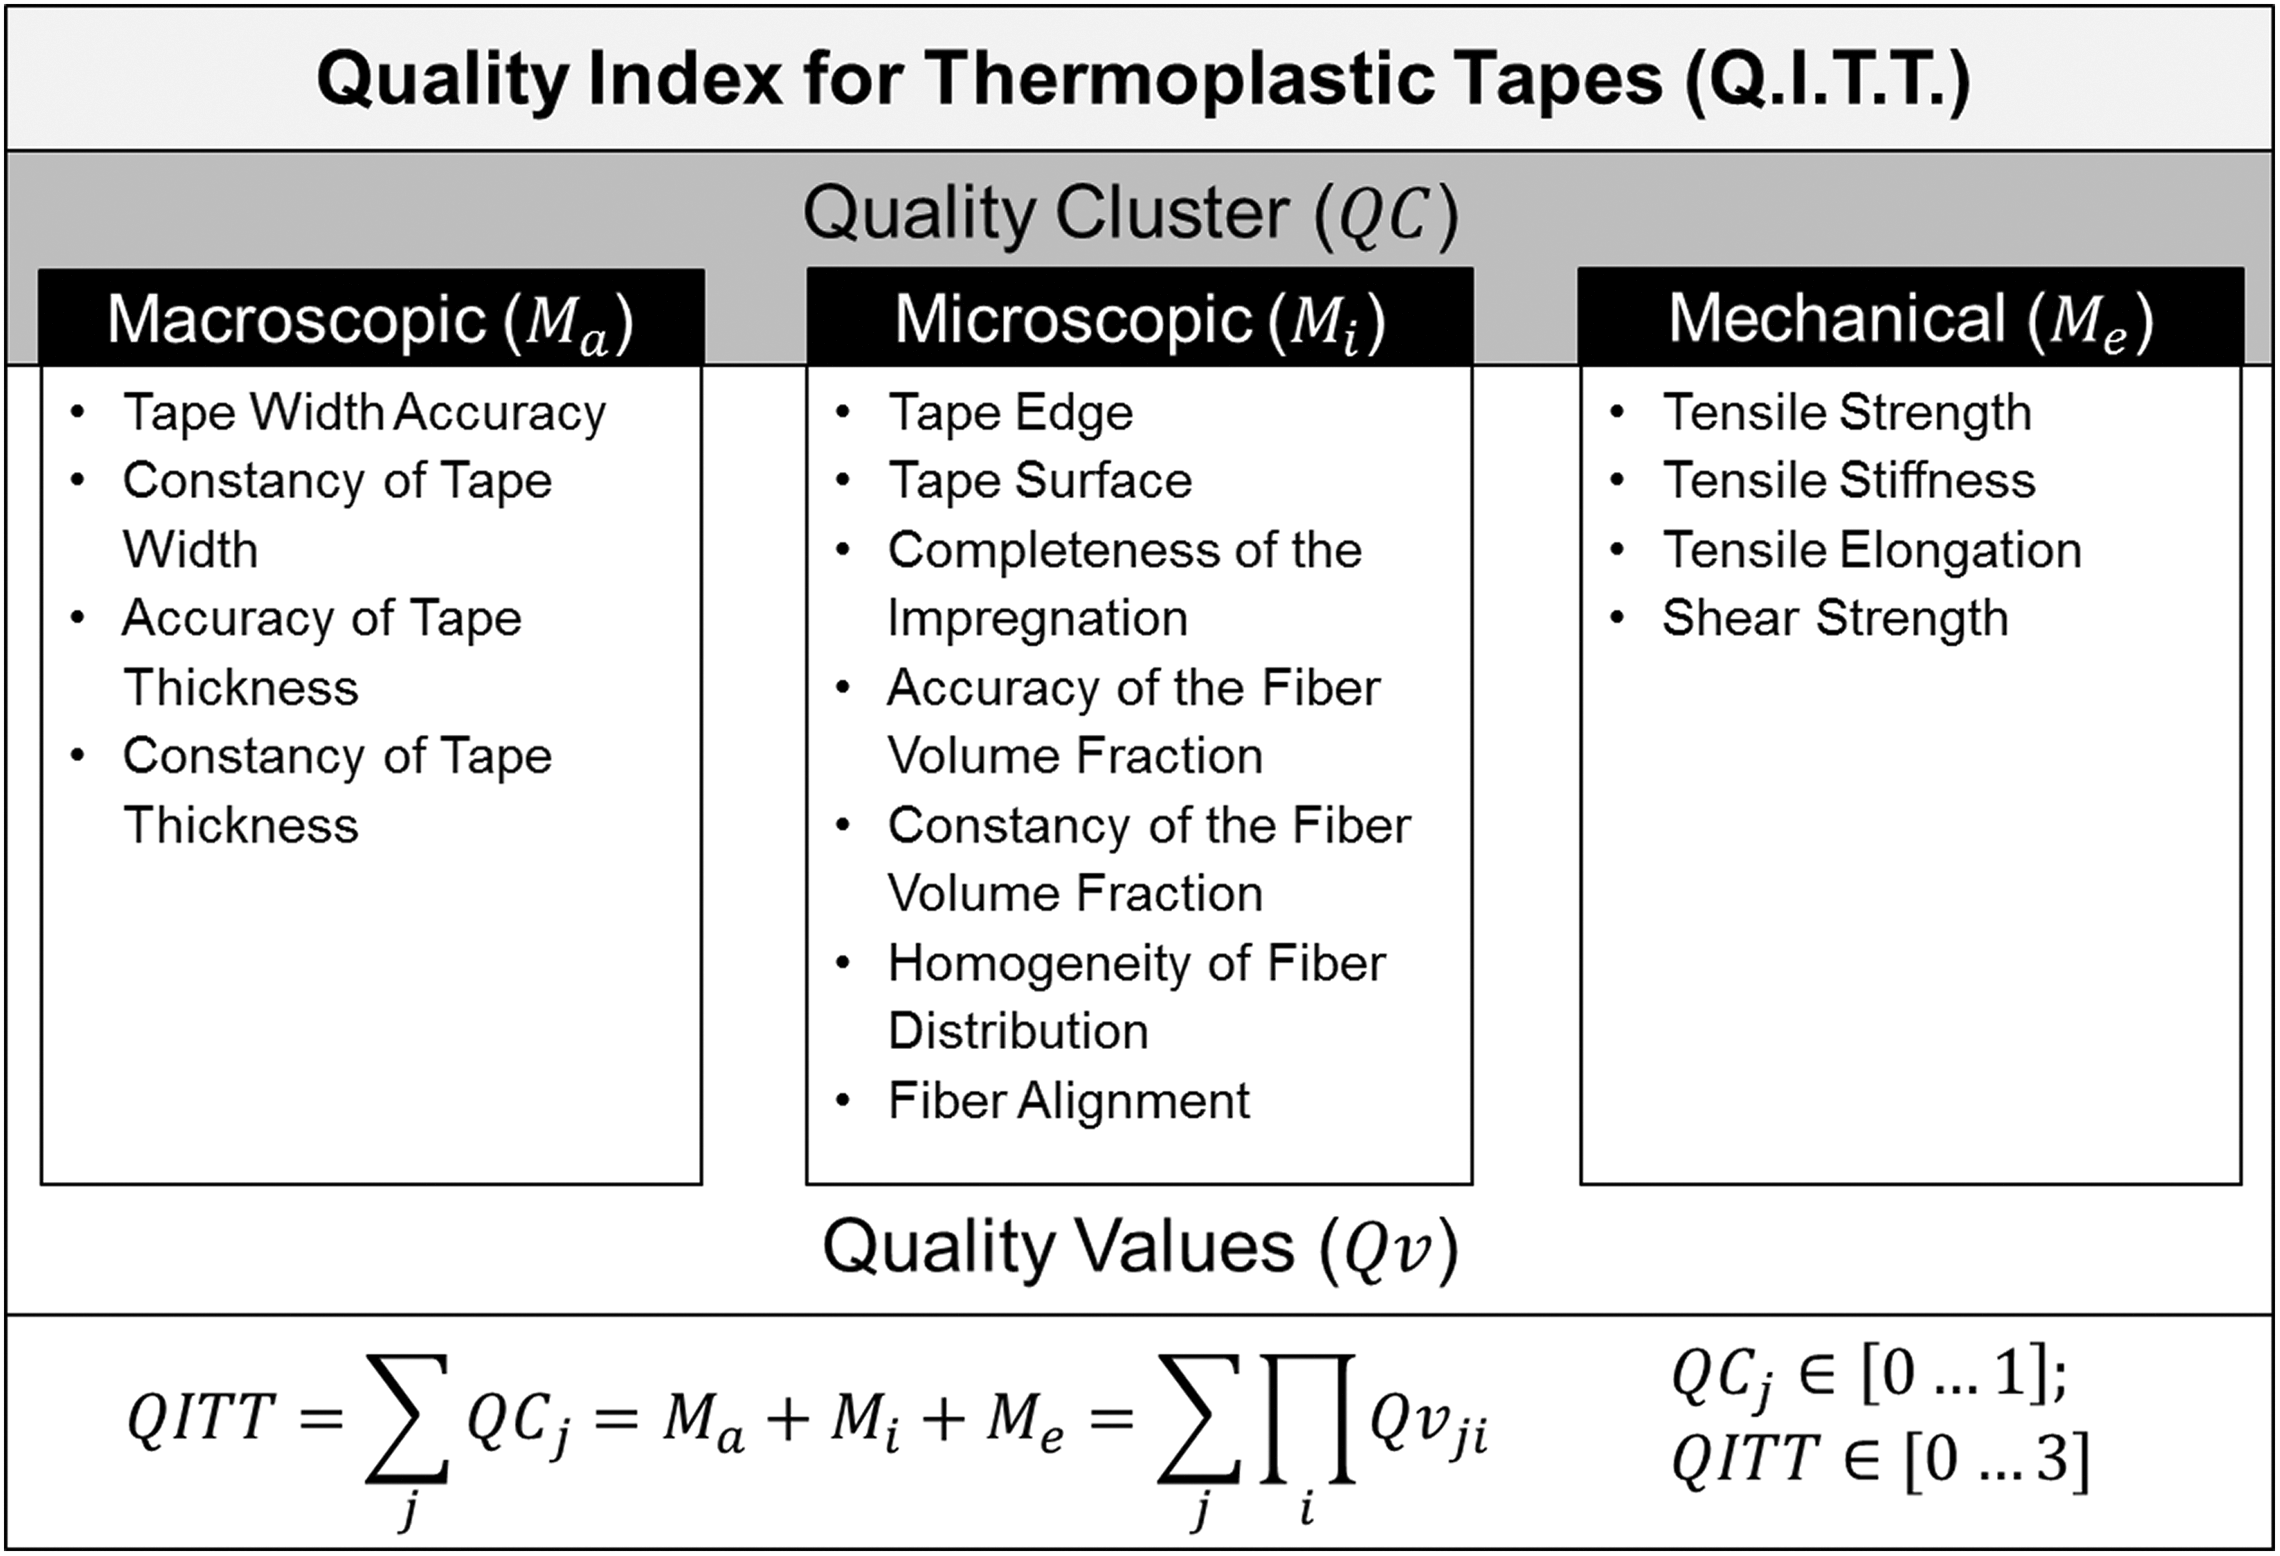
Quality analysis process for thermoplastic tapes according to Beresheim. 36
Mack et al. 37 developed a quality test rig based on the QITT for the automated determination and evaluation of the quality values tape width, tape thickness, and surface roughness. The tapes are rewound and measured via optical micrometers and laser scanners. This not only automates the measurement but also eliminates the influence of the operator.
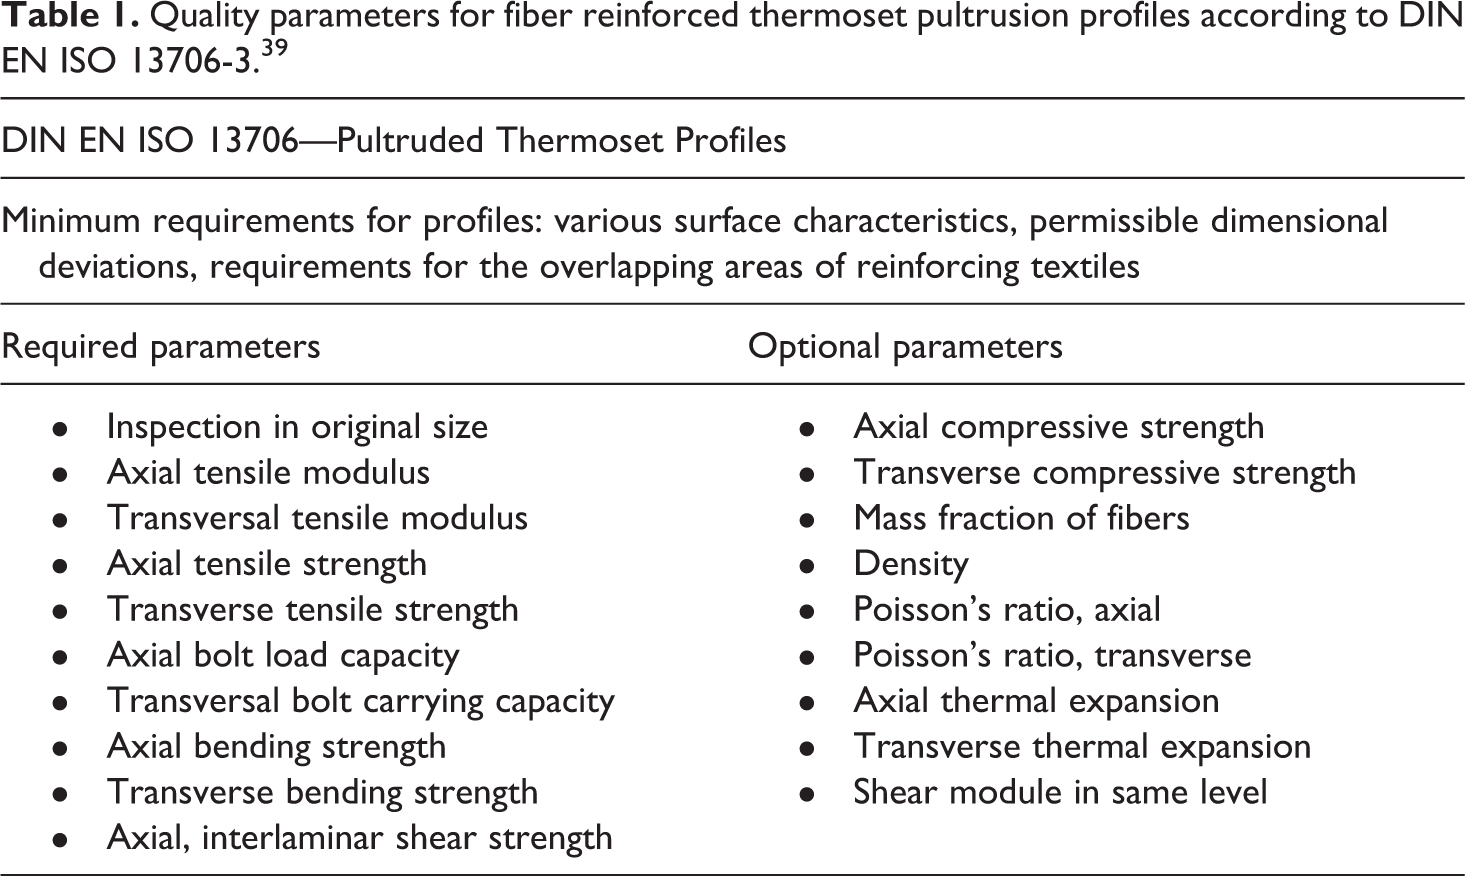
Standards for continuous fiber reinforced polymer strands can be found in the field of pultrusion. The standards DIN EN ISO 13706-2 38 and DIN EN ISO 13706-3 39 describe test procedures and general requirements for thermoset pultruded profiles. This also includes pultruded round strand profiles. Table 1 summarizes the quality parameters considered in this standard.
Quality parameters for fiber reinforced thermoset pultrusion profiles according to DIN EN ISO 13706-3. 39
For determining the quality and for simple comparison of FRTS, there is no method available so far. Based on the procedures and standards listed here, developments must therefore be made regarding geometric aspects and the use of the strands as semifinished products for further processing.
Objectives
The aim of this research is to develop a quality analysis method for continuous fiber reinforced polymer strands (QTS). This should enable: Comparison and evaluation of FRTS. Monitoring of quality fluctuations of FRTS. To enable the development of specific new FRTS.
To simplify the comparison of different semifinished products or batches, a single value should be assigned to each material at the end of the quality analysis process. Depending on the requirements of the process and the application, it should also be possible to weight the various evaluation criteria. By weighting, the QTS should also be transferable to various processes of continuous fiber reinforced polymer strands. The development of the QTS described in this article is carried out using the FIFDM process as application.
Quality analysis process
To enable statements about the quality of the polymer strands, meaningful quality criteria must be identified. Out of this, quality values with metric scale have to be determined for all quality criteria and mathematically combined to a quality index.
Process and application requirements
Requirements for FRTS arise primarily from the requirements of both the processing and the application. Based on the preliminary work, 23,24 the requirements for the FIFDM process and resulting requirements for FRTS are shown in Table 2.
Requirements for FIFDM process and resulting requirements for FRTS.
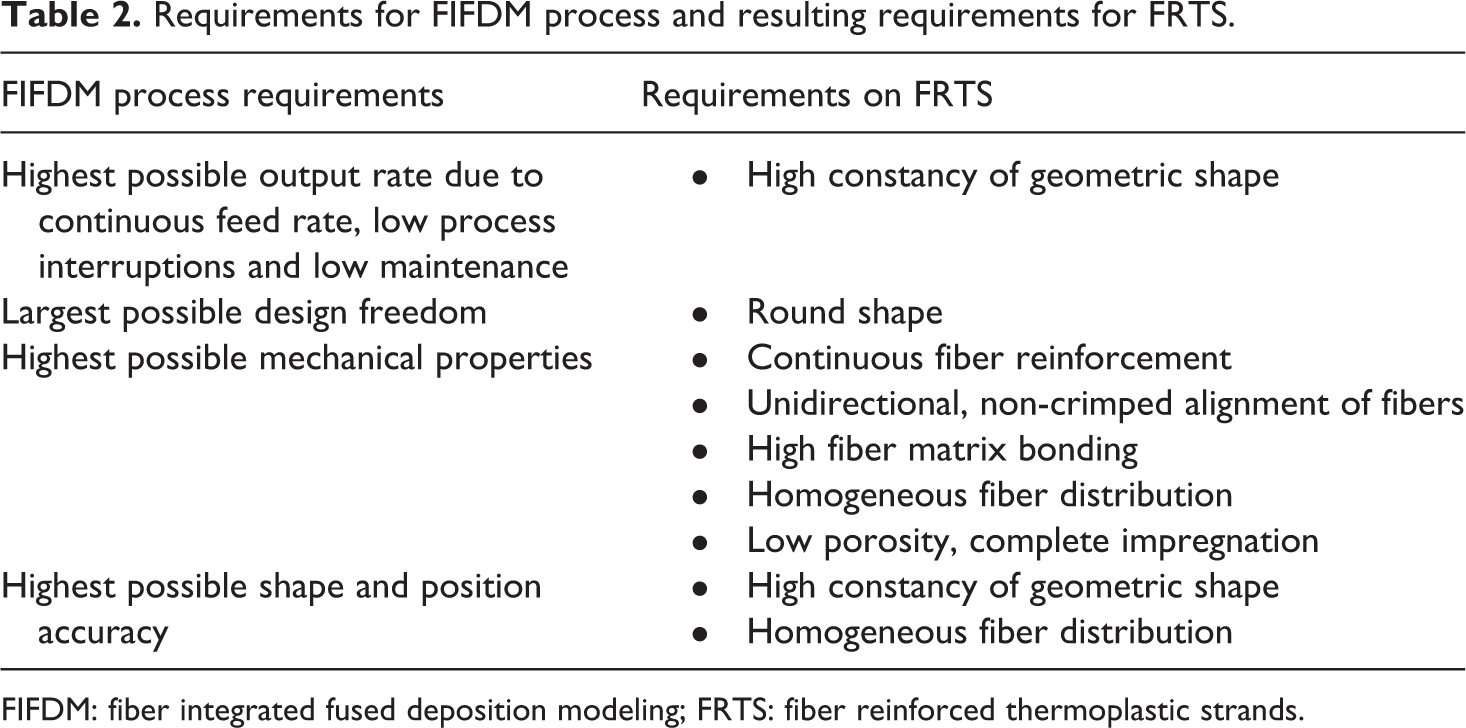
FIFDM: fiber integrated fused deposition modeling; FRTS: fiber reinforced thermoplastic strands.
To be considered as semifinished product for the FIFDM process, the requirements shown in Table 3 must at least be fulfilled.
Minimum FRTS requirements for FIFDM process.
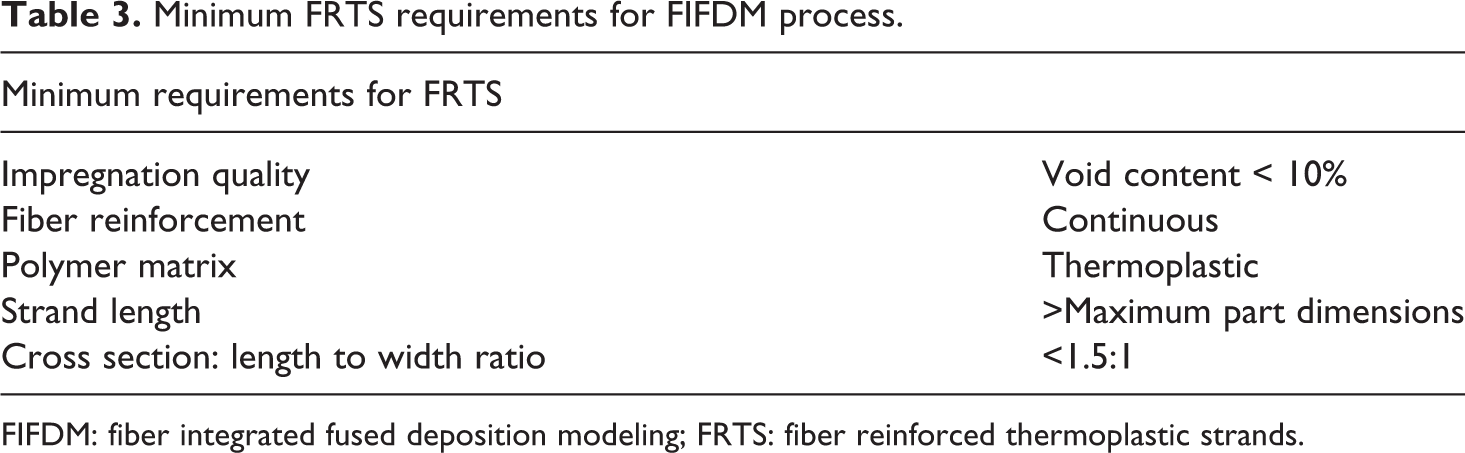
FIFDM: fiber integrated fused deposition modeling; FRTS: fiber reinforced thermoplastic strands.
Minimum requirements for impregnation quality and length to width ratio of the FRTS result from carried out tests and considerations regarding processability in the FIFDM process.
Identification of quality criteria
Based on the requirements in Table 2, the criteria used to evaluate the FRTS are determined. Therefore, the FRTS properties are divided into three categories: No-Go criteria: Limit values which must not be undercut or exceeded in order to allow the FRTS to be processed and used in general. For example, requirements shown in Table 3. Process design criteria: Material-specific properties of the composite which are important for the process design, but independent of the quality of the FRTS. For example, properties of neat polymers and fibers. Quality criteria: Properties that have an influence on the processing and are independent of the materials used. This means that the criteria, despite the use of the same type and amount of polymer and fibers, lead to different results in processing.
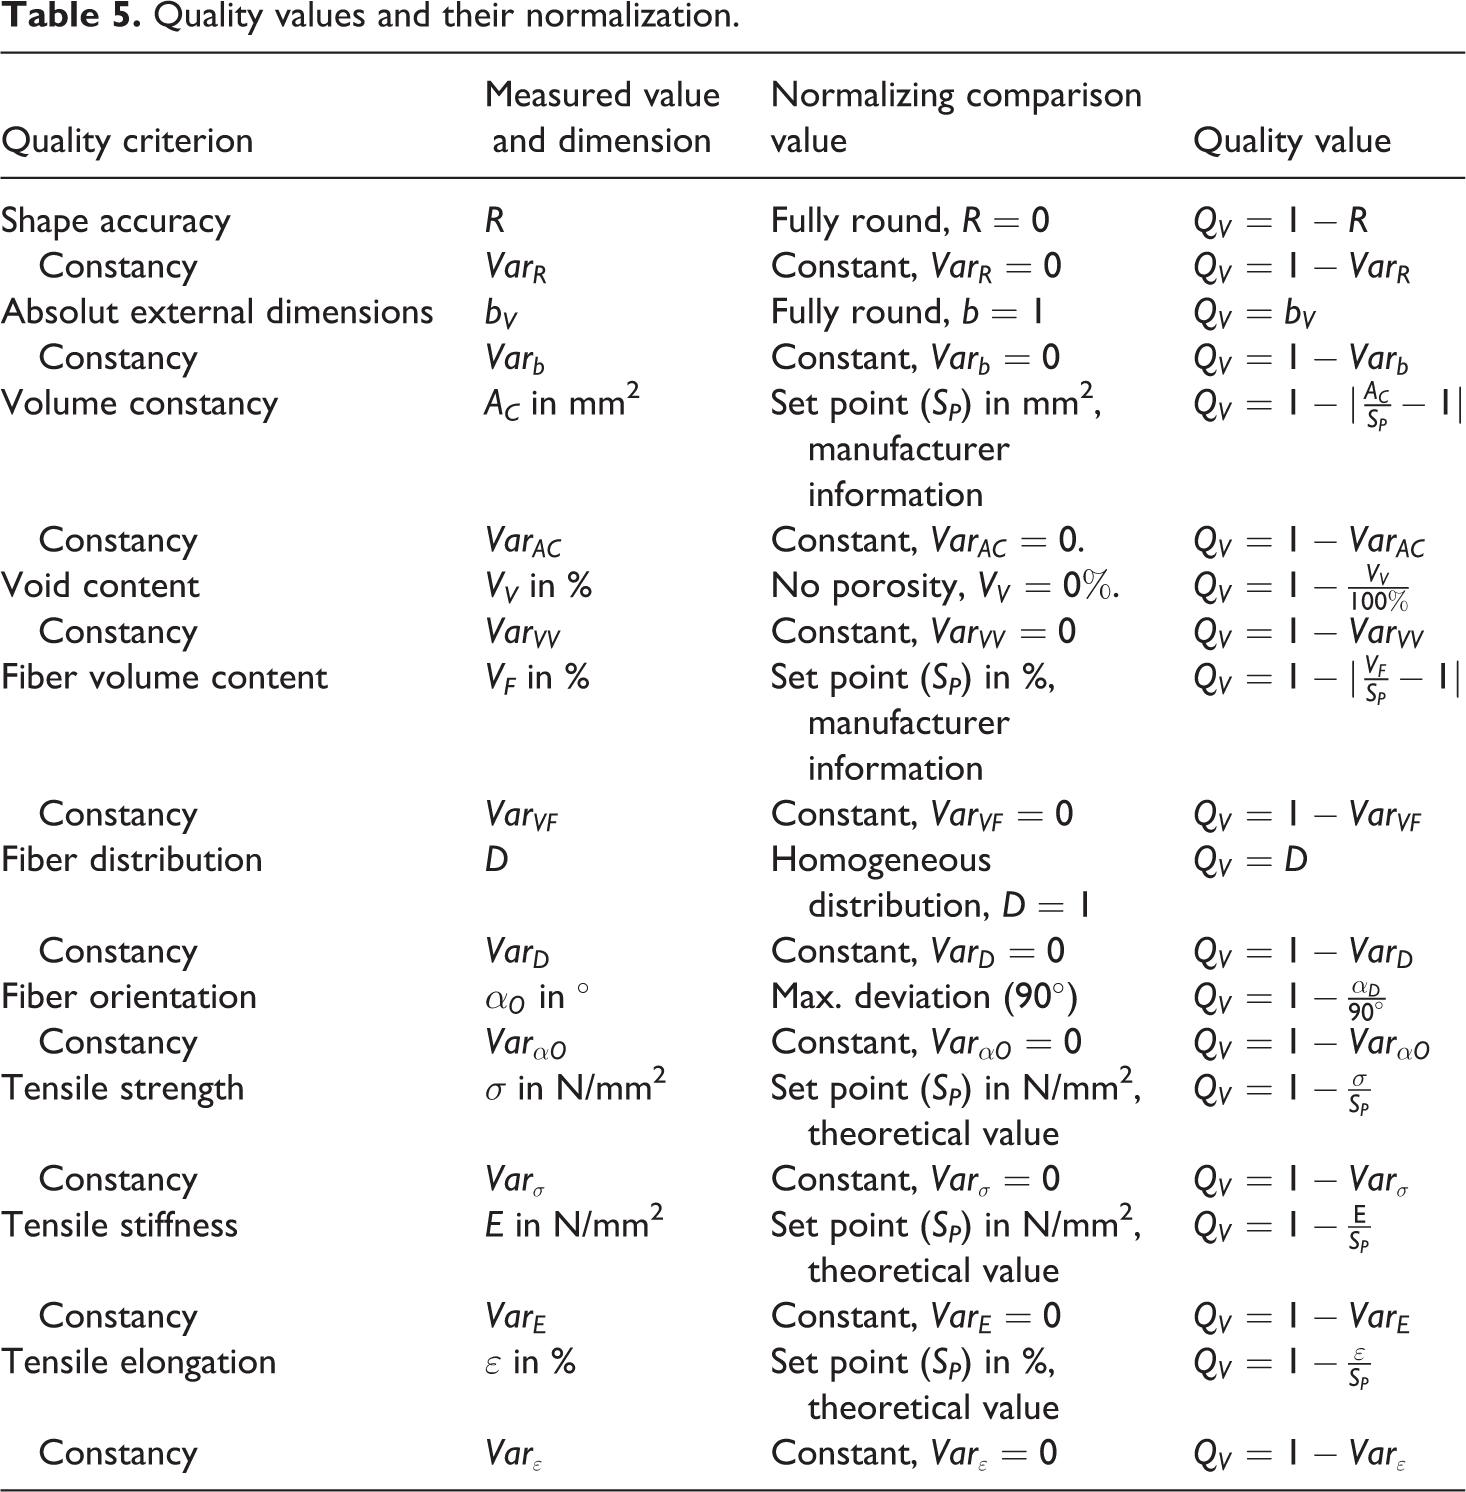
Since the first two criteria are strongly dependent on the process and application, only the third category, quality criteria, is included in the QTS. Relevant FRTS quality criteria and their influence on further processing and quality of the printed product are presented below: Shape accuracy: Describes the deviation of the outer geometry of the strand cross section from the desired profile geometry. In case of the FIFDM process, the extrusion nozzle has a round exit to achieve the greatest possible design freedom. The desired profile geometry of the extruded semifinished product for the FIFDM process is therefore a circle. The shape accuracy thus describes a deviation of the roundness of the circle. On the one hand, a deviation in roundness can lead to forming work within the nozzle and associated slower process speeds. On the other hand, material might shear off at the nozzle inlet, which leads to deposits at the nozzle edge and fiber breakage. Also, the heat input per time into the FRTS is influenced by contact surface between nozzle and strand. Furthermore, changes in the cross-sectional shape affect the contact pressure of the conveying rollers, which causes slippage and thus fluctuations in the conveying speed. Absolute external dimensions: Describes the minimum and maximum dimensions of the profile geometry of the strand. In case of circular profile geometry, there is automatically a widest and a narrowest point if the strand is not optimally round. As the strand is usually clamped in the narrowest area between the rollers in the conveying unit, the narrowest width of the strand is an indicator of slippage in the conveying unit. The maximum width, on the other hand, is a measure of compatibility with the nozzle geometry. Volume constancy: Considers the deviation of the cross-sectional area over the strand length. The effects on the FIFDM process do not differ significantly from those caused by the deviations in shape accuracy. However, it must be distinguished whether the cross-sectional fluctuations are due to voids or to a mass change of polymer or fibers. In the second case, large diameters can lead to nozzle blockage. Smaller diameters can cause gaps between the placed strands. Void content: The void content provides information about the completeness of the impregnation and the consolidation of the FRTS. Voids are gas or unfilled gaps in the FRPC. The void content can influence the diameter of the FRTS. In addition, it reduces the thermal conductivity of the FRTS and thus the heating speed. In the printed product, voids also represent material defects that reduce the mechanical properties. Even though voids might be closed during processing in the nozzle, this requires sufficient time, pressure and temperature, which limits the process speed. Fiber volume content: Fibers are the load-carrying element in the FRTC. Therefore, the quantity of fibers is responsible for the mechanical properties of the subsequent product. Fiber orientation: The orientation of the reinforcing fibers in the FRTS has a significant effect on the mechanical properties of the FRTC part due to their geometrical related anisotropic behavior. Even small deviations between fiber and load direction can result in a significant reduction of mechanical properties. Since a targeted rearrangement of the fiber orientation in the existing FRTC is not possible during the processing, the fibers in the FRTS should already be as straight and aligned in the strand direction as possible. Fiber distribution: For universal applicability of the semifinished FRTS products, the fiber distribution should be as homogeneous as possible. Furthermore, exposed fibers at the edge increase the friction within the extrusion nozzle, which complicates strand conveying and results in increased wear of the nozzle. Fibers at the edge of the strand can also be damaged at the conveying unit or the extrusion nozzle. Mechanical properties: Are a measure of the quality of the composite. For the strands of the FIFDM process, only the tensile strength, stiffness, and elongation are taken into account due to the feasibility of the test methods. Compared with the theoretically achievable tensile properties of the fibers, they are an indication of damaged fibers.
Table 4 summarizes the quality criteria and the findings they provide with regard to FPRS properties, further processing, and the later product.
Quality criteria of FRTS and their influence on process and final product.
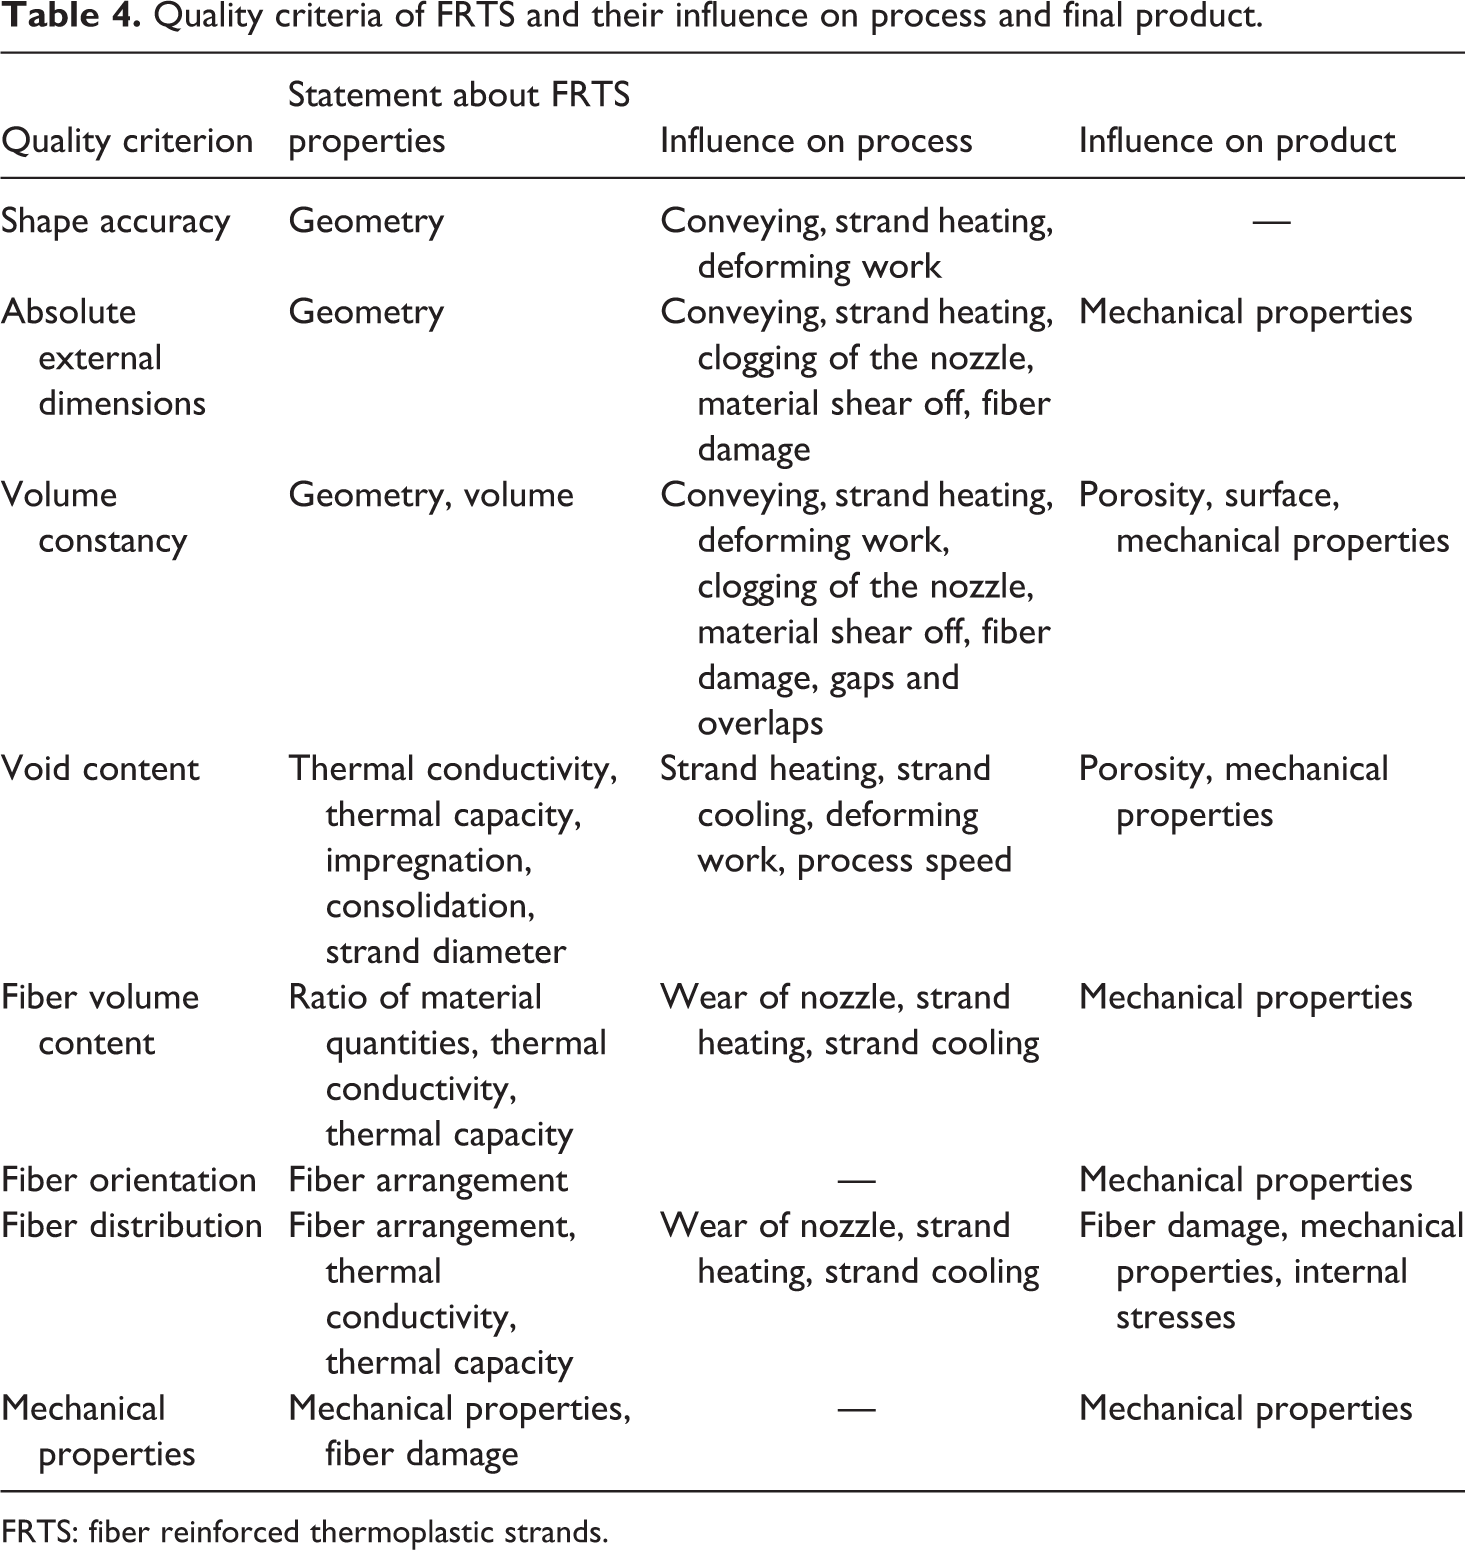
FRTS: fiber reinforced thermoplastic strands.
Analysis methods for quantifying the quality criteria
Appropriate analytical methods are required to convert the quality criteria into quantifiable quality values. Therefore, random measurements should be taken at certain intervals over a wide range of the strand length. To prevent the measurements from being falsified by systematic process influencing variables, the distances between the measurements can also be chosen randomly.
Two quality values can be attributed to each quality criterion from Table 4. On the one hand, the respective target value, which is determined by the arithmetic mean over all measurements and related to an optimum value. On the other hand, the constancy of the respective target value, defined by the coefficient of variation

The majority of the analysis methods presented in the following are performed at the cross section of the strand. This requires the preparation of micrographs. Varidur 3003 from Buehler (Uzwil, Switzerland) and KEM 15 plus from ATM (Mammelzen, Germany) were used as embedding resin. With Struers (Willich, Germany) grinding and polishing machines, the samples were gradually ground down to a grain size of P4000 and polished with 3 and 1 µm diamond dispersion. It is important that the prepared cross-sectional plane is as perpendicular as possible to the direction of the strand. Images were taken with the DM6000 M microscope from Leica (Leica Camera AG, Wetzlar, Germany). Evaluation was carried out with the analySIS docu software from Olympus (Tokyo, Japan).
Volume constancy
To determine the volume constancy, the cross-sectional area AC of the FRTS is measured. Using a micrograph image, the contour of the FRTS cross section can be reproduced by manually placing points on the strand circumference and connecting them by straight lines. The surface area is calculated from the closed area created in this way.
Shape accuracy: roundness
According to DIN EN ISO 1101, 40 roundness is defined as the difference between two centered circles, with a minimally large circle that completely encloses the area to be measured and a maximally large circle that lies completely within this area. Based on that, roundness can be determined using various methods: the least square circle, the minimum circumscribed circle, the maximum inscribed circle, and the minimum zone circle. 41,42 However, the disadvantage of this definition is that only the maximum deviations from roundness are taken into account. This means that individual low-mass bulges can strongly influence the roundness value. With regard to the processing of the FRTS through a nozzle, however, these hardly represent any forming work and thus no major restriction for the process. Therefore, a new method for determining the roundness consisting of two different sub-criteria has been developed. These require the calculation of the cross-sectional area and its centroid of the FRTS using micrographs. An equivalence circle with equal area as the cross-sectional area is placed in the cross section with the centroid as center point. Figure 4 illustrates the sub-criteria.
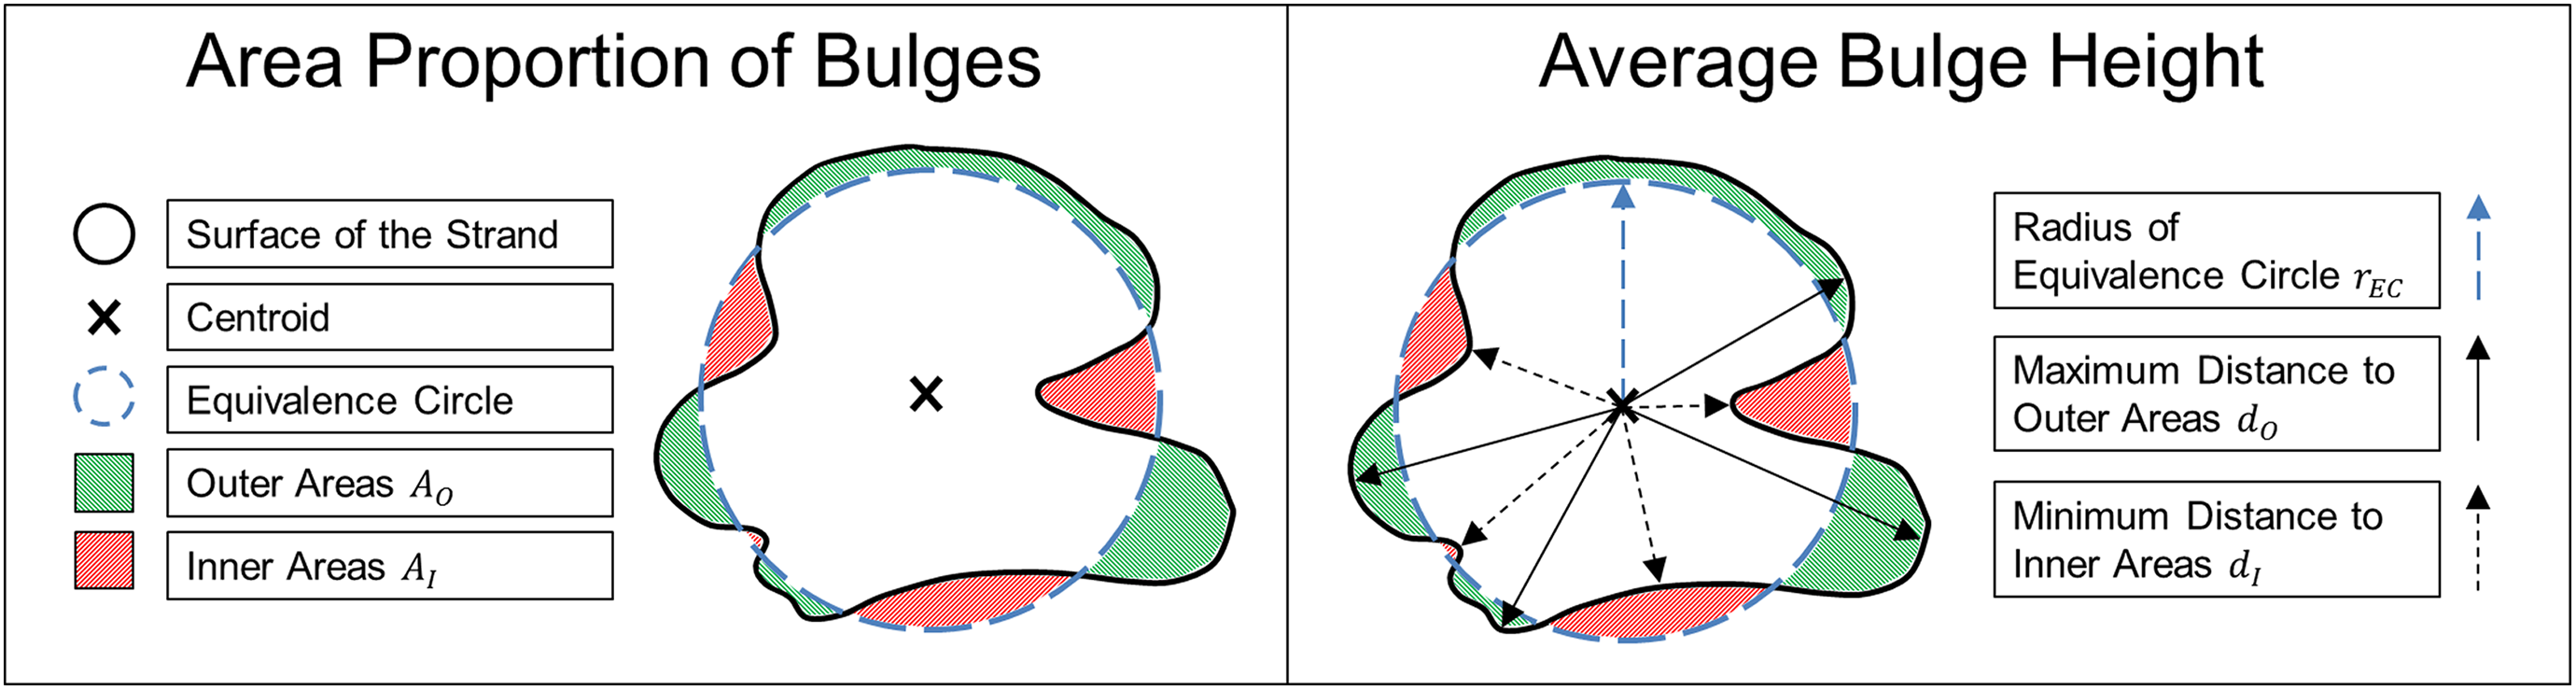
Determination of roundness.
Area proportion of bulges AB: The cross-sectional areas that are located outside the equivalence circle AO or the areas in the circle that are not belonging to the FRTS AI are summed up each and related to the total cross section AC, as seen in formula (2)
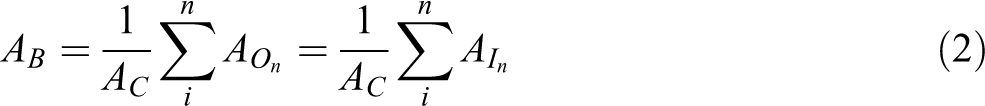
Average bulge height hB: The maximum distance of positive dO and the minimum distance of negative areas dI to the centroid are determined and their difference to the radius of the equivalence circle
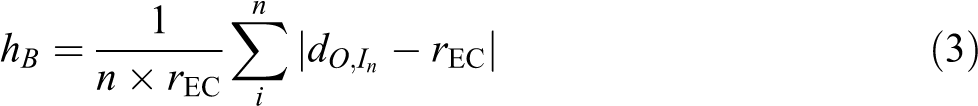
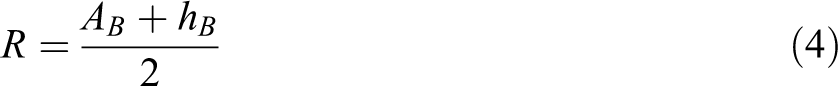
The roundness R in this article is defined as mean value of both sub-criteria, see formula (4)
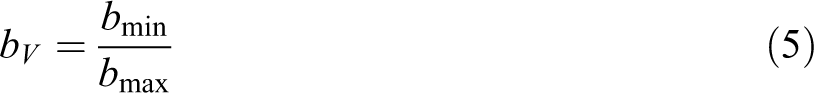
Absolute external dimensions
With a caliper gauge, the minimum and maximum width is measured at certain points of the FRTS. The variation of the strand width bV results from the quotient of the minimum
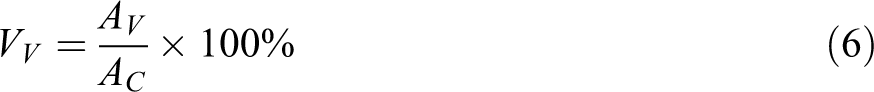
Void content
In this article, the void content VV is determined by gray scale analysis using microscope images on microsections as shown in Figure 5. In gray scale analysis, the difference in contrast between fibers, matrix and voids is used. Threshold values can be used to determine the area portion of the same gray value range with regard to the total strand. According to formula (6), the void content is calculated from the quotient of void area AV and cross-sectional area AC

Determination of fiber volume content and void content by gray scale analysis.
In strict terms, the measurement on a cross section is not a void volume but a void area. However, the void volume can be determined by repeating measurements at several points over the length of the strand and averaging the void contents. Disadvantage of the gray scale analysis is the comparatively high inaccuracy of up to ±5% according to experience. This is mainly due to manual setting of the threshold values and micrograph defects such as fiber breakouts and scratches that can occur during sample preparation.
Fiber volume content
There are several ways to determine the fiber volume content:
Determination of the total mass of the FRPC in relation to the mass of the fibers separated by solvolysis or pyrolysis.
Determination of the density of the FRPC compared to the densities of the components.
Direct determination via microscope or CT images using gray scale analysis.
In this work, the method of gray scale analysis is carried out analogously to the void content, see Figure 5. The main reason for this are synergies with the evaluation of the other quality criteria, since more than half of the quality criteria are evaluated using micrographs. The fiber volume content VF is calculated according to formula (7) from the quotient of the fiber area AF to the cross-sectional area

Fiber distribution
To determine the fiber distribution, the strand cross section is again examined using micrographs. The fiber areas are differentiated from the rest of the strand by gray scale analysis. The fibers are homogeneously distributed over the cross section if all adjacent fibers have the maximum possible equal distance from each other. To determine the geometric position of the fibers in a round cross section, the fiber position is described using a polar coordinate system. A polar coordinate system is a two-dimensional coordinate system in which each point is defined by the distance to a fixed origin point, the radial coordinate r, and an angle to a fixed direction, the angular coordinate ϕ, see Figure 6. All points on a circle centered in the origin have the same radial coordinate, while all points on a straight line through the origin have the same angular coordinate. The analysis of the fiber distribution is carried out separately for radial and angular coordinates. To reduce the evaluation effort, the strand cross section is divided into discrete areas, see Figure 6.
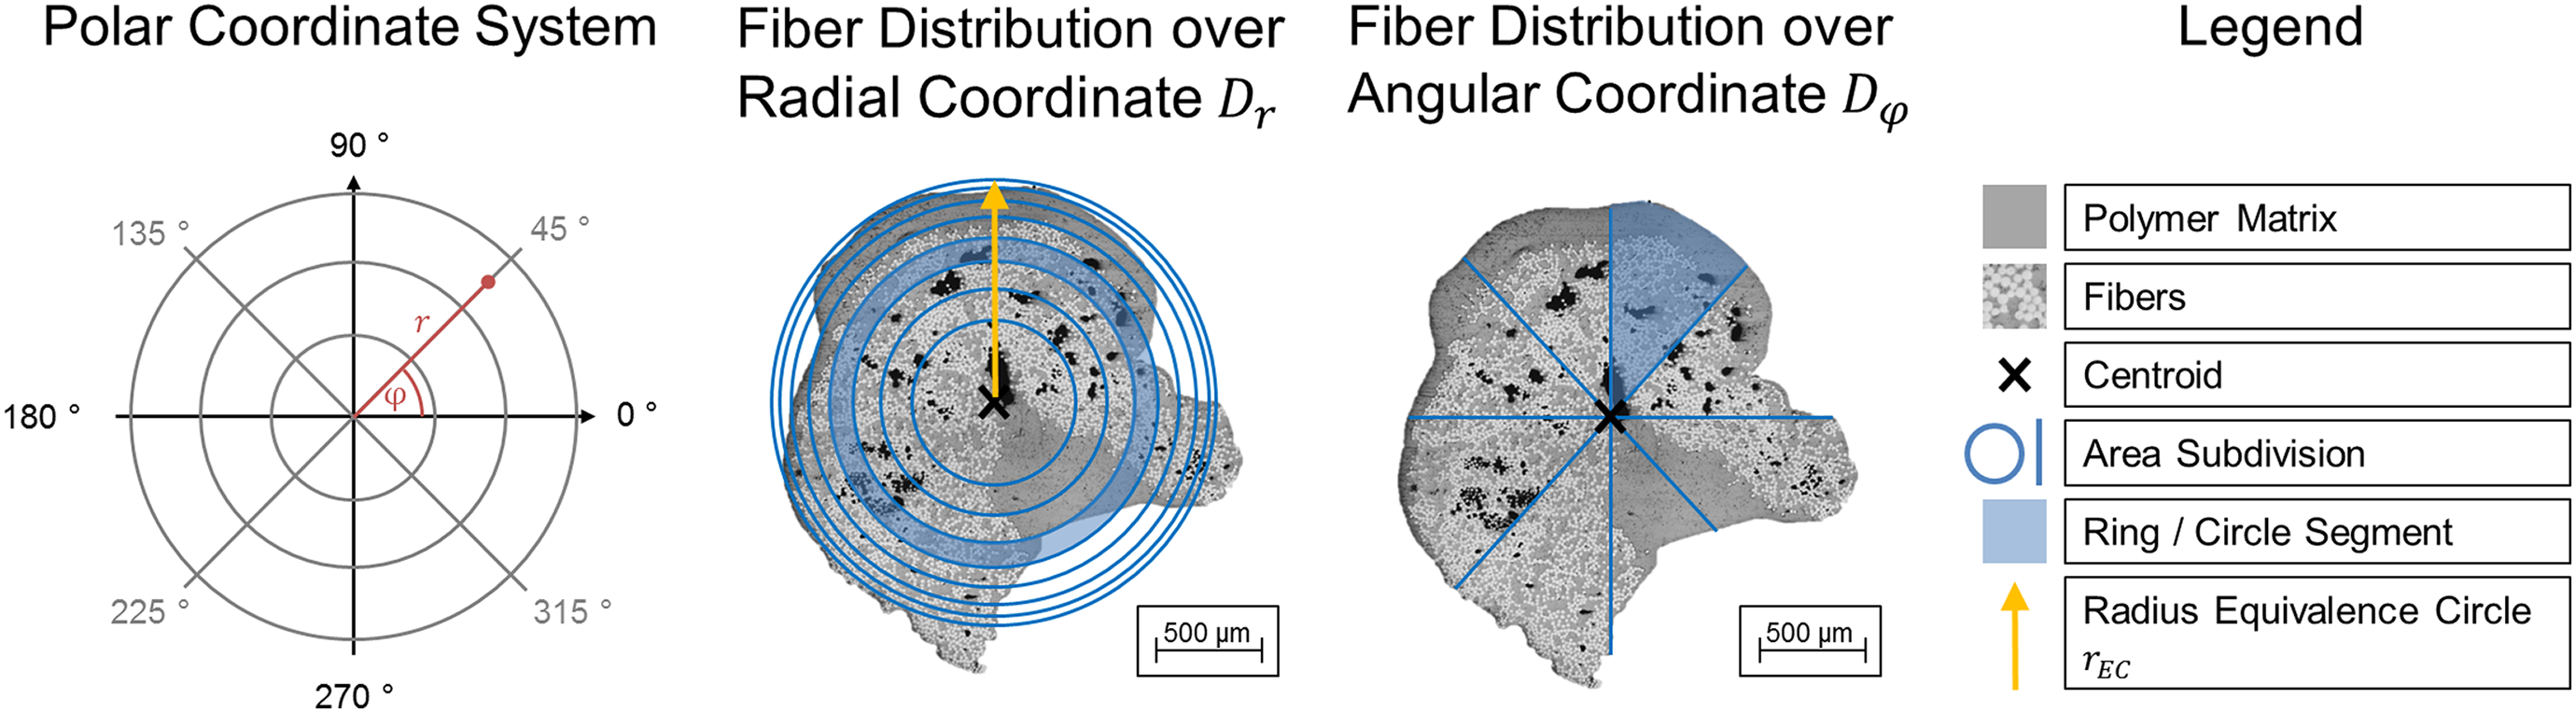
Determination of fiber distribution.
Distribution of the fibers over the radial coordinate Dr: The cross section is being divided into an inner circle and several rings with increasing radius. The outer radius of the largest ring corresponds to the equivalence circle of the FRTS. The inner circle and the rings are all equal in area and all centered in the centroid of the cross section. According to formula (8), the fiber areas of the inner circle and the rings
Distribution of the fibers over the angular coordinate
According to formula (10), the criterion fiber distribution D is defined as mean value of both sub-criteria
Fiber orientation
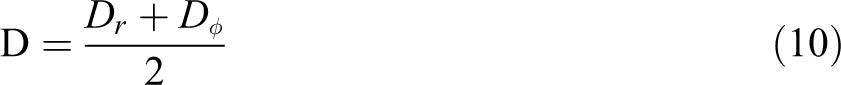
Since micrographs represent only an area and no volume, the fiber orientation must be determined by computer tomography (CT). In the case of carbon fibers, this method can only be used to a limited extent due to the poor contrast. Here, a determination could be made about the change of the centroid of the fiber area in cross section over the strand length. In this work, CT images were taken with a nantom 180NF Micro-CT scanner from GE Phoenix (Boston, USA) on 15 mm long strand sections with a resolution of 7 µm. The evaluation was carried out with the help of the software VGStudio Max (version 3.2; Volume Graphics, Heidelberg, Germany). For fiber orientation, as with voids and fiber volume content, a gray scale analysis is performed to distinguish the volume ranges of the fibers from those of the matrix and the voids. A Cartesian coordinate system of three planes is placed manually in the 3-D scan, one plane intersecting the strand vertically and the other two planes running parallel to the strand and intersecting in the strand axis. A 3-D mesh is placed over the scan of the strand. The direction of the fiber components in each resulting small volume element is referenced to the strand axis. In this way, the fiber angle
Example of a CT image of a FRTS with histogram of the fiber orientation.
Mechanical properties: tensile strength/tensile stiffness/tensile elongation
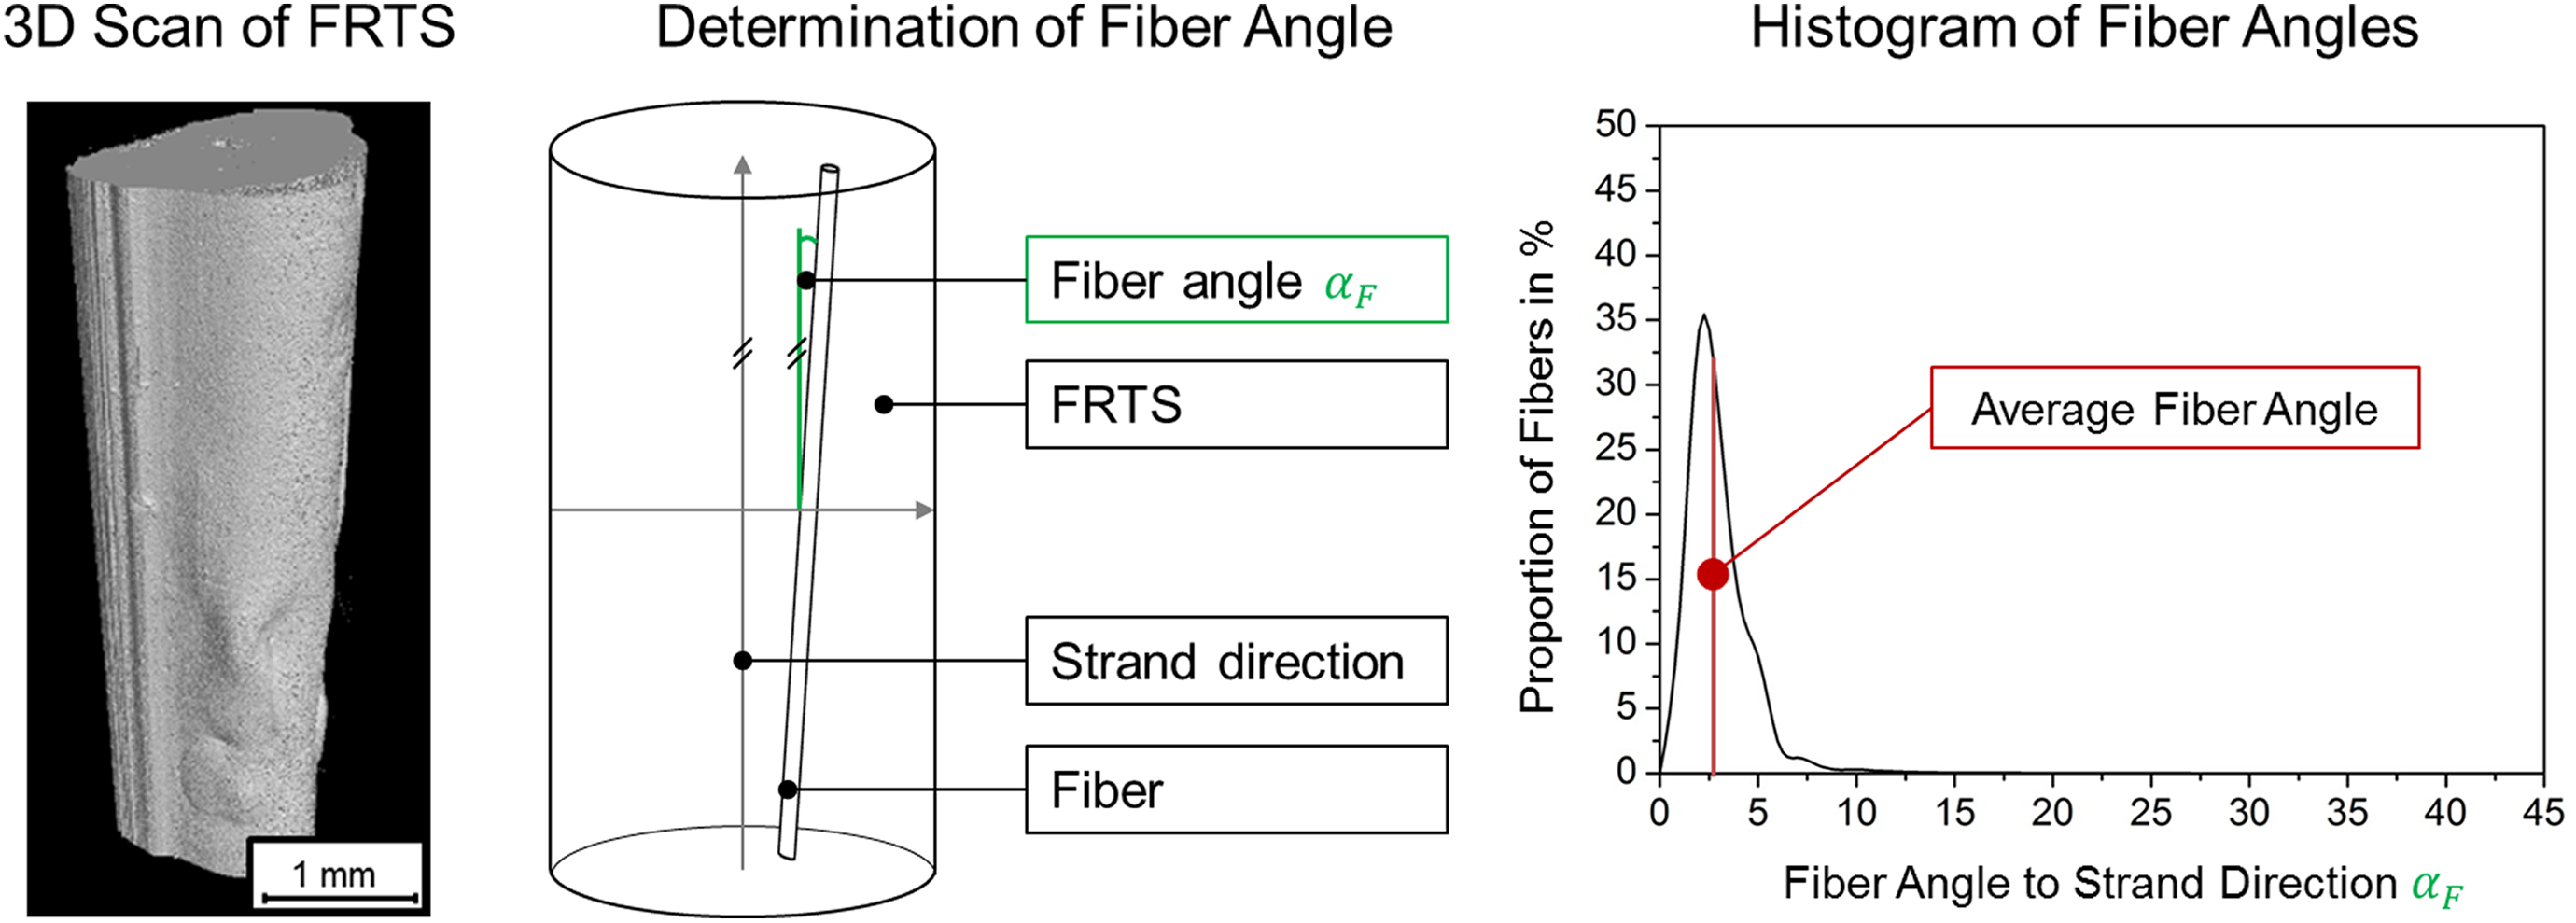
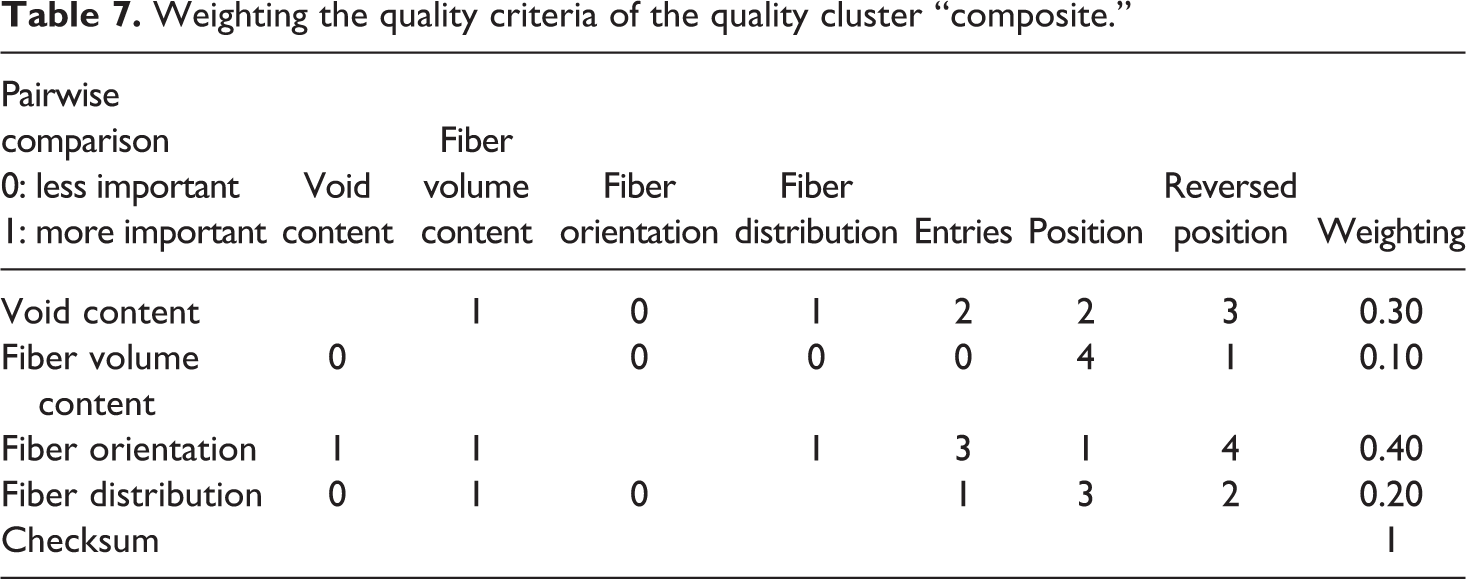
The tensile tests are carried out in accordance with DIN EN ISO 527-5 43 and DIN EN ISO 17129 44 for testing continuous fiber reinforced polymers. Due to the given strand diameter and the irregular surface, the tests could not be carried out exactly according to the given standards. Challenges in carrying out the tests arose above all for the clamping of the almost round strands. With flat clamping jaws, excessive pressing forces lead to pre-damage of the strands and thus to failure in the clamping area. If the contact forces are too low, the strand is pulled out of the clamping. Due to irregular external shapes of the strands, semicircular grooves as provided in the abovementioned standard 44 cannot be used either. Therefore, the strands were glued into 45-mm long steel jaws with Scotch Weld DP 8005 by 3M (Saint Paul, USA), which is a PP compatible adhesive. The specimen length between the clamps was 200 mm. A tensile tested strand specimen is shown in Figure 8 including the clamps glued together. For better comparability, the calculation of tensile strength and E-modulus is based on the fiber area instead of the entire strand cross section.
Tensile tested FRTS specimen.
Calculation of a quality index
The large number of quality criteria complicates a meaningful comparison between different FRTS. To facilitate this, it is imperative to consolidate the information. The aim is therefore to combine all quality values in one dimensionless quality index. For this purpose, all quality criteria are grouped into different content categories—the so-called quality clusters—as shown in Figure 9. In this way, a distinction is made between quality criteria that allow a direct statement on geometry, composite, and mechanics. The quality clusters can be used to differentiate the content of the quality evaluation, despite consolidation of the information on one quality index. While the geometric quality criteria have a higher influence on the manufacturing process, the quality criteria of the clusters of composite and mechanics have a larger impact on the final product.
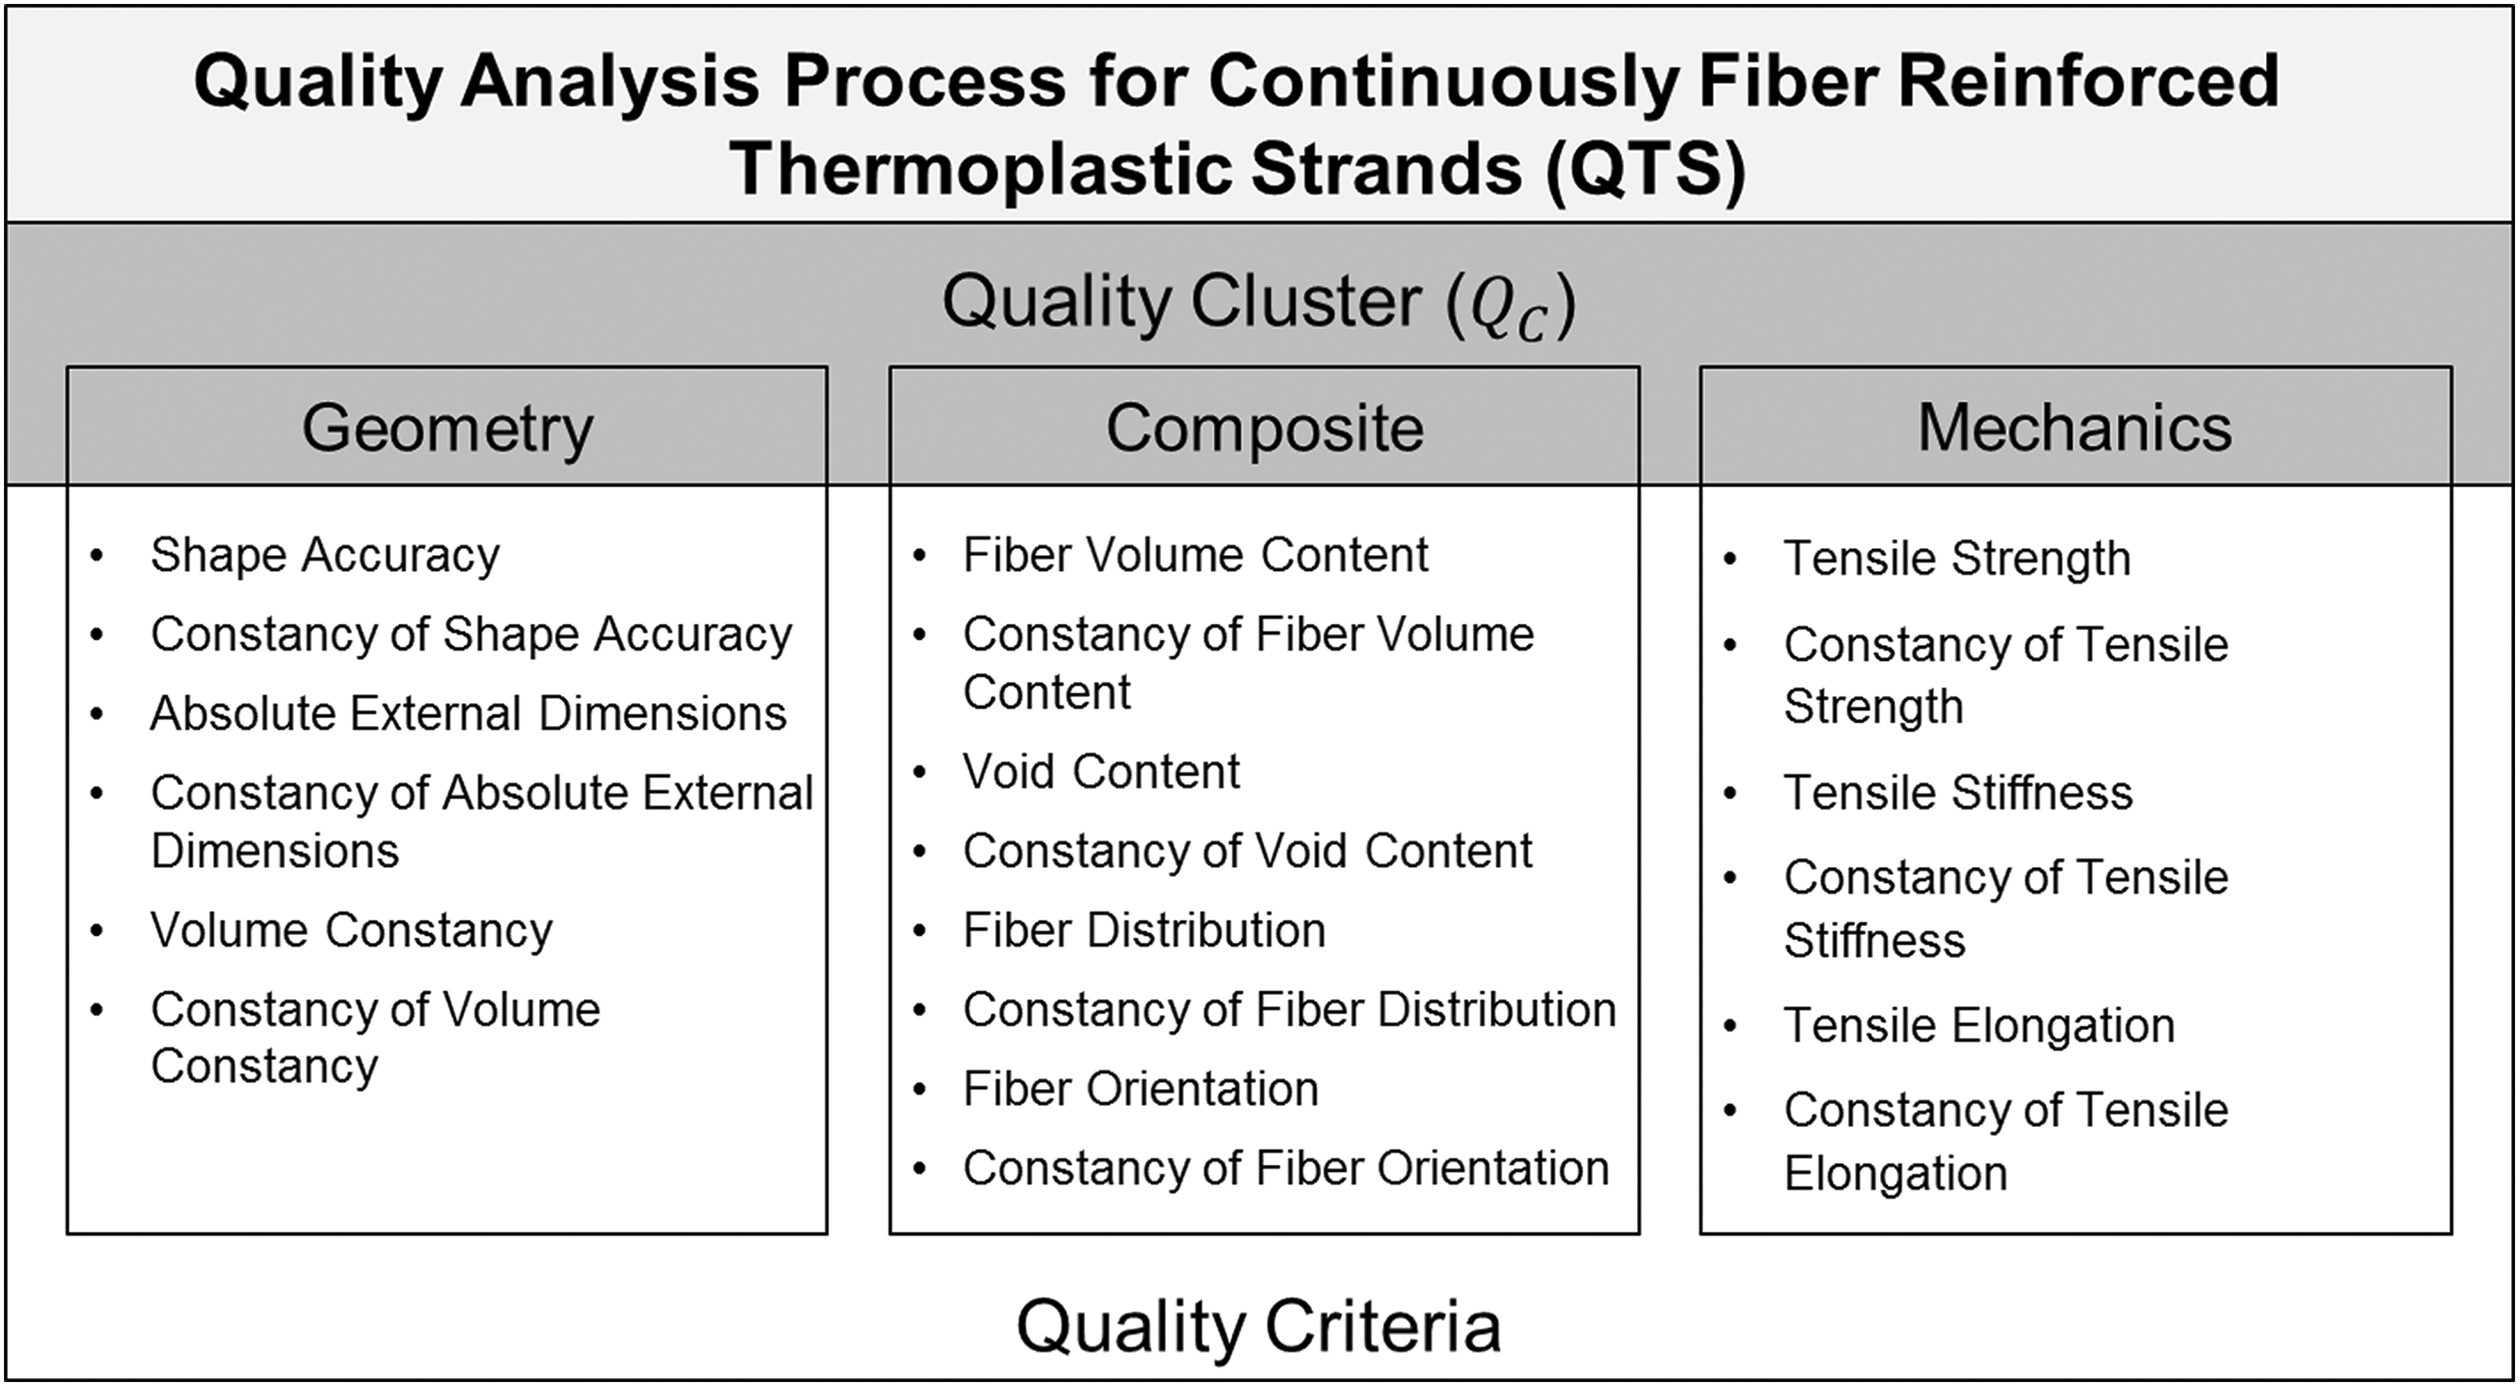
Clustering of quality criteria.
The scaling level of the characteristics decides which mathematical operators can be used for calculation. Since all the criteria listed here can be assigned to the ratio scale and thus to the highest scale level, all basic arithmetic operations can be used. Relationships of the characteristic values may also be formed. However, since the quality values of the quality criteria have different dimensions and units, it is necessary to normalize the quality values. All quality values are therefore normalized to a dimensionless number between 0 and 1, with 1 as the maximum, to ensure comparability. The quality index
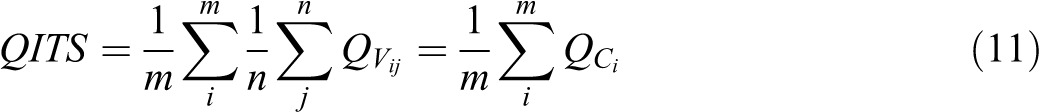
According to formula (11), the value of the quality clusters is determined first. This corresponds to the arithmetic mean
Quality values and their normalization.
Weighting the quality criteria
By classifying the quality criteria into clusters, the three areas “Geometry,” “Composite,” and “Mechanics” are equally included in the calculation of the quality index, irrespective of their number of quality criteria. When selecting suitable semifinished products, however, the influence of the various quality criteria or clusters can vary greatly depending on the application. To reflect the different weightings, it is necessary to rank the various quality criteria or clusters according to their importance. The ranking can then again be taken into account by weighting factors when calculating the quality index.
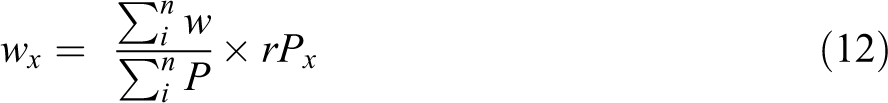
Utility analysis is an established and effective method for the weighting of criteria. This is based on the method of pairwise comparison. All criteria are compared in pairs with regard to their importance and the respective preferred criterion is noted in a preference matrix. Based on the absolute number of entries, positions P are assigned to the criteria by a ranking, from which the weighting w ϵ [0…1] is calculated according to formula (12). Therefore, the quotient of the sum of the weights w and the sum of the positions P is multiplied by the reversed position
Formula (13) shows that there are two possibilities for individual weighting when calculating the
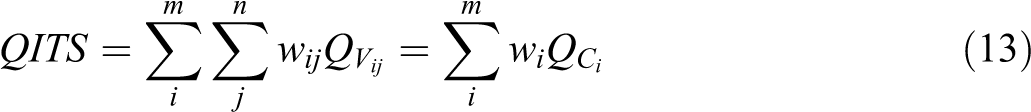
In case that all quality values are to be equally weighted, the quality clusters must be weighted with the quotient of the number of quality criteria contained and the sum of all quality criteria.
Material selection for the FIFDM process development
The concept of the FIFDM process requires the processing of an already impregnated semifinished product. For a targeted development of a semifinished product, however, it is initially important to build up a fundamental understanding of the process. Therefore, available semifinished products have been used up to now. Based on a market research, an intermediate product from the production of long-fiber reinforced thermoplastic pellets (LFT pellets) is selected. Usually, LFT pellets are used in compression or injection molding. The production of LFT pellets takes place in a pultrusion process. Continuous fibers are drawn off from bobbins and through a bath filled with molten thermoplastic. A nozzle is used to form a round strand. After leaving the nozzle, the thermoplastic strand is quenched with water and then cut into pellets with a length between 11 and 25 mm. 45
Common thermoplastics for LFT pellets are PP and PA 6, usually reinforced with 20–60 wt% of glass fibers. LFT pellets are comparatively inexpensive semifinished FRPC products due to the low-prized raw materials and the fully automated manufacturing process. To obtain continuous strands, the material is manually removed from the production before the cutting process. For the material selection for process development of the FIFDM process, a total of two thermoplastic strands shown in Figure 10 with a diameter of approximately 1.9 mm each from two different manufacturers are compared with each other. Both consist of semicrystalline PP with 60 wt% of continuous glass fibers. PP was selected as matrix because of its 70–80°C lower melting temperature compared to PA 6 and therefore lower heating temperatures are sufficient for the process. With 60 wt% glass fibers, a high reinforcement effect is to be achieved. Assuming that this is an E-glass fiber with a density of 2.6 kg/m3, this corresponds to a fiber volume content of 34.4%. The only difference between the two materials is the color of the matrix. While the PP of manufacturer 1 is colored black with carbon black particles, the PP of manufacturer 2 is left in its natural state. Using the QTS, the suitability of the two semifinished products for the process development of the FIFDM process is to be compared with each other.
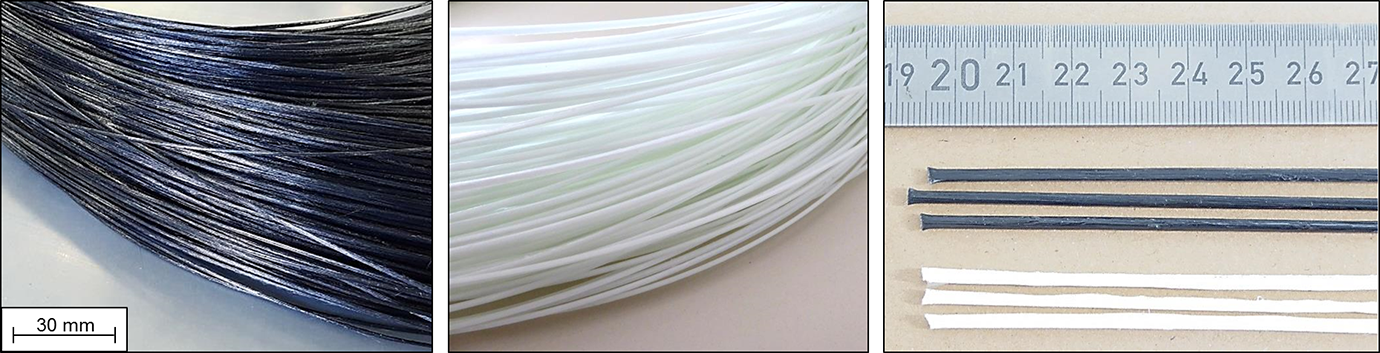
FRTS 1 from manufacturer 1 (black) and FRTS 2 from manufacturer 2 (white).
First, the quality criteria are weighted. The weighting of the quality criteria of cluster “Geometry” is shown in Table 6. Since the volume constancy according to Table 4 influences both the process and the printed structure most, it is weighted the highest in cluster “Geometry.”
Weighting the quality criteria of the quality cluster “geometry.”
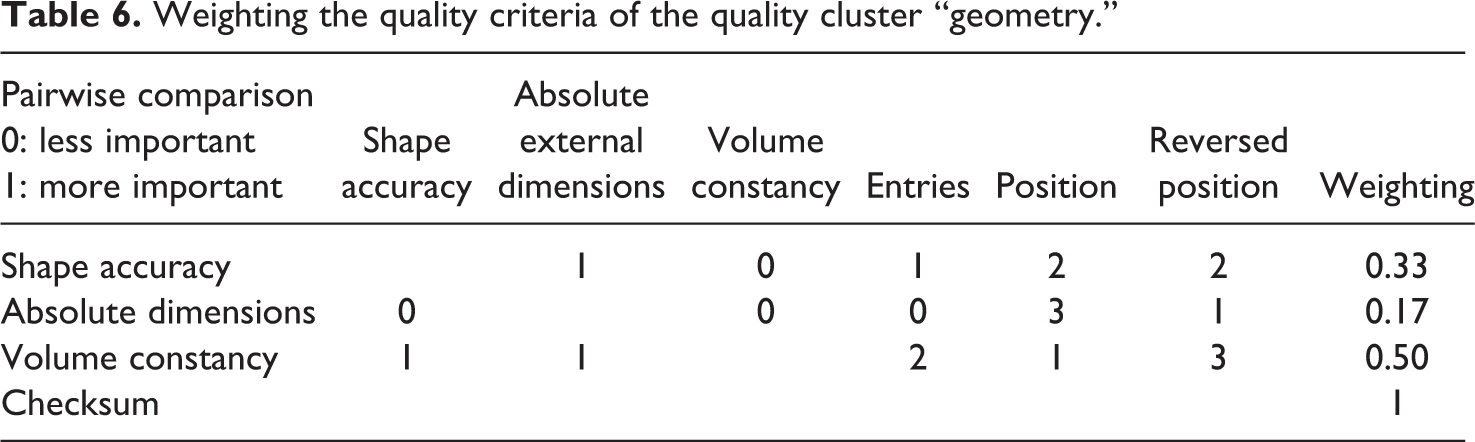
Table 7 shows the criteria weighting of the cluster “Composite.” In this cluster, fiber orientation, void content, and fiber distribution are important parameters for experimental process analysis. The higher and more stable the quality of the semifinished product, the lower its influence on the process and the more clearly the results of an experimental investigation can be assigned to certain process influences. Therefore, the absolute amount of the fiber volume content plays a subordinate role in process analysis despite its high influence on the mechanical properties.
Weighting the quality criteria of the quality cluster “composite.”
For the weighting of the criteria of the “Geometry” and “Composite” clusters, the related criteria of target value and constancy were combined. The weighting factors are therefore divided equally between the two quality values when calculating the
The quality clusters are also weighted according to Table 8. The cluster “Composite” not only has the most quality criteria, but can also be positively influenced by the process in the most difficult way and is therefore given the highest weighting. The Cluster “Mechanics,” on the other hand, plays the least role in process design, since mechanical investigations are only performed on a comparative basis.
Weighting the quality cluster.
Table 9 provides the experimental design and the measured values for the different quality criteria for both semifinished products FRTS 1 and FRTS 2.
Measured quality criteria for two different FRTS.
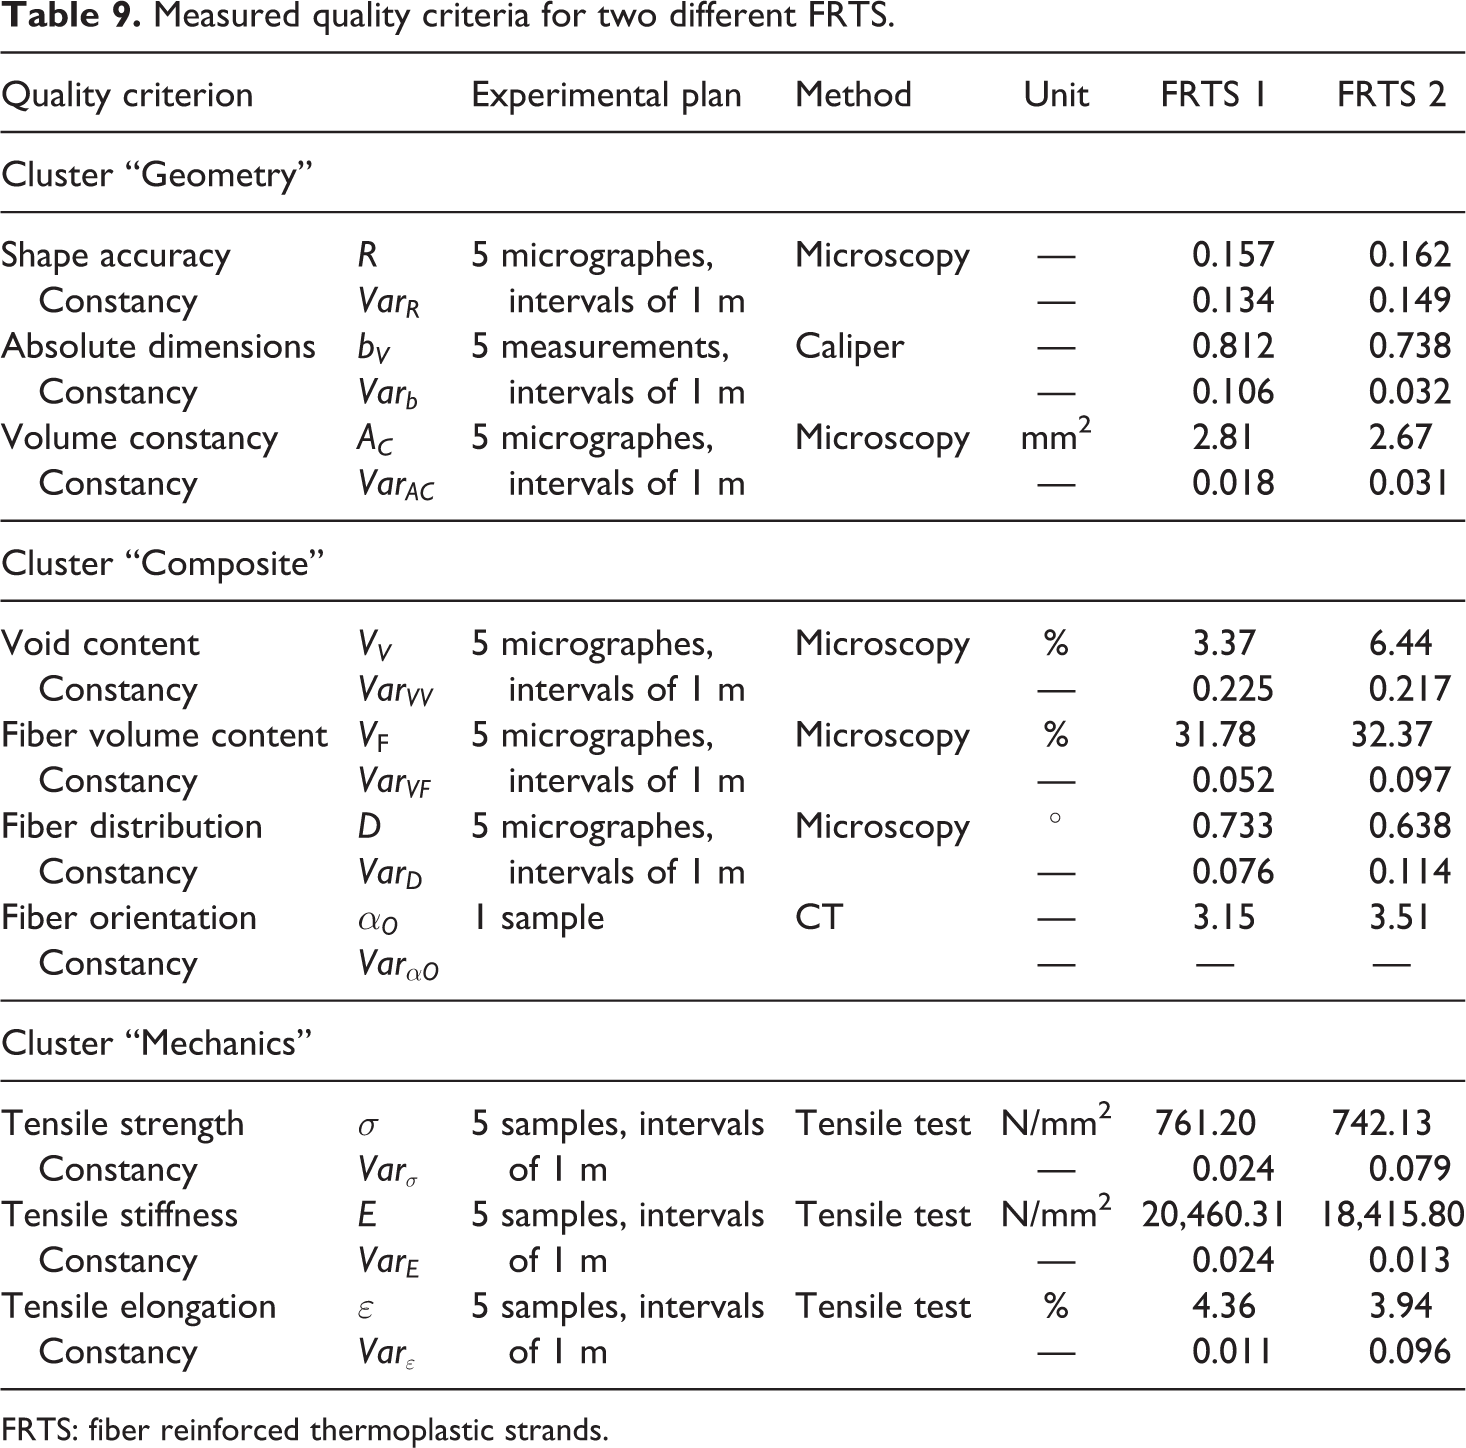
FRTS: fiber reinforced thermoplastic strands.
The normalized quality values and the calculated
Quality values and calculated
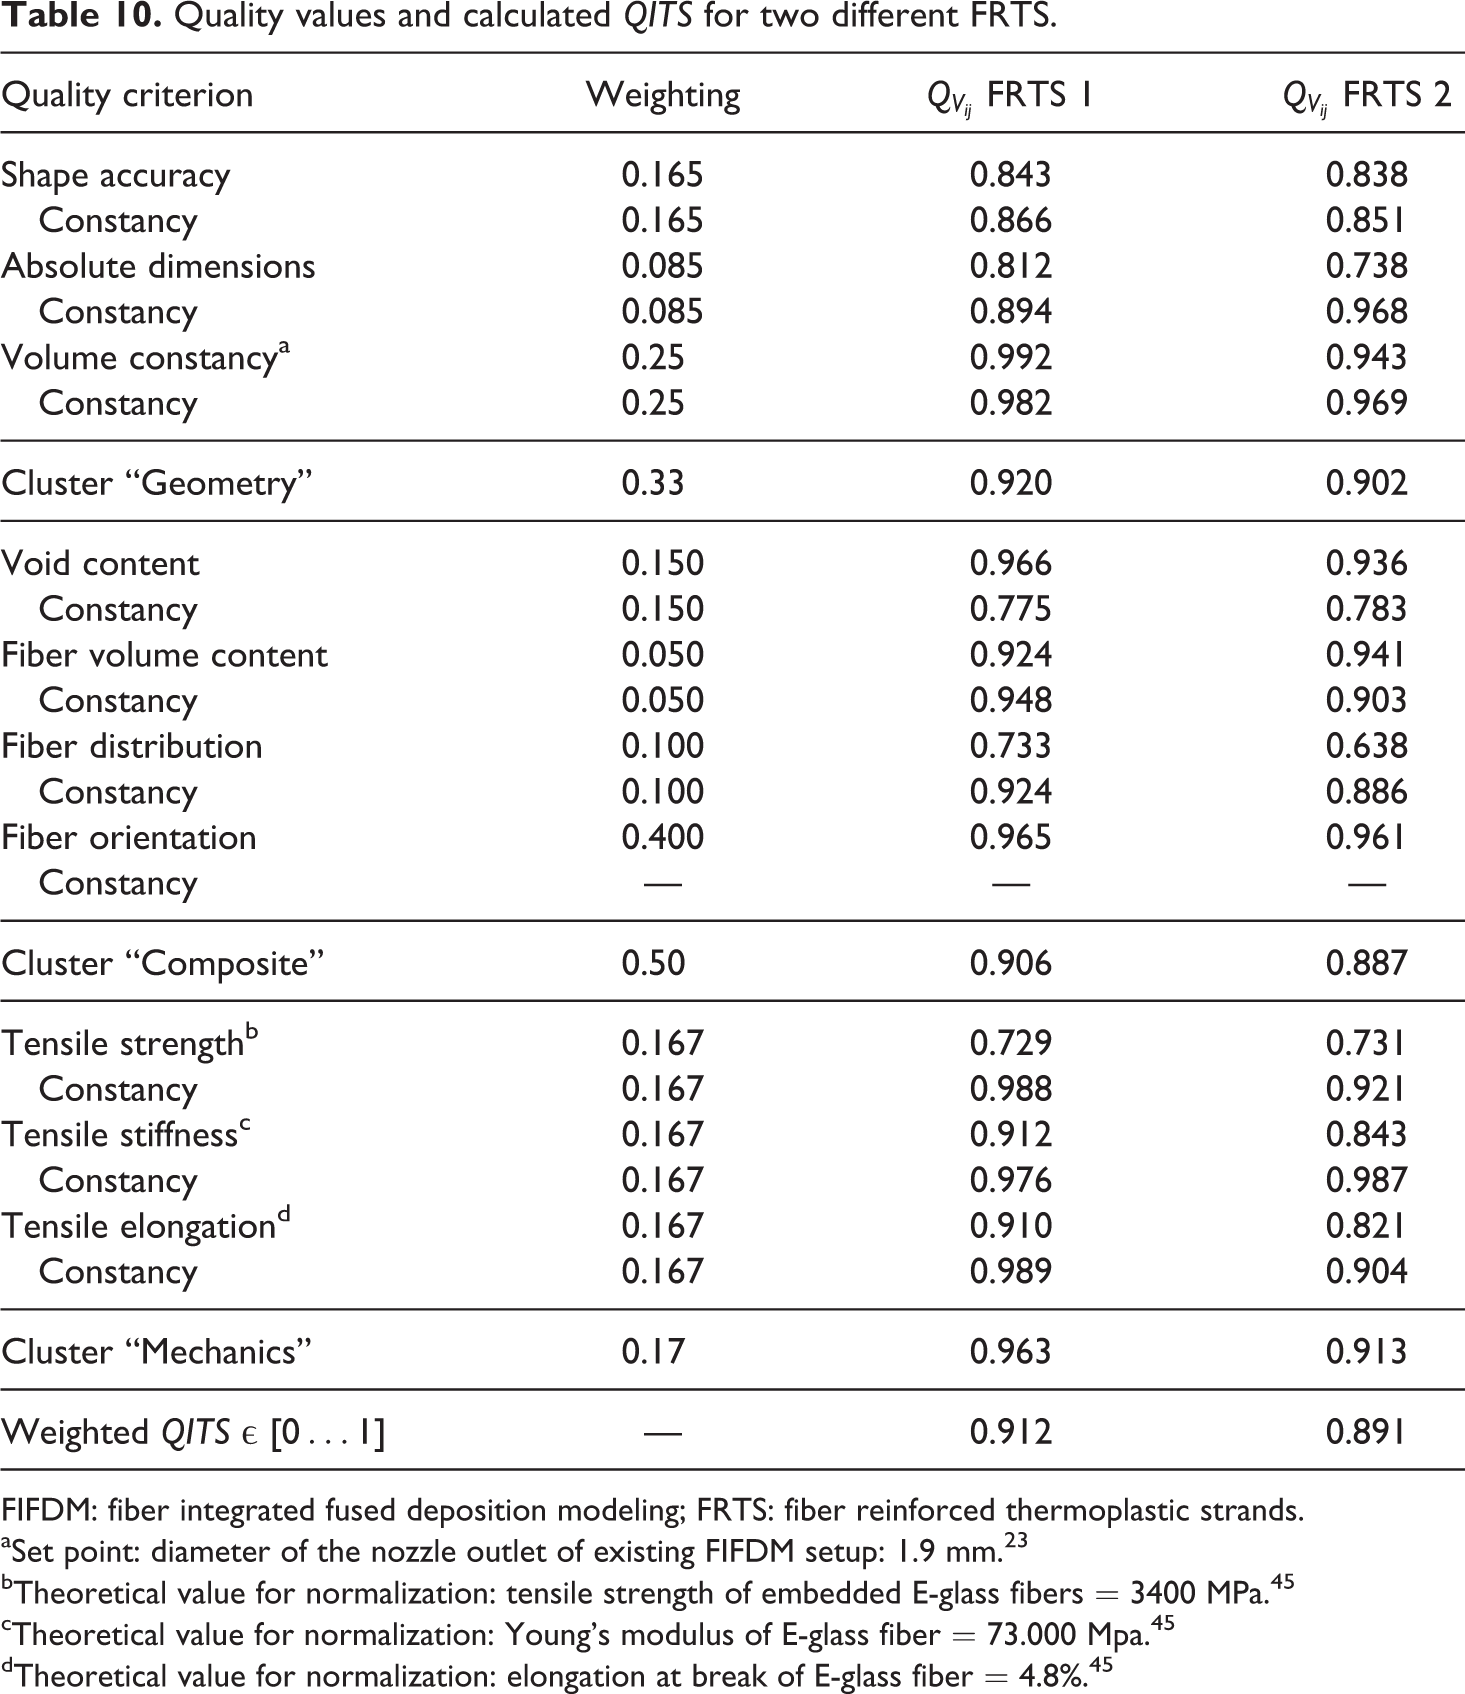
FIFDM: fiber integrated fused deposition modeling; FRTS: fiber reinforced thermoplastic strands.
aSet point: diameter of the nozzle outlet of existing FIFDM setup: 1.9 mm. 23
bTheoretical value for normalization: tensile strength of embedded E-glass fibers = 3400 MPa. 45
cTheoretical value for normalization: Young’s modulus of E-glass fiber = 73.000 Mpa. 45
dTheoretical value for normalization: elongation at break of E-glass fiber = 4.8%. 45
According to this, FRTS 1 reaches a higher value than FRTS 2 for each cluster and thus also for the
Conclusion and outlook
This article presents a quality analysis process for continuous FRTS, called QTS. The background is the development of the FIFDM process, a new AM process for continuous fiber reinforced polymers, which requires FRTS as semifinished product. Therefore, the QTS provides a tool that can quantify the quality of FRTS and thus helps in the development and selection of a suitable FRTS as well as in quality control. For this purpose, quality criteria for the FRTS were formulated based on the requirements of the subsequent processing and the printed product. These consider the geometry, the composite characteristics, and the mechanical properties of the FRTS. Analytical methods were developed to quantify the quality criteria. To ensure simple comparability of different batches or FRTS products, the resulting quality values of the QTS are calculated to a single quality index, the
In the future, the QTS will be used to advance the development of new semifinished products for the FIFDM process. Furthermore, the aim is to automate the analysis process as far as possible. This is intended to minimize errors resulting from manual evaluation and allow using it as a quality entrance inspection in industrial production.