
Abstract
Multiwalled carbon nanotubes (MWCNTs) have wide range of applications. Commercial MWCNTs have impurities, disorder and entangled structure, which limit its applications. In this respect, novel, low-energy consumption and friendly technique was applied to enhance its structure. The technique is operated during isometric process inside autoclave and based on thermal treatment of MWCNTs in the presence of solvent and pressure. It was used to enhance the oxidative thermal stability of MWCNTs. Thermal gravimetric analysis results showed an increase in onset temperature, activation energy of decomposition, and the temperature required to loss 75, 50, and 33 wt% as the treating temperature increased. Raman spectroscopy tests showed a decrease in the degree of disorder from 1.29 for untreated samples to 0.45 for samples treated at 250°C. The electrical resistivity of MWCNTs was increased from 0.33 Ω.cm for untreated samples to 0.54 Ω cm for 250°C treated samples. Advantages of thermal treatment of MWCNTs using this technique appeared in the presence of a percolation behavior for the AC electrical conductivity when a polymer matrix was loaded with it with a threshold percolation concentration of 0.7 wt%. Furthermore, Cole–Cole Z semicircles as well as Argand plots of the electric modulus appeared for polymer matrix loaded with thermally treated MWCNTs beyond the threshold percolation concentration.
Keywords
Introduction
The attractive physical and chemical properties of multiwalled carbon nanotubes (MWCNTs) make them very promising for a wide range of industries. 1 They can be used as active components with other materials, for example, random access memory (RAM), field effect transistors (FETs), gas sensors, and reinforcement composite materials. 2 –9 However, the investigations on the oxidative thermal stability of MWCNTs and their decomposition reactions have been slim.
Thermal stabilities of MWNTs, often given in terms of oxidation temperatures, are a direct consequence of the presence of aromatic rings within their structures. As a result, the thermal stabilities of these materials are influenced by the number and diameter of the walls, 10,11 the length of the tube, 12 and the presence of residual catalysts and/or defects. Also, the curvature and strains of MWCNTs influence their surface and oxidation behavior. As compared to graphene, which is stable up to 873 K, 13 –15 MWCNTs have inferior thermal stabilities in an air atmosphere owing to strain caused by the curvature of the conjugated networks. 10 Generally, the maximum oxidation temperatures (T ps) of MWCNTs, obtained using thermogravimetric analysis (TGA), vary from material-to-material in a range of 673–773 K. 10,15,16 It is known that oxidative degradation pathway of MWNTs involves reversible adsorption of gaseous O2 on the basal graphene sidewalls to form mobile/static oxygenated carbons or direct reaction with edge carbon atoms leading to rapid CO2 formation. 17,18 .
Also, usage of commercial carbon nanotubes (CNTs) in practical applications is limited because of their low oxidative thermal stability. It is known that the purification and functionalization of MWCNTs have achieved in last decades through the oxidation of CNTs. The oxidation processes have produced functional surface groups such as carboxylic groups, alcoholic groups, and ketone groups 19 and gave a chance for further synthesizing of several functional groups and facilitating the reactions between the polymers and CNT surface. 20 The chemical oxidation of MWCNTs could be carried out by a number of reagents and methods, such as sulfuric acid, 21 hydrogen peroxide, 22,23 nitric acid, 24 –27 hydrochloric acid, 28 –31 and ozone-air. 32,33 The content and nature of the formed functional surface groups depends strongly on the oxidation method and the mechanism of the process. 22,34,35 Many researches were done in last years on the properties of CNTs (defectiveness, diameter, and morphology) before and after oxidation. 10 However, this region still needs more investigation because of the high number of CNTs producers and increasing the CNTs applications.
Therefore, a facile approach to improve the oxidation stabilities of MWCNTs is a necessary component of efforts to broaden applications of these materials. Recently, Kim et al. 36 enhanced the oxidative thermal stability of MWCNTs through their coating by Flavin mononucleotide for protecting the surface of nanotubes. However, the presence of protective coating around MWCNTs may cause restrictions for their properties and applications.
Dispersion of CNTs through polymeric matrices depends on the surface structure of CNTs and was improved using different physical and chemical or noncovalent and covalent functionalization methods. These methods include ultrasonic dispersion, 37 solution, 38 coagulation, 39 microemulsion, 40 melt blending, 41 oxidation of CNTs side walls surfactants, 42 and in situ polymerization. 43 The covalent functionalization produces CNTs/polymer nanocomposites with enhanced polymer–filler interactions but decreases the electrical and thermal conductivity of CNTs. 44 Besides, it conducted with unfriendly strong acids and oxidants. The electrical conductivity of polystyrene-loaded prefunctionalized MWCNTs with 3-hydroxy-2-napthoic acid (toxic in nature) was found to be relatively increased. 45,46 On the other hand, non-covalent functionalization is conducted with low cost and less pollution. Non-covalent functionalization is conducted via physical surfactant adsorption, polymer wrapping through van der Walls interactions and pep stacking between polymers and CNTs, and finally, endohedral methods in which guest atoms or molecules are stored through capillary effect. 38,47 Polymers loaded CNTs have vitality daily uses and applications like nano medicine 48 and water filters. 49 Therefore, it is very important to search about a noncovalent dispersion technique having no pollutions.
Therefore, in this study, a novel technique has been used for improving the oxidative thermal stability of CNTs. The technique is a green one because no acids or functional groups used. This will be confirmed by the TGA, Raman, and the electrical resistivity studies. The importance of this technique appears well as the electrical properties as well as Raman spectroscopy of polymer blends loaded with different concentrations of thermally treated CNTs were studied.
Experimental
Materials
MWCNTs (purity: >95 wt%, outside diameter: <8 nm, length: approximately 30 mm) used in this work were purchased from Chengdu Organic Chemicals Co. Ltd., Chinese Academy of Sciences (China). Polyvinyl alcohol (PVA) with molecular weight 89,000 and 99+% hydrolyzed (Australia, package number 341584) and polyvinylpyrrolidone (PVP) with an average molecular weight of 40,000 were purchased from Sigma-Aldrich (Australia, package number pvp40). Both PVA and PVP were used as received.
Thermal treatment of MWCNTs
The desired amount of as received MWCNTs was dissolved in distilled water and ultra-sonicated for 30 min followed by magnetic stirring for further 24 h to get MWCNTs solution. Then, solution was gradually heated inside an autoclave to a treating temperature of 100°C at a heating rate of 1.0°C min−1. The temperature was held at 100°C for 2 h and under a pressure of 100 KPa. The system was then left to cool to room temperature and left inside the autoclave for 24 h. Solution then dried in air at 150°C for 2 h. The process was repeated for other solutions of MWCNTs but at treating temperatures of 150, 200, and 250°C.
Polymer blends MWCNTs samples preparations
Initially, equal weights of PVA and PVP were dissolved in hot distilled water at 90°C with a magnetic stirrer for 2 h. These solutions were then mixed to each other and stirred for further 24 h to get a blend solution S1. Another similar solution was prepared to get blend solution S2. The desired amounts of as received MWCNTs (0.0, 0.25, 0.5, 0.77, 1.0, 2.5, 5.0, and 10.0 wt%) were dissolved in distilled water and ultra-sonicated for 30 min followed by magnetic stirring for further 24 h to get MWCNTs solutions M1. Other similar weight ratios of previously thermally treated MWCNTs at 250°C solutions were also prepared to get solutions M2. The sonicated MWCNTs solutions M1 and M2 were added to previously dissolved PVP-PVA blend solution S1 and S2 to obtain polymer-MWCNTs solutions MS1 and MS2, respectively. Both solutions MS1 and MS2 were sonicated again for 30 min, stirred for 24 h, and then cast in horizontal petri dishes and dried under ambient conditions to get two group samples. Group MS1 represents PVP-PVA polymer blends loaded with different concentrations of as received MWCNTs. Group MS2 represents PVP-PVA polymer blends loaded with different concentrations of previously thermally treated MWCNTs at 250°C.
Characterizations
TGA tests
TGA tests of all thermally treated MWCNTs were performed using Perkin Elmer TGA Differential Thermal Analysis (TG./DTA 6300 brand, USA) at a heating rate of 10° min−1 in the temperature range from room temperature up to 1000°C.
Raman spectroscopy
Micro-Raman spectra for the thermally treated MWCNTs were acquired using the μ - Raman Spectrometer Model Labram HR EVO (Horiba, France) in the confocal geometry with the confocal hole size of 50 μm. He–Ne laser source (633 nm) was used at 25% numerical density filter and the Raman signal excitation and collection were performed from 50× wide distance objective. The spectral and spatial resolutions of the spectrometer were maintained at 2 cm−1 and 1 μm, respectively.
SEM spectroscopy
Scanning electron microscopic (SEM) photographs were taken for untreated and treated MWCNTs using low-vacuum high-resolution field emission Joel electron microscope.
Electrical resistivity tests
The electrical properties were performed using 4200-SCS Semiconductor Characterization System (KEITHLEY Co., Cleveland, Ohio, USA). The treated MWCNTs were compressed at room temperature under a pressure of 40 kg cm−2 in the form of circular discs of thickness 1 mm and diameter of 1 cm for electrical measurements. The electric current, I, through samples was measured and the electrical resistivity was calculated using the formula
AC electrical conductivity tests
Polymer nanocomposite samples MWCNTs/PVP-PVA used were in the form of circular discs of diameter 1 cm and thickness 0.1 mm held between two brass electrodes. The AC electrical properties were studied by impedance spectroscopy measurements performed on both group samples using Novo control concept 50 system (Germany) in the frequency range of 1–107 Hz and under AC voltage of 0.1 V at room temperature. The system included dielectric analyser series Alpha-A, temperature control system Novotherm and data acquisition and evaluation software WinDETA.
All measurements were repeated many times to ensure the reproducibility of results.
Results and discussions
Thermal properties of thermally treated MWCNTs
Thermal stability of the MWCNTs before and after treatment was investigated and shown in Figure 1. The TGA curve of the untreated MWCNTs shows a loss of 50wt % at 620°C; 92% of MWCNTs weight is lost at 900°C by further heating. Also, Figure 1 shows that the total thermal decomposition of MWCNTs is achieved by two steps. The onset of major mass loss occurred around 415°C, and a high mass loss happened subsequently. This strong mass loss observing above 415°C is due to degradation of disordered or amorphous carbon and other metal impurities. 50,51 These results indicate that the thermal stability of the commercial MWCNTs is needed to improve. In this way, we treated the MWCNTs in presence of high pressure of solvent and at different temperatures. At 100°C, Figure 1 reveals that MWCNTs loss 50 wt% at 796°C and only 70% at 900°C. In the same way, the total thermal decomposition of thermally treated MWCNTs occurs through three stages. By comparing with the untreated sample, the treated sample at temperature of 100°C possess clear enhancement of thermal stability. It means that the 50 wt% loss of the treated MWCNTs needed temperature is higher than that of the untreated sample by 176°C. In case of the treatment accomplished at 150°C, similar enhancement is observed leading to 50% weight loss at higher temperature of 815° C as compared with the untreated sample (620°C). Also, at 900°C, enhancement of the thermal stability of MWCNTs is clear where only 67% weight loss of the treated MWCNTs is observed as compared with 92% of the untreated MWCNTs.
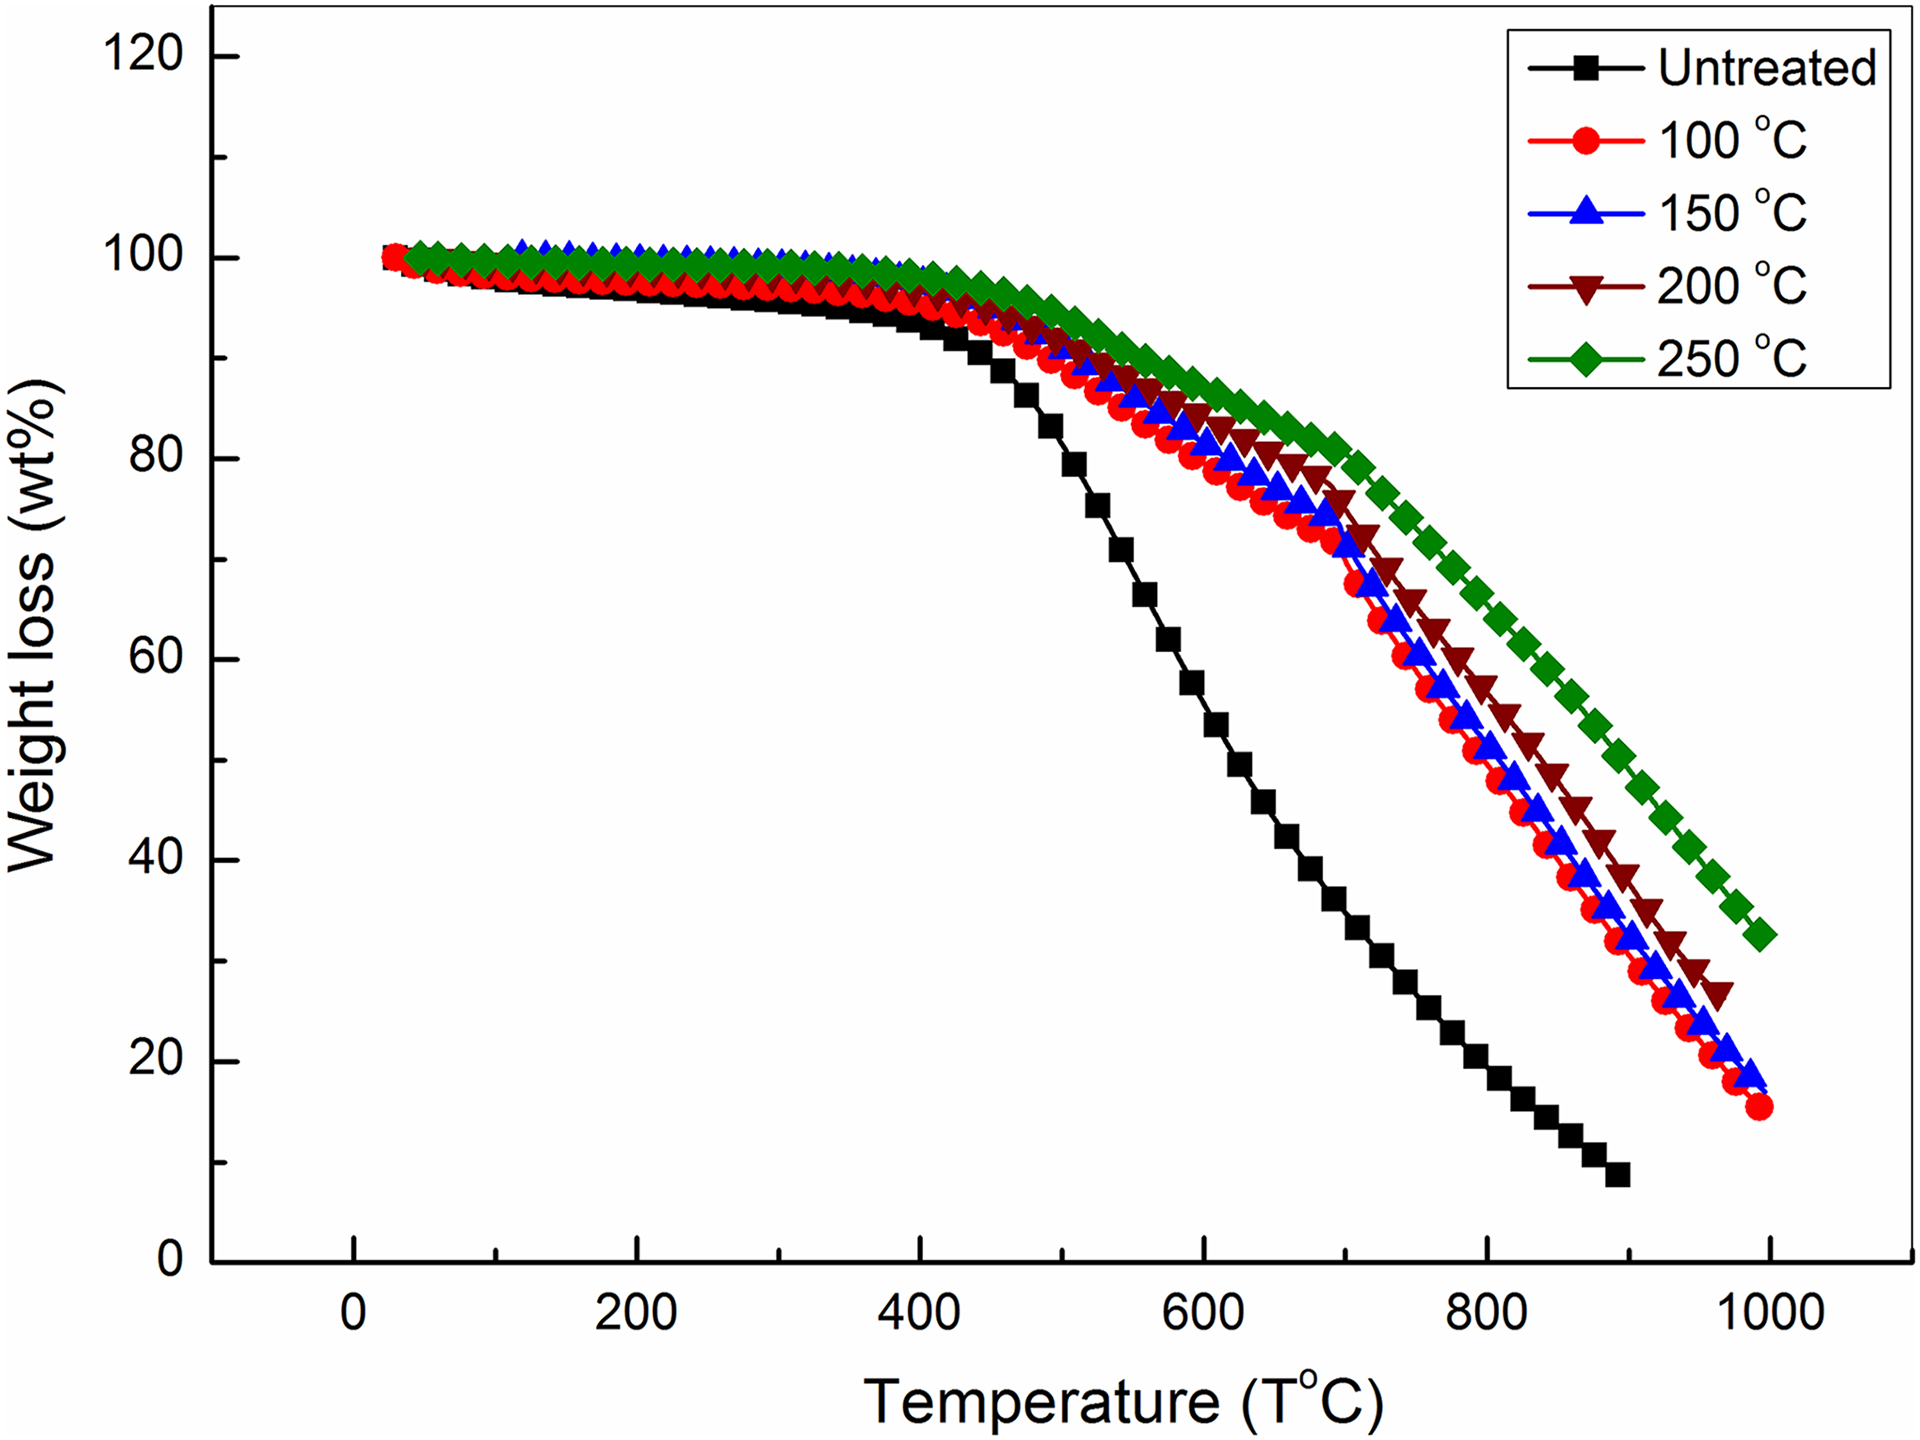
TGA curves of MWCNTs thermally treated at different temperatures.
By treating the MWCNTs at 200°C and 250°C, the enhancement of the thermal stability continued in the same trend. The 50% weight loss occurs at 836°C and 891°C, respectively. On another side, the onset temperature of the treated samples shows linear function dependence with slope 0.27 on the treating temperature as shown in Figure 2. This indicates that this technique increases the thermal stability of MWCNTs. In the same way, clear linear relationship between the decomposition temperatures required to loss 75, 50and 33 wt% and the different treating temperatures of this technique is shown in Figure 3.
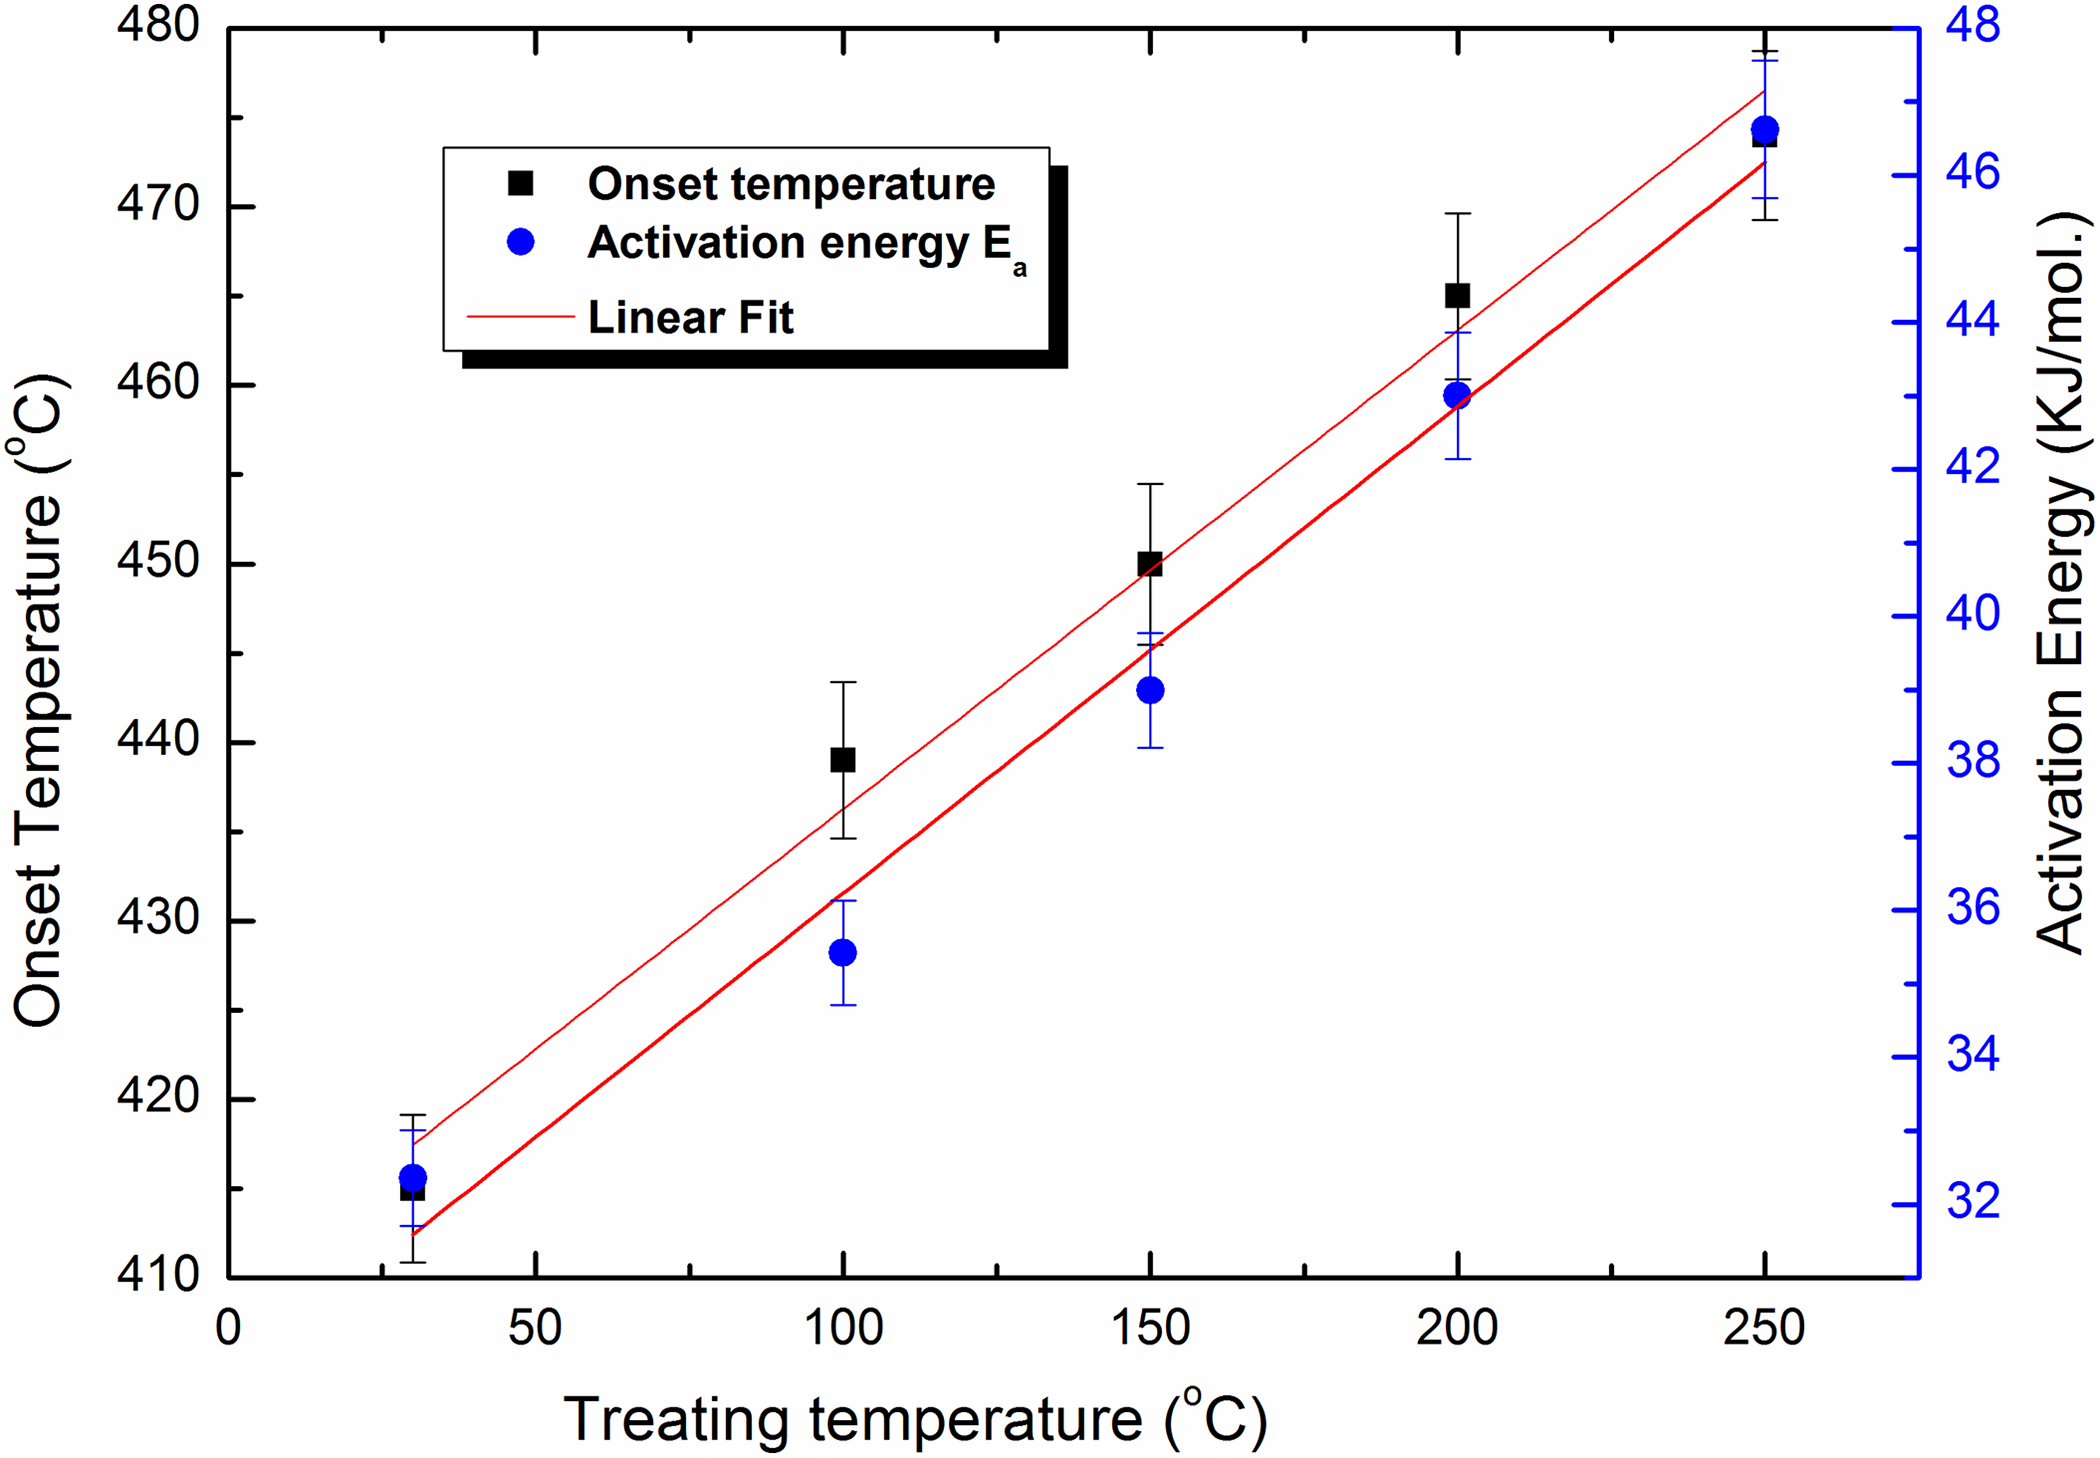
Dependence of the onset temperature and activation energy of MWCNTs thermally treated at different temperatures.
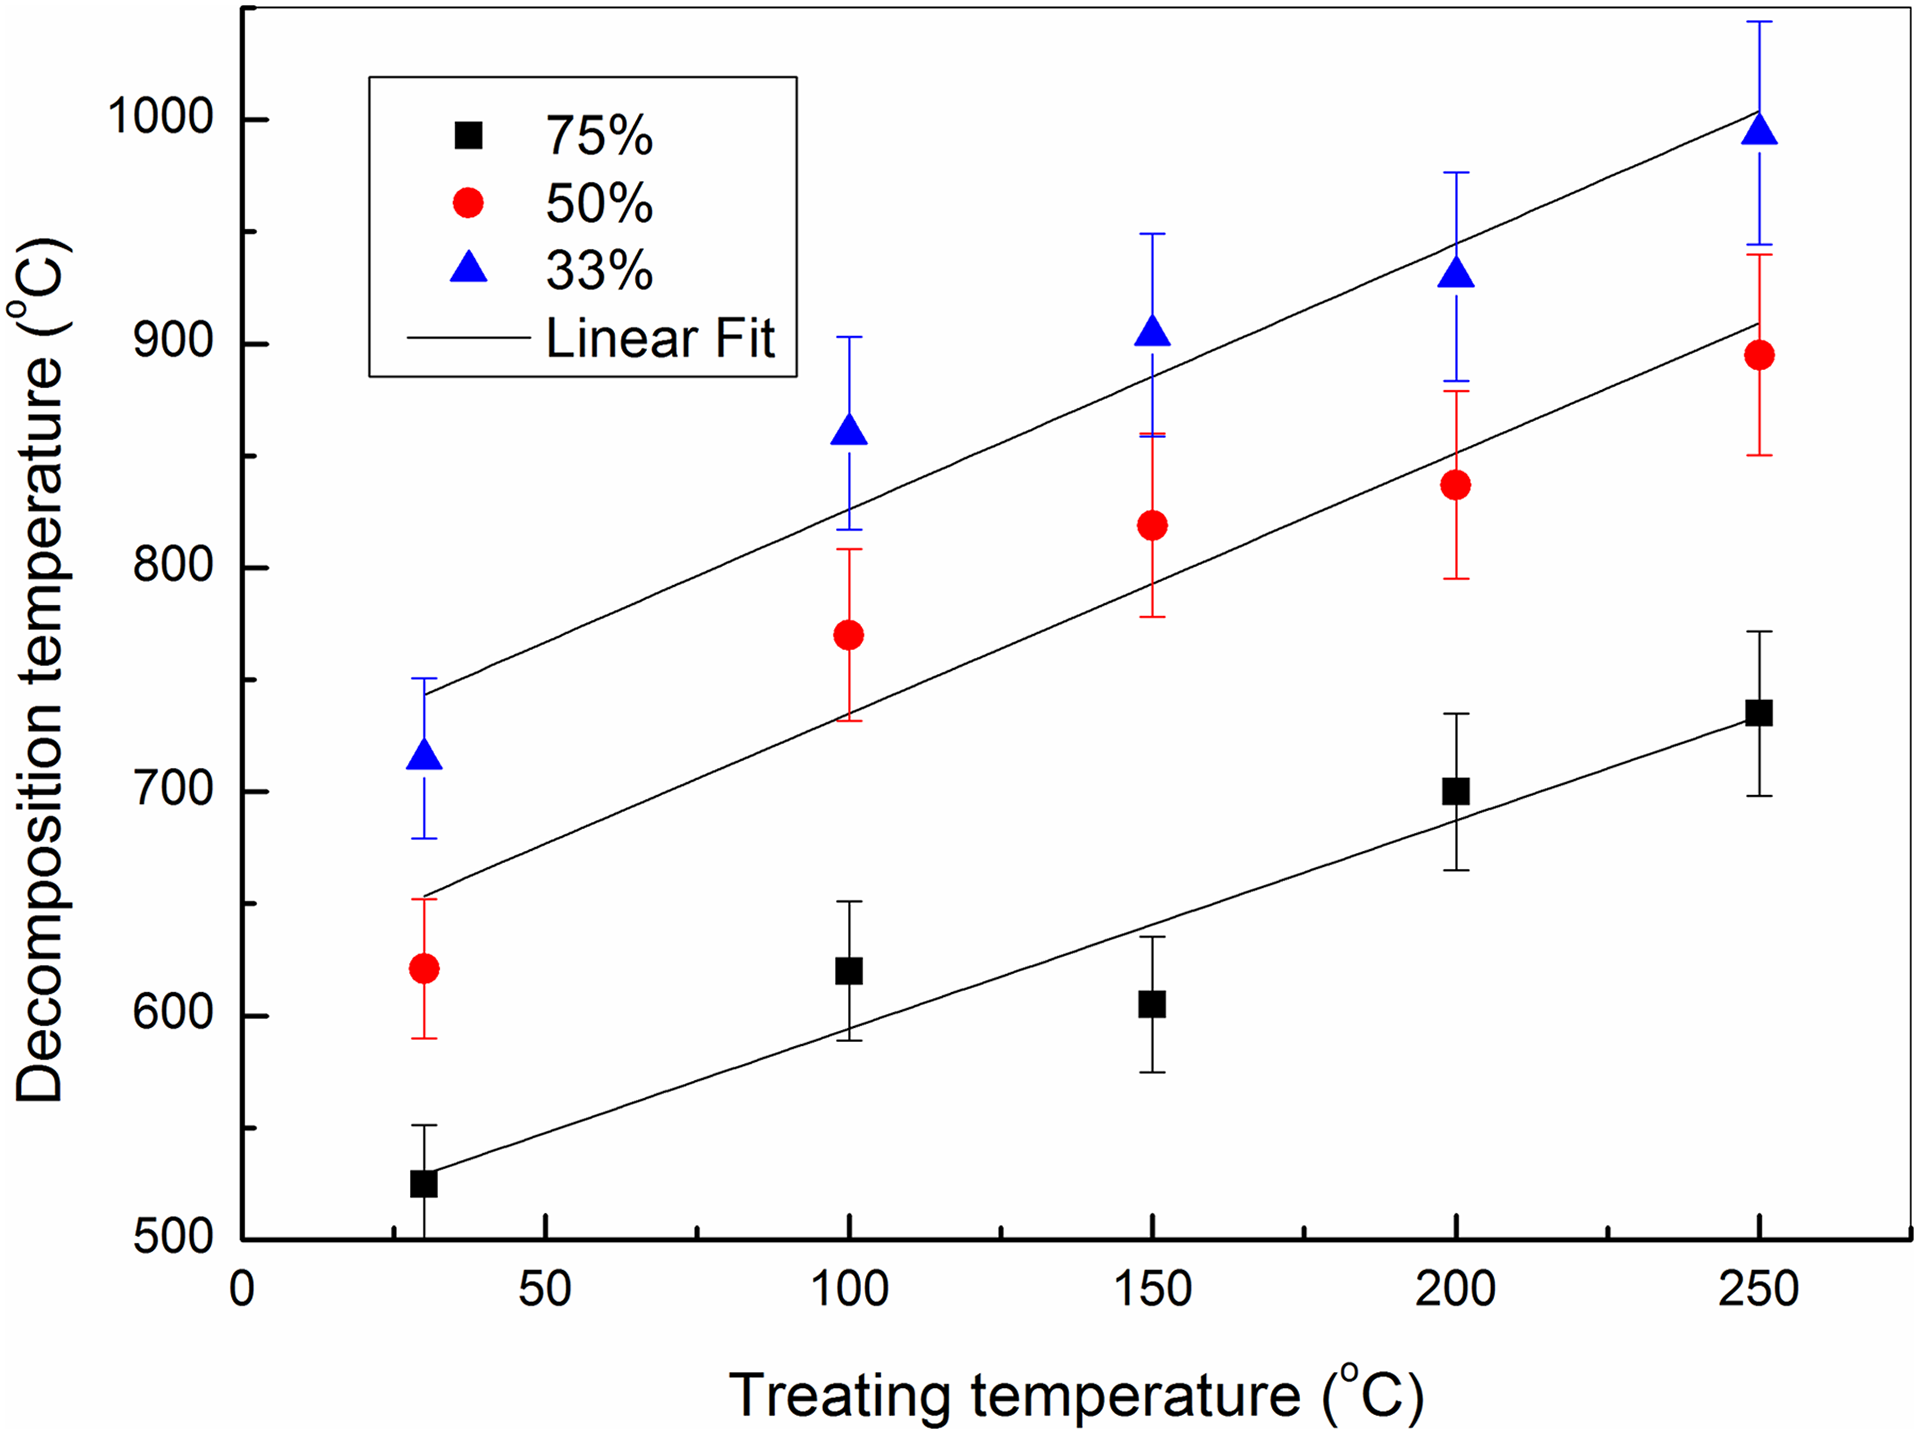
Dependence of the decomposition temperature for MWCNTs on treating temperature.
These discussions indicate that thermal treatment of MWCNTs in the presence of high pressure of solvents at relatively small temperature (up to 250°C) is effective for improving their oxidative thermal stability.
Activation energy for thermal decomposition of the treated MWCNTs relies on the residual mass and could be estimated using Coates and Redfern equation: 52,53

where Ea is the activation energy in J mol−1 and T is the absolute temperature in Kelvin, R is the universal gas constant (8.31 J (mol.K)−1), and α is the fraction of weight loss given by:

where wT
, wI
, and wF
are the weight at temperature T and the initial and final weights of the samples, respectively. By drawing the dependence of
Raman spectroscopy of thermally treated MWCNTs
Raman spectroscopy was used to investigate the morphology change (graphitic ordering, defects, etc.) of MWCNTs treated with this technique at different temperature. Figure 4 shows the Raman spectra of the MWCNTs before and after treatment. In case of the untreated MWCNTs (lower curve), first- and second-order Raman spectra of MWCNTs are displayed. The first-order Raman spectrum showed two strong bands which are well identified as G and D bands. Distinguished D band peak is observed at 1325 cm−1 which shows existence of defects, disordered, and amorphous carbon. The obvious G band (at 1585 cm−1) produced from the graphitic nature of the MWCNTs is also identified. It related to the in-plane vibration of two atoms in a hexagonal lattice. The ratio of the intensity of D to G bands (I D/I G) indicates the degree of disorder in the carbonaceous material. This ratio for the untreated MWCNTs was 1.29. The high ratio of intensities, I D/I G, indicates that the CNTs are not well graphitized.
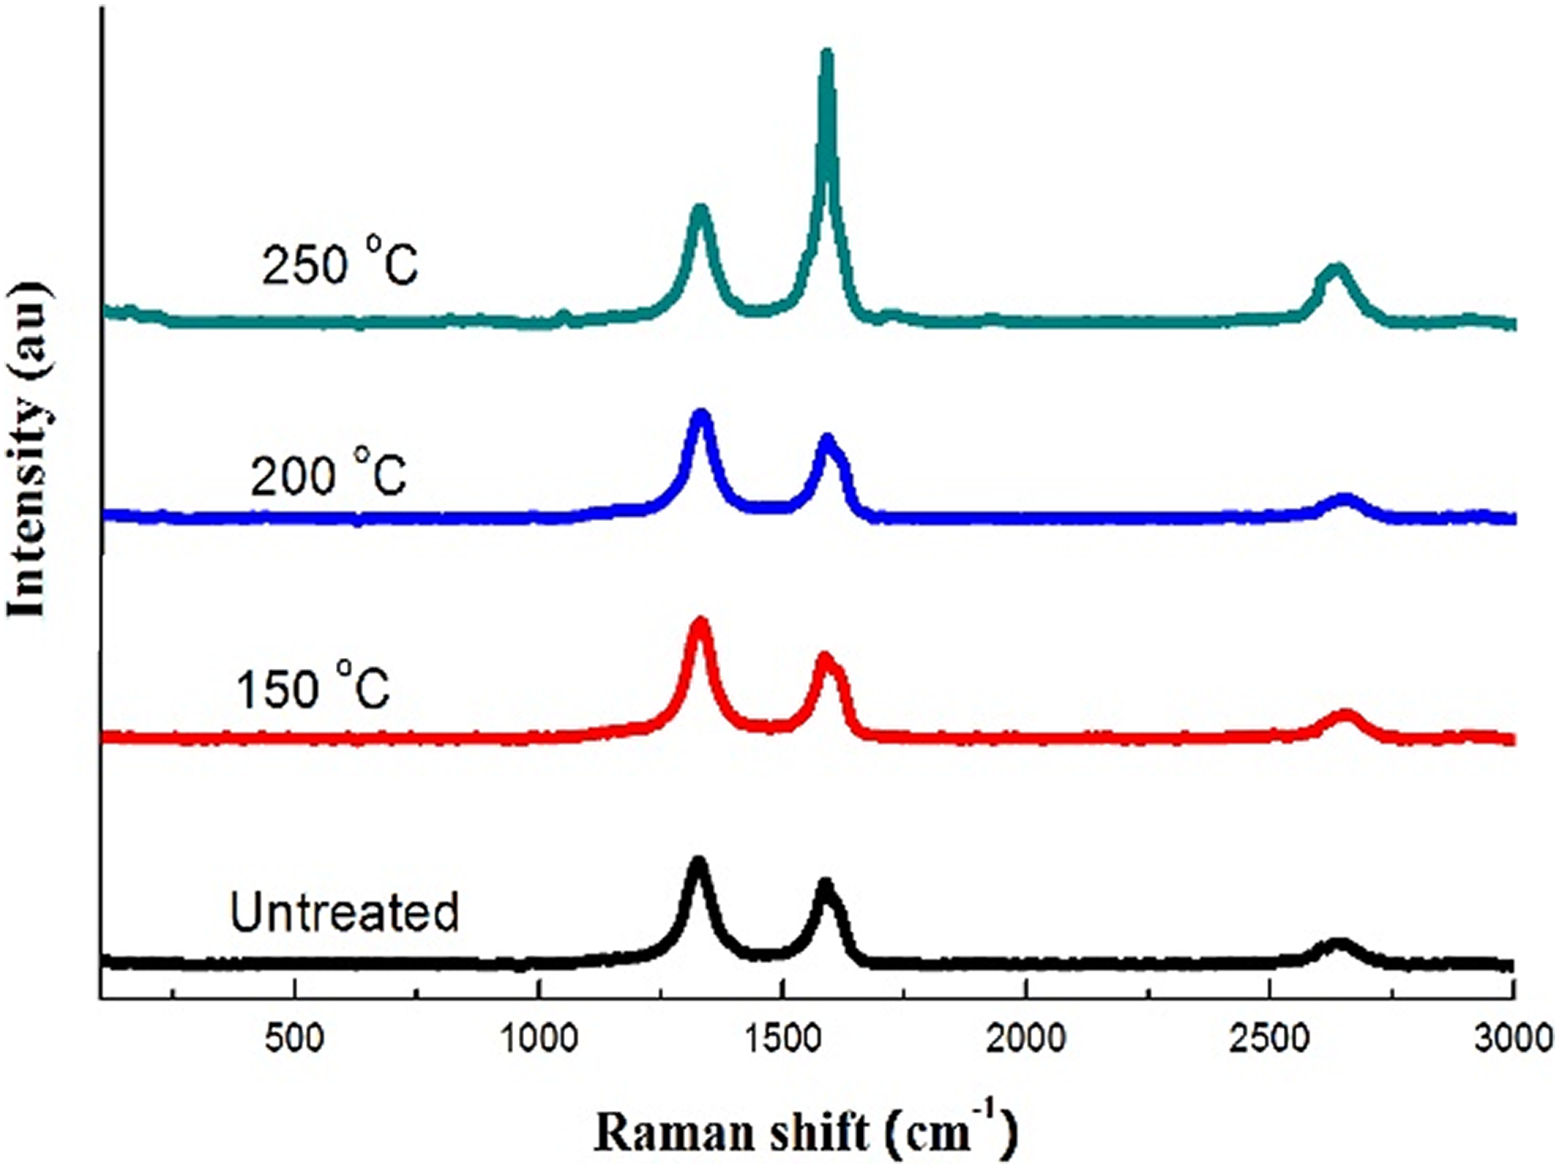
Raman spectroscopy of MWCNTs thermally treated at different temperatures.
According to the literature, the I D/I G ratio between 0.5 and 0.9 means that the carbon owns high-grade crystallinity and the smallest graphite crystallites are at least larger than 5 nm. 54 In the current case, it shows that the untreated MWCNTs are less ordered and more defective. Second-order Raman spectrum is observed as a clear peak at 2637 cm−1. This band is assigned as 2D-band. This band is an intrinsic property of well-ordered sp2 carbons 40 and closely related to the band structure of graphene layers in carbon. It has been reported that 2D-band further downshifts due to disorder or defects presence in carbon lattice. 55
Raman data suggest low-quality carbonaceous backbone for the untreated MWCNTs meaning that these MWCNTs are entangled to each other and twisted, which creates more defects on the surface of CNTs.
During the thermal treatment of MWCNTs at 150 and 200°C, a little change is observed through Raman spectrum as shown in Figure 4. At 150°C, a little increase is observed for D band while a little decrease occurs for G band at 200°C. Therefore, the degree of disorder in the carbonaceous material I D/I G ratio increased at 150°C. On the other hand, thermal treatment of MWCNTs at 250°C produces a clear positive effect on the ordering of MWCNTs. Where the G band becomes sharper and its intensity increased from 573 to 1877. It leads to a high reduction of the degree of disorder in the carbonaceous material I D/I G ratio from 1.29 to 0.45. It must be noted that there is no change observed for the D band. It means that the solvent molecules, which converted into vapor, at high pressure and temperate 250°C enforce the MWCNTs to become more ordered through increasing the dispersion of nanotubes and decreasing the curvature and twisting of nanotubes. These results suggest that the solvent molecules at high pressure are adsorbed over the surface of CNTs. With 150°C and 200°C, they tried to penetrate inside the matrix of MWCNTs to make shield among the nanotubes and prevent van der weal’s forces. At 250°C, the solvent vapor molecules get high energy and mobility to penetrate and adsorb among the nanotubes causing steric repulsion among the nanotubes and decreasing the curvature and twisting of the nanotubes. This mechanism is confirmed by increasing the degree of disorder I D/I G ratio from 1.29 to 1.45 at 150°C and sharply decreasing to 0.45 at 250°C. According to the literature, this ratio 0.45 means that the treated MWCNTs become possessing high-grade crystallinity and the smallest graphite crystallites are at least larger than 5 nm. 54
SEM analysis of thermally treated MWCNTs
This used mechanism is confirmed by field emission SEM. SEM images have shown in Figure 5. The untreated MWCNTs have highly curved stacked cylinders with 2D shape. By treating MWCNTs with the solvent molecules at high pressure with different temperatures, separation among the MWCNTs is observed at 100, 200, and 250°C. Also, SEM images show the presence of voids between the bundles of the MWCNTs indicating penetration of solvent molecules through the aggregates of MWCNTs and confirming the suggested mechanism for the novel technique. Furthermore, 3D shape is observed for the treated MWCNTs.
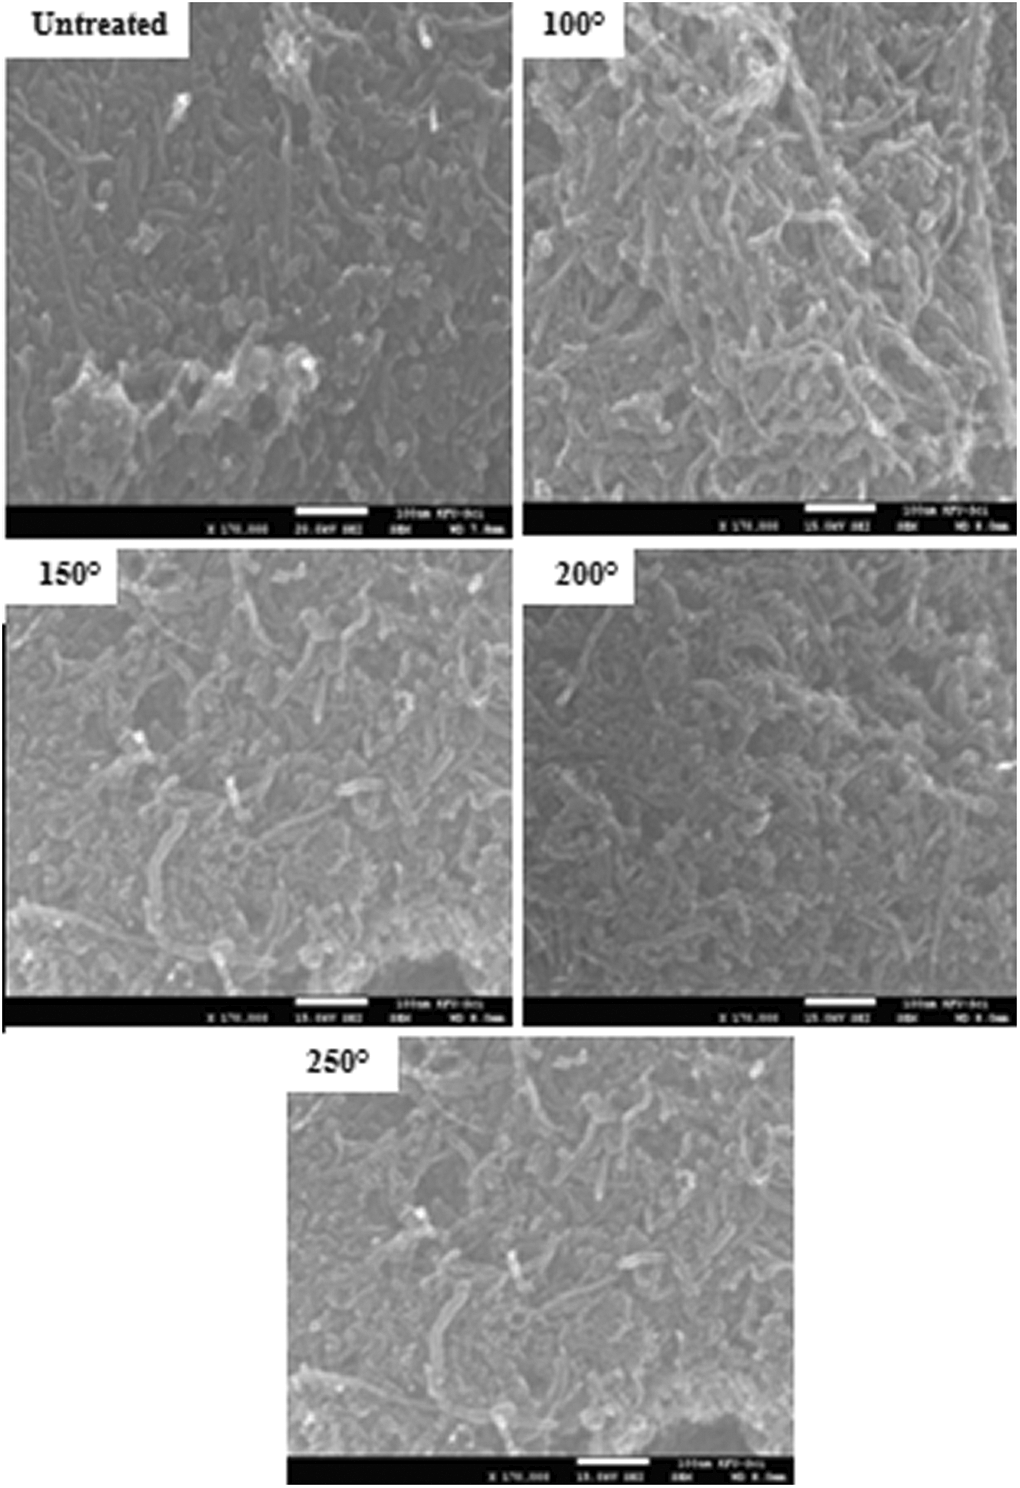
SEM photographs of MWCNTs thermally treated at different temperatures.
Electrical resistivity of thermally treated MWCNTs
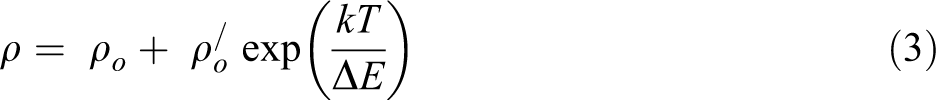
The electrical resistivity of MWCNTs is a good indicator of their structure. Figure 6 shows the dependence of the electrical resistivity on the treating temperature for the thermally treated MWCNTs. The electrical resistivity of the untreated MWCNTs equals 0.33 Ω cm. This value is increased to 0.54 Ω cm (about 61%) for samples treated at 250°C. This appears to be due to the presence of voids created in the bulk of the samples with thermal treatment process. These voids separate CNTs from each other and make fewer contacts between them leading to an increase in the resistivity. The behavior of resistivity increase is found to be exponential according to the formula:
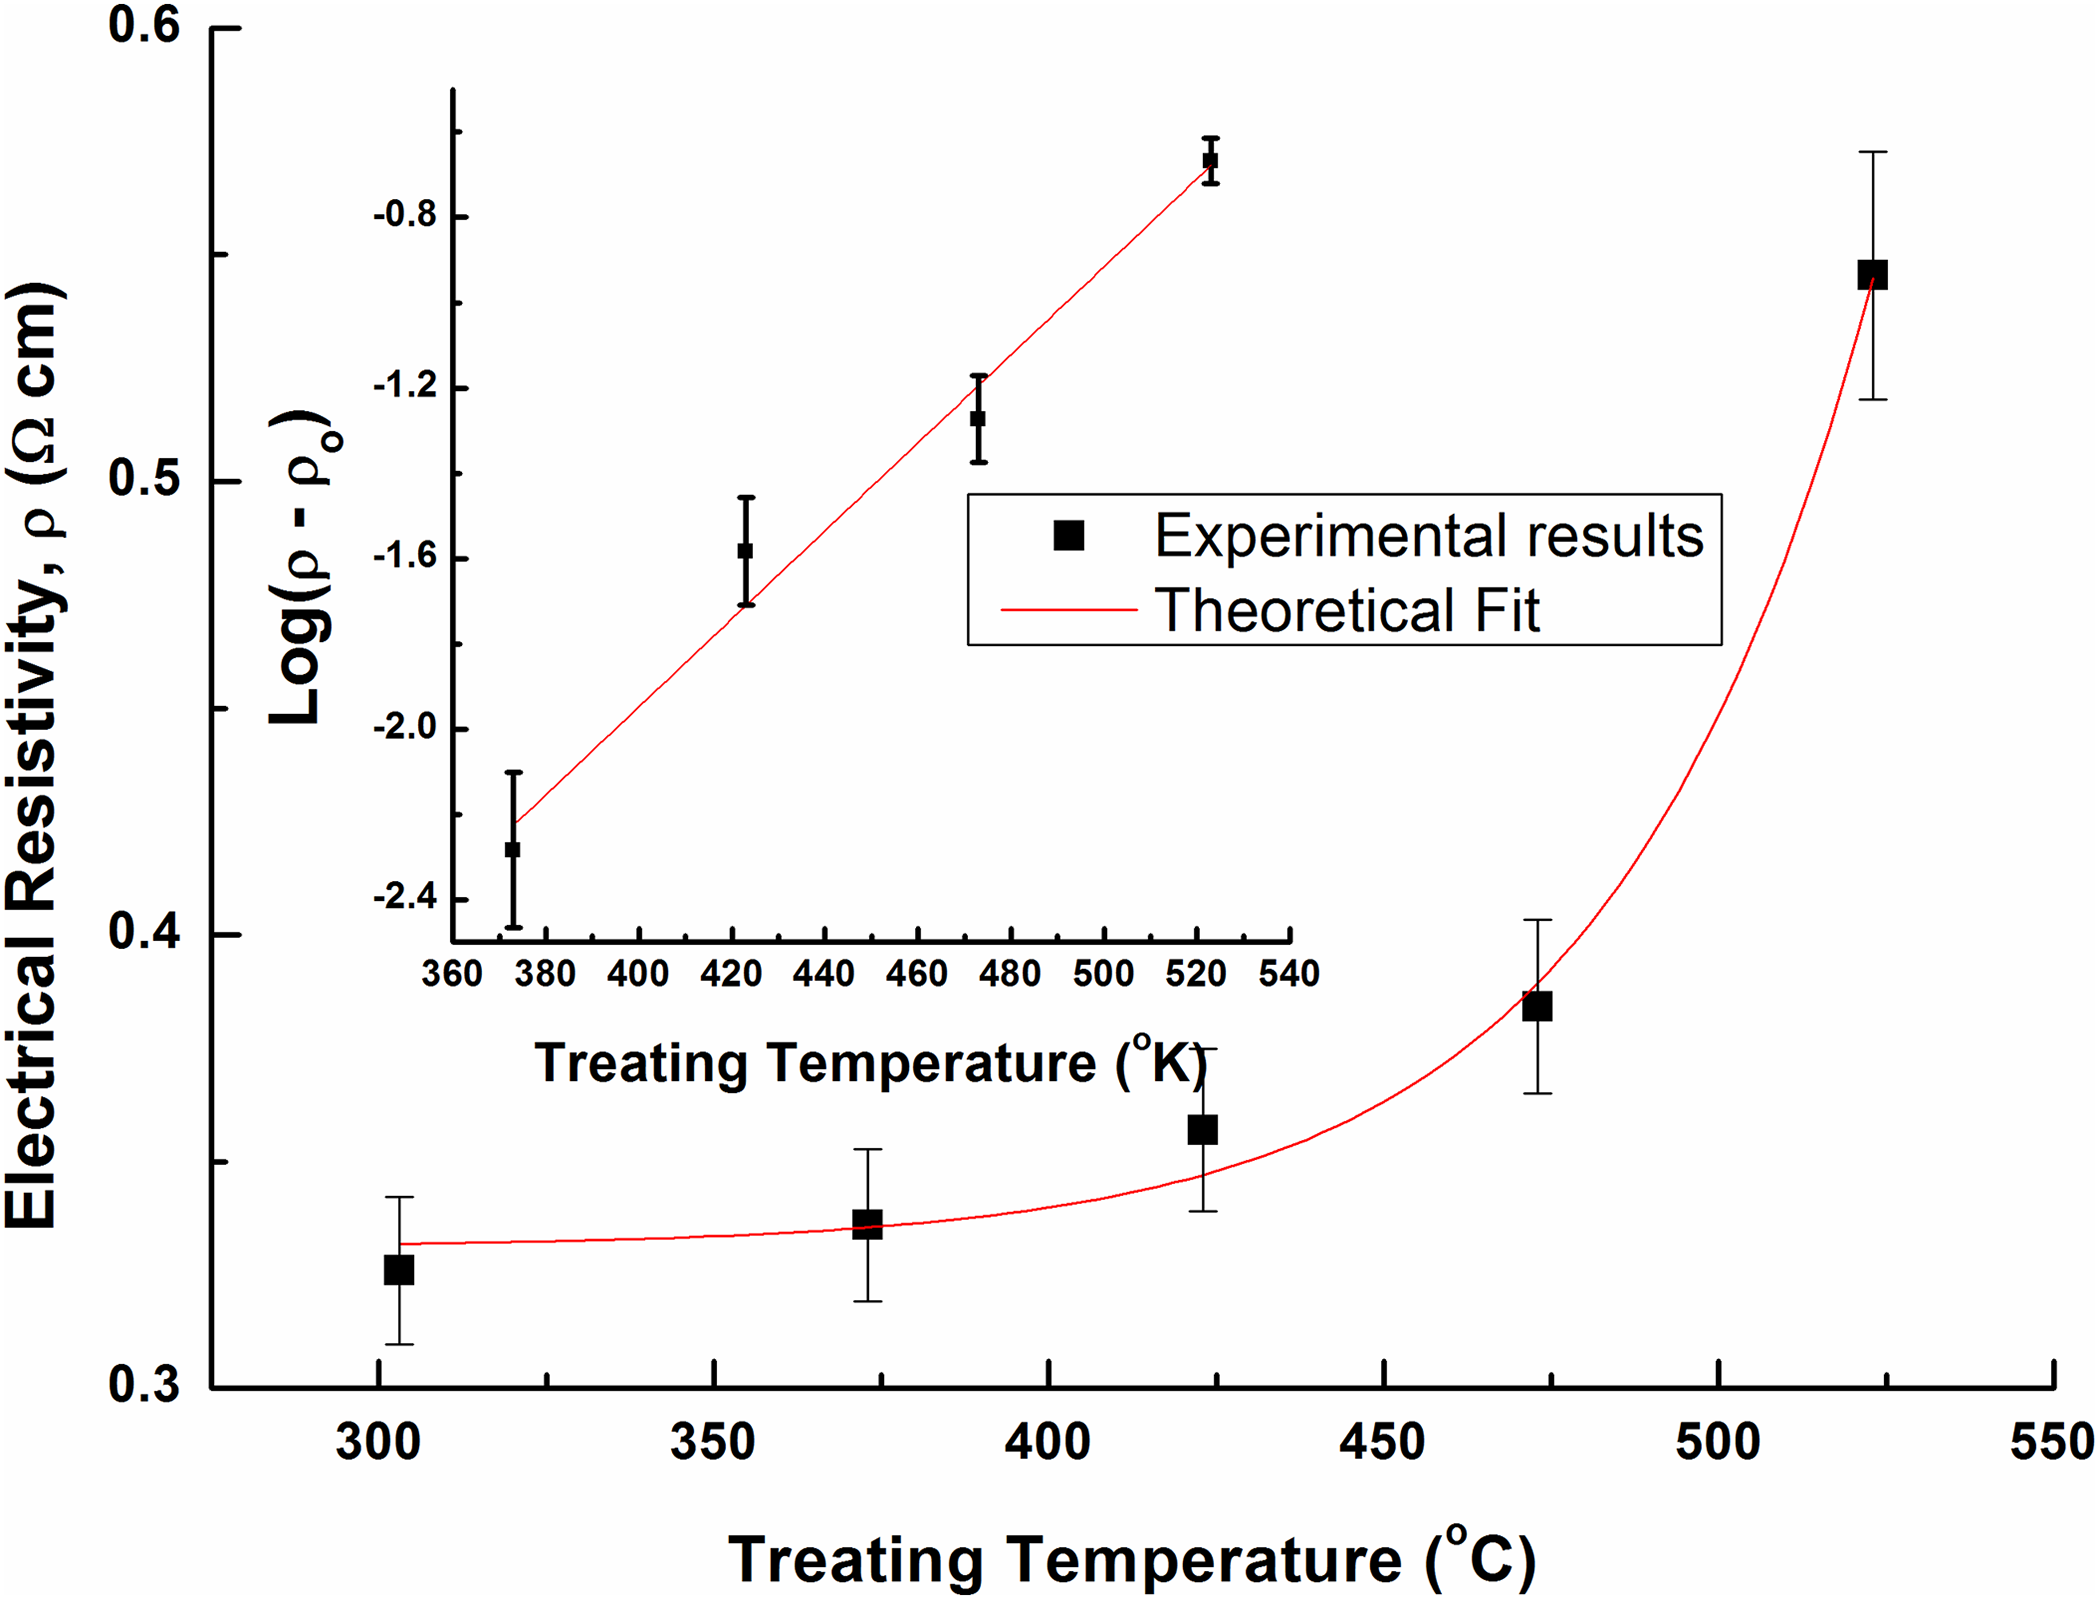
Dependence of the electrical resistivity of MWCNTs on treating temperature. The inset shows the dependence of the logarithm of resistivity on treating temperature.
where
AC electrical properties of polymer blend loaded with MWCNTs
Beside the defect structure and low oxidative thermal stability, commercial CNTs tend to agglomerate in bundles and their dispersion in many solvents is limited, and this is reflected as limitations in polymers loaded CNTs nanocomposites applications. The development of the electrical properties of polymers loaded CNTs depends strongly on the degree of dispersion of CNTs through the polymer matrix as well as the interaction between them and polymer chains. Physical (ultrasonication and high shear mixing) and chemical (surfactants, melt blending, and surface functionalization) approaches were followed to improve the dispersion inside polymer matrices.
In this work, another novel approach is followed to enhance the dispersion of MWCNTs inside PVP-PVA polymer blend, which is reflected directly on the development of the electrical conductivity of the polymer nanocomposites. Figure 7 illustrates the AC electrical conductivity of PVP-PVA polymer blend loaded with different weight ratios of as received commercial MWCNTs (group MS1) and thermally treated MWCNTs (group MS2) at a frequency of 1.0 Hz and room temperature. The electrical conductivity of commercial MWCNTs polymer blend samples does not change, approximately, with increasing MWCNTs content due to the aggregation in bundle structure. On the other hand, blends containing thermally treated MWCNTs show percolation behavior. At low loading of CNTs in PVP-PVA blend, the conductivity of the composite is essentially equal to that of the polymer. In this case, fillers are dispersed inside the polymer matrix and there are no paths for charge carriers. As the loading increased, a critical loading or percolation threshold is reached; the conductivity starts to increase rapidly as a function of filler loading as shown in Figure 7. In this region, conductivity is limited by barriers to pass the charge carriers from one filler conducting site to another which is close but not in contact. Further increase in CNTs makes them in contact and the electrical conductivity reaches a constant value.
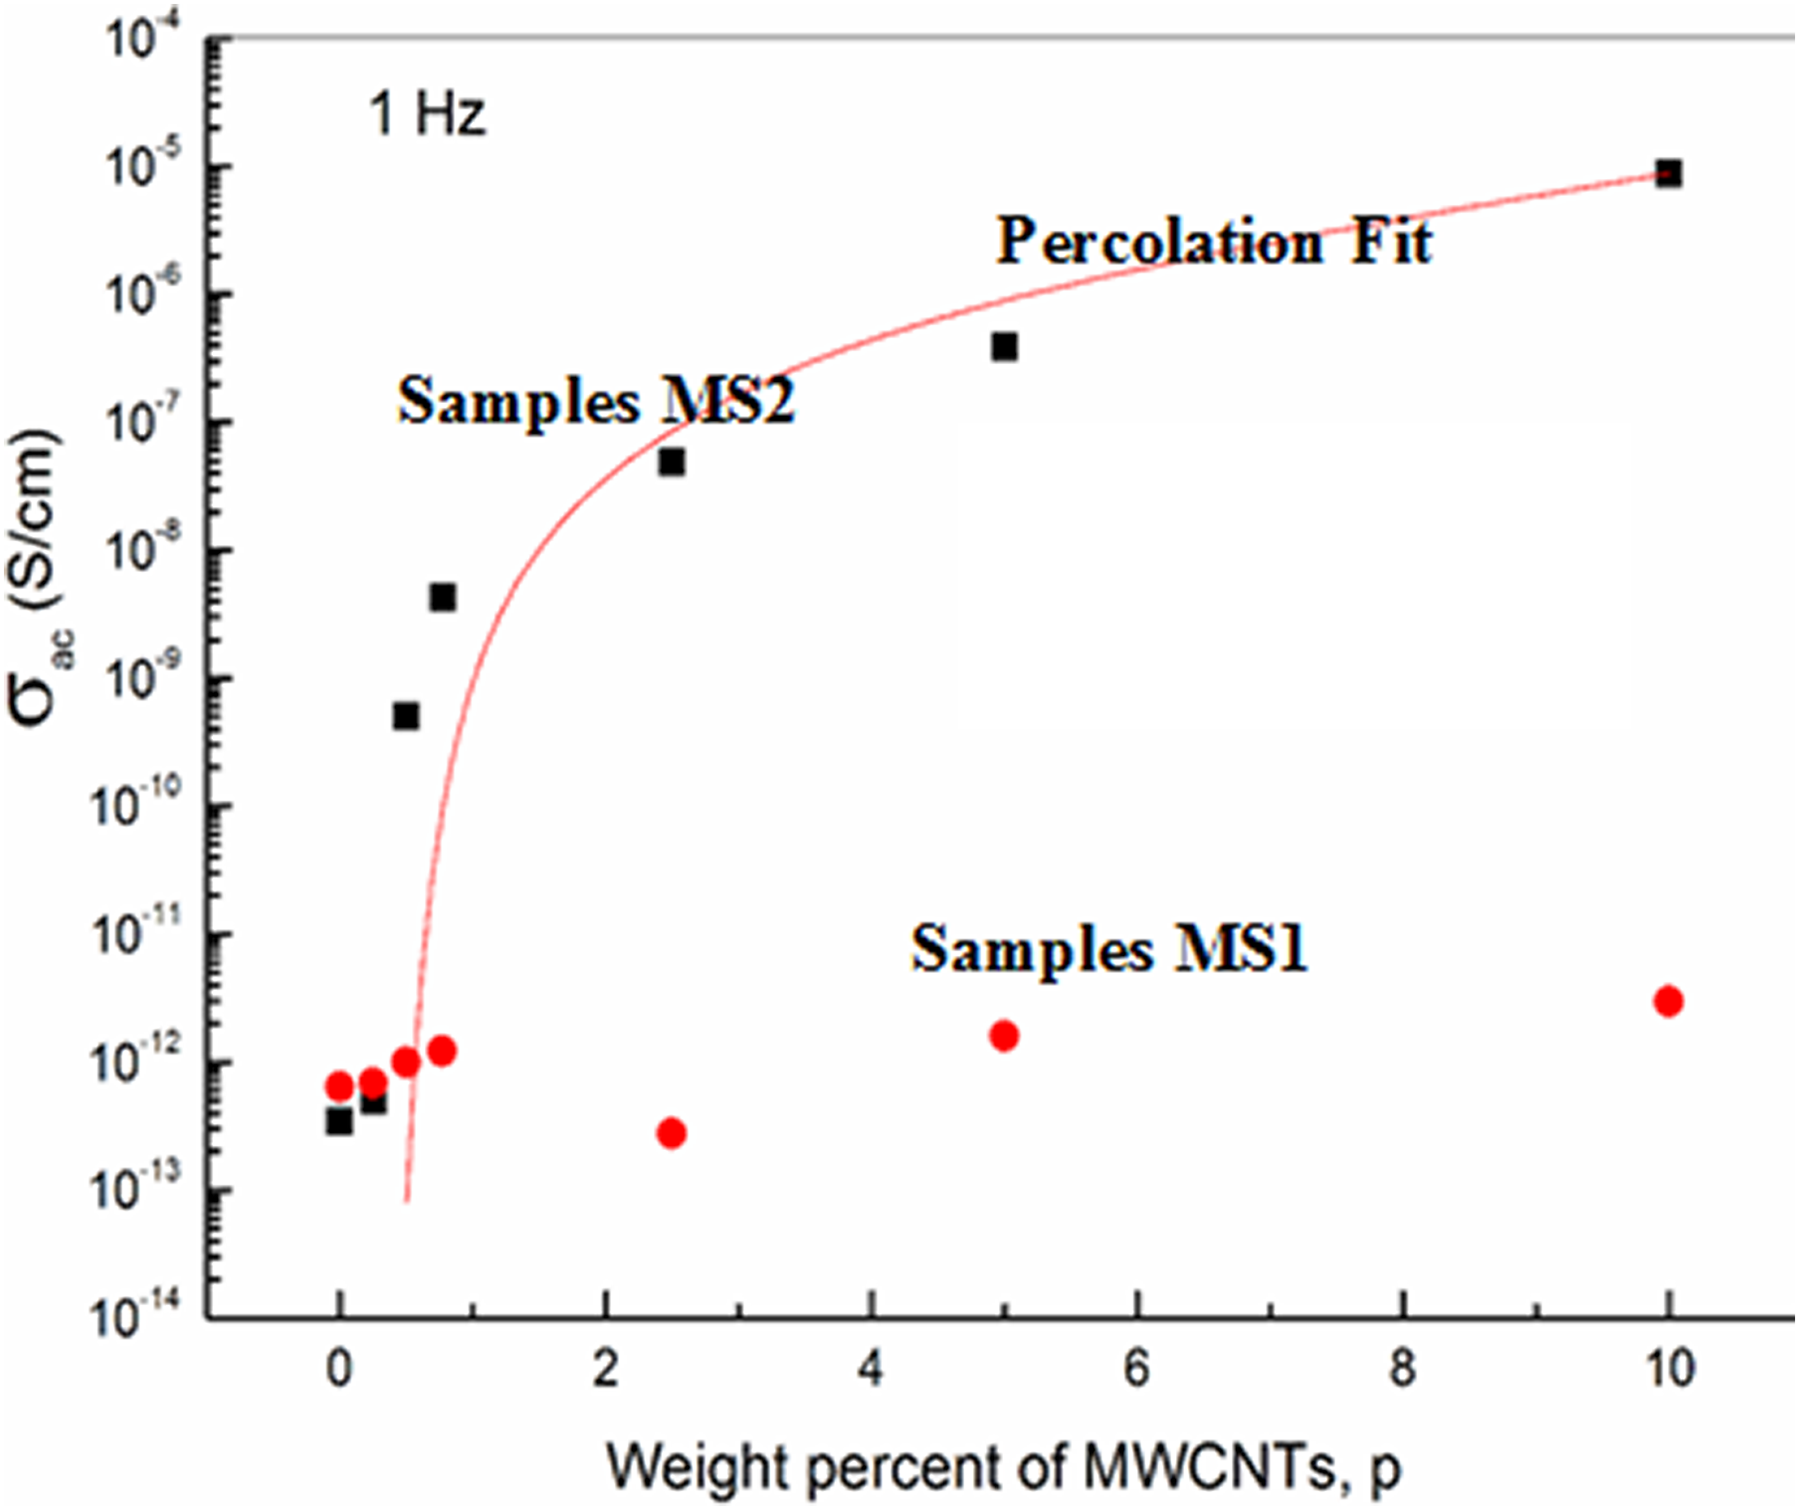
Dependence of the AC electrical conductivity of PVP-PVA blend on the weight ratio of MWCNTs for MS1 and MS2 group samples at 1.0 Hz and room temperature.
Ordering of MWCNTs and voids created between them during thermal treatment process overcome the van der Waals forces which make CNTs less staked and more dispersed through the polymer matrix. This appears well in the presence of the percolation behavior. This percolation behavior of MS2 samples obeys the equation:

where
The total impedance (Z) value that was measured for prepared composites was resolved into real (Z /) and imaginary (Z //) parts to construct effect of preparation technique as well as the concentration of MWCNTs on the behavior of the Cole–Cole Z plot which provides a strong evidence about the role of preparation technique on the formation of MWCNTs-polymer blend network. Figure 8 presents the Z Cole–Cole plot of MS2 group nanocomposite samples at different weight ratios of MWCNTs and at room temperature. The Cole–Cole Z plot consists of a high-frequency semicircle represented by a bulk resistor connected in parallel with a frequency dependent capacitor and a low frequency spike represented by a constant phase element. In this case, the motion of ions may occur through the polymer matrix free volume, which can be represented by a resistor. Capacitors represent the polarized immobile polymer chains in the alternating field. The ionic motion and polymer chains bulk polarization are in parallel and therefore the semicircle at high frequency can be observed.
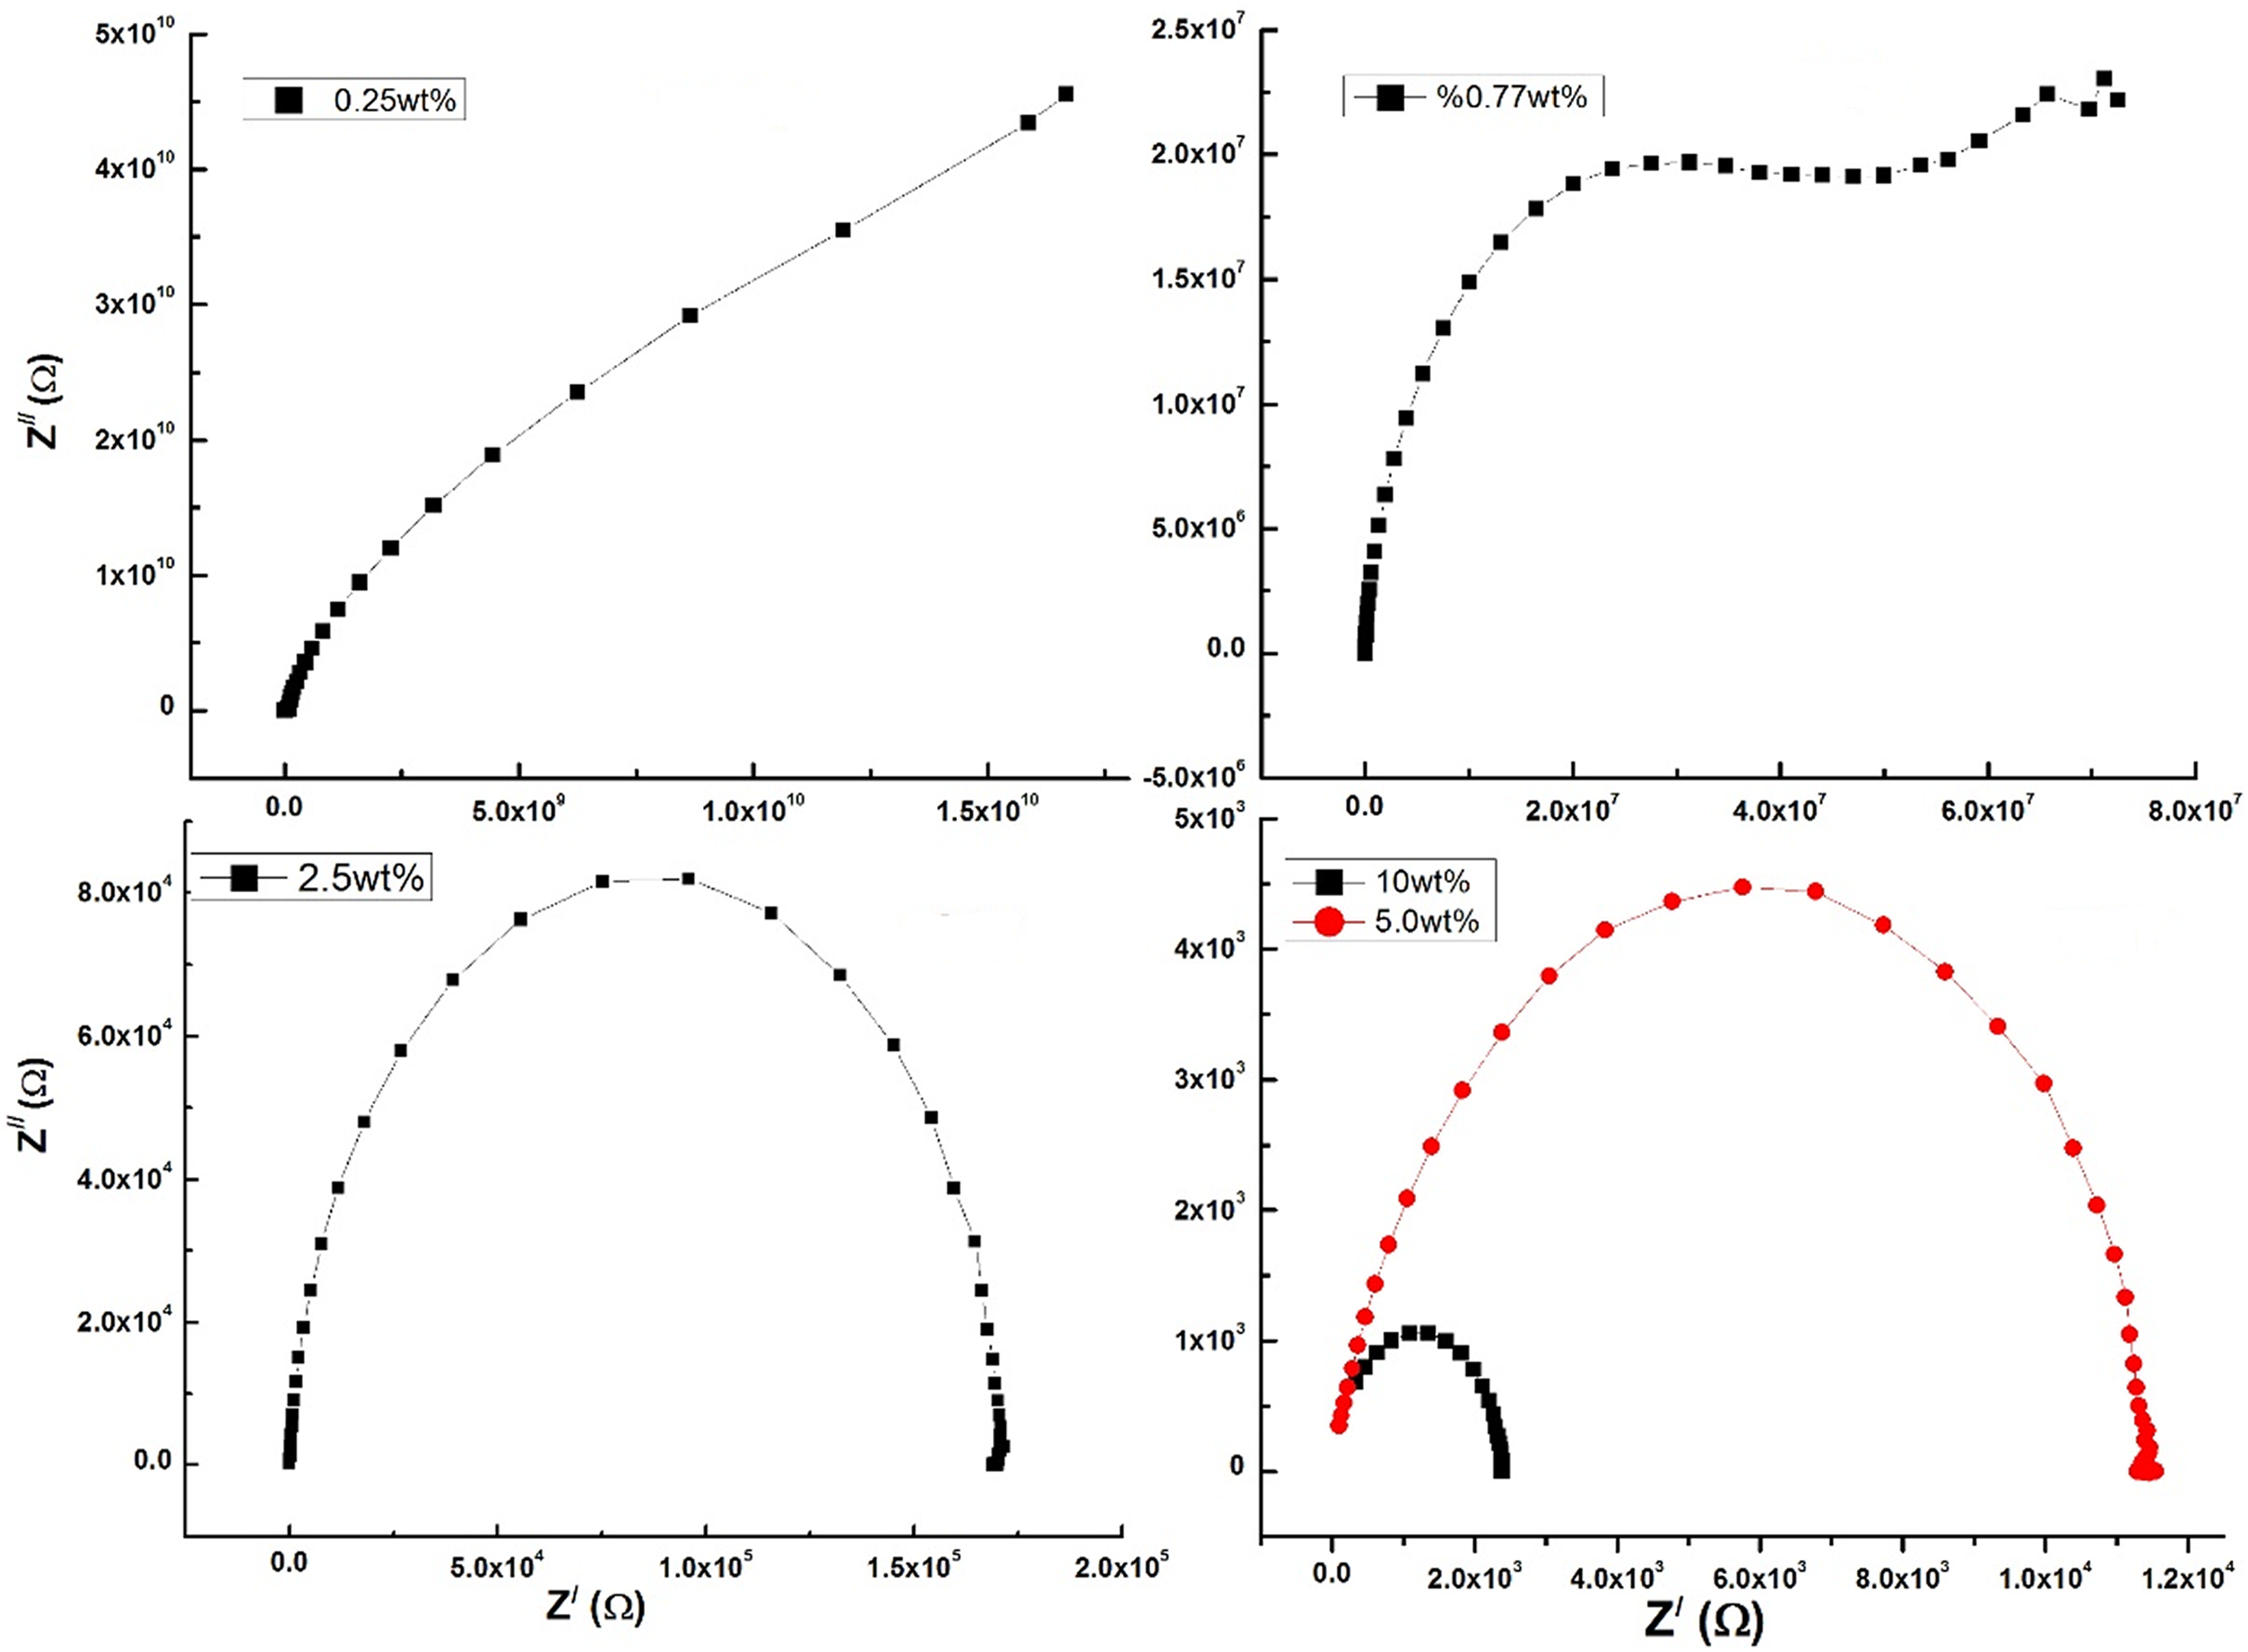
Cole–Cole impedance plots of PVP-PVA loaded with different weight ratios of MWCNTs for MS2 group samples at room temperature.
It is obvious from Figure 8 that Cole–Cole Z semicircles appear for MS2 samples. The radius of the Cole–Cole plot of composite decreases with increasing MWCNTs weight percent which indicates that the distance between CNTs–CNTs in the polymer network decreases besides the formation of dispersed CNTs networks. 59
The relaxation behavior of the prepared composites shows in all cases the existence of capacitor element and as CNTs content for MS2 samples increases the resistance element in these composites becomes more pronounced. However, it will be very interesting if we consider the Argand plot between imaginary part (M //) versus real part (M /) of the electric modulus to recognize the effect of the preparation technique and CNTs content on the relaxation behavior. It was reported previously 60 that if the Argand plot between M // and M / of electric modulus has semicircular behavior then the relaxation is due to conductivity relaxation process, if not, then it is due to viscoelastic relaxation (or polymer molecular relaxation).
In the present work, the values of M / and M // were determined using the following equation:

where
Figure 9 plots the relation between M // and M / for MS2 samples room temperature. The figure shows semicircles behavior with small radii for high MWCNTs content. It was reported that the radius of the arc of Argand plot is related to the electrical conductivity of the matrix that is small radius means higher electrical conductivity. 61 This indicates that thermal treatment makes good dispersion of MWCNTs and produces a 3D network. This shows that the relaxation behavior is mostly due to charge conductivity relaxation. 60,62 –65
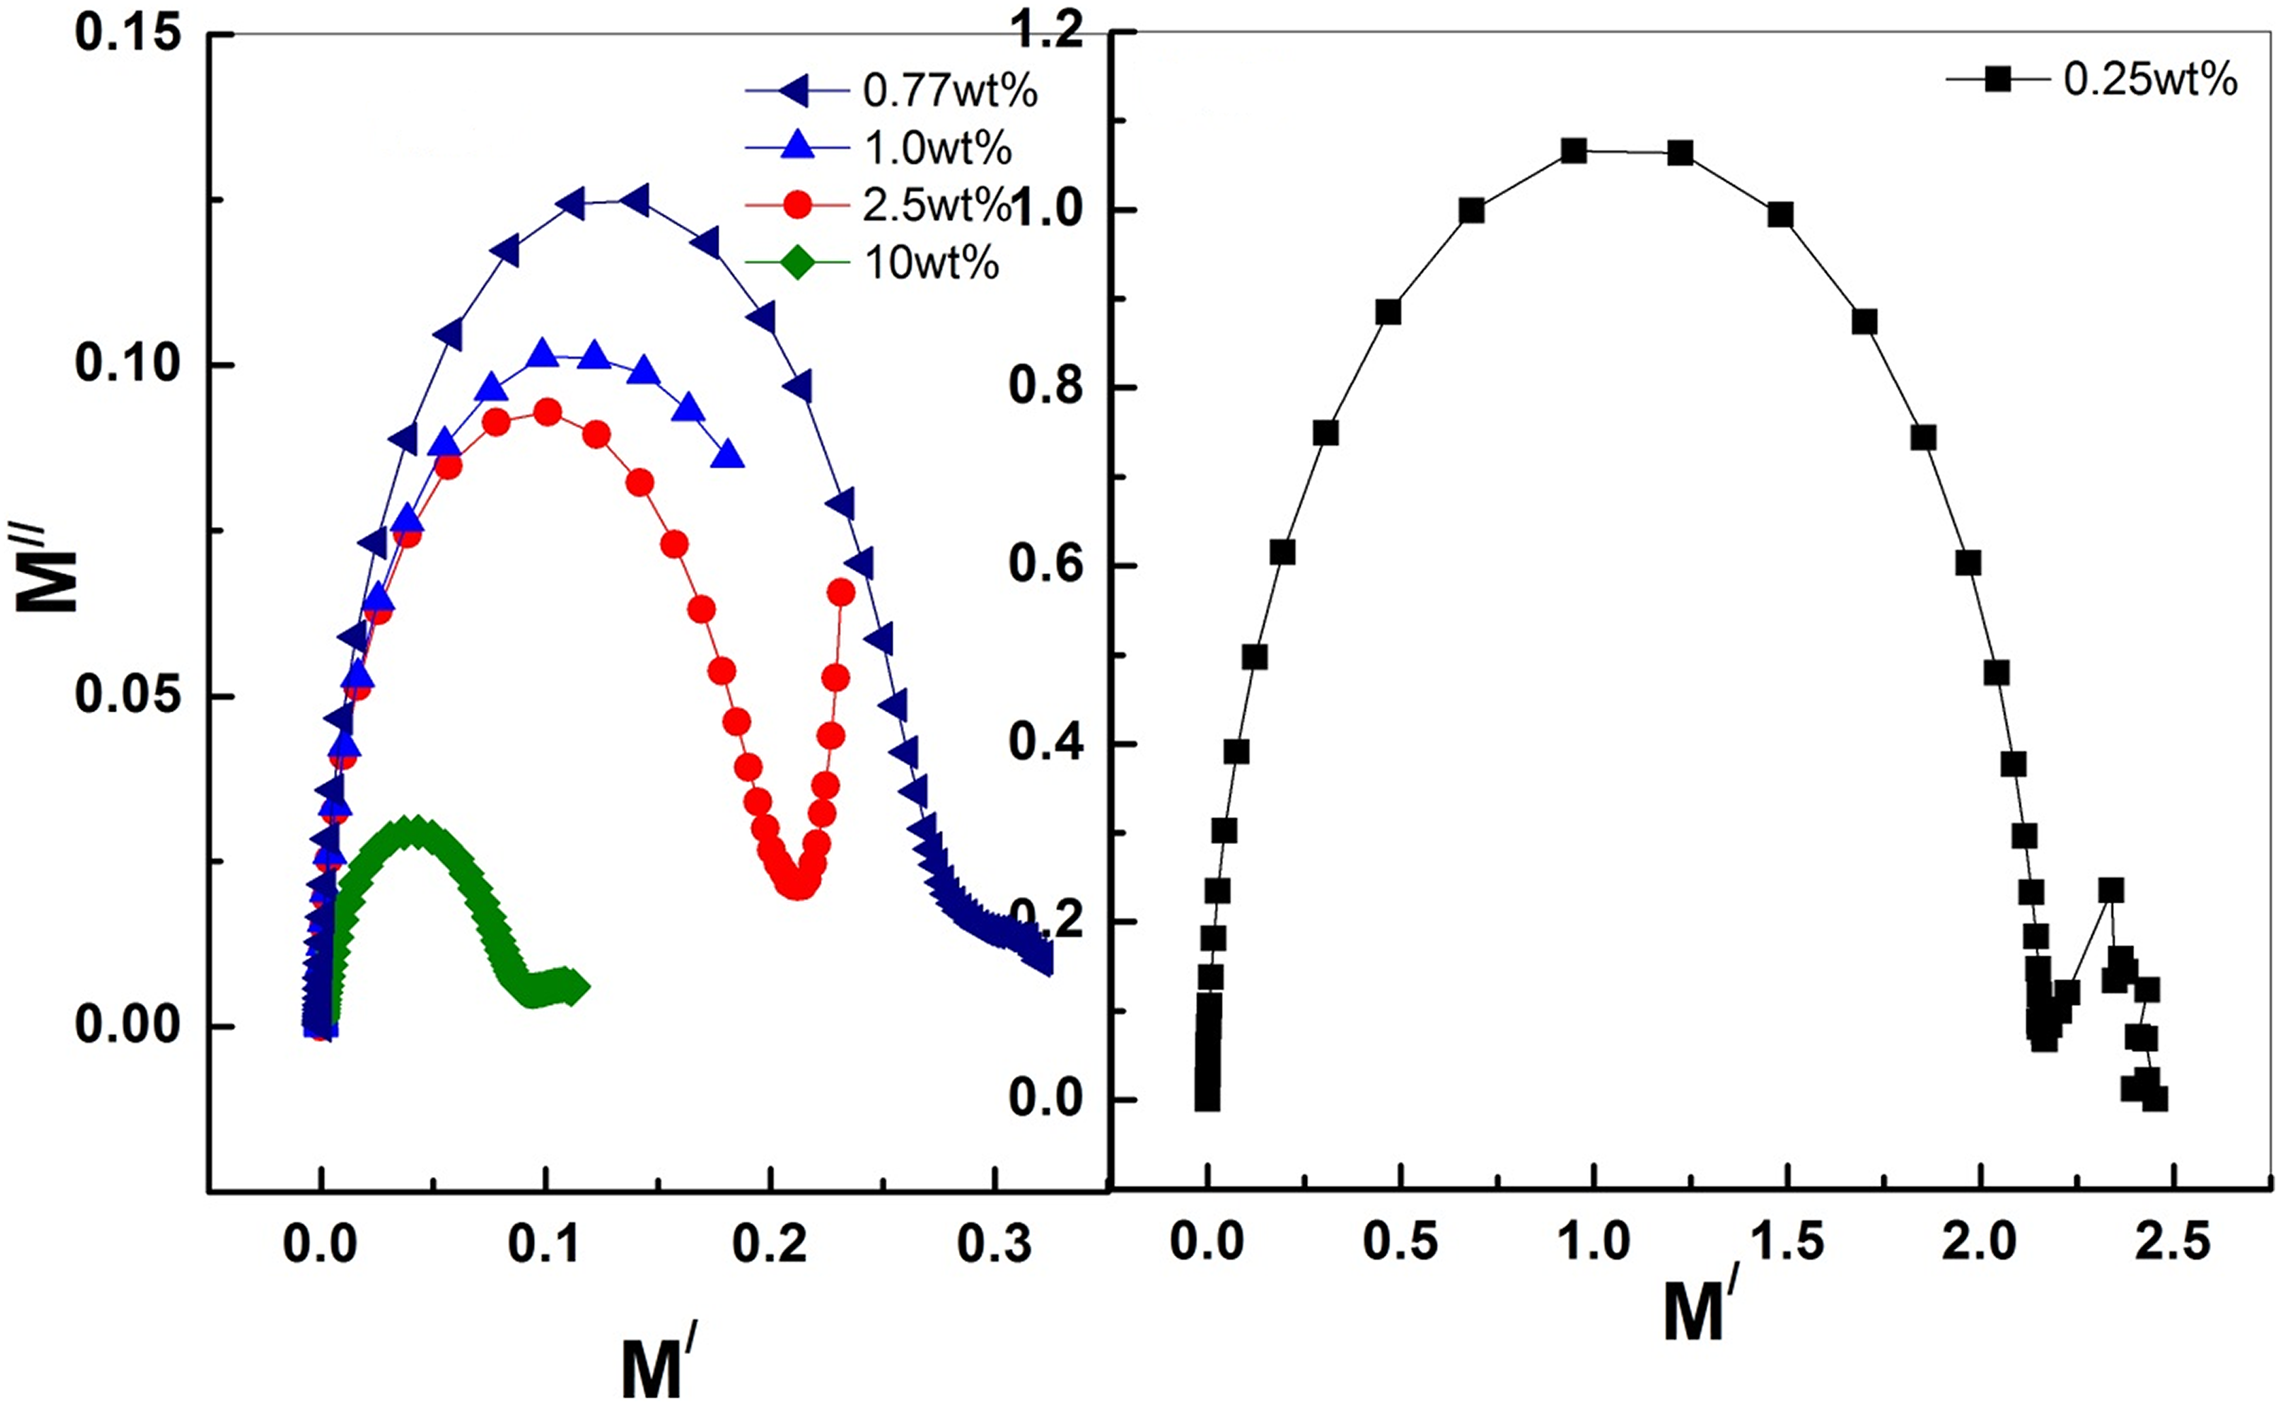
Argand plots of PVP-PVA loaded with different weight ratios of MWCNTs for MS2 group samples at room temperature.
Raman spectroscopy of thermally treated MWCNTs loaded PVP-PVA blend
Figure 10 presents the Raman spectra of MS2 samples. It shows a presence of polymeric characteristic modes even at 0.77 wt% CNT loading with no significant decrease in the 1425 cm−1 CH2 stretch peak intensity. Even the small peak of C=O stretch mode related to the polymers crystallinity is also present at 1732 cm−1 and there is no shift toward low or high frequencies as compared with pure sample. Thus, the 0.77 wt% CNT-loaded sample manifests an intermediate phase of the polymer crystallinity. Moreover, on further increasing the CNT loading, as can be seen from the 2.5 wt% CNT-loaded sample’s spectrum, the as-blended nanocomposite completely loses the polymeric crystalline phase.
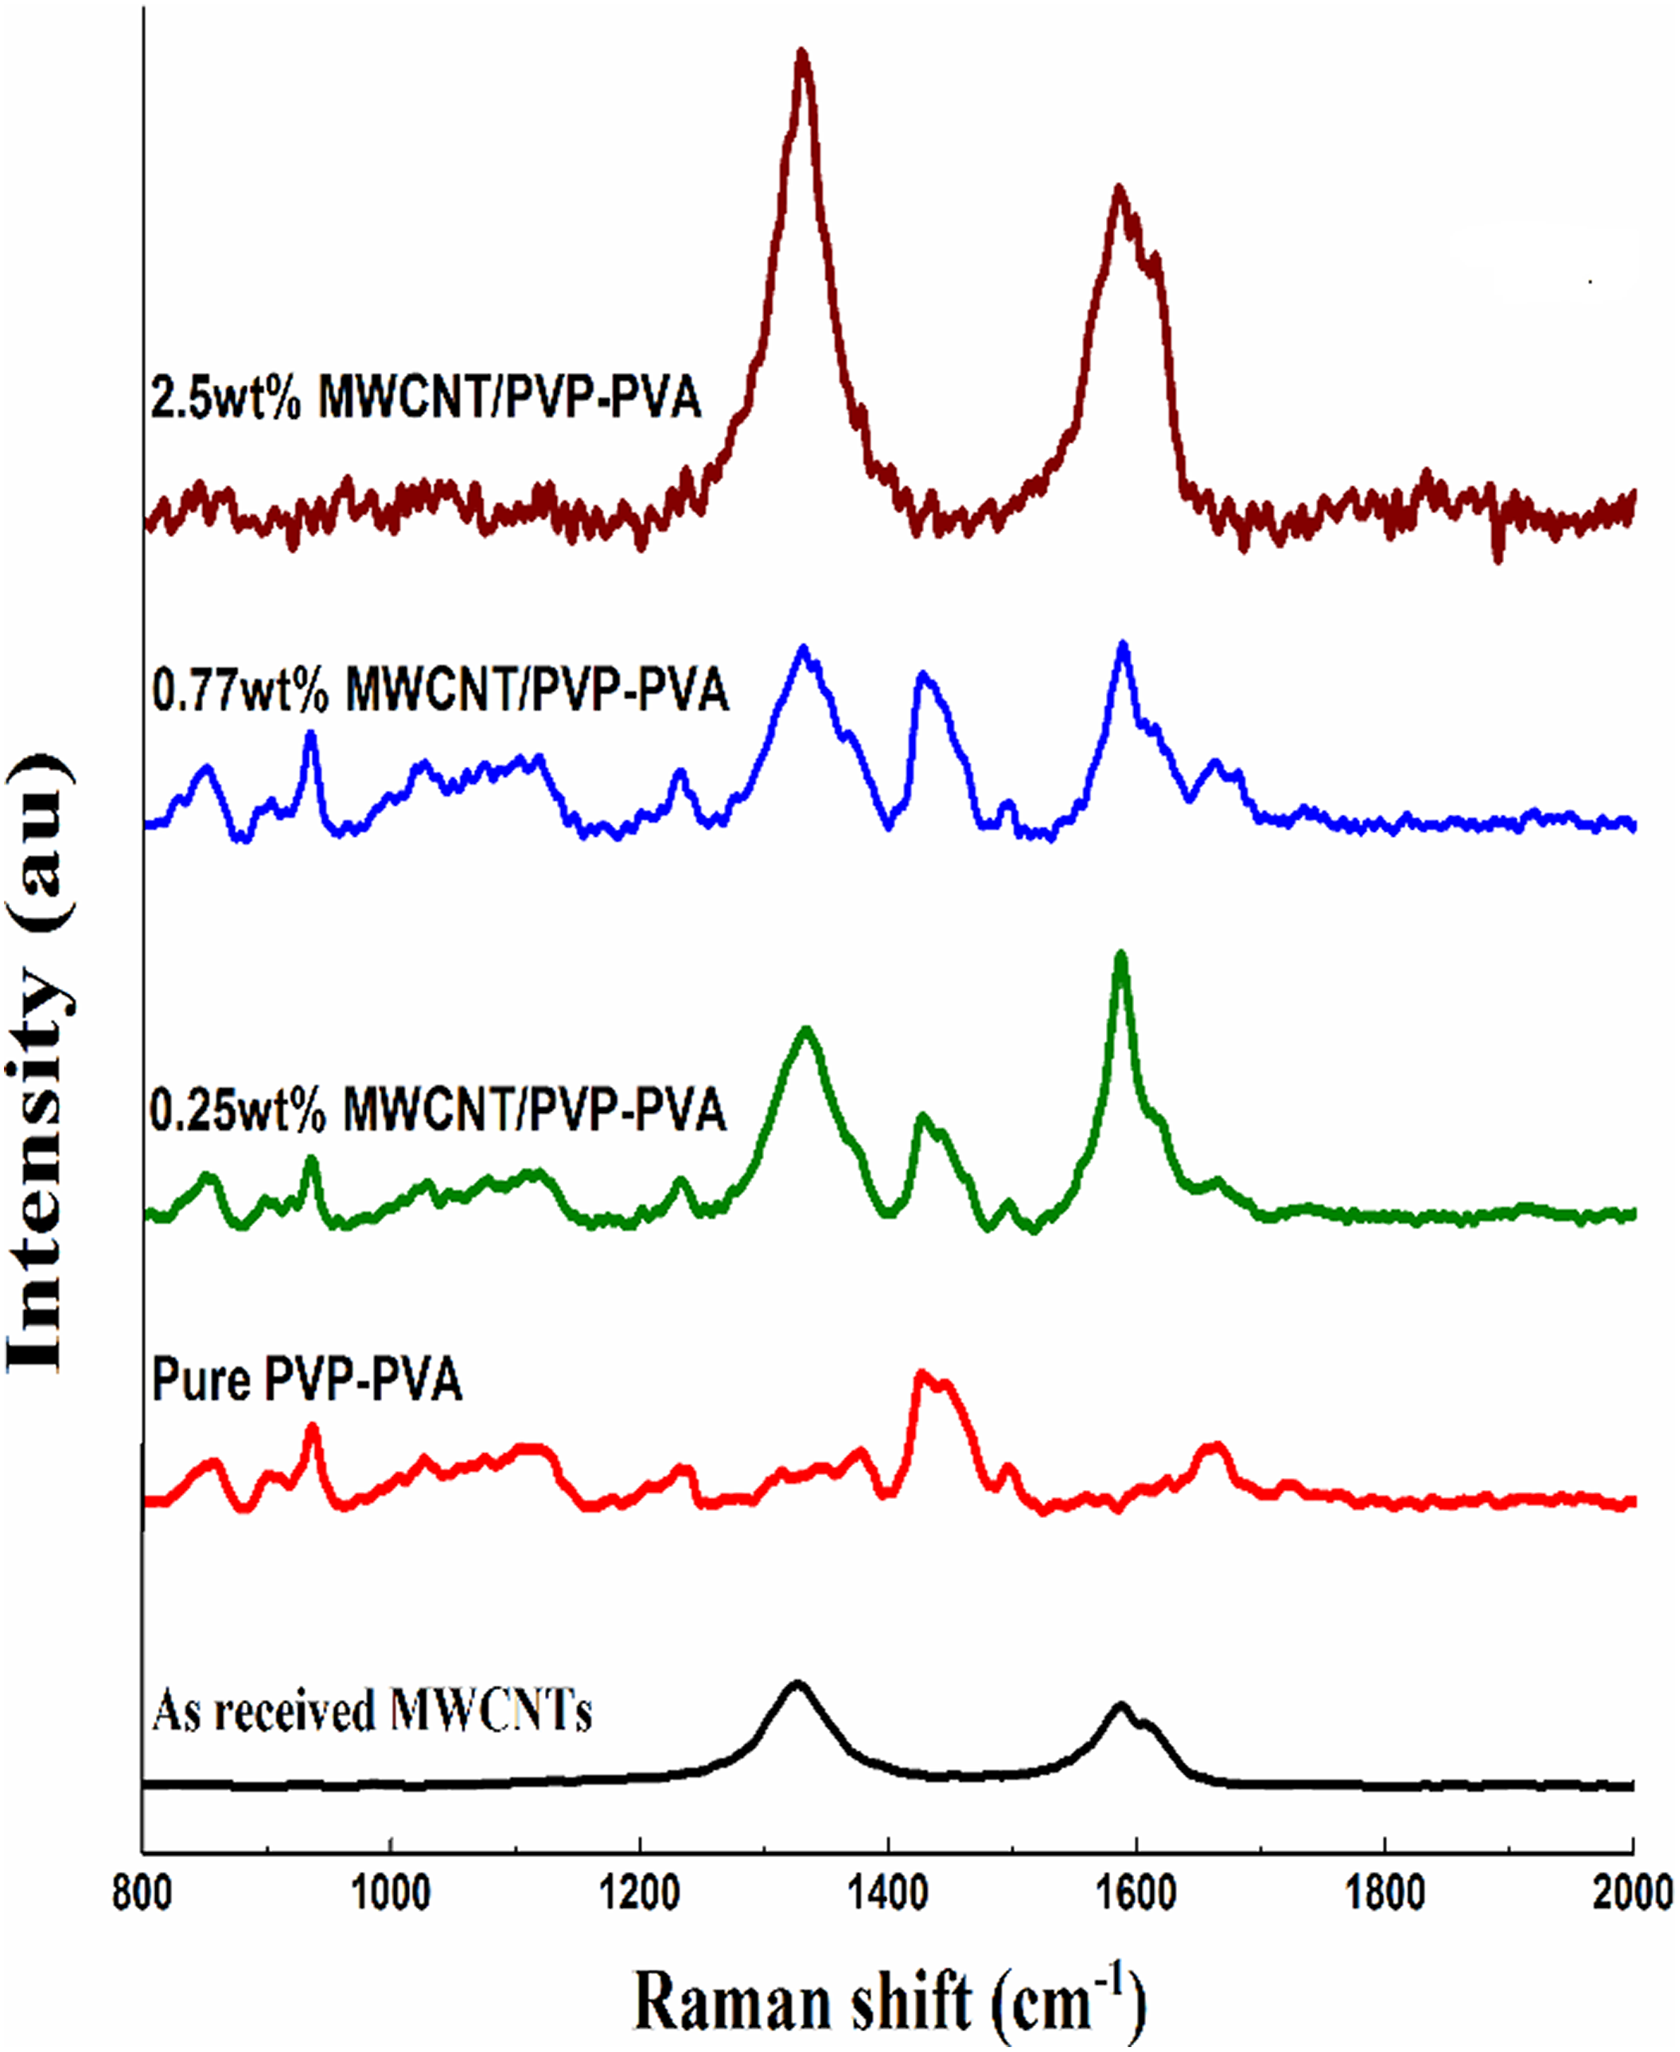
Raman spectroscopy of PVP-PVA blend loaded with different weight ratios of MWCNTs for MS2 group samples at room temperature.
A good dispersion of MWCNTs in the polymer matrix is related to the extent of debundling of the CNT aggregates or clusters. 66 It is observed that all the characteristic CNT Raman modes show upshift behavior during the debundling; we have found D-band-related higher frequency shifts approximately 2–10 cm−1 in respect to CNT loading. Maximum stiffening of 8 cm−1 for the 0.77 wt% CNT-loaded sample. Moreover, the G-band peak is also found to be correspondingly upshifted by 2 cm−1. The higher stiffening indicates proper dispersion of the polymer inside the CNT bundles. On further increasing the CNT loading to 2.5 wt%, the Raman modes are found to be resoftened and converged to pure MWCNT frequencies. Furthermore, the G+ and G− modes, which are associated with axial (along tube) and circumferential vibrations of the two primitive C-atoms in the CNT honeycomb lattice, are separable—1588 and 1605 cm−1—in the as received MWCNT and 2.5 wt% loading. However, 0.77 wt% loaded samples show separable G-band splitting, which is reported before only for the isolated CNTs. 67 The intensity ratio of D to G band (ID/IG) is an indicator commonly used to ascertain the quality of CNTs, presence of defects, disorder, purity, and oxidation. The ID/IG ratio of pure MWCNTs approximately 1.1 remains constant in respect to CNT loading.
Conclusions
The thermal treatment technique of commercial MWCNTs in the presence of solvent and pressure enhances its oxidative thermal stability as a result of impurities removal. This is observed from the increase of onset temperature, the activation energy of decomposition, and the temperature required to loss same MWCNTs weights as the treating temperature increases. This technique also increases CNTs alignment via decreasing the degree of disorder. This technique is done through an isometric process and increasing temperature causes an increase in solvent vapor pressure. Thus, as the treating temperature increases, vapor solvent molecules penetrate between CNTs and push them apart from each other. This results as a presence of voids between CNTs and increases its resistivity. A percolation behavior for the AC electrical conductivity is observed when polymer matrix is loaded with MWCNTs thermally treated using this technique. Besides, the Cole–Cole impedance and Argand plots show semicircular behavior at concentrations above the threshold value of thermally treated MWCNTs.
Footnotes
Acknowledgement
The authors would like to acknowledge Deanship of Scientific Research, King Faisal University, Al-Ahsa, Kingdom of Saudi Arabia, for providing financial support for this work, which has a project ID number: 160040.
Funding
The author(s) received no financial support for the research, authorship, and/or publication of this article.