
Abstract
Nanocomposites of conjugated polymers polypyrrole (PPy) and polyvinyl chloride (PVC) as matrices and 1,4-phenylenediamine (PDA) as a linker with amine functional graphite (FG-NH2) as filler have been efficiently fabricated using in situ oxidative polymerization, and the effect of various mass ratios on physicochemical characteristics of prepared nanocomposite was investigated. The layer-by-layer oxidative polymerization of various matrices on host filler surface is confirmed by Fourier transform infrared, energy dispersive X-ray, and X-ray photoelectron spectroscopy examinations. Field emission scanning electron microscopy revealed fibrillary morphology of obtained nanocomposites. Thermal stability, glass transition temperature, and melting and crystallization temperature of the nanocomposites were increased with the incorporation of modified graphite. Brunauer–Emmett–Teller analysis explored the improved adsorption capacity (128 cm3 g−1) of the nanocomposite with higher feeding ratio of pyrrole. The influence of FG-NH2 and pyrrole on electrical conductivity performance of composites was also investigated. Functionalized graphite in the resultant PPy/PVC/PDA@FG-NH2 nanocomposites played an important role in forming conducting network in PPy matrix indicating synergistic effect between PPy and FG-NH2.
Keywords
Introduction
Carbon nanostructures with large specific surface area and chemical stability have gained a considerable attention owing to unique physical and chemical characteristics. The integration of carbon material with polymers, polyelectrolytes, biomolecules, and inorganic materials leads to the formation of new materials including sensors. In addition, the novel material can be achieved by the combination of carbon material with conducting polymers. 1 The high-performance and cost-effective devices having long-term stability are indispensable for conventional technologies and energy storage devices allowing numerous potential applications in near future including clothes and smart biosensors. 2 Compared with conventional batteries, lithium ion batteries (LIBs) offer relatively high specific capacity and thus find its several applications in important power sources such as digital cameras, mobile phones, hybrid electrical vehicles, and laptop computers. 3 Graphite is normally used in such commercial LIBs where it acts as anode material due to easy Li+ insertion/de-insertion, low cost, and increasing supply of raw materials. 4 However, there are some features which limit its applications such as low lithium storage capacity (372 mAh g−1) and low lithium diffusion coefficient restricting its wide range of applications and making it very critical issue to explore novel carbon anode materials. 5 Compared with carbon materials, pseudo-capacitive materials including conducting polymers possess high charge storage capacity. But some drawbacks limit its direct application in super capacitors such as poor stability, high resistance, and lower cycle life in charging discharging process. 6,7 Thus, electrochemical performance can be improved by the combination of conducting polymers with carbon materials. 6 Conducting polymers such as polyaniline, polypyrrole (PPy), and poly(3,4-ethylenedioxythiophene) as well as their derivatives are very important material to be utilized in supercapacitors showing high conductivity in doped state with several advantages such as good environmental stability, low cost, adjustable redox capacity, and high storage capacity. 8 Among these conducting polymers, PPy is the most commonly applied conducting polymer owing to its good electrical conductivity, ease of processing, and good environmental stability. 9
The poor electrochemical activity of graphite electrodes is major hurdle in its way requiring acid treatment, thermal treatment in air, medication with metals, and electrochemical oxidation prior to use. Most of the approaches involve oxygen-containing functional groups on its surface such as C=O and C–OH 10 providing large surface area and interfacial interaction with polymer matrix. 11 Liu et al. 12 carried out the synthesis of PPy/silver chloride nanotubes and studied their antimicrobial properties. Recently, a group of researchers such as Duan et al., 13 Sun and Mo, 14 Chen et al., 15 Yang et al., 16 and Bonaccorso et al. 17 have successfully prepared PPy-based composites and films. They concluded that even low volume fraction of expanded graphite (EG) was sufficient in order to meet the percolation threshold of conductivity in the fabricated poly(methyl methacrylate) (PMMA)/EG, polystyrene (PS)/EG, polyethylene glycol (PEG)-NH2/G, and PPy/EG nanocomposites. However, some drawbacks of these composites were also noticed made by blending of EG with polymers directly such as poor mechanical strength as well as existence of aggregates of graphitic sheets which may interlock with each other and hence poor conducting networks will result due to such aggregation. This aggregation may also result from insufficient intercalation of polymers or monomers into galleries of graphite sheets. In addition, no more monomer or polymers can penetrate into pore owing to closeness of pores in nature and thus polymers might not separate the graphite sheets around such pores but will overlap with each other.
To overcome all these problems as well as homogeneous dispersion of graphite into polymeric matrix, we implemented a chemical oxidative layer-by-layer in situ polymerization route to develop functional graphite (FG) treated with hexamethylene diamine (FG-NH2)-based nanocomposites using PPy and polyvinyl chloride (PVC) as matrices and 1,4-phenylenediamine (PDA) as a linker which crosslink these nanocomposites and modified graphite was dispersed as a filler. In this endeavor, we have fabricated different series of multilayered PPy/PVC/PDA@FG-NH2 nanocomposites as a result of in situ polymerization, and effect of various concentrations of conducting polymer on resulting nanocomposites was investigated keeping filler concentration constant. To the best of our knowledge, the core shell PPy/PVC/PDA@FG-NH2 hybrids were chemically synthesized for the first time through this route. Using numerous suitable techniques, the physical characteristics of the resulting material were explored. The idea underlying this study was to achieve nanocomposites with excellent electrical conductivity without decrease in thermal properties. The usage of cheaper, more efficient, and non-contaminating energy source is also one of the major challenges at present. The use of LIBs is an attractive route which converts chemical energy into electrical energy via chemical bond cleavage. The liquid electrolytes can be replaced successfully by ionically conducting polymers termed as polymer electrolytes in rechargeable LIBs. In the same way, conducting polymer composites can be utilized in rechargeable LIBs due to advantage of high stability toward environmental exposition, reasonable conductivity, biocompatibility, and chemical synthesis. 18
Experiment
Materials
Graphite fine powder (99%), pyrrole (Py, 99%), PVC (99%), and PDA (98%) were purchased from Sigma-Aldrich (St Louis, Missouri, United States) and kept at 0°C prior to use. Other reagents such as potassium dichromate (K2Cr2O7, 99.9%), hydrochloric acid (HCl, 37%), nitric acid (HNO3, 70%), and tetrahydrofuran (THF, 99.9%) were also procured from Aldrich and used as received.
Purification of graphite
Natural graphite is 98.5% pure but still contains some impurities such as aluminum (Al), iron, chromium, and other metals. These impurities may have been incorporated in graphite during the synthesis process. These metallic impurities must be eliminated by thermal oxidation or acid treatment using HF, HNO3, or HCl. In this attempt, graphite was purified by HCl treatment. For this purpose, 6-g graphite was introduced into a two-necked round-bottomed flask containing 50-mL HCl. The mixture was refluxed at 65°C for 2 h. Afterward, the purified graphite was filtered, washed with distilled water until pH = 7 was attained and dried in an oven at 90°C.
Functionalization of graphite
An easy way to modify the properties of nanocomposites containing graphite as filler is the attachment of the distinct functional groups on the surface of graphite which enhance the physical characteristics due to significant interaction between the matrix and filler. Terminated functional groups around the graphite core are known to stimulate the possible applications for graphite. Among all types of FG, more conveniently produced are the carboxylated FG. Carboxylation was performed by treating the purified graphite with strong acids, that is, HNO3 at room temperature with continuous stirring for 24 h. This whole mixture was refluxed at 140°C for 24 h. Later, 500 mL of deionized water was added to the above mixture, filtered (0.2-mm cellular membrane filter paper) and washed several times with deionized water till pH =7 was obtained. The FG was dried in an oven at 60°C for 2 h and is termed as graphite oxide (GO).
Amide grafting on acid-treated graphite
Hexamethylene diamine (HMDA) consisting of long hydrophobic chain of alkyl groups and hydrophilic amine groups was chemically reacted with acid-treated graphite (GO). The alkyl amine chains were chemically grafted on GO. The amine groups were attached with carboxylic acid sites of functionalized graphite and are labeled as FG-NH2 as shown in Figure 1.
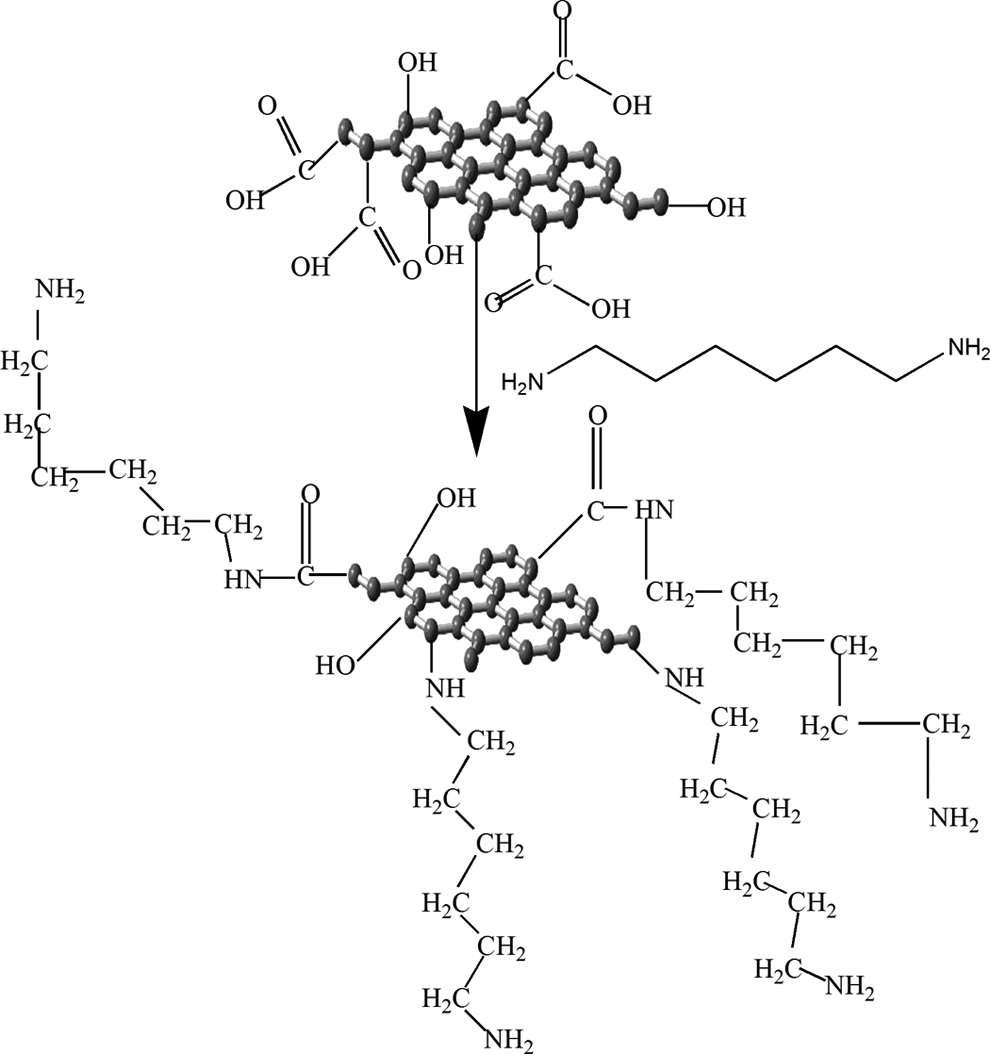
Schematic representation of amide grafting of graphite.
Synthesis of first-layered PPy@FG-NH2 nanocomposite
Synthesis of PPy@FG-NH2 nanocomposites was achieved utilizing oxidative in situ layer-by-layer polymerization route. In this typical synthetic procedure, 2 mL of pyrrole and 200 mL of 1M HCl (aqueous) were mixed and vigorously stirred for 1 h. Then, 5 g of FG-NH2 was added to the above reaction mixture. The oxidation reaction was initiated by drop wise addition of 200-mL K2Cr2O7/HCl (1M) solution at 0°C with continuous stirring. The reaction mixture was filtered using a vacuum pump through cellular membrane filter paper (pore size 0.4 mm). The product was obtained as a wet cake and dried in an oven at 60°C for 2 h.
Preparation of second-layered PPy/PVC@FG-NH2 nanocomposite
First, 4-g PVC was dissolved in 100-mL THF and stirred for 1 h. Subsequently, the solution was poured into a two-necked round-bottomed flask containing 4-g PPy@FG-NH2 dispersed in 300 mL of THF. Afterward, the mixture was refluxed at 50°C for 8 h. Then, the reaction mixture was cooled to room temperature, filtered, and then was dried in an oven at 60°C for 2 h.
Fabrication of third-layered PPy/PVC/PDA@FG-NH2 nanocomposite
For the fabrication of third-layered nanocomposite, 3-g PDA was dissolved in 30-mL THF and then the solution was poured into a two-necked round-bottomed flask containing 3 g of PPy/PVC@FG-NH2 dissolved in 250-mL THF. The mixture was refluxed at 50°C for 12 h. Subsequently, the product was filtered and dried in an oven at 60°C for 2 h. The formation of layered nanocomposite is illustrated in Figure 2. Sample codes and composition of nanocomposites used in this study are listed in Table 1.
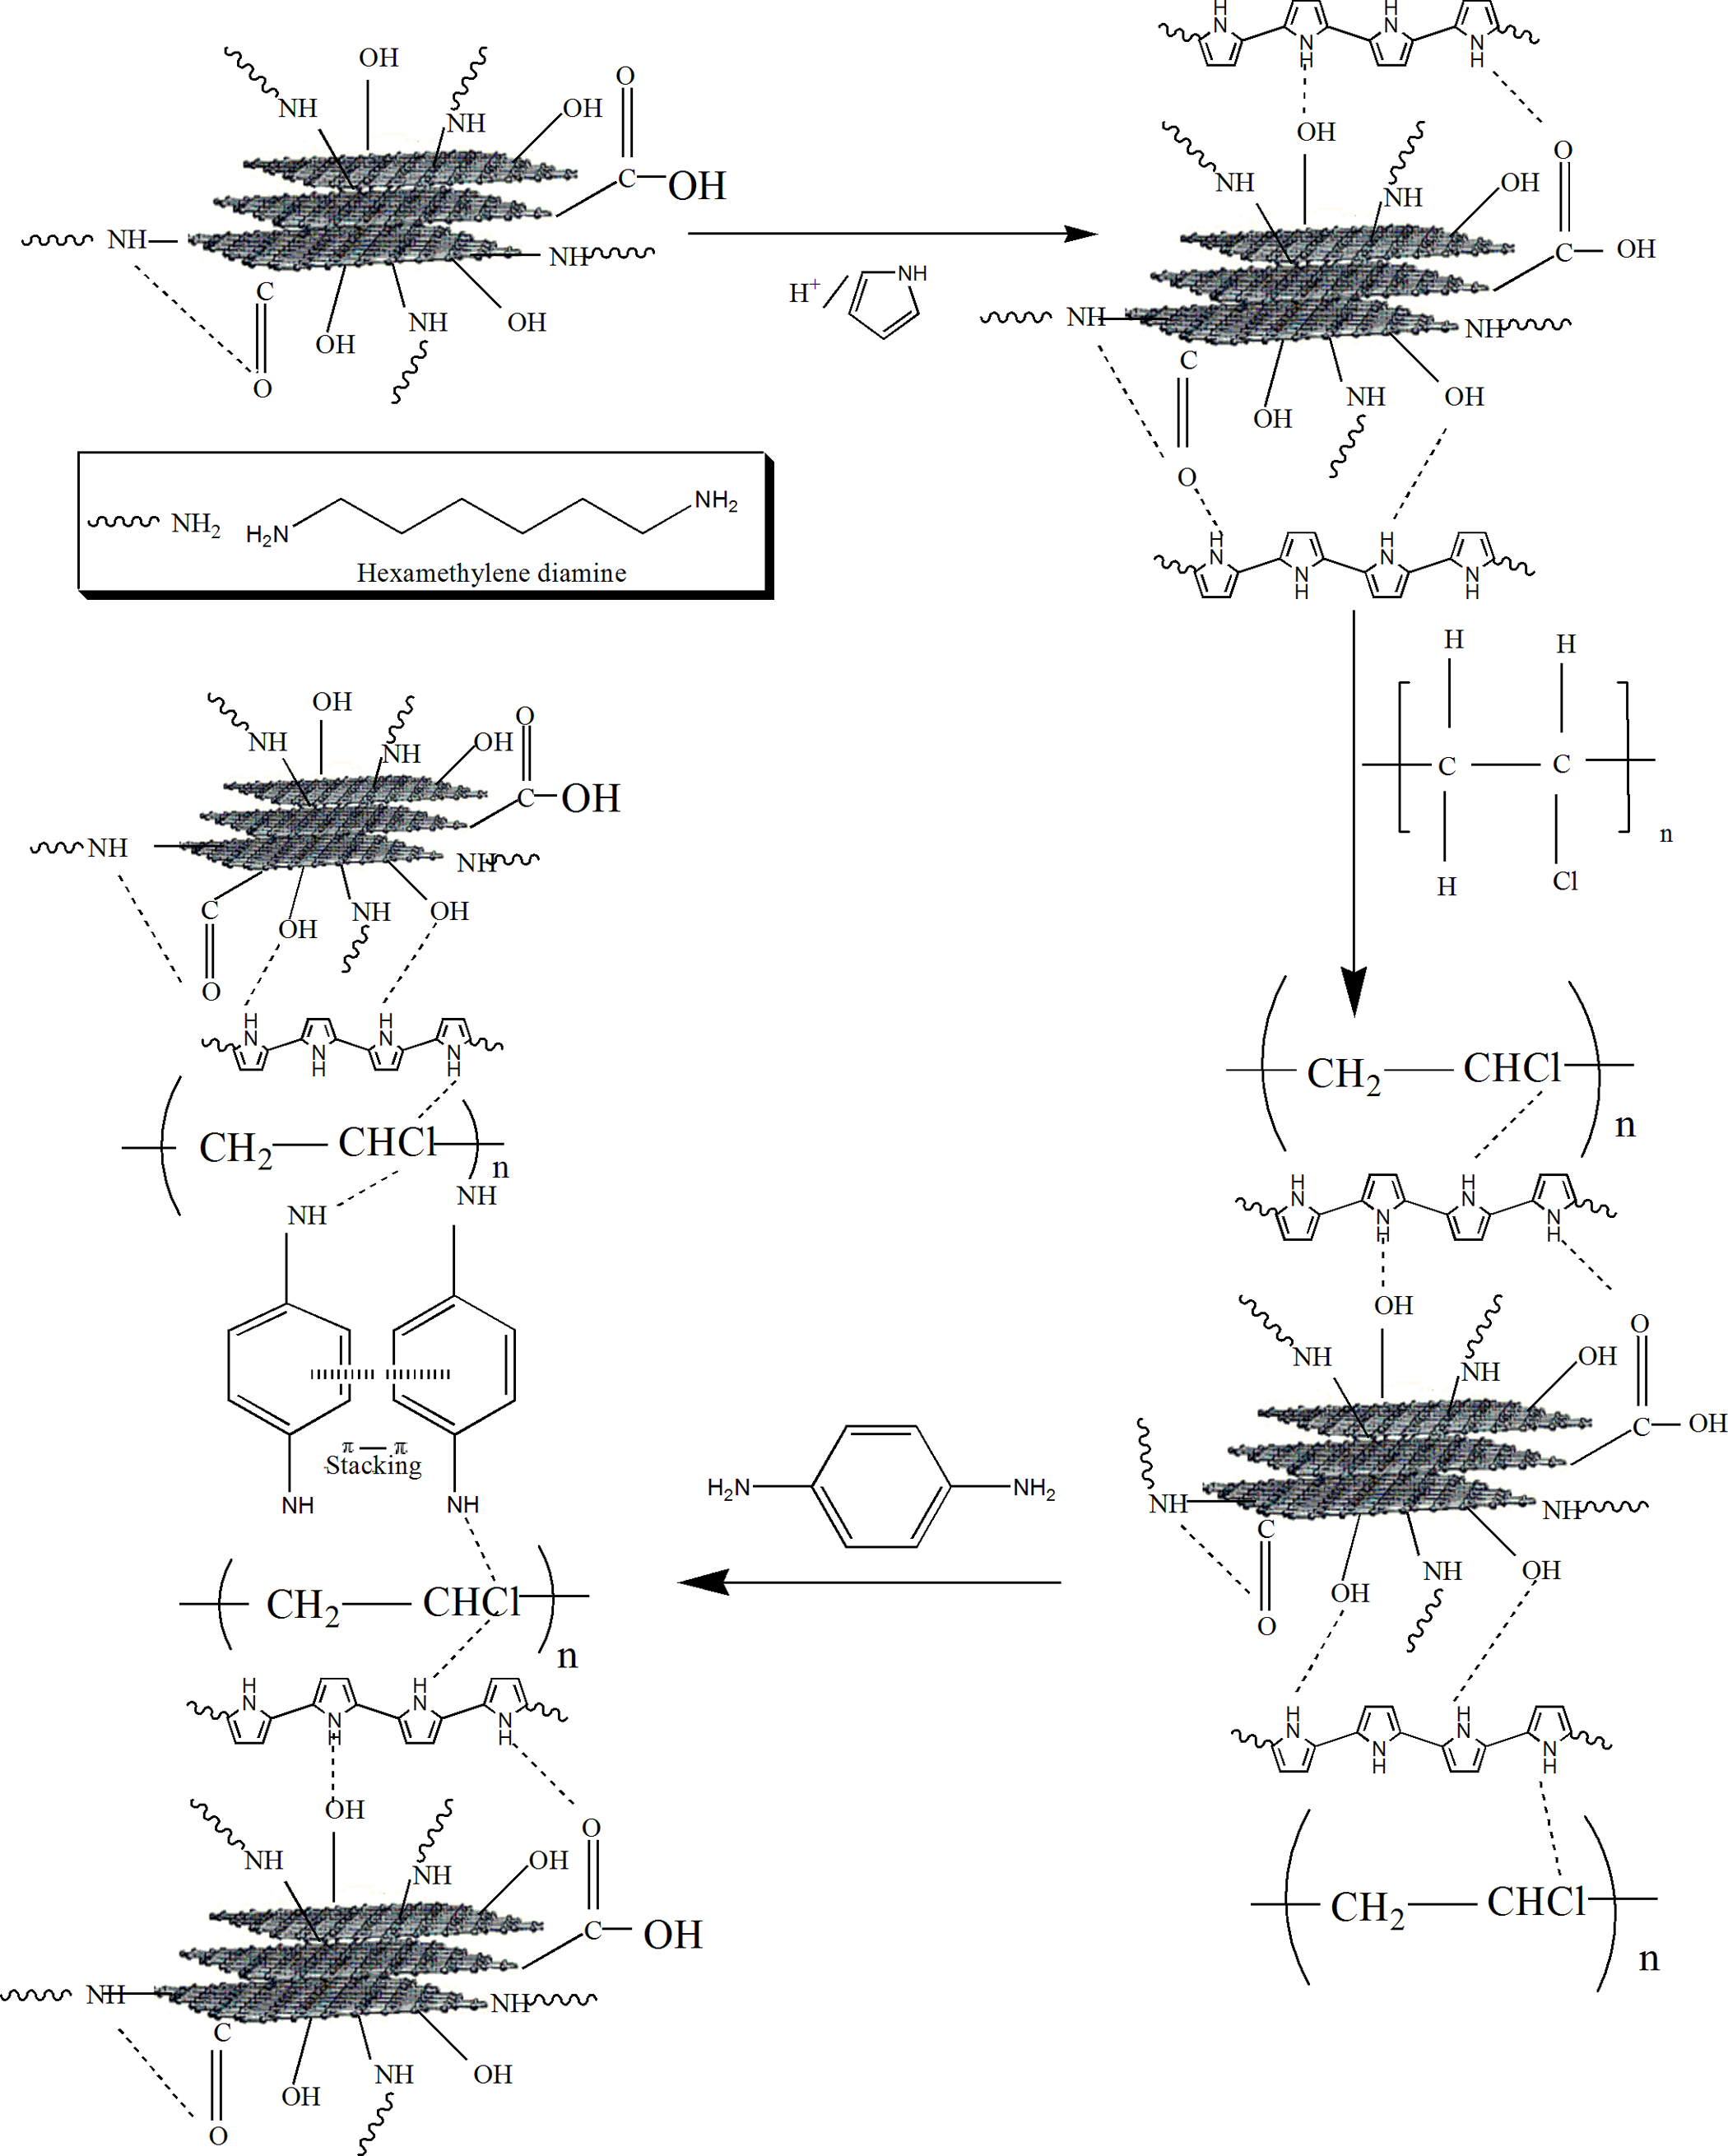
Preparation of PPy/PVC/PDA@FG-NH2 nanocomposite.
Sample codes and composition of nanocomposites.
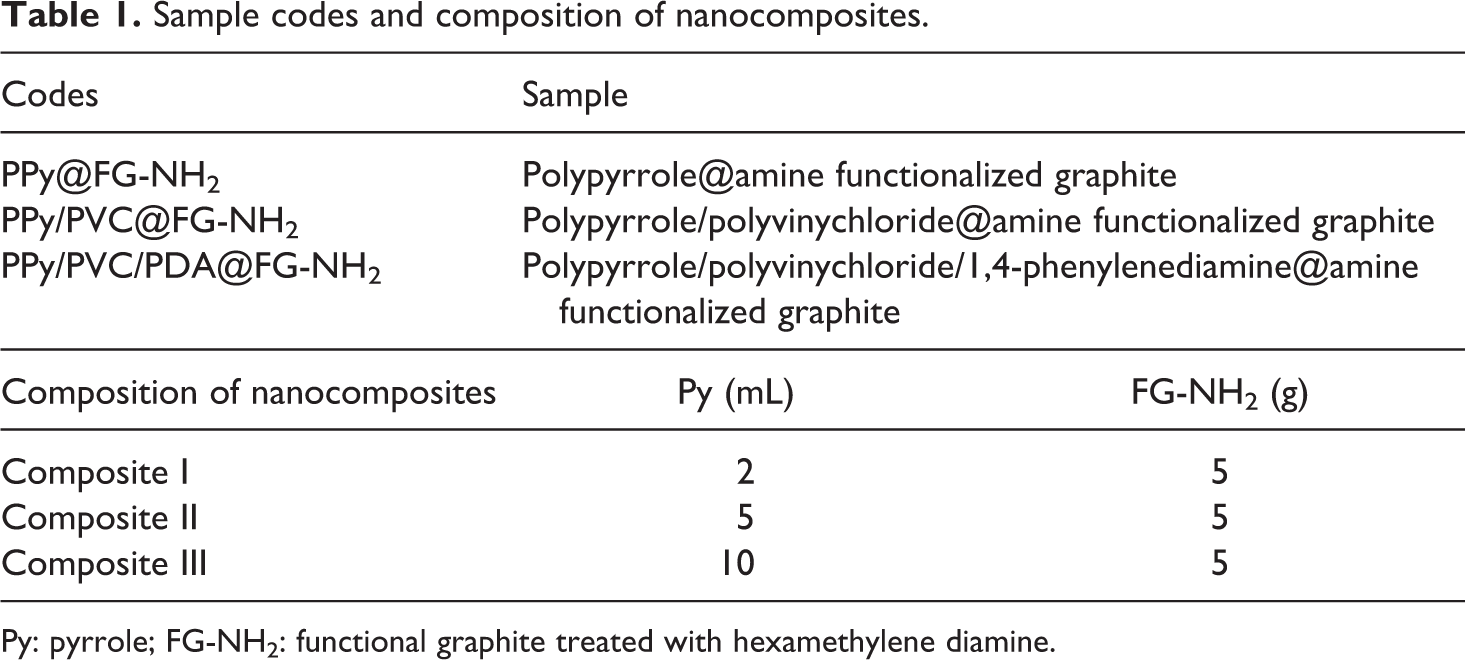
Py: pyrrole; FG-NH2: functional graphite treated with hexamethylene diamine.
Characterization
A Nexus 870 Fourier transform infrared (FTIR) spectrometer (Madison, Wisconsin, USA) was used to record IR spectra in the transmission mode (4000-450). PerkinElmer PHI system (Waltham, Massachusetts, USA) was used for X-ray photoelectron spectroscopy (XPS) measurements. Field emission scanning electron microscopy (FESEM) was carried out using Hitachi S-4800 (Tokyo, Japan). The fractured surfaces (under liquid nitrogen) of samples were vacuum coated with thin layer of gold. Thermal stability of the prepared samples was analyzed by a themogravimetric analyzer (TGA)/differential thermal analyzer (DTA) (Mettler Toledo, Columbus, Florida, USA). Approximately 5 mg of samples in an aluminum oxide crucible was used at a heating rate of 10°C min−1. The thermal properties were evaluated with a Mettler Toledo differential scanning calorimetry (DSC) 822 (Switzerland) differential scanning calorimeter by taking 5–10 mg of samples in Al pans at a heating rate of 10°C min−1. PW 3040/60 X’pert PRO (Panalytical, Netherland; Ni-filtered Cu Kα radiation, 40 kV, 30 mA) was used for X-ray diffraction (XRD) patterns of prepared nanocomposites. A Micromeritics Tristar II automatic adsorption instrument (Norcross, Georgia, USA) was employed for the surface area calculations through nitrogen adsorption–desorption isotherms at 77 K. The electrical conductivity of rectangular shape (25 × 10 × 1 ± 0.05 mm3) thin composite films was measured using the four-point method under ambient atmosphere by Keithley 2401 (Cleveland, Ohio, USA).
Results and discussion
Spectroscopic analysis
To confirm the presence of PPy and PVC as a component of nanocomposites, the samples were characterized by FTIR. Figure 3 shows the FTIR spectra before and after the formation of layered nanocomposites. Figure 3(a) represents the FTIR spectrum of FG-NH2 which shows the broad band around at 2900 cm−1 corresponding to –CH asymmetric and symmetric stretching of CH2 groups indicating the presence of alkylamine on GO surface. Upon grafting of amine groups on GO, a shift is resulted in stretching vibration of –C=O (1720 cm−1) and C–O (1229 cm−1) at higher wave number. There is also appearance of some additional peaks at 2829 cm−1 (–CH symmetric stretching) and 2969 cm−1 (–CH asymmetric stretching), confirming the presence of amine groups. The nature of interaction of FG-NH2 is confirmed by the appearance of peaks at 1720 cm−1 (C=O stretching), 1582 cm−1 (N–H bending of amide group) along with the peak at 1053 cm−1 (C-N stretching), 1025 cm−1 (C–O stretching), and 3409 cm−1 (N–H stretching) revealing the successful formation of amide linkages. 19 –21
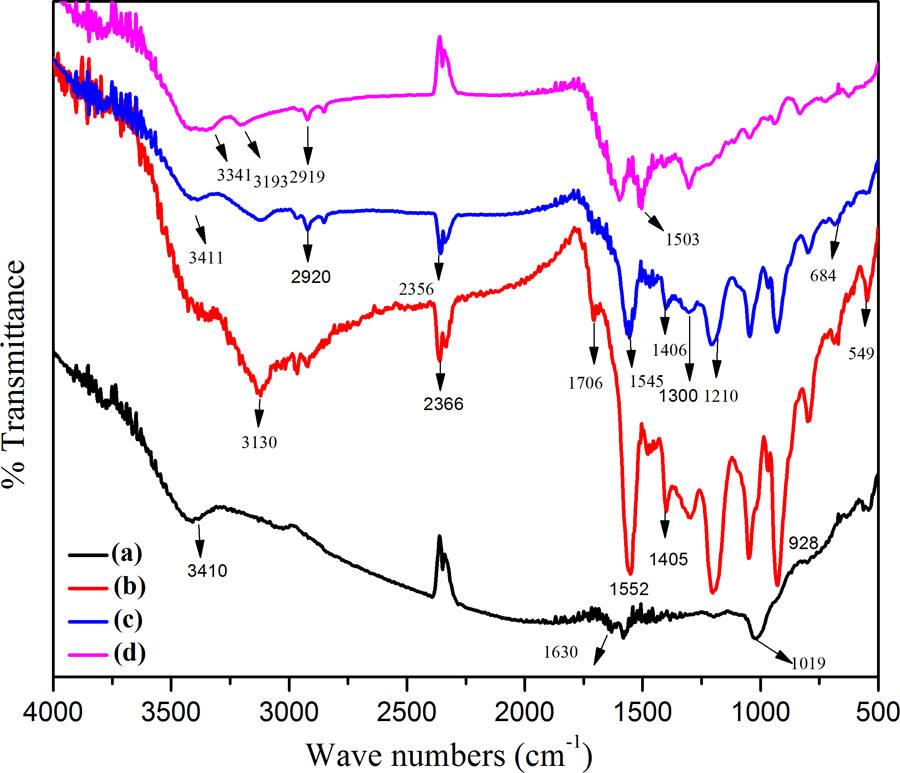
FTIR spectra of (a) FG-NH2, (b) PPy@FG-NH2, (c) PPy/PVC@FG-NH2, and (d) PPy/PVC/PDA@FG-NH2.
The peak appearing at 1573 cm−1 was due to C–C–C symmetric stretching vibrations. The broad band at 3410 cm−1 attributed to –OH stretching vibration. The peaks originating from PPy component of nanocomposites can be seen in Figure 3(b). The peak at 549 cm−1 corresponds to C–N stretching of PPy chains indicating the presence of shorter delocalization length of poly conjugated system. 22 The peak at 928 cm−1 corresponds to bipolaron state of PPy. 23 The downward shifting of this peak was due to H-bonding between hydrogen atoms in PPy and –OH group on layer of treated graphite. The absorption band at 3130 cm−1 appeared due to N–H stretching of PPy. A new shoulder around 1552 cm−1 indicated conjugation for PPy@FG-NH2. In addition, the peak owing to –COOH group was shifted downward at 1706 cm−1, probably due to the π–π interaction between aromatic rings of PPy and graphite layers. 24 The characteristic peaks at 1560 and 1406 cm−1 correspond to stretching vibrations of C=C and C–N of PPy. 25 The higher intensity of peaks also reflects longer effective π-conjugation along the PPy chains which in turn increase the conductivity of resulting nanocomposites 26 and are in good agreement with reported literature for PPy. 27 Also, peak at 1054 cm−1 corresponds to in-plane deformation of the C–H and N–H bonds of pyrrole ring. 28 For PPy/PVC@FG-NH2, C–H stretching mode can be observed at 2920 cm−1 and CH2 deformation mode at 1300 cm−1. 29 The peak at 684 cm−1 was attributed to C–Cl stretching vibrations whereas band at 1210 cm−1 represents C–H in phase bending. The peaks associated with N–H and C–N stretching were shifted downward to 3411 and 1406 cm−1 indicating complexation between PPy and PVC (Figure 3(c)). 30 The representative FTIR spectrum of PPy/PVC/PDA@FG-NH2 is shown in Figure 3(d). The broad band centered at 3341 cm−1 was due to stretching vibration of free N–H suggesting the presence of secondary amino groups (–NH–). A very weak shoulder at 3193 cm−1 might be due to C–H stretching on aromatic rings. The sharp peak at 1601 cm−1 was associated with aromatic ring stretching. 31 Table 2 established the corresponding FTIR data of PPy@FG-NH2, PPy/PVC@FG-NH2, and PPy/PVC/PDA@FG-NH2 composites.
FTIR data of PPy@FG-NH2, PPy/PVC@FG-NH2, and PPy/PVC/PDA@FG-NH2.
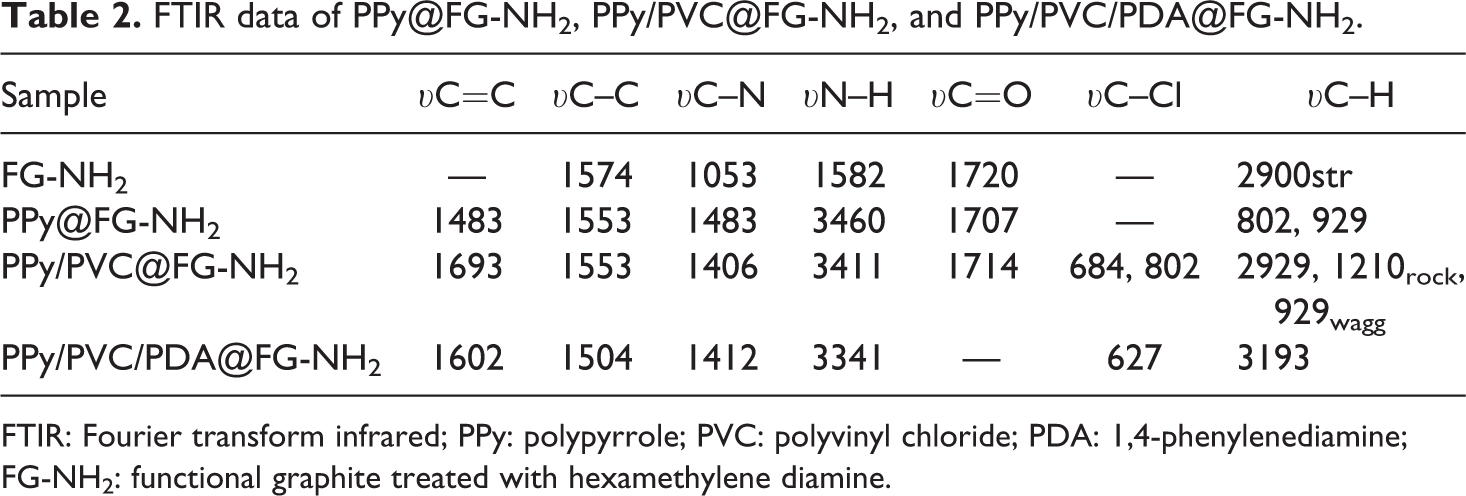
FTIR: Fourier transform infrared; PPy: polypyrrole; PVC: polyvinyl chloride; PDA: 1,4-phenylenediamine; FG-NH2: functional graphite treated with hexamethylene diamine.
XPS analysis
Survey quantification
The presence of functional groups on the surface of PPy/PVC/PDA@FG-NH2 was also confirmed by XPS. Figure 4(a) and (b) shows the wide scan spectra for FG-NH2 and PPy/PVC/PDA@FG-NH2 composites. Compared with FG-NH2, the peak for nitrogen with increased intensity at 399.5 eV in the entire range of XPS spectrum for PPy/PVC/PDA@FG-NH2 clearly indicates the existence of nitrogen species which comes by the deposition of PPy spread over the entire sheets of FG-NH2. The signals for C 1s, N 1s, and O 1s observed in the survey scan of PPy/PVC/PDA@FG-NH2 at different binding energies were attributed to the elements originating from polymers backbone. The intensity of peak is correlated with the abundance of that specie. As indicated by the broad scan that relative concentration of nitrogen is high owing to grafting of PPy. In addition, there was no appearance of peaks for Al and silicon (Si) in composite survey scan of PPy/PVC/PDA@FG-NH2 showing complete coverage of graphite surface with polymers. Furthermore, oxygen signal intensity is reduced reflecting its bonding with polymer via hydrogen bonding. Besides, a less intense peak for chlorine from poly(vinyl chloride) revealed hydrogen bonding between NH of PPy and C–Cl (PVC). 32
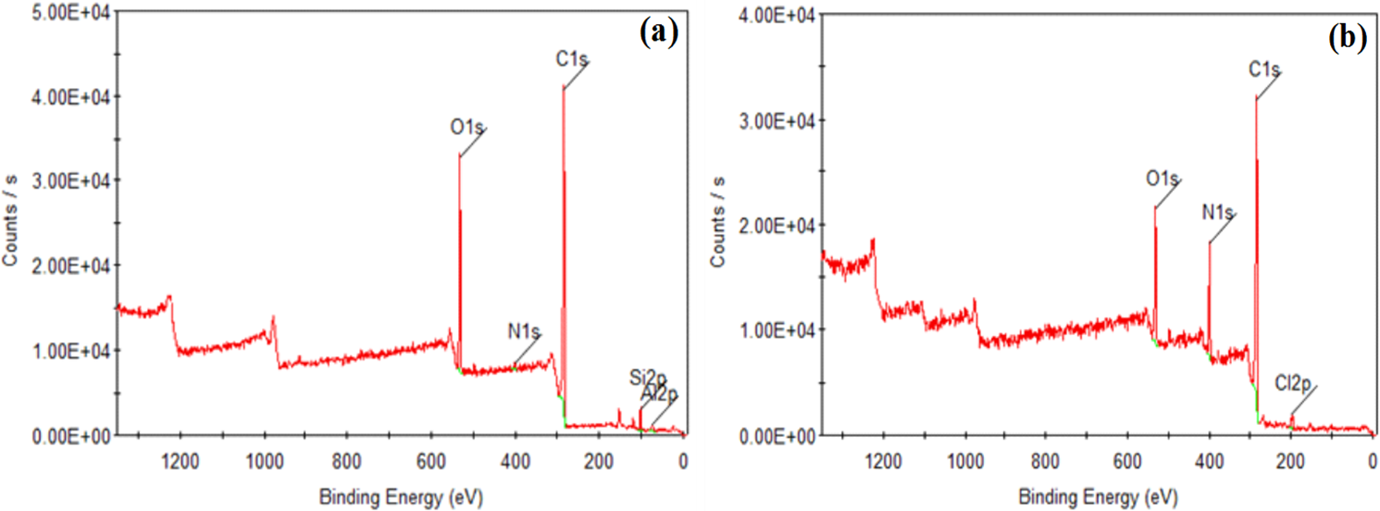
XPS survey scan of (a) FG-NH2 and (b) PPy/PVC/PDA@FG-NH2.
The component of hybrid core–shell or specific chemical composition of PPy/PVC/PDA@FG-NH2 and their corresponding XPS spectra along with fitted curves are demonstrated in Figure 5. The XPS C 1s spectrum (Figure 5(a), (d), and (g)) can be deconvoluted into three components peaks at 284.4, 285.4, and 288.3 eV, respectively. The major peak with large intensity which appeared at 284.4 eV is attributed to C–C or C–H groups present in pyrrole ring. The peak at 285.4 eV can be assigned to C–N groups confirming the deposition of PPy. The high energy peak is attributed to C–O and C=O bond in polymer chain. 33 The deconvoluted N 1s spectrum (Figure 5(b), (e), and (h)) presents four Gaussian peaks constituting binding energy of 398.7, 399.6, 399.9, and 400.9 eV which are assigned to imine-like structure (–C=N–), neutral and amine-like structure, and positively charged structure (–NH+–). 34,35 The contributions of nitrogen at 400.9 eV can be ascribed to positively charged nitrogen. Of note, the distinct signal at 531.7 eV in Figure 5(c) is attributed to C–O or C=O groups. The well resolved peaks fitting at 532.2 and 533.0 eV can be assigned to C–OH and O–C=O. The two component peaks correspond to two kinds of carbon; one for –CH2 and other for –CHCl in the backbone of PVC. 36 Apparently, there is a shift of main peak (Figure 5(f)) toward low binding energy. They are located at 197.1, 199.8, 201.6, and 202.2 eV, respectively. It should be noted by a careful observation that main peak splits into two peaks with a small shoulder. The two peaks with high intensity reflect C–Cl moieties which are linked by covalent bonding. The two small less intense peaks are attributed to delocalization of lone pair electrons from Cl inside the frame of whole composite containing PPy and PVC. As electron pair resides no more on chlorine strictly through p–π effect so extends the range of delocalization changing the state of covalent bond of C–Cl leading to split of spectrum and appearance of peak at 199.8 eV. 36 –38 Inspecting Cl 2p spectra, it was revealed that peak intensity for Cl also decreases in PPy/PVC/PDA@FG-NH2 compared with PPy/PVC@FG-NH2 indicating crosslinking (Figure 5(i)). By a careful observation, it was noticed that peak area gradually decreases indicating crosslinking in nano-complex and there is a continuous increase in electron delocalization changing C–Cl covalent state due to crosslinking owing to PDA leading to an enhancement in conductivity. PVC undergoes to high degree of dehydrochlorination upon exposure to high energetic particles such as electrons. The electrical conductivity of resulting nanocomposites was increased due to synergism effect of PPy and PVC such that decomposition product of PVC would be captured by the neighboring moieties. 35 Table 3 describes the values of binding energies at which relative peaks appeared.
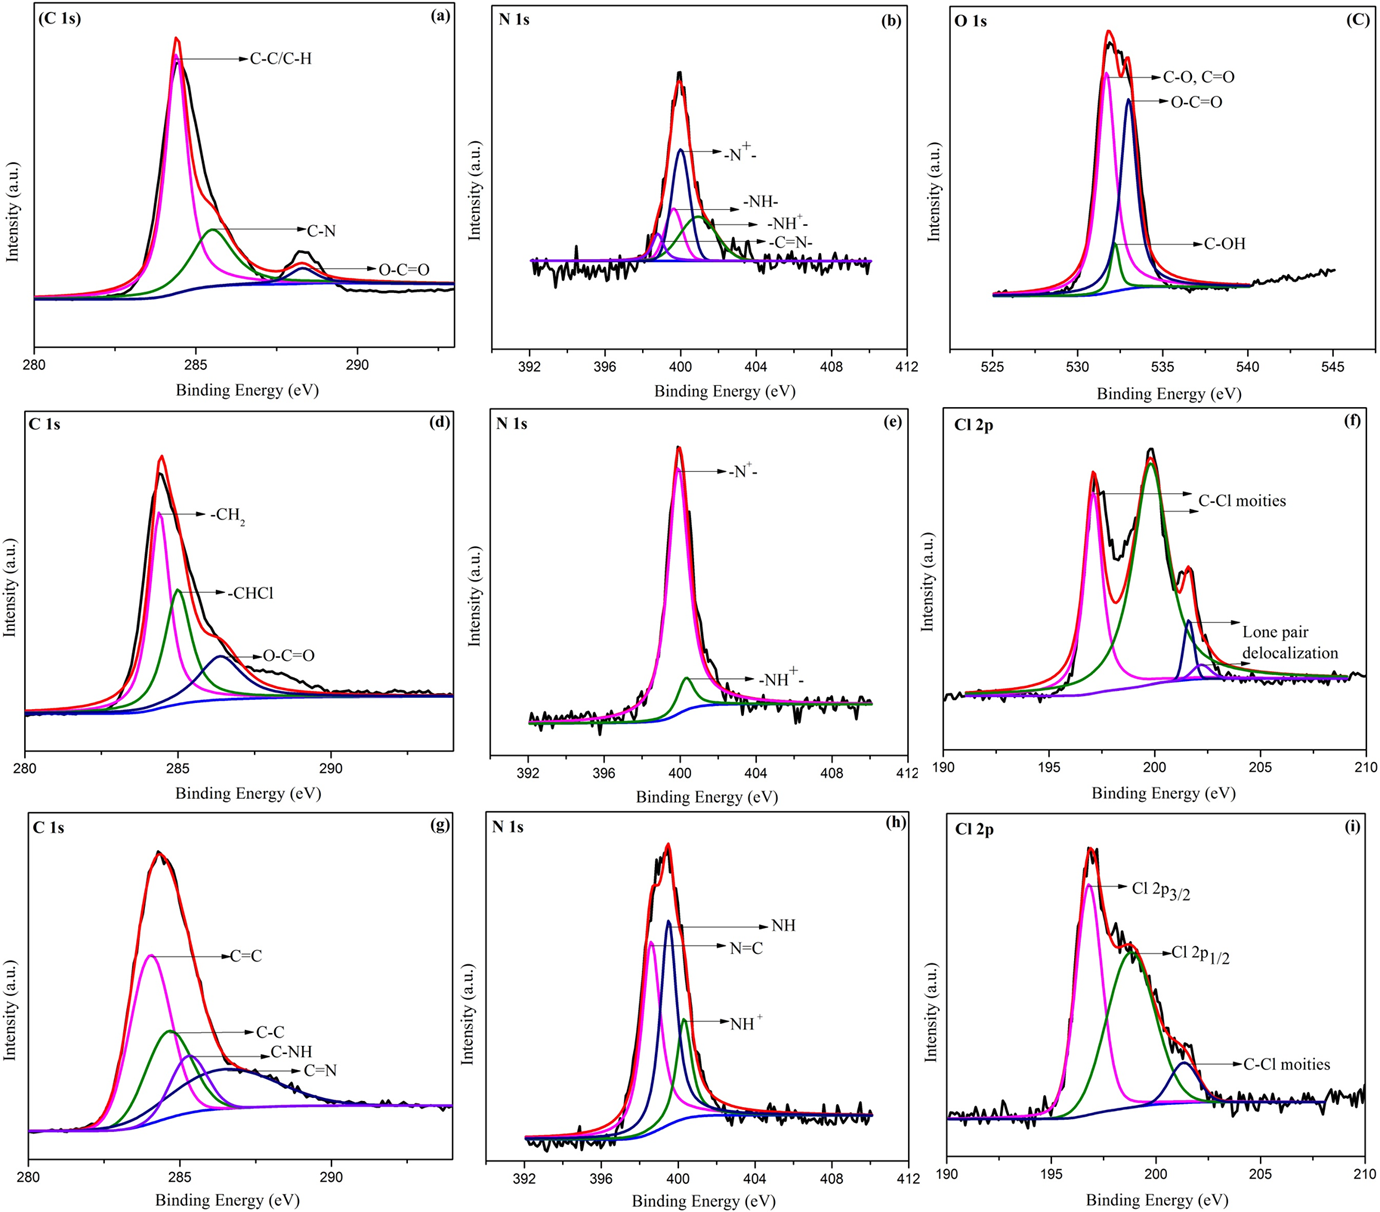
The deconvolution of the XPS. (a) C 1s, (b) N 1s, and (c) O 1s peaks of PPy@FG-NH2; (d) C 1s, (e) N 1s, and (f) Cl 2p peaks of PPy/PVC@FG-NH2; and (g) C 1s, (h) N 1s, and (i) Cl 2p peaks of PPy/PVC/PDA@FG-NH2.
Binding energies (eV) and their assignment for the major core levels.
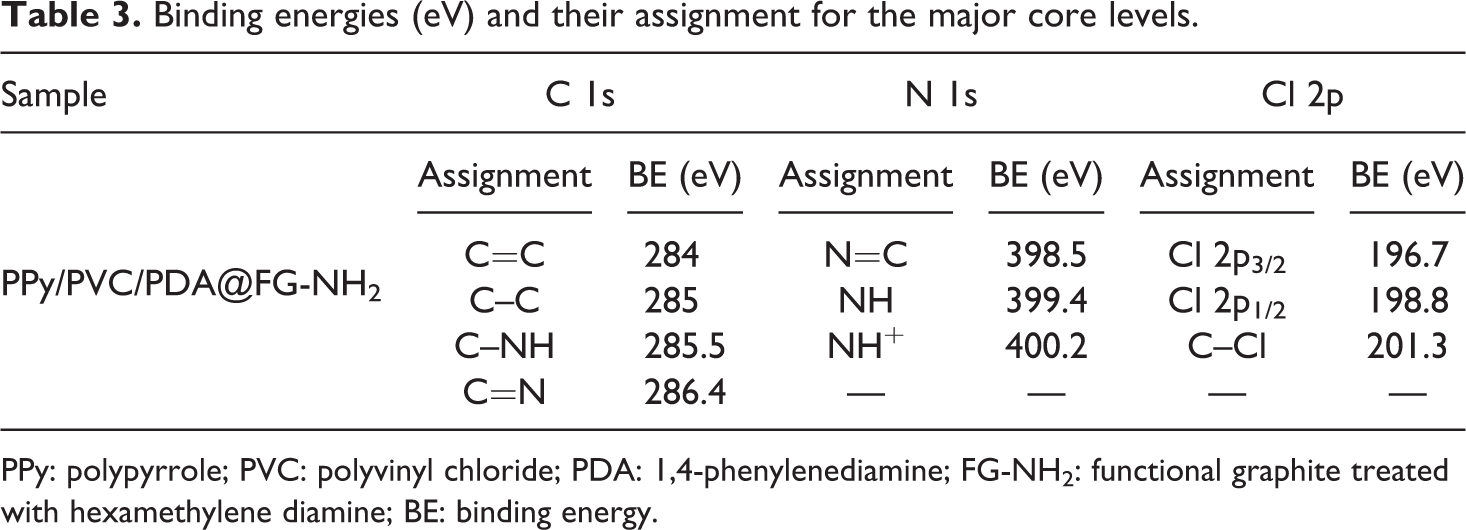
PPy: polypyrrole; PVC: polyvinyl chloride; PDA: 1,4-phenylenediamine; FG-NH2: functional graphite treated with hexamethylene diamine; BE: binding energy.
Energy dispersive X-ray analysis
Energy dispersive X-ray spectroscopy was performed to investigate the composition of functionalized graphite and nanocomposites. The component elements and their corresponding percentages shown in Figure 6 confirmed the presence of C, O, N, and Cl in PPy/PVC/PDA@FG-NH2 nanocomposite attributed to the characteristic elements of FG-NH2 and PPy, whereas other elements such as Al and Si are present as an impurity. The atomic percent of carbon (80.11%) in PPy/PVC/PDA composite reflected the successful coating of polymers. The small amount of oxygen from functional groups of –COOH and –OH on the surface of FG-NH2 partially may as a result of oxidation by air. It also showed a small amount of K in sample which may arise from K2Cr2O7 used in the polymerization of pyrrole monomer.
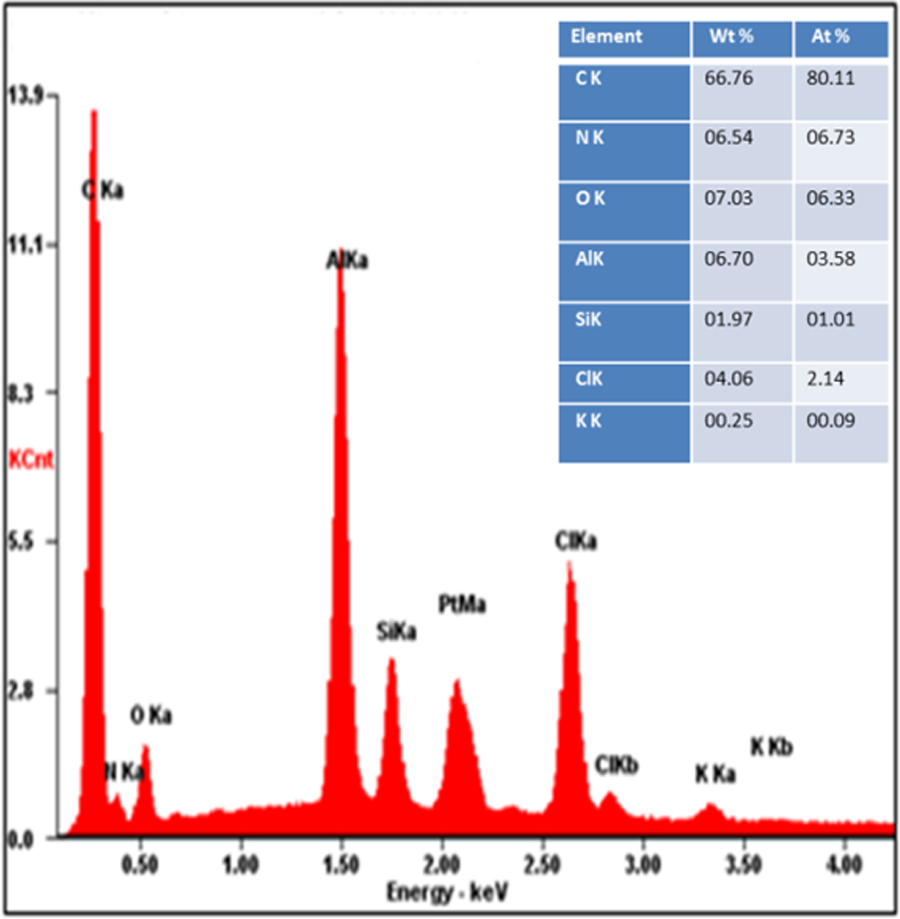
EDX spectrum of PPy/PVC/PDA@FG-NH2.
Morphological investigations
The high and low resolution SEM micrographs of layered composites revealed large sized aggregates and rough topology of FG-NH2 (Figure 7(a) and (b)) that can be attributed to crystal structure of graphite. It could be recognized that PPy chains are well dispersed and well adhered on the wrinkled surface of functionalized graphite (Figure 7(c) and (d)). This well adherence of Py+ can be explained on the basis of electron donor and acceptor interaction between Py+ and π-electron system in modified graphite. The larger spaces between graphite flakes can be produced by the intercalation of Py+ to more complex formation. In Py+@FG-NH2, a better dispersion of Py+ chains was manifested by FG-NH2 which verified that Py+ may helpful in separation of graphitic layers. The GO particles are covered by protruding out chains of PPy to form multilayer aggregates probably owing to weak interparticle interaction. 39 The prepared PPy/PVC@FG-NH2 nanocomposite has cauliflower-like structure 40 with highly porous, spongy, and connected channels as shown in Figure 7(e) and (f). Such type of highly porous polymer-based materials can be utilized in numerous applications, including absorbents, ion exchange applications, and bio separators. 41 –43 A closer look at the micrographs explores bridge formation and crosslinking between polymers owing to the presence of PDA as depicted in Figure 7(g) and (h).
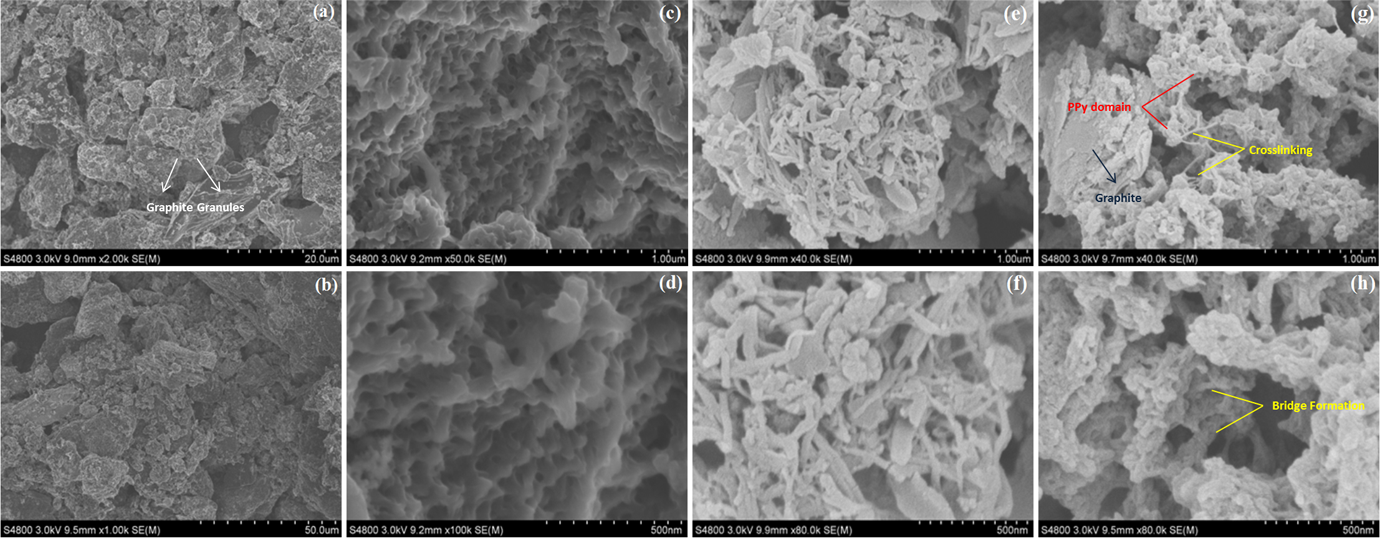
Representative FESEM micrographs. FG-NH2 at (a) 20 and (b) 50 μm; PPy@FG-NH2 at (c) 1 μm and (d) 500 nm; PPy/PVC@FG-NH2 at (e) 1 μm and (f) 500 nm; and PPy/PVC/PDA@FG-NH2 at (g) 1 μm and (h) 500 nm.
The final nanocomposites obtained by the introduction of PDA have an irregular morphology constituting polymer junks with tightly woven network of interconnected fibers providing excellent pathways for the transportation of ions leading to enhanced electrochemical characteristics. Figure 8 discloses the influence of concentration change on morphology. From Figure 8(a), it can be seen that PPy possesses globular submicron structure. The topography of nanocomposites was altered by the incorporation of PPy particles. Compared with pure FG-NH2, the puckering features of FG-NH2 disappear in nanocomposites owing to agglomerate formation. The SEM micrographs of composites I and II (Figure 8(b) and (c)) showed large laminar layers with smaller ones. These composites have no any distinguishable PPys while composite III constitutes many PPys with shorter nanofibrillar morphology (Figure 8(d)) which built an improved electron conducting network affecting the conductivity performance. It was observed that addition of PPy played a significant role in polymerization of PPy by the incorporation of PPy chains to grow with an ordered morphology. 37,44
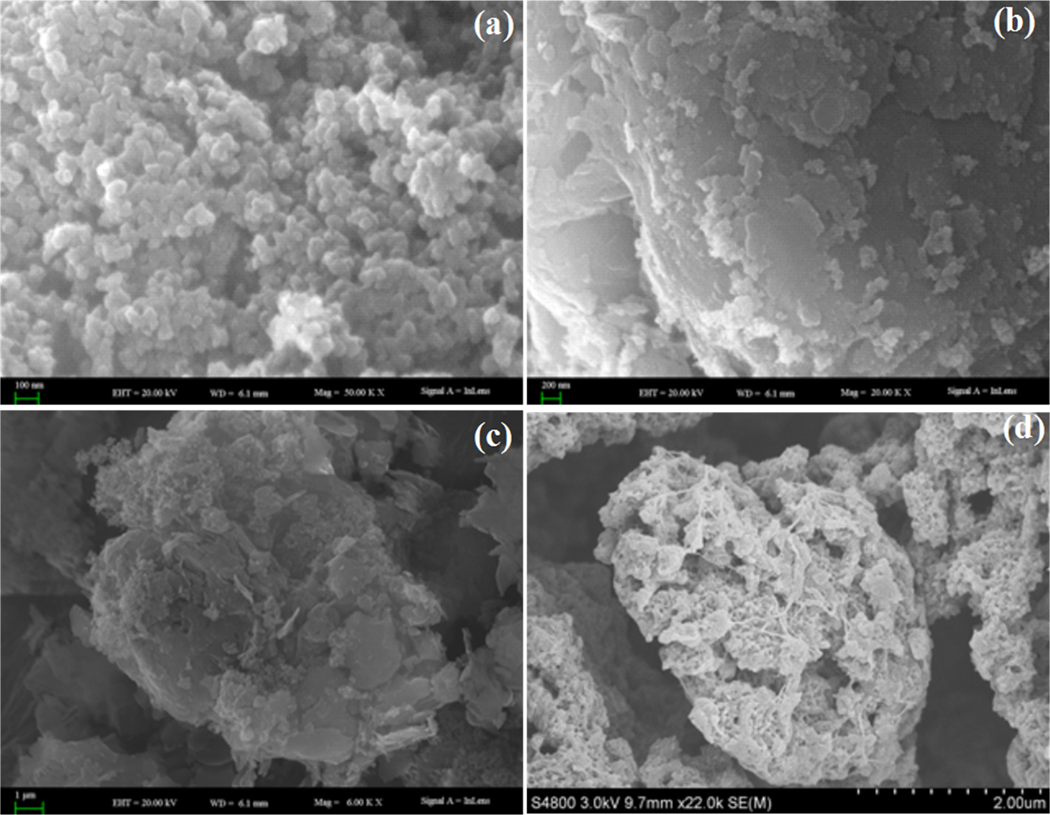
SEM micrographs of (a) PPy, (b) composite I, (c) composite II, and (d) composite III.
Thermal gravimetric analysis
A comparison of weight loss of PPy@FG-NH2 and PPy/PVC/PDA@FG-NH2 nanocomposites for all concentrations (composites I to III) under nitrogen atmosphere at a heating rate of 10°C min−1 is shown in Figure 9. It can be seen that PPy/PVC/PDA@FG-NH2 nanocomposites showed increased thermal stability which may be attributed to compactness of nanocomposites owing to strong interactions among polymer chains as well as crosslinking due to the presence of PDA acting as a linker. The contents of each composite can be checked according to their weight transition in temperature range of 250–500°C. The major and sharp weight loss of PPy@FG-NH2 and PPy/PVC/PDA@FG-NH2 occurred at temperature range around 200 and 400°C, respectively. No apparent weight loss was observed for PPy/PVC/PDA@FG-NH2 crosslinked nanocomposites in the range of 0–400°C due to strong interaction between PPy and PVC. This delayed decomposition relative to PPy@FG-NH2 reflected the strong interfacial interaction between filler and polymer shells. The two steps and rapid loss were observed for PPy@FG-NH2 nanocomposite. Upon heating, PPy@FG-NH2 starts to lose weight mass and this small weight loss was found at temperature range from around 150°C due to evaporation of physically absorbed water moieties. The weight loss from 150°C to 250°C was associated with the release of labile oxygen-containing functional groups and yielding carbon monoxide, carbon dioxide, and water vapors. Moreover, above 315°C, the weight decrease in PPy@FG-NH2 would be due to the elimination of pyrrole chain in addition to loss of oxygen from skeleton leaving behind residual carbon. 1 It can be seen from TGA curves of composites I to III that weight loss between 0°C and 100°C results due to volatilization of water moieties from sample. After 10% weight loss around 350°C, the curves change smoothly and level off which is accredited to pyrolysis of main chain and due to dehydrochlorination of PVC after which rate of loss become slowdown. 45 The composite I had residual weight of about 78% at 600°C while composites II and III exhibited residual weight of about 79 and 85%, respectively, at the same temperature. The data of temperature at various weight losses demonstrated that temperatures for composite with higher concentrations are higher in comparison with composites with lower concentration indicating enhanced thermal stability of composite. This is associated with the reason that increased concentration of conducting PPy imposed restrictions to the thermal decomposition reaction because of poor gas circulation between graphite layers and polymer chains. In the same way, the lamellar structure of graphite sheets also limited the activity of PPy molecules and hence hindering the thermal decomposition reaction. 24,25,46
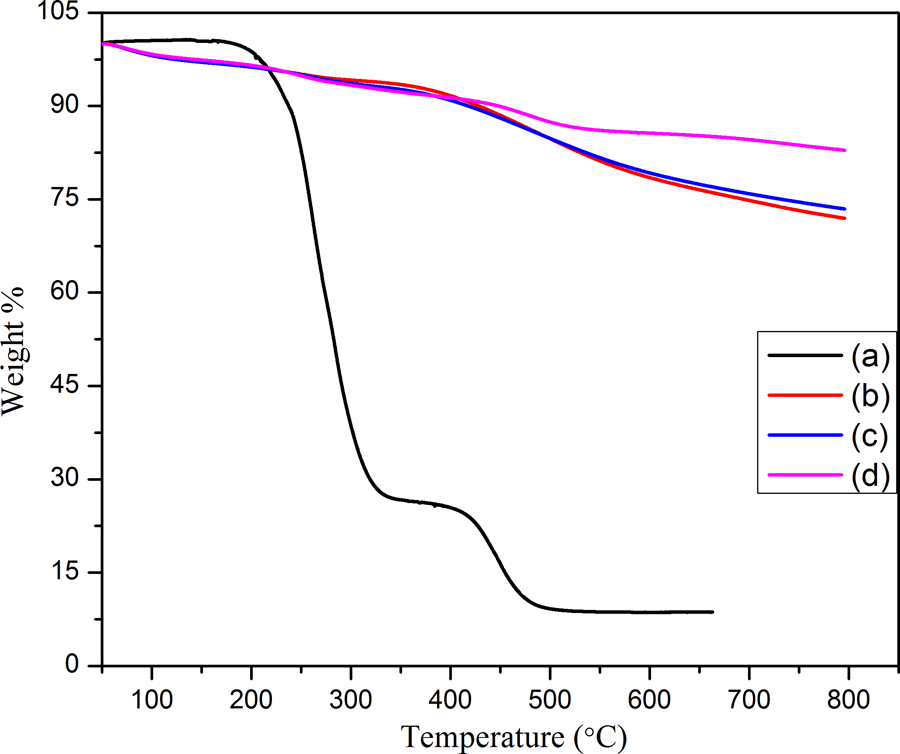
Thermal degradation curves of (a) PPy@FG-NH2, (b) composite I, (c) composite II, and (d) composite III.
Differential scanning calorimetry
The DSC heating traces of PPy@FG-NH2 and PPy/PVC/PDA@FG-NH2 nanocomposites (I to III) are displayed in Figure 10. This demonstrated the influence of concentration change of PPy on glass transition temperature (Tg) and melting behavior of the composites. The Tg (measured as middle point of variation in the slope of baseline of DSC curve) was found to be 43 and 45°C for composites I and II while it was 48°C for nanocomposite III constituting higher concentrations, respectively. Noticeably, nanocomposite constituting higher feeding ratio exhibited higher Tg accrediting to enhanced chain rigidity leading to hindrance in segmental motion. There was also observed a significant shift in melting behavior. The incorporation of PPy@FG-NH2 in PVC matrix results in the rise of about 28°C in melting temperature in comparison with the neat composite which is attributed to strong interactions between filler and matrix. The polymeric chain rigidity can be associated with the existence of both physical and chemical interactions between matrix and filler and ultimately leading to an enhanced melting temperature. These findings indicated that the crosslinking occurs between PPy and PVC due to PDA linker leading to an enhancement in Tg and melting temperature. Well dispersion of modified graphite functioned as filler may also hinder the molecular motion of polymeric chains which could also be responsible for an increased Tg of nanocomposite. 38
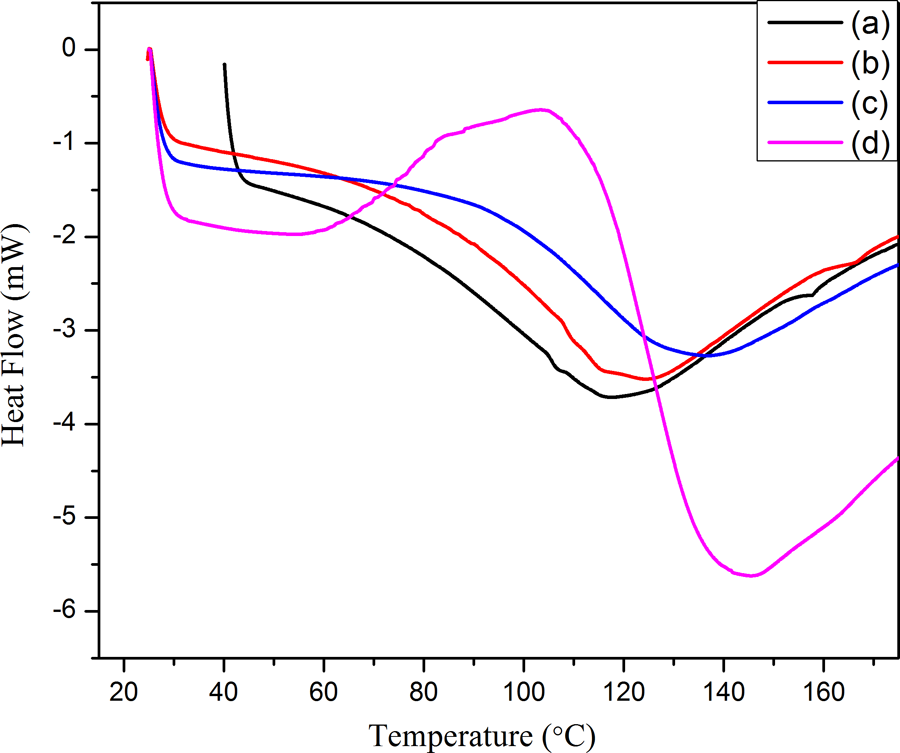
DSC thermograms of (a) PPy@FG-NH2, (b) composite I, (c) composite II, and (d) composite III.
XRD analysis
The structure of composites was also evaluated by employing XRD. Figure 11(a) shows two characteristic XRD diffraction peaks for FG at 2θ = 26.5° and 54.8° with d-spacing of 3.36 corresponding to (002) and (004) planes of graphite. 47 The peaks for FG-NH2 (Figure 11(b)) are shifted toward lower angle with decreased intensity as well as d-spacing of 4.45 was comparatively larger than FG owing to intercalation of amine functional groups after treating with HMDA. In addition, there is a complete lost or diminishing of (004) diffraction peak of graphite in PPy@FG-NH2 composite (Figure 11(c)) verifying the disorganization along the c-axis. It was interesting to note that after polymerization of Py+ there was a separation of graphite layers into mono or few layered sheets as consistent with SEM. This separation occurs as a result of intercalation of pyrrole into interlayers of treated graphite which act as molecular wedges that move deeper and deeper inside the layers providing drive force and finally leading to separation of layers. After dispersing PVC, there was no significant change in peak position. The appearance of peak at 2θ = 22.1 (Figure 11(d)) indicated that the layered structure of PPy/PVC@FG-NH2 with a d-spacing of 3.36 was slightly greater than PPy@FG-NH2, that is, 3.33. The relative shift of peak position with corresponding change of d-spacing by change of weight ratios for composites I to III is shown in Figure 11(e) to (g) and data are listed in Table 4. The characteristic peak for composites I to III was shifted toward higher angle indicating intercalation of PPy chains within graphitic sheets. It can be seen from XRD pattern that the small characteristic diffraction peak which appeared at 2θ = 54 vanished in composites and there is no characteristic diffraction peak indicating that regular periodic structure of FG-NH2 has been lost and graphite sheets were delaminated in the composites. 30,43
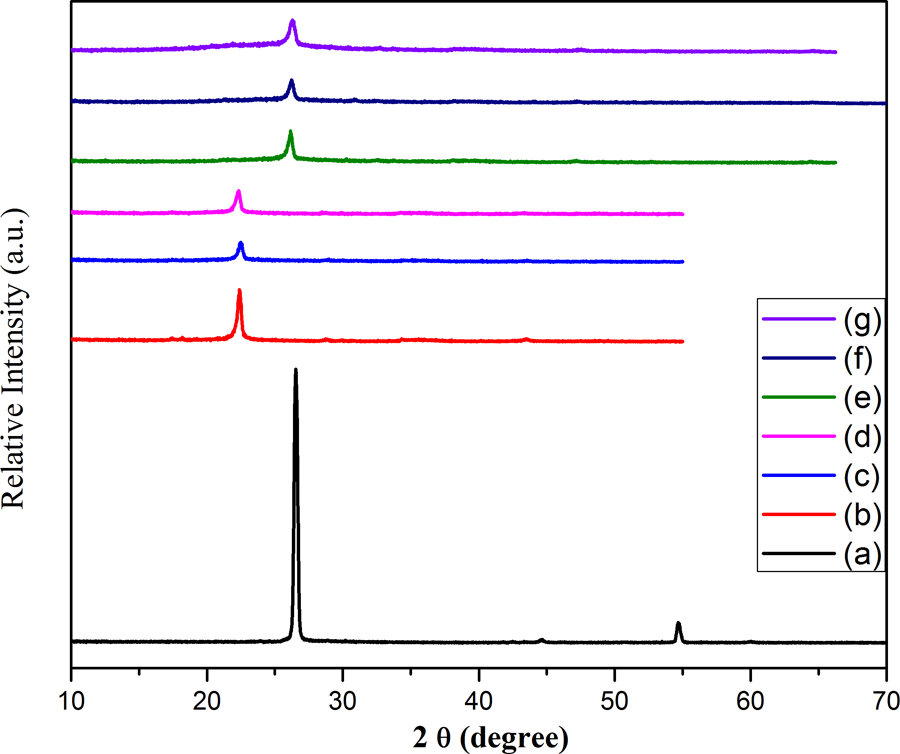
XRD diffraction patterns for (a) FG, (b) FG-NH2, (c) PPy@FG-NH2, (d) PPy/PVC@FG-NH2, (e) composite I, (f) composite II, and (g) composite III.
XRD parameters showing relative peak position.
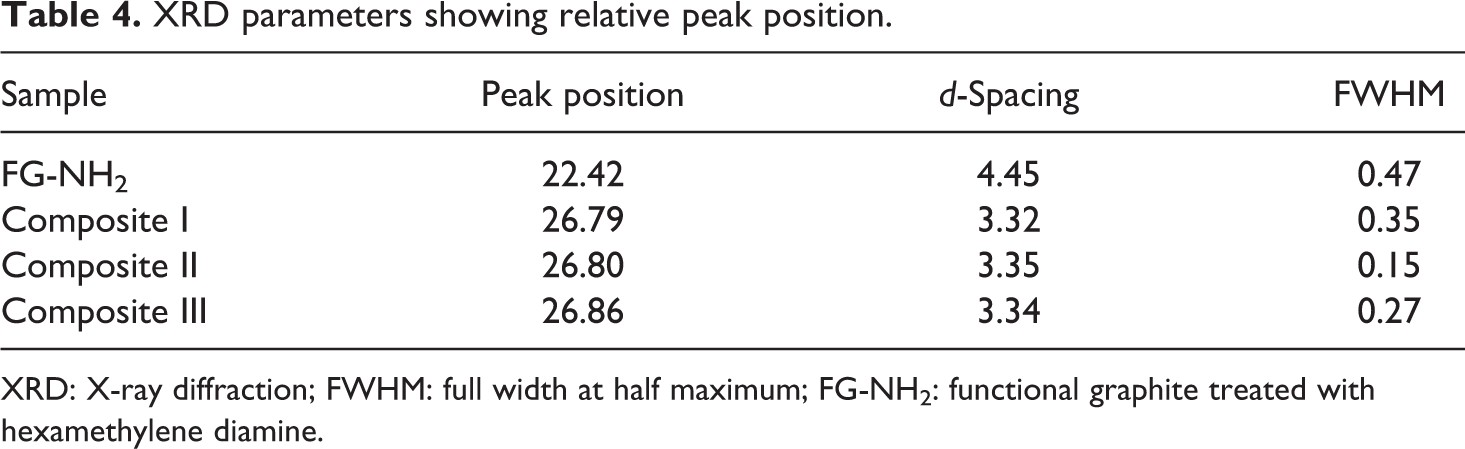
XRD: X-ray diffraction; FWHM: full width at half maximum; FG-NH2: functional graphite treated with hexamethylene diamine.
Surface area and porosity
The nitrogen adsorption–desorption experiments were conducted for the prepared nanocomposites in order to quantify pore size distribution, pore volume, and surface area as shown in (Figure 12(a) and (b)). The composites showed type-III isotherms attributed to multilayers formation of nitrogen at low pressure. The knee or inflection point falls close to the completion of monolayer while the second and higher layers achieved with the increase in relative pressure. The calculated Brunauer–Emmett–Teller (BET) surface area for neat FG-NH2 is 10.69 m2 g−1 which was increased by the deposition of PPy, that is, 50.48 m2 g−1 but onward surface area again decreases for PPy/PVC@FG-NH2 and PPy/PVC/PDA@FG-NH2 composites which may be ascribed to restacking of graphite layers 48 as well as charge broadening in addition to π–π interactions within the framework of composites. It can be observed by the pore size distribution plots of PPy/PVC/PDA@FG-NH2 that pore size below 4 nm mainly contributed by carbon. 49,50 The influence of grafting of various polymers and linker on BET surface area and pore volume is enlisted in Table 5. It was observed that both surface area and pore volume first increase and then decrease. This ascribed to fierce generation of pores upon initial deposition of PPy@FG-NH2 and henceforth surface area, amount of microspores, and pore volume also increase at first but further deposition as well as incorporation of PDA (acting as a linker) resulted progressively transformation to pore extension and increases the mesopores while decreasing micropores.
(a) BET adsorption–desorption isotherms and (b) BJH pore size distribution curves for (inset (a)) FG-NH2, (inset (b)) PPy@FG-NH2, (inset (c)) PPy/PVC@FG-NH2, and (inset (d)) PPy/PVC/PDA@FG-NH2.
Textural properties PPy@FG-NH2, PPy/PVC@FG-NH2, and PVC/PDA@FG-NH2 including data for various mass ratios.
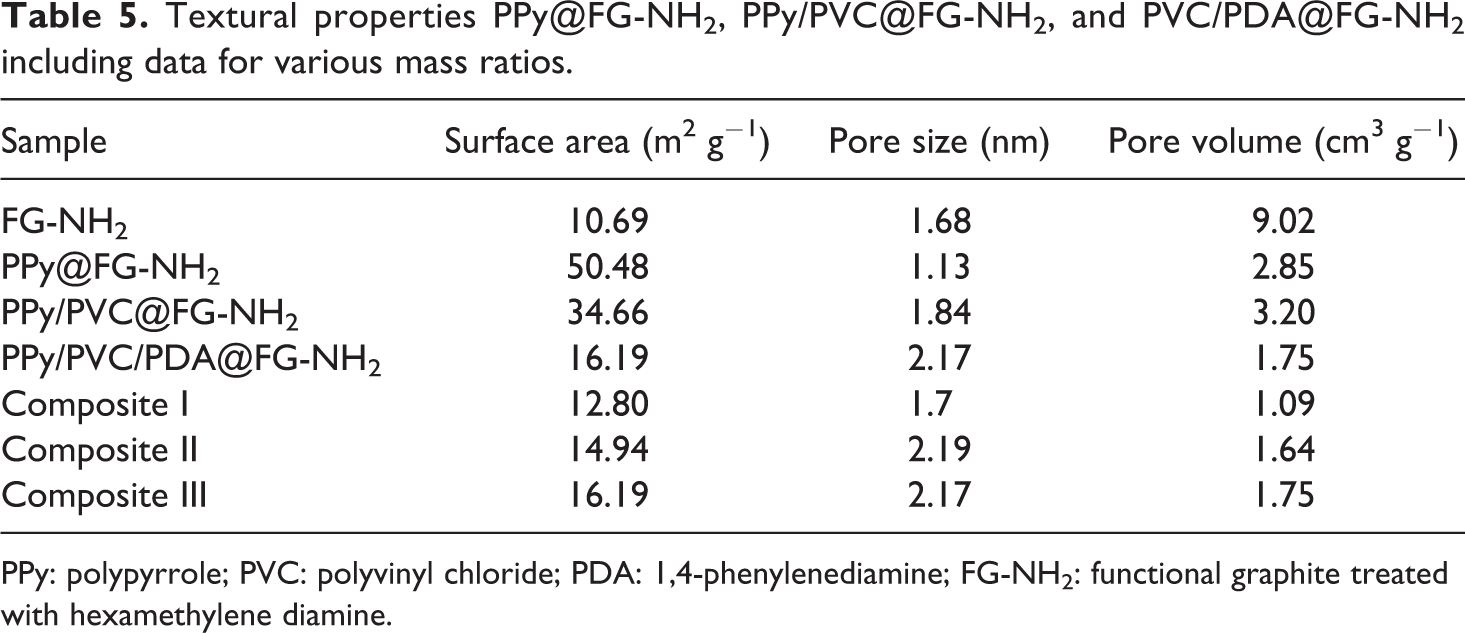
PPy: polypyrrole; PVC: polyvinyl chloride; PDA: 1,4-phenylenediamine; FG-NH2: functional graphite treated with hexamethylene diamine.
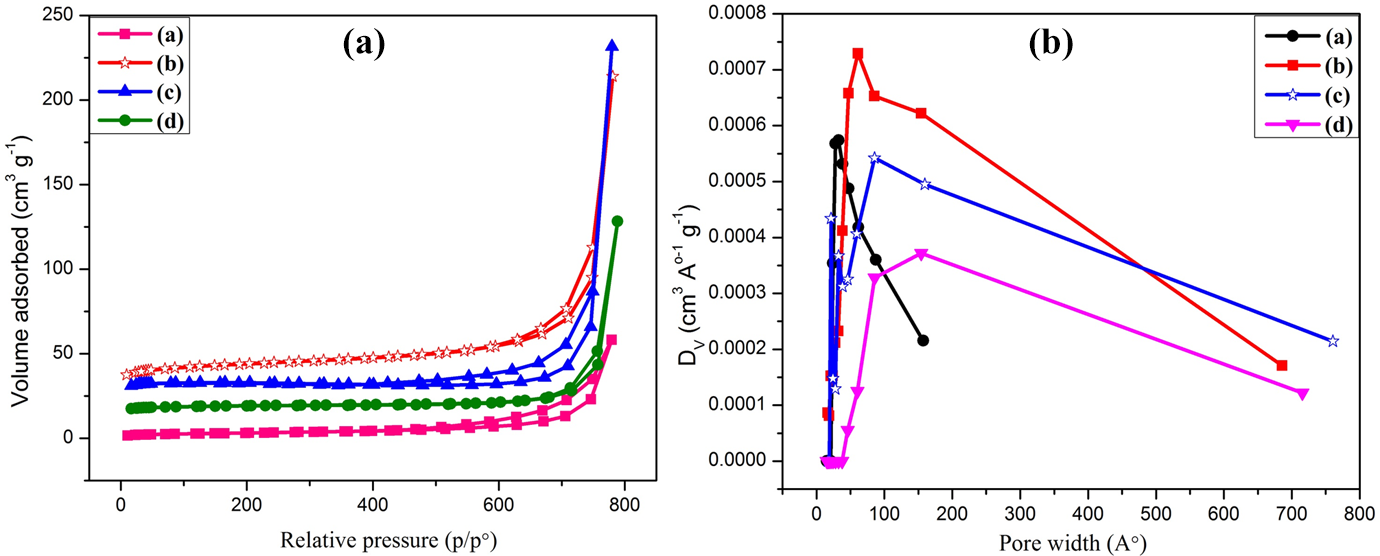
The influence of feeding ratios of conducting polymer (PPy) on the adsorption–desorption and Barrett–Joyner–Halenda pore distribution curves are presented in Figure 13(a) and (b), respectively. The type-II isotherm is observed when adsorption takes place on powders with pore diameter larger than micropores. The size of micropores observed for PPy/PVC/PDA@FG-NH2 composites I to III was 1.7, 2.19, and 2.17 nm, respectively. At higher pressure, the composites with higher mass ratio showed better adsorption capacity around 128 cm3 g−1 compared with low mass having adsorption capacity around 115 and 73 cm3 g−1, respectively. The surface area of composite with higher feeding ratio of PPy was found to be 16.19 m2 g−1 greater than composites with low feeding ratios (14.94 and 12.80 m2 g−1, respectively). It is reported that the enhanced pore volume provides more surface area for the adsorption and consequently facilitating the catalytic activity as well. 51
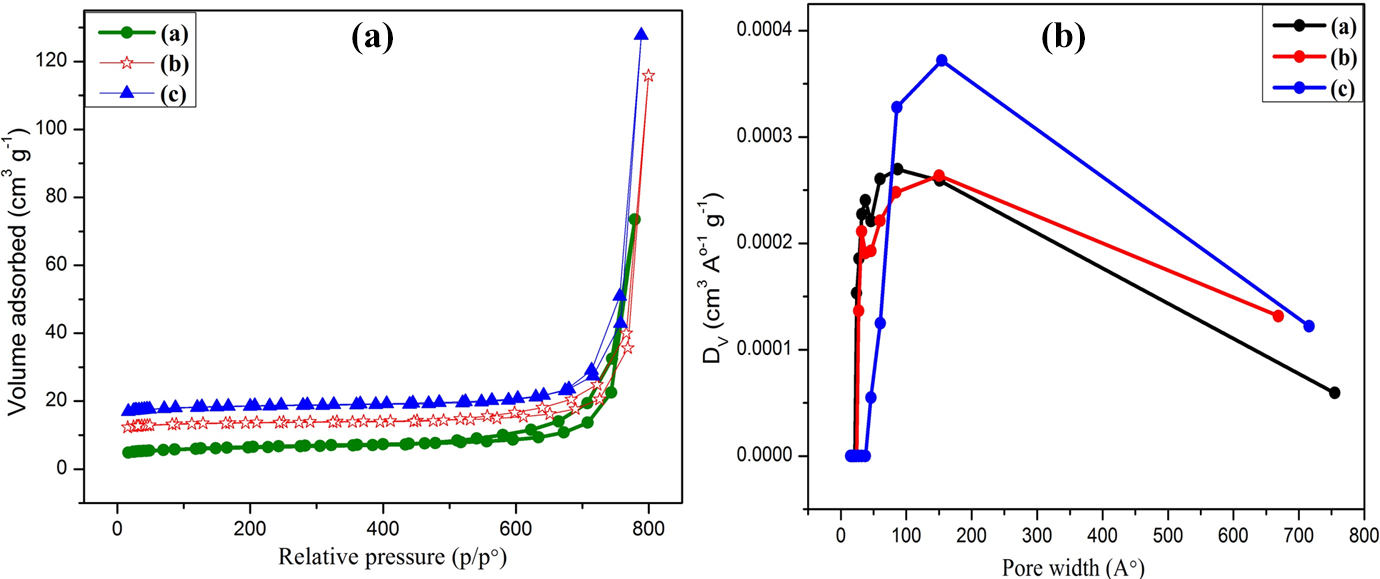
(a) A preliminary comparison of all surface areas and (b) pore size distribution curves for (inset (a)) composite I, (inset (b)) composite II, and (inset (c)) composite III.
Electrical conductivity performance
The variation of electrical conductivity of PPy@FG-NH2, PPy/PVC@FG-NH2, and PPy/PVC/PDA@FG-NH2 composites with temperature is displayed in Figure 14. The composite constituting PPy and PVC as a matrix and PDA as linker showed a dramatic increase in conductivity and approaches to a maximum value attributed to the presence of PPy and FG-NH2 moiety. In PPy/PVC/PDA@FG-NH2 composite, the conductive passageways were formed by partial network connections leading to a dramatic increase in conductivity. 43,52,53 In spite of this, some conjugated structures also resulted in conductivity of composites. Moreover, in the case of PPy/PVC@FG-NH2 composite (indicated by filled red circles), a slight increase in temperature results with decrease in conductivity due to the removal of solvent which is bounded to polymer chains and oligomers of low molecular weight. The cause of such decrease in conductivity may be that initial increase in temperature is being used up in filler orientation instead of hopping of electron from highest occupied molecular orbital (HOMO) to lowest occupied molecular orbit (LUMO) and hence decrease in conductivity. Then, at higher temperature, increase in conductivity was observed due to inter and intrachain hopping leading to high charge carrier mobility within the composite.
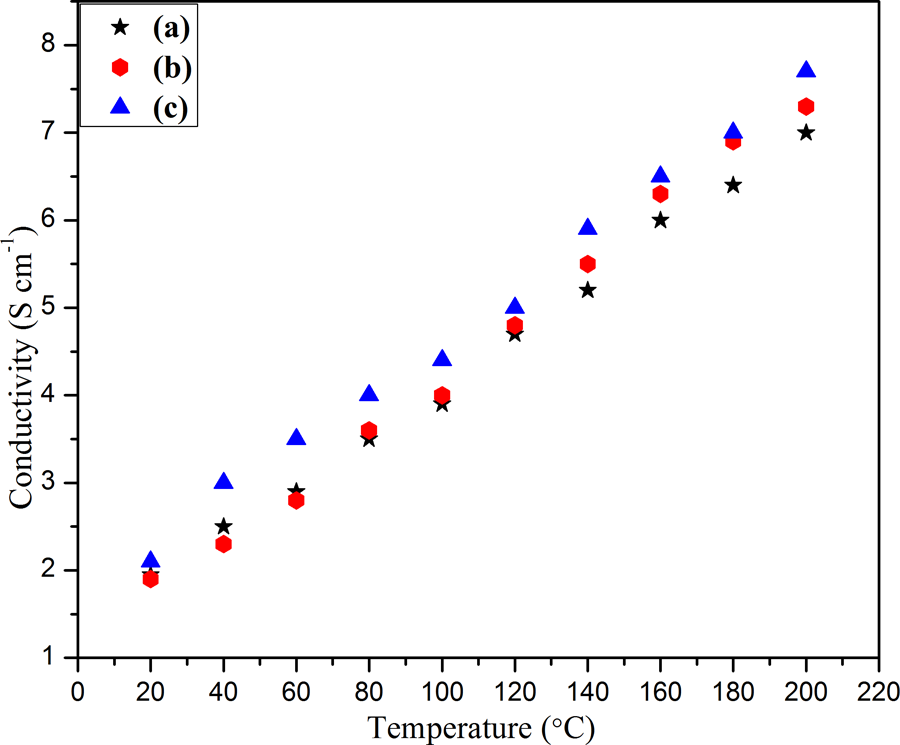
Electrical conductivity display of (a) PPy@FG-NH2, (b) PPy/PVC@FG-NH2, and (c) PPy/PVC/PDA@FG-NH2.
Figure 15 showed the influence of mass ratios of PPy on conductivity. It can be clearly seen from bar chart that composite III with higher concentration has more conductivity than with lower once. This can be attributed to several factors such as increased concentration of PPy have more opportunity to get attached on the surface of modified graphite providing more diffusion paths and hence facilitating the electrochemical activities of PPy in nanocomposite. 54 At higher concentration of PPy, increase in conductivity may also be attributed to π–π stacking between FG-NH2 and PPy for which electron mobility inside the composite increases.
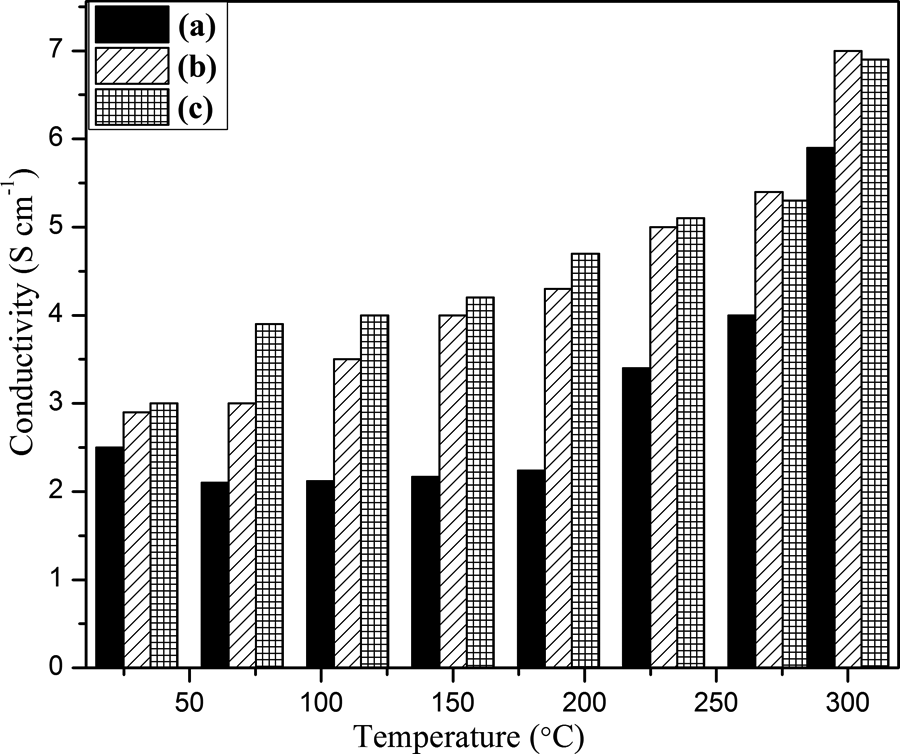
Electrical conductivity display of (a) composite I, (b) composite II, and (c) composite III.
Conclusions
In this article, we reported a rational design and synthesis of hierarchical multilayered mesoporous hybrid material. First, pretreatment of graphite (acidic functionalization) without damaging the structural properties of filler was carried out. Afterward, the incorporation of functionalized filler into a polymeric matrix by means of in situ polymerization led to a high-performance multilayered PPy/PVC/PDA nanocomposite. The effect of various concentrations of conducting polymer on the physicochemical properties of composites was investigated. The structural and morphological results reveal encapsulation of FG-NH2 by PPy and PVC. The fabricated nanocomposites showed improvement in thermal stability as measured by thermal analysis. The increase in electrical conductivity can be ascribed to the formation of conducting network which is also consistent with SEM investigation demonstrating well dispersion of filler inside the matrix without agglomeration. Composite III constituting a higher concentration of PPy displayed higher conductivity as well as increased surface area could have potential application in rechargeable batteries. Increasing concentration of PPy chains provides channels for the transportation of electrons. Overall, FG-NH2 has also demonstrated an exciting ability to simultaneously improve multiple physical, thermal, electrical, and surface characteristics of polymer nanocomposites making it a multifunctional nano-reinforcement and can be used in energy storage devices, biosensors, and other fields.
Footnotes
Acknowledgements
The authors acknowledge the financial support of Higher Education Commission, Islamabad, Pakistan, under the indigenous PhD fellowship scheme.
Funding
The author(s) disclosed receipt of the following financial support for the research, authorship, and/or publication of this article: This work was supported by the Higher Education Commission, Islamabad, Pakistan, under the indigenous PhD fellowship scheme.