
Abstract
β-Tricalcium phosphate (β-TCP)/hydroxyapatite (HA) nanocomposite have been synthesized by the precipitation method. Then, the effect of change in weight percentage, temperature, stirring time, pH, and surfactant on β-TCP/ HA nanocomposite powders were studied. The samples were characterized by different techniques such as X-ray diffraction, Fourier transform infrared spectra, and scanning and transmission electron microscopy techniques. The results showed that using a chemical deposition method, β-TCP/HA nanocomposite with uniform size and particle size distribution could be obtained. SPAN 20 had better results as a surfactant compared to Aliquat. In general, samples were optimized in a pH of 10, with 24-h stirring time, temperature of 1100°C, and concentration of 0.3 molar calcium salt and 0.19 molar salt phosphate.
Introduction
Bioceramics such as alumina, zircon, calcium phosphates, and bioglass have inordinate prominence in biological environments. Research and progress on such bioceramics have made significant contributions to the health and quality of human life. 1 –3
Calcium phosphate-based materials have expected much devotion as bone graft substitutes in dental and orthopedic reconstructive medicine because of their outstanding biocompatibility, bioactivity, and osteoconduction characteristics. 4 –6 Specifically, the most broadly used calcium phosphate-based materials are hydroxyapatite [HA, Ca10(PO4)6(OH)2] and β-tricalcium phosphate [β-TCP, Ca3(PO4)2]. Despite their positive biological properties, both materials have a number of problems that decrease their clinical performance. 7,8 The central attractive feature of these bioactive bone graft materials is their capacity to arrange a strong direct bond with the host bone resulting in strong interface compared to other bioinert or biotolerant materials which form a fibrous interface. 2,9 Researchers showed that the dissolution of HA in the human body after implantation is too low to complete the optimal formation of bone tissue. On the other hand, β-TCP shows fast release of Ca2+ and PO4−3 ions when exposed to physiological fluids. 2,10,11 Furthermore, hydroxyapatite crystals has the chemical formula of Ca10(PO4)6(OH)2 and calcium-to-phosphorus (Ca/P) ratio of 1.67. It can normally make up to 69% of the weight of the natural bone. Hydroxapatite has a hexagonal structure and is the most stable phase among numerous calcium phosphates. Hydroxyapatite is stable in body fluid as well as in dry or moist air up to 1200°C. It does not decompose and has shown to be bioactive. The β-TCP, represented by the chemical formula of Ca3(PO4)2 with Ca/P ratio of 1.5, also has a hexagonal crystal structure. 1,12,13
The biocompatibility and similarity of calcium phosphates like hydroxyapatite and tricalcium phosphate to the mineral composition of human bone and teeth have made them appropriate for replacement of damaged segments of human skeleton system. 1,14 Biphasic calcium phosphate (BCP) composites consisting of HA and β-TCP have many applications in human body. 1,15
Whereas stoichiometric HA and TCP have been broadly studied during the last decades. Few work ratios have been done to study of BCP that consists of an intimate mixture of HA and β-TCP of varying HA to β-TCP ratios. 16 –18 BCP has been developed to combine the benefits of the properties of HA and β-TCP. The term BCP was first used by Heimann et al. 16 to describe bioceramic that consisted of a mixture of HA and β-TCP, after the X-ray diffraction (XRD) analysis. Kim et al. described that the mixture of 20% HA and 80% β-TCP was contained in the prepared porous TCP by XRD analysis. Newly, there is growing interest in developing BCP ceramic as the scaffolding material for the reason that BCP is more effective in bone repair or regeneration than pure HA or pure β-TCP and has controllable biodegradation rate to a confident degree. 17 The degradability of this compound is depending on the Ca/P ratio with TCP being the maximum ratio and usually results in the most extensive bone remodeling around the scaffold. 5,18 Controlling the HA to β-TCP ratio is very important for controlling the bioreactivity of the porous BCP foam as reported by Yamada. 4 HA is stable in the body fluid, while TCP is rather soluble. The dissolution rate of HA in body fluid is too low but that of β-TCP is too fast for bone bonding. Thus, BCP consisting of HA and TCP can be used to control the bioresorbability and accomplish optimal results. Numerous researchers have recently attempted to develop BCPs comprising HA and β-TCP as well using numerous synthetic routes, such as the blending of different calcium phosphates in solid-state reactions, 9,19 precipitation, 6,20 liquid mix techniques, 10,21 treatment of natural bone, 8,22 spray pyrolysis, 11,23 microwave, 12,24 and high-energy drying milling. 25
BCP powder was synthesized using wet precipitation method. However, it was very difficult to control the pH of the chemical synthesis process as it can vary with temperatures.
In this present study, the nanocomposites with different β-TCP/HA ratios have been produced by employing different Ca/P ratio, pHs, sintering time, surfactants, and different sintering temperatures. To this end, the novelty of this report is to obtain the optimum Ca/P ratio, pHs, sintering time, surfactants, and different sintering temperatures and then to modify β-TCP/HA nanocomposites which can produce a well-crystallized deified grain structure.
Materials and methods
Preparation of β-TCP/HA nanocomposite powder
BCP powder was synthesized via wet precipitation method by changing the parameters of the concentration of the raw material, pH, stirring time, surfactants, and temperature. To reach the stoichiometry and the ratio of Ca/P, variable concentrations were used to reach a suitable concentration. Nanocrystalline β-TCP/HA compounds were prepared by solution precipitation method using Ca(NO3)2 4H2O (Merck prolabo 0308821 142, Germany) and (NH4)2HPO4 (Merck prolabo A0143307 037, Germany) as starting materials and ammonia solution as an agent for pH adjustment.
To synthesize β-TCP/HA nanocomposite, aqueous solutions of calcium salt with a concentration of 0.3 molar and phosphate salt with concentrations of 0.225, 0.198, 0.191, 0.183, and 0.179 molar separately prepared and distilled into distilled water. The solution was stirred for 24 h and then it was aged for 24 h. The ammonia solution acts as agents for pH adjustment of 10. Following the separation of the deposition of the reaction solution, the solution was washed with distilled water and dried for 24 h at 110°C. The final powders were calcined at 1100°C for 2 h.
For the next part, preparation of β-TCP/HA nanocomposite with different pHs was achieved. At first, a solution of 0.191 M (NH4)2HPO4 was slowly added dropwise to the 0.3 M Ca(NO3)24H2O solution. After that, the solution was stirred for 24 h, and the resulting solutions with adjusted different pH of 8, 9, 10, and 11 were dried in an oven at 110°C for 24 h, and the obtained precipitations were calcined at 1100°C for 2 h. In the next part, the suspensions of 0.3 M of calcium salt and 0.191 M phosphate was vigorously stirred at 25°C. After that, the resulting solution was stirred for different stirring time (2, 12, 24, 36) with adjusted different pH of 10 and then, the obtained precipitation was dried in an oven at 110°C for 24 h, calcined at 1100°C for 2 h. In the following part, for enhancing the properties, the effect of two surfactants (Aliquat, Merck, Germany and Span 20, Merck, Germany) were achieved. The suspensions of ethanol with certain amount of surfactants (Aliquat and Span 20) were vigorously stirred at 25°C for 1 h, respectively.
After that the surfactants were added to the suspensions of 0.3 M of calcium salt and 0.191 M phosphate, and the resulting solution was stirred for 24 h and calcined at 1100°C for 2 h.
At last, the effect of different temperatures (850°C, 1100°C, 1200°C) on preparation of β-TCP/HA nanocomposites were accomplished. After preparing suspensions of 0.3 M of calcium salt and 0.191 M, Span 20 as a surfactant was added to the solution. The final solution was mixed for 24 h and aged for 24 h. After filtering and washing, the materials were dried at 110°C for 24 h and calcined at 850°C, 1100°C, and 1200°C for 2 h. Phase identification was performed by XRD PW1800, of Philips Company, using nickel-filtered copper K α radiation in the range of 2θ = 10°–60° with a scanning speed of 5° min−1.
The size of the crystalline was determined by the Scherrer method.
The equation was calculated as below
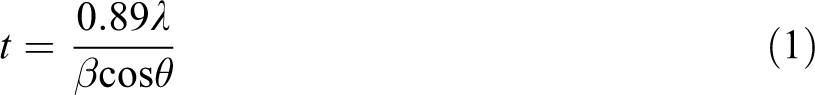
where, t is grain size, λ is the wave length, β is peak width chosen at half height in radians, and θ is the angle in degrees. 15
A Fourier transform infrared spectrometer (FTIR) by Perkin Elmer Spectrum (Germany) 100 series was used with the universal attenuated total reflection method.
Microstructures of powders were identified by transmission electron microscope (TEM; Philips–Zeiss, Germany) and field-emission scanning electron microscopy (FESEM PHENOM, Horsham).
Results and discussion
Microstructure properties of the β-TCP/HA nanocomposite
The XRD patterns of the β-TCP/HA nanocomposite with different Ca/P (1.3, 1.51, 1.56, 1.63, 1.67) are illustrated in Figure 1.The straight baseline and sharp peaks of the diffractogram in Figure 1 confirmed that the products were well crystallized. Over the whole range of compositions, when the input Ca/P molar ratio was 1.67, the peaks corresponding to HA were dominant with no evidence of others phases. At the other extereme, β-TCP was produced at an input Ca/P molar ratio of 1.3.
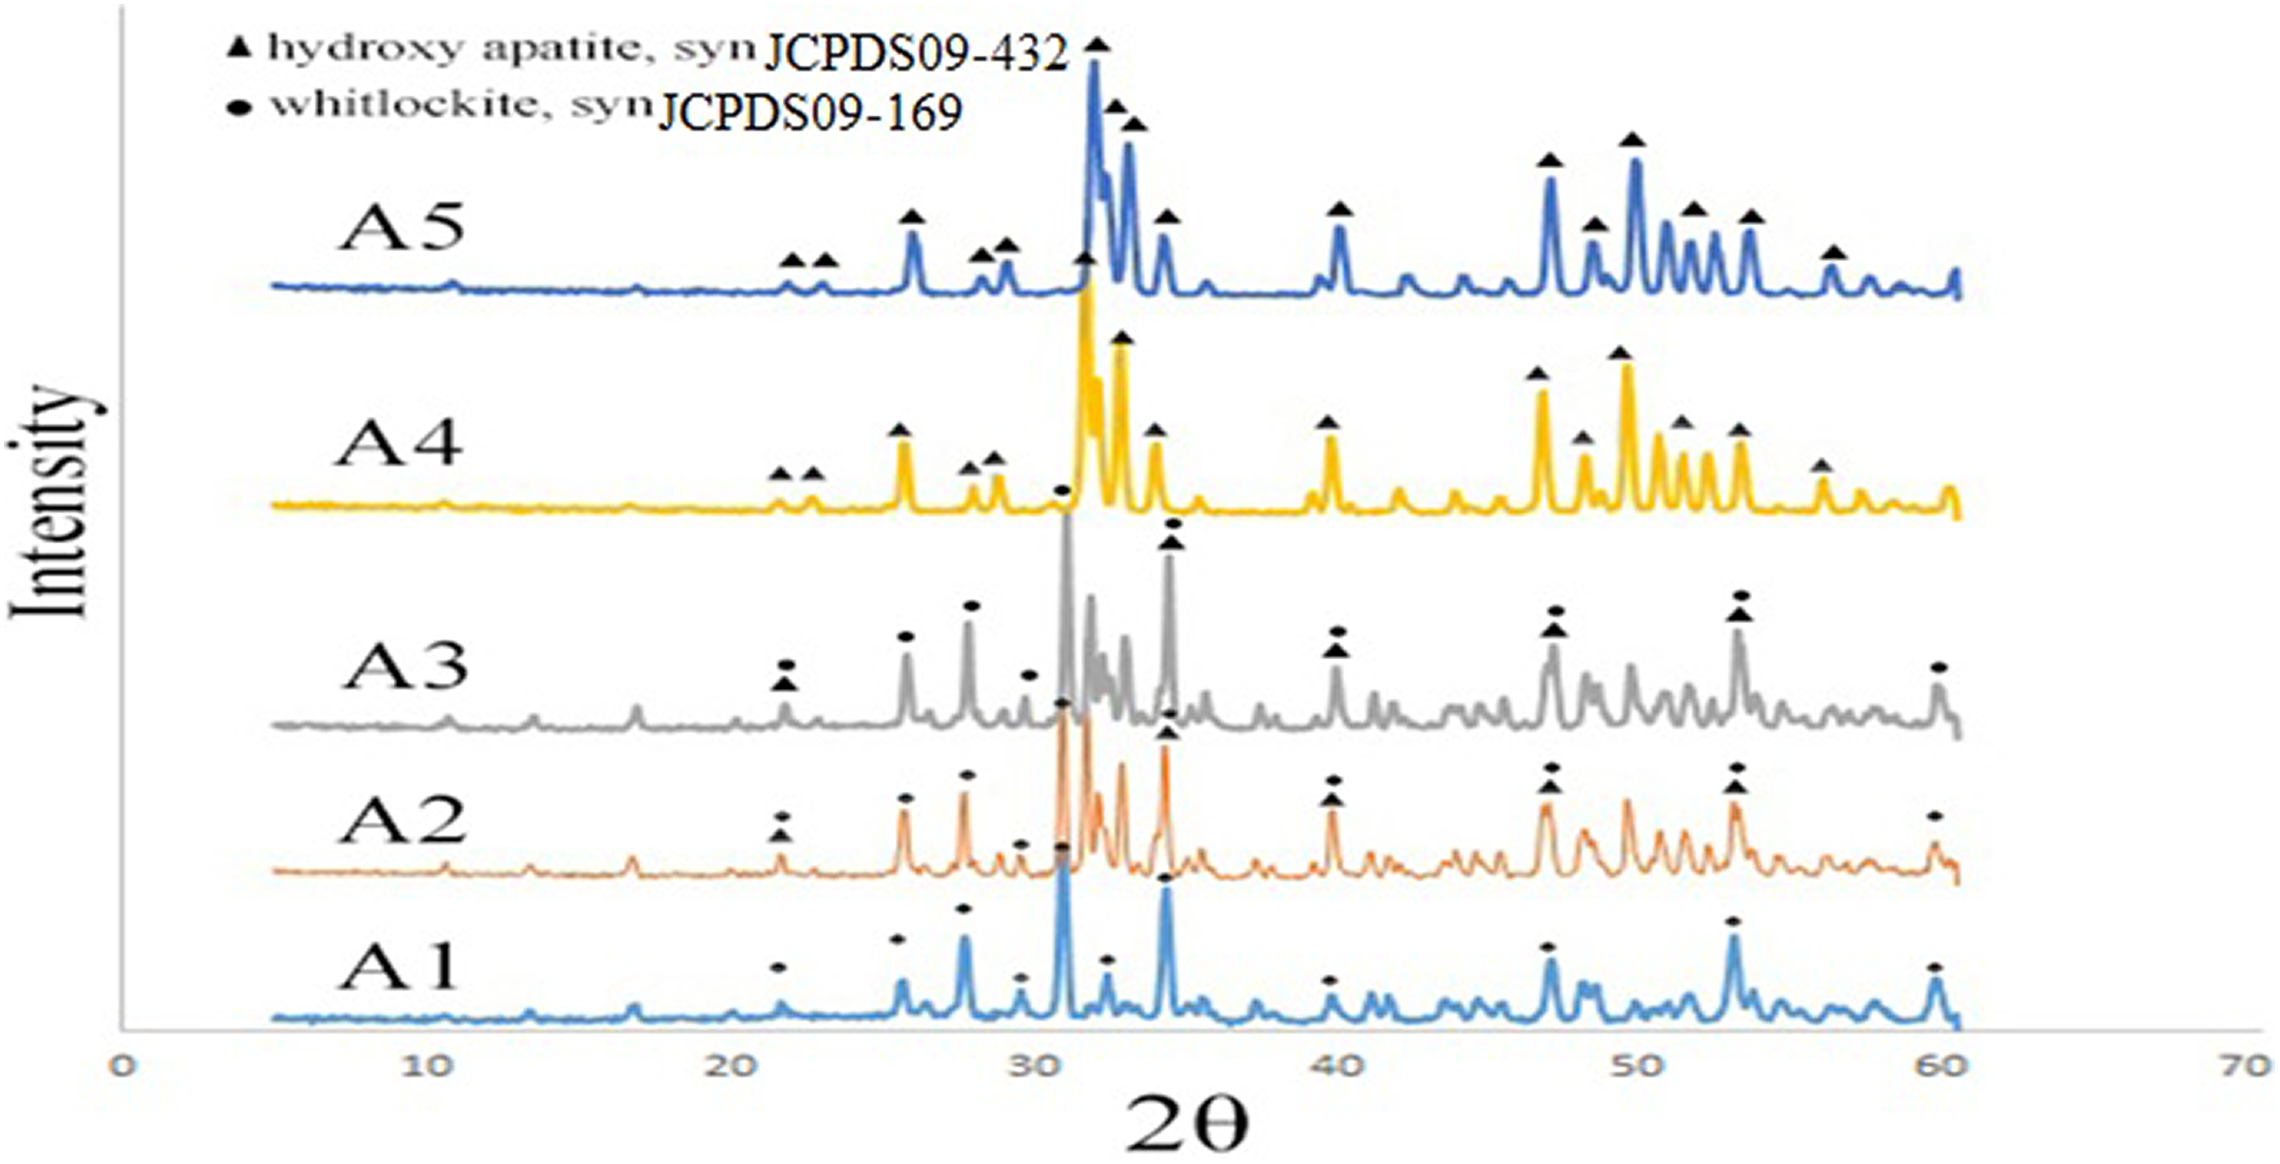
XRD patterns of β-TCP/HA nanocomposite with various Ca/P condition.
The sharp peaks of the XRD recorded pattern in Ca/P of 1.56 and 1.63 correspond to both β-TCP and HA phases, which is in agreement with the Joint Committee on Powder Diffraction Standard (JCPDS) card PDF No. JCPDS09-169 and JCPDS09-432, respectively.
On the basis of Scherrer equation, the crystalline size of A1–A5 samples after calcination at 1100°C temperature for 2 h was shown in Table 1.
Different Ca/P ratio and crystalline size for samples A1–A5.
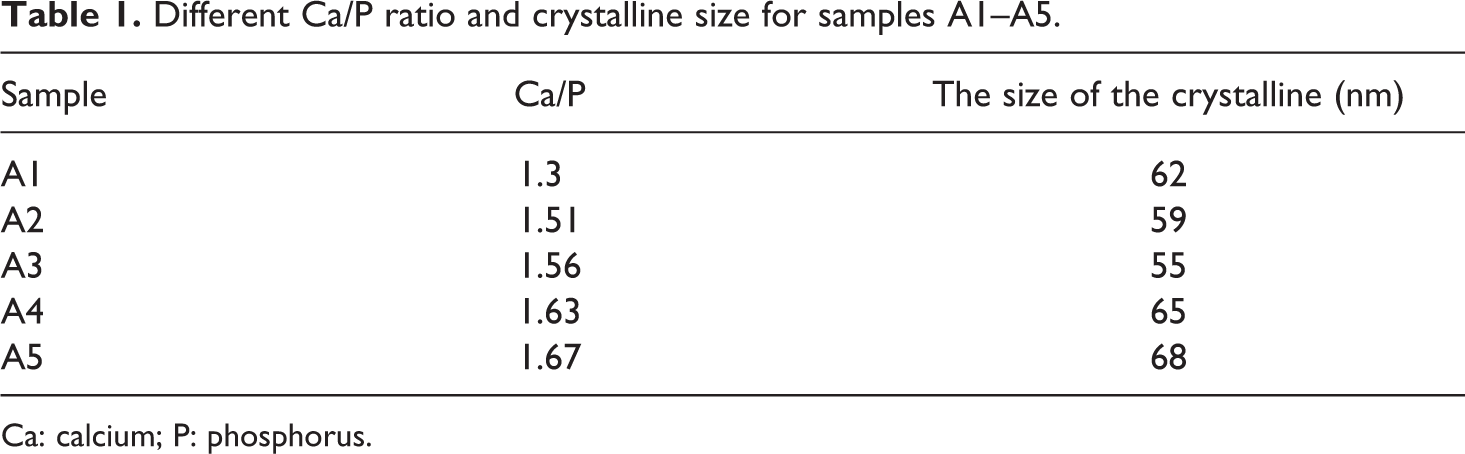
Ca: calcium; P: phosphorus.
The XRD patterns of the β-TCP/HA nanocomposite with different pH (8, 9, 10, 11) are illustrated in Figure 2.
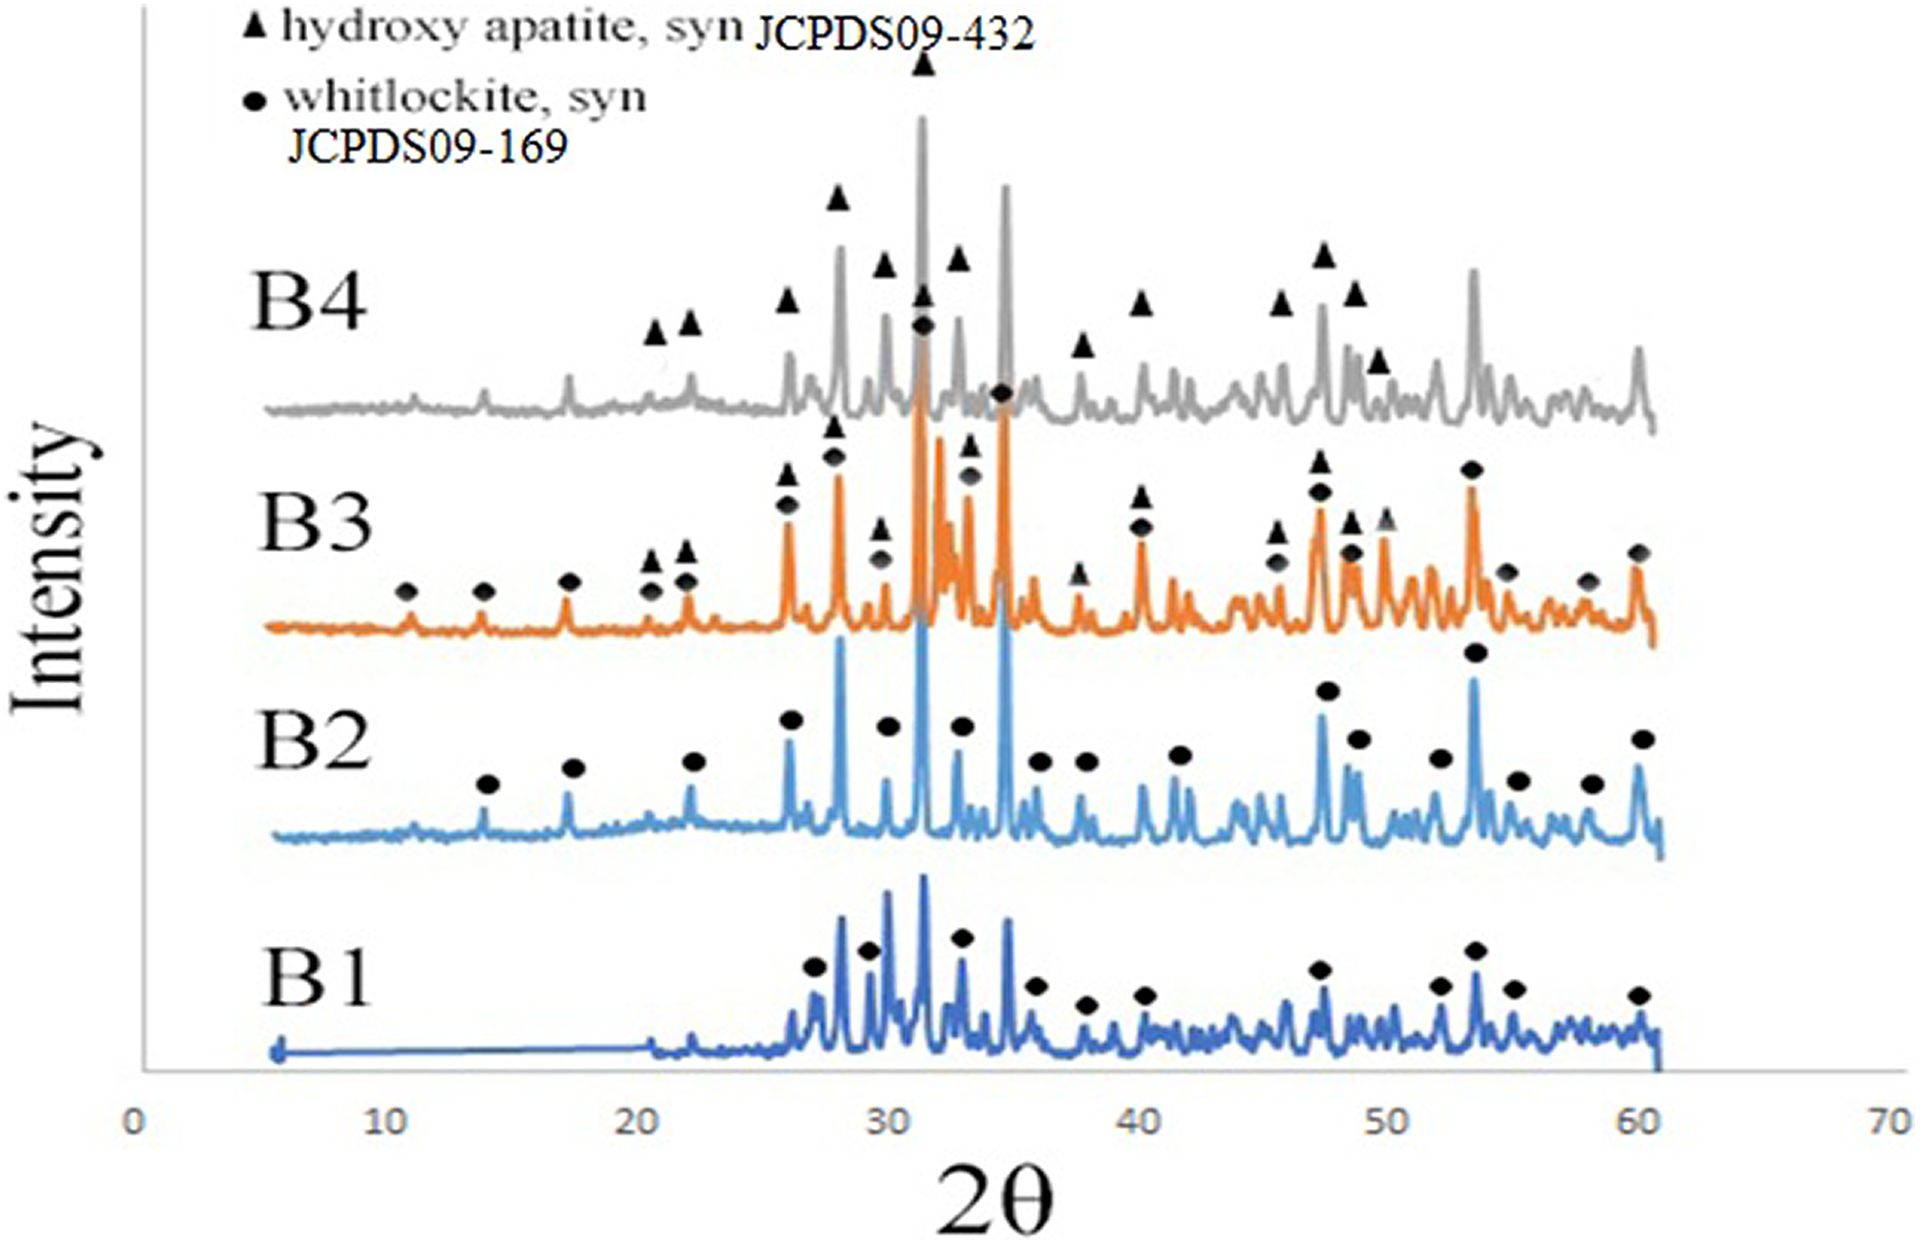
XRD patterns of β-TCP/HA nanocomposite with various pH conditions.
The sharp peaks of the XRD recorded pattern in pH of 8 and 9 correspond to β-TCP phase as a main phase and indexed according to the standard value (JCPDS 09-0169) but with increasing the pH to 10 indicated to both β-TCP and HA phases which is in agreement with JCPDS card PDF No. JCPDS09-169 and JCPDS09-432, respectively. Well-characterized peaks of pure HA is called as pure HA, and the peaks were indexed according to the standard pattern (JCPDS 09-0432), with the dominant phase at pH = 11. Moreover, with increasing the pH, the samples were more crystallized.
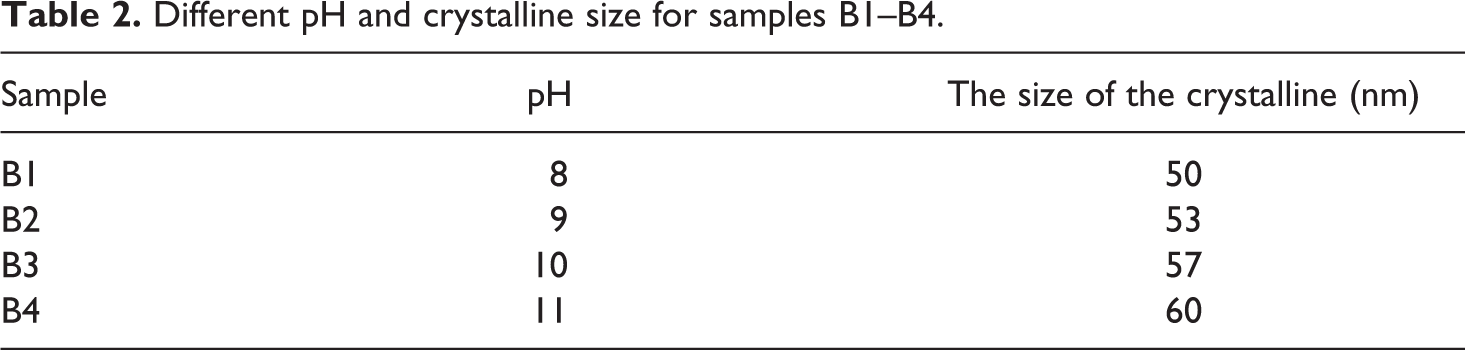
Regarding the Scherrer equation, the crystalline size of B1–B4 samples after calcination at 1100°C temperature for 2 h is shown in Table 2. With increase in the pH, the crystalline size of powders increased and the decomposition of HA decreased.
Different pH and crystalline size for samples B1–B4.
Taken together, the pH = 10 is the best pH for preparing the nanocomposites. The XRD patterns of β-TCP/HA nanocomposite with different stirring times are shown in Figure 3.
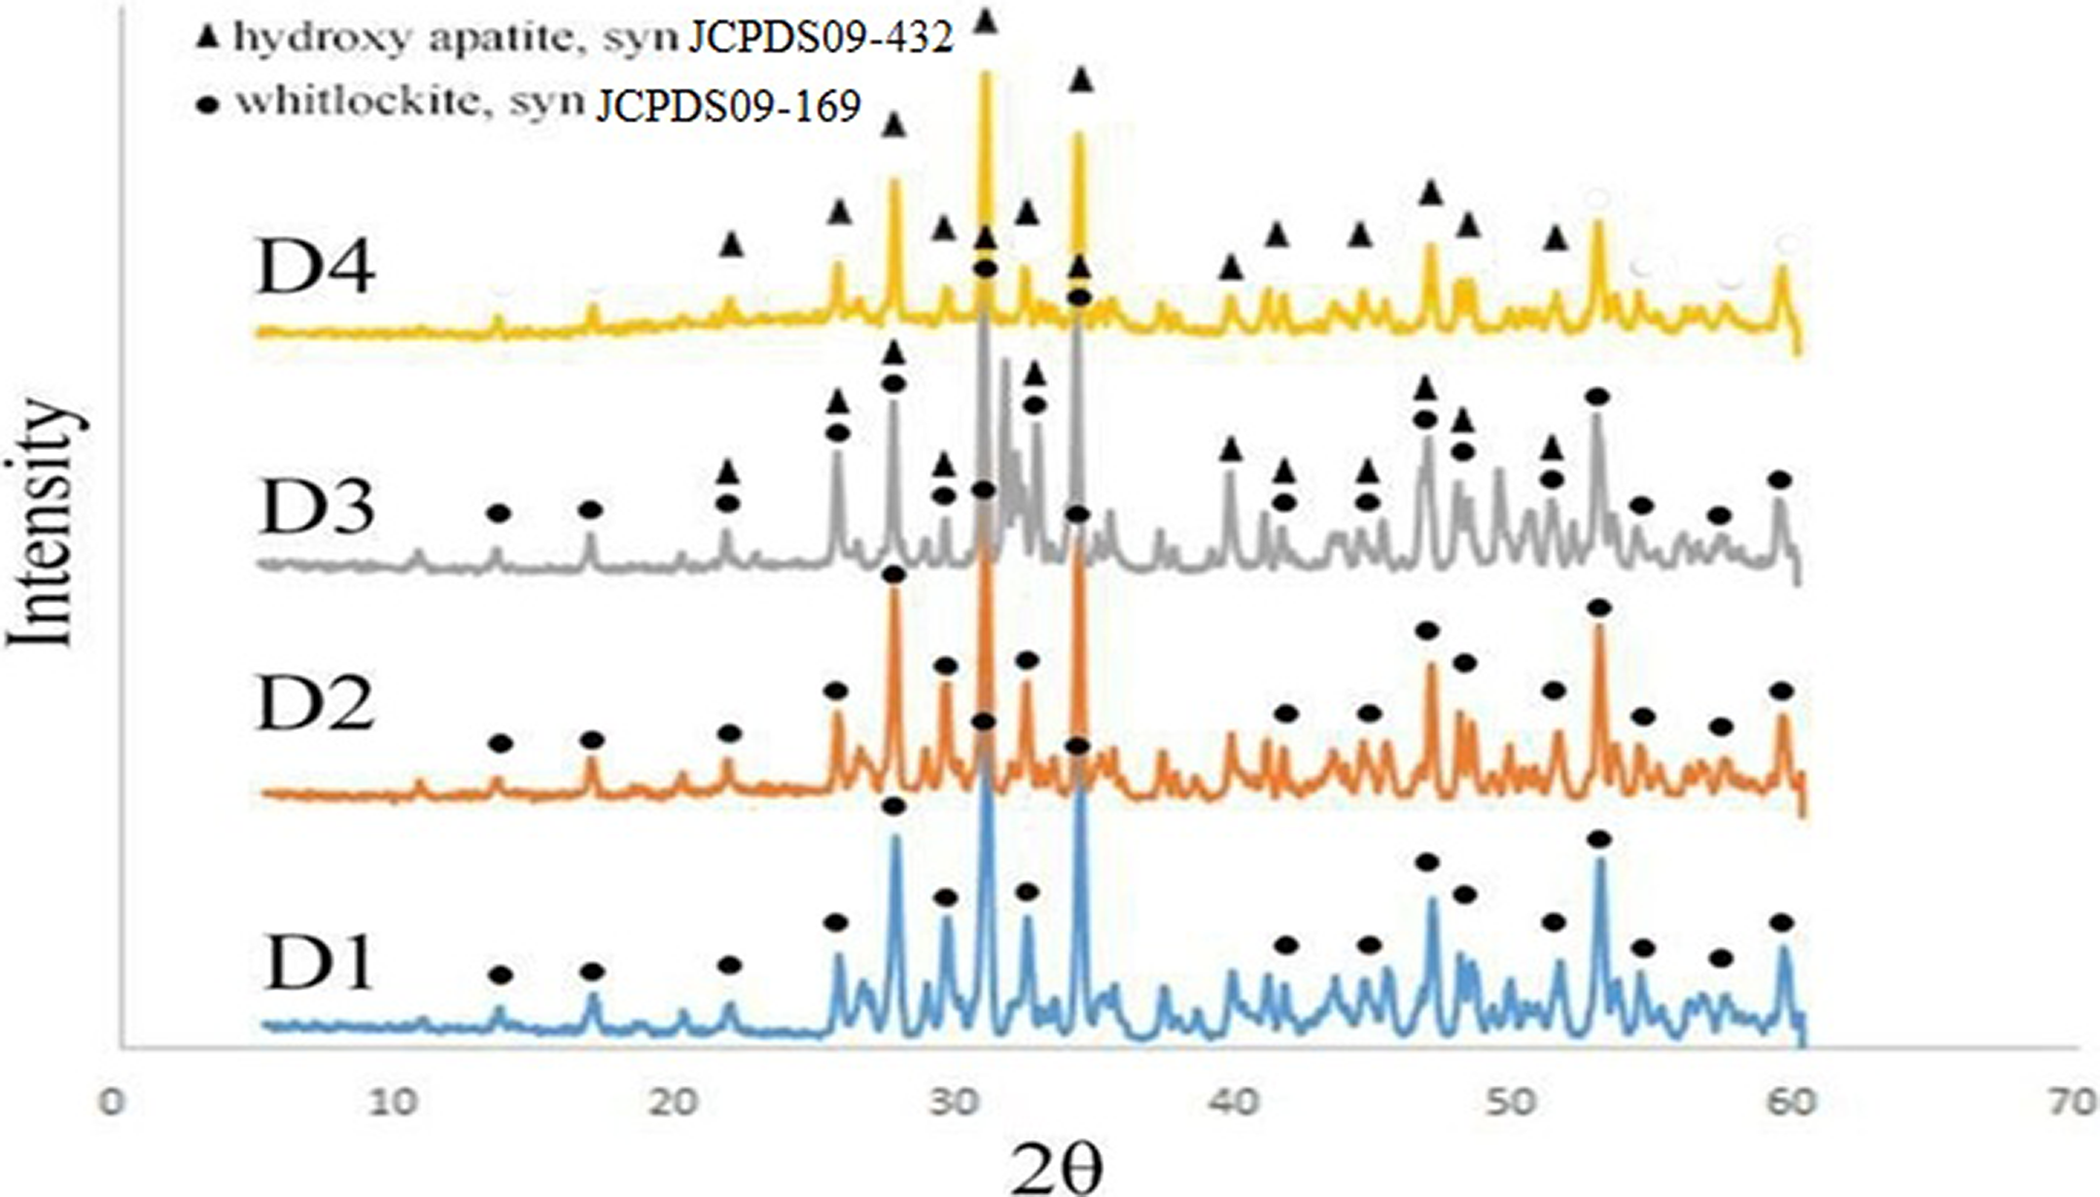
XRD patterns of β- TCP/HA nanocomposite with various stirring times.
The XRD characteristic peaks revealed that the main phases of D1 and D2 samples were β-TCP, but in samples D3 and D4, both β-TCP and HA phases existed which is in agreement with JCPDS card PDF No. JCPDS09-169 and JCPDS09-432, respectively. Furthermore, the main phase in D4 sample was HA phase, and in D3 sample, there were both TCP and HA phases equally.
The intensity of the additional peaks increased from D1 to D4, indicating that the amount of β-TCP decreased as the excess amount of the phosphate solution decreased during the preparation procedure. 1,26
The crystalline size of nanocomposites according to the Sherrer method is shown in Table 3.
Different stirring time and crystalline size for samples D1–D4.
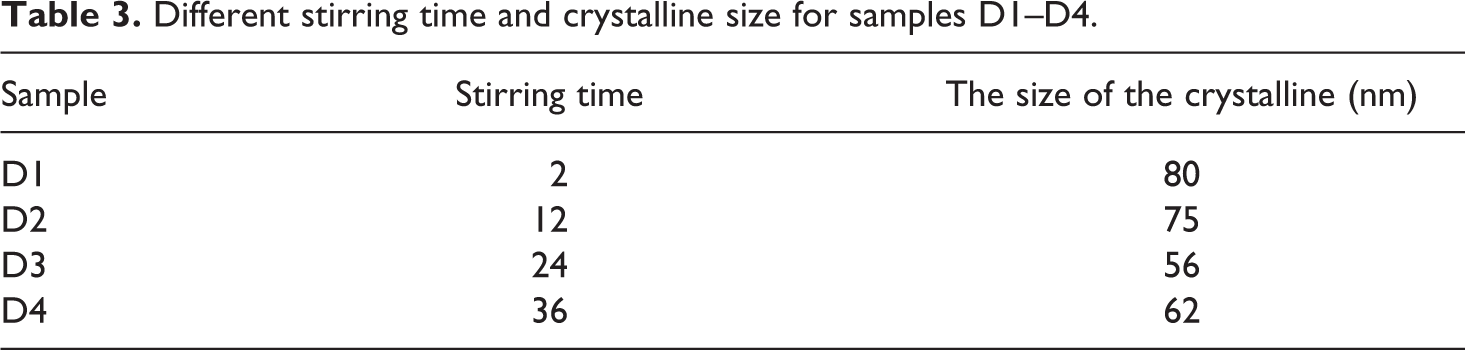
Figure 4 shows the XRD pattern of the β-TCP/HA nanocomposite powder with different surfactants.
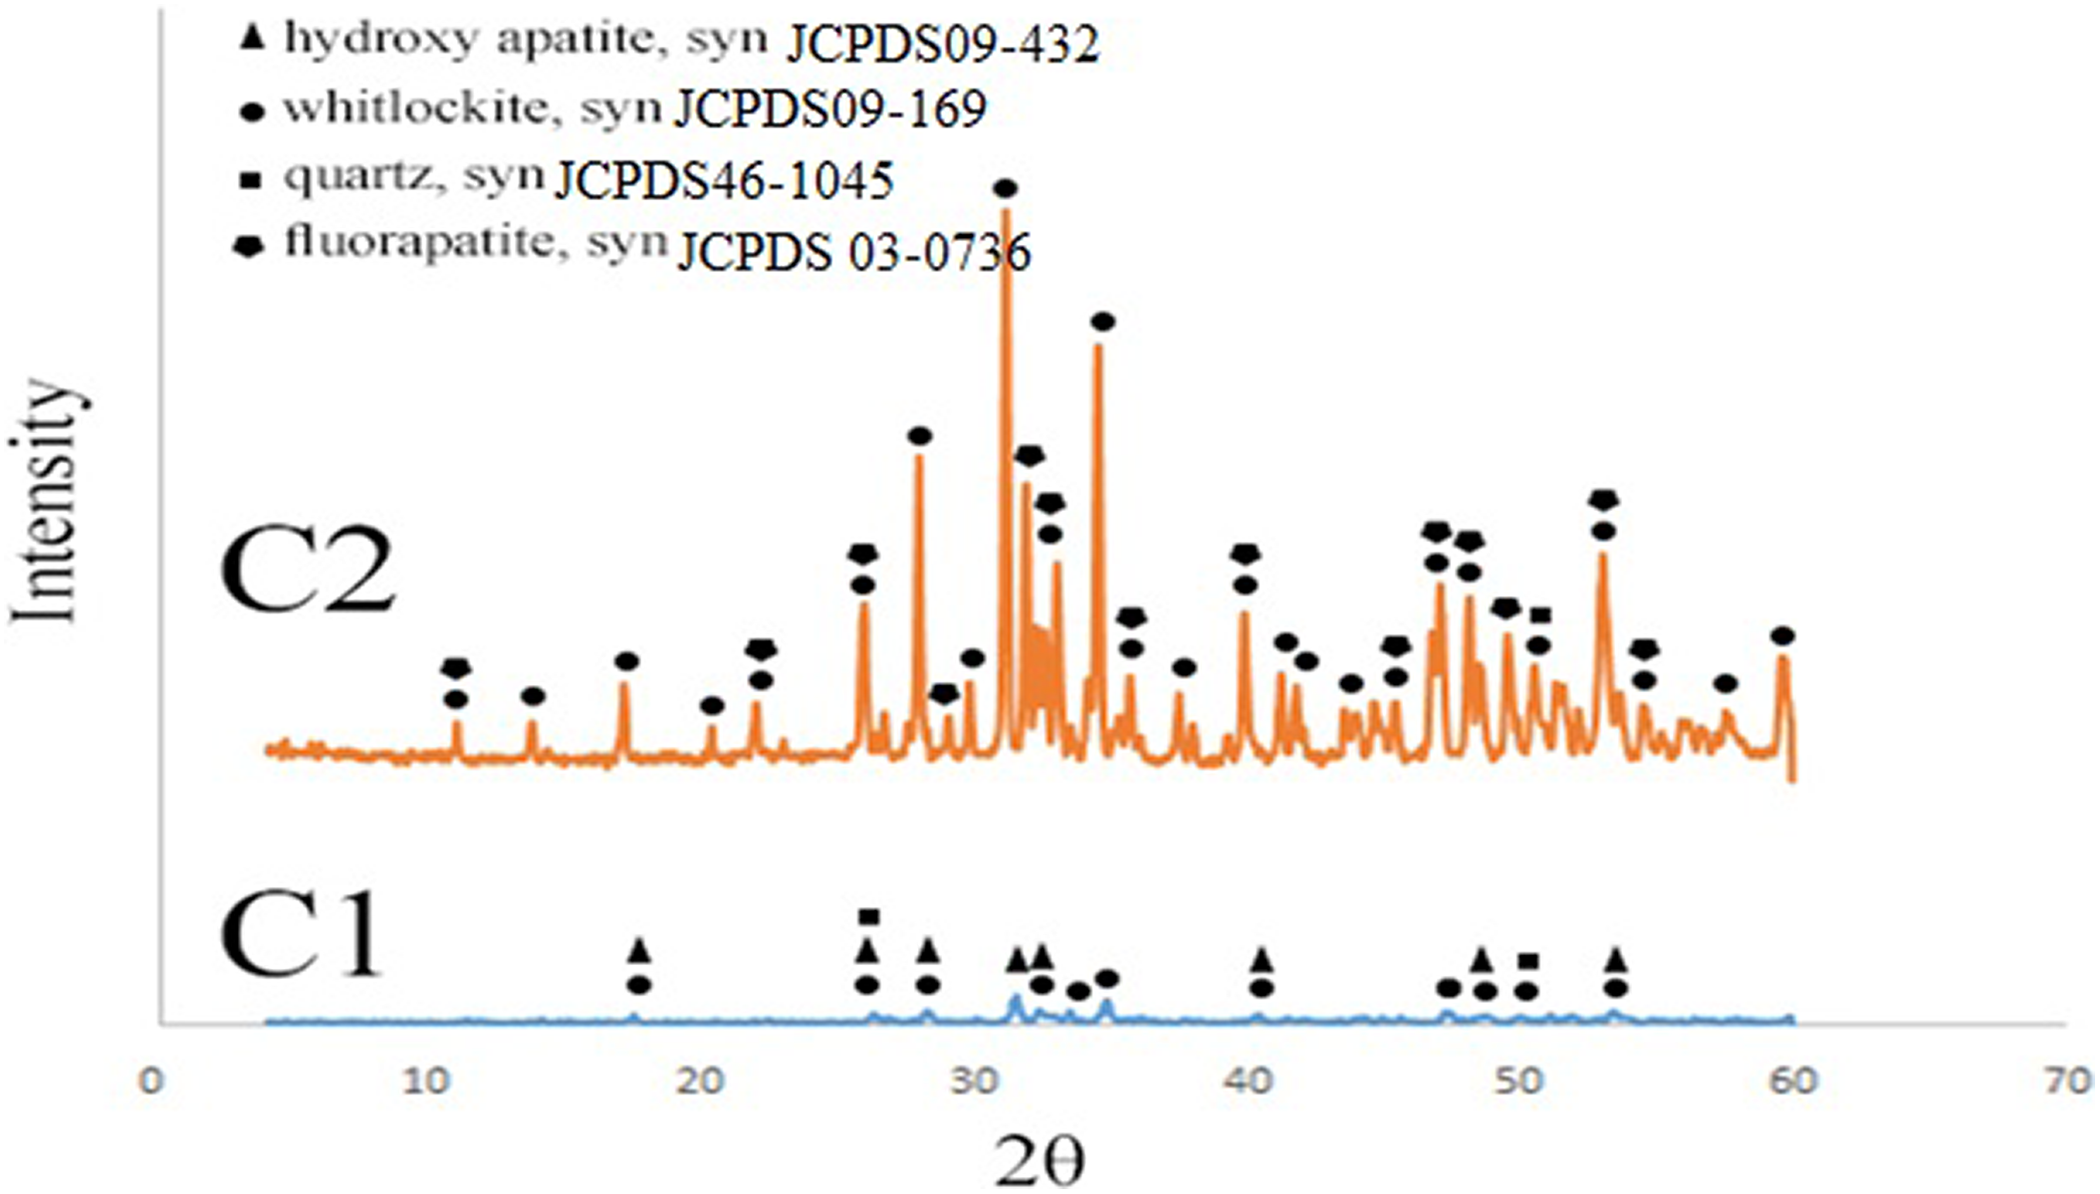
XRD patterns of β-TCP/HA nanocomposite with various surfactants.
The XRD characteristic peaks revealed that the main phases of all samples were β-TCP and HA phases. Furthermore, no significant difference was observed between them, indicating that the addition of surfactants did not affect the crystal structure of the final product.
But as it was shown, the peak intensity in the C1 sample was considerably larger and longer than the C2 sample. It should be noted that with the increase of SPAN 20, the grain size decreased, but by adding Aliquat, the crystalline size was bigger due to the agglomeration of the nanoparticles. This also matches the results of TEM. The crystalline size of nanopowders was calculated according to the Scherer equation (Table 4).
Different surfactants and crystalline size for samples C1–C2.
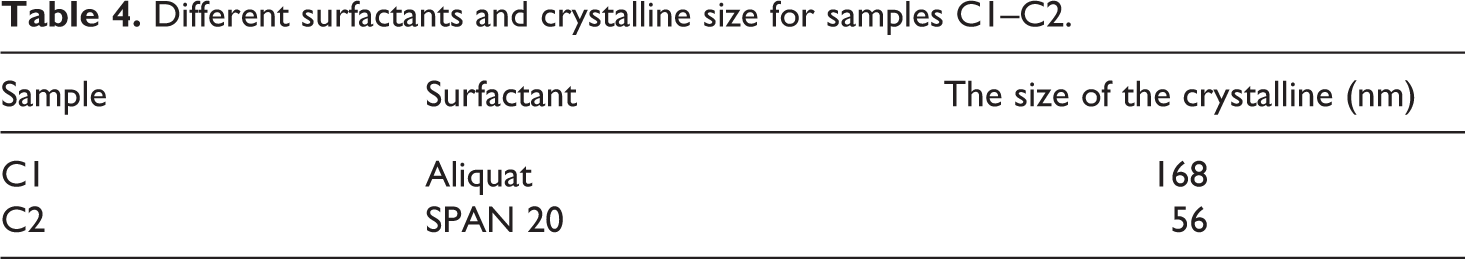
It was observed that by the increase of SPAN 20, the crystallite size decreased to 56 nm. However, further increase of Aliquad increased the crystallite size to 168 nm due to the agglomeration of nanoparticles. This might indicate a better dispersion, less agglomeration of nanoparticles with SPAN 20, and more powder crystallization.
Therefore, it was inferred that the best surfactant for β-TCP/HA nanocomposite is SPAN 20.
The XRD patterns of β-TCP/HA nanocomposite with SPAN 20 as a surfactant at different temperatures are shown in Figure 5.
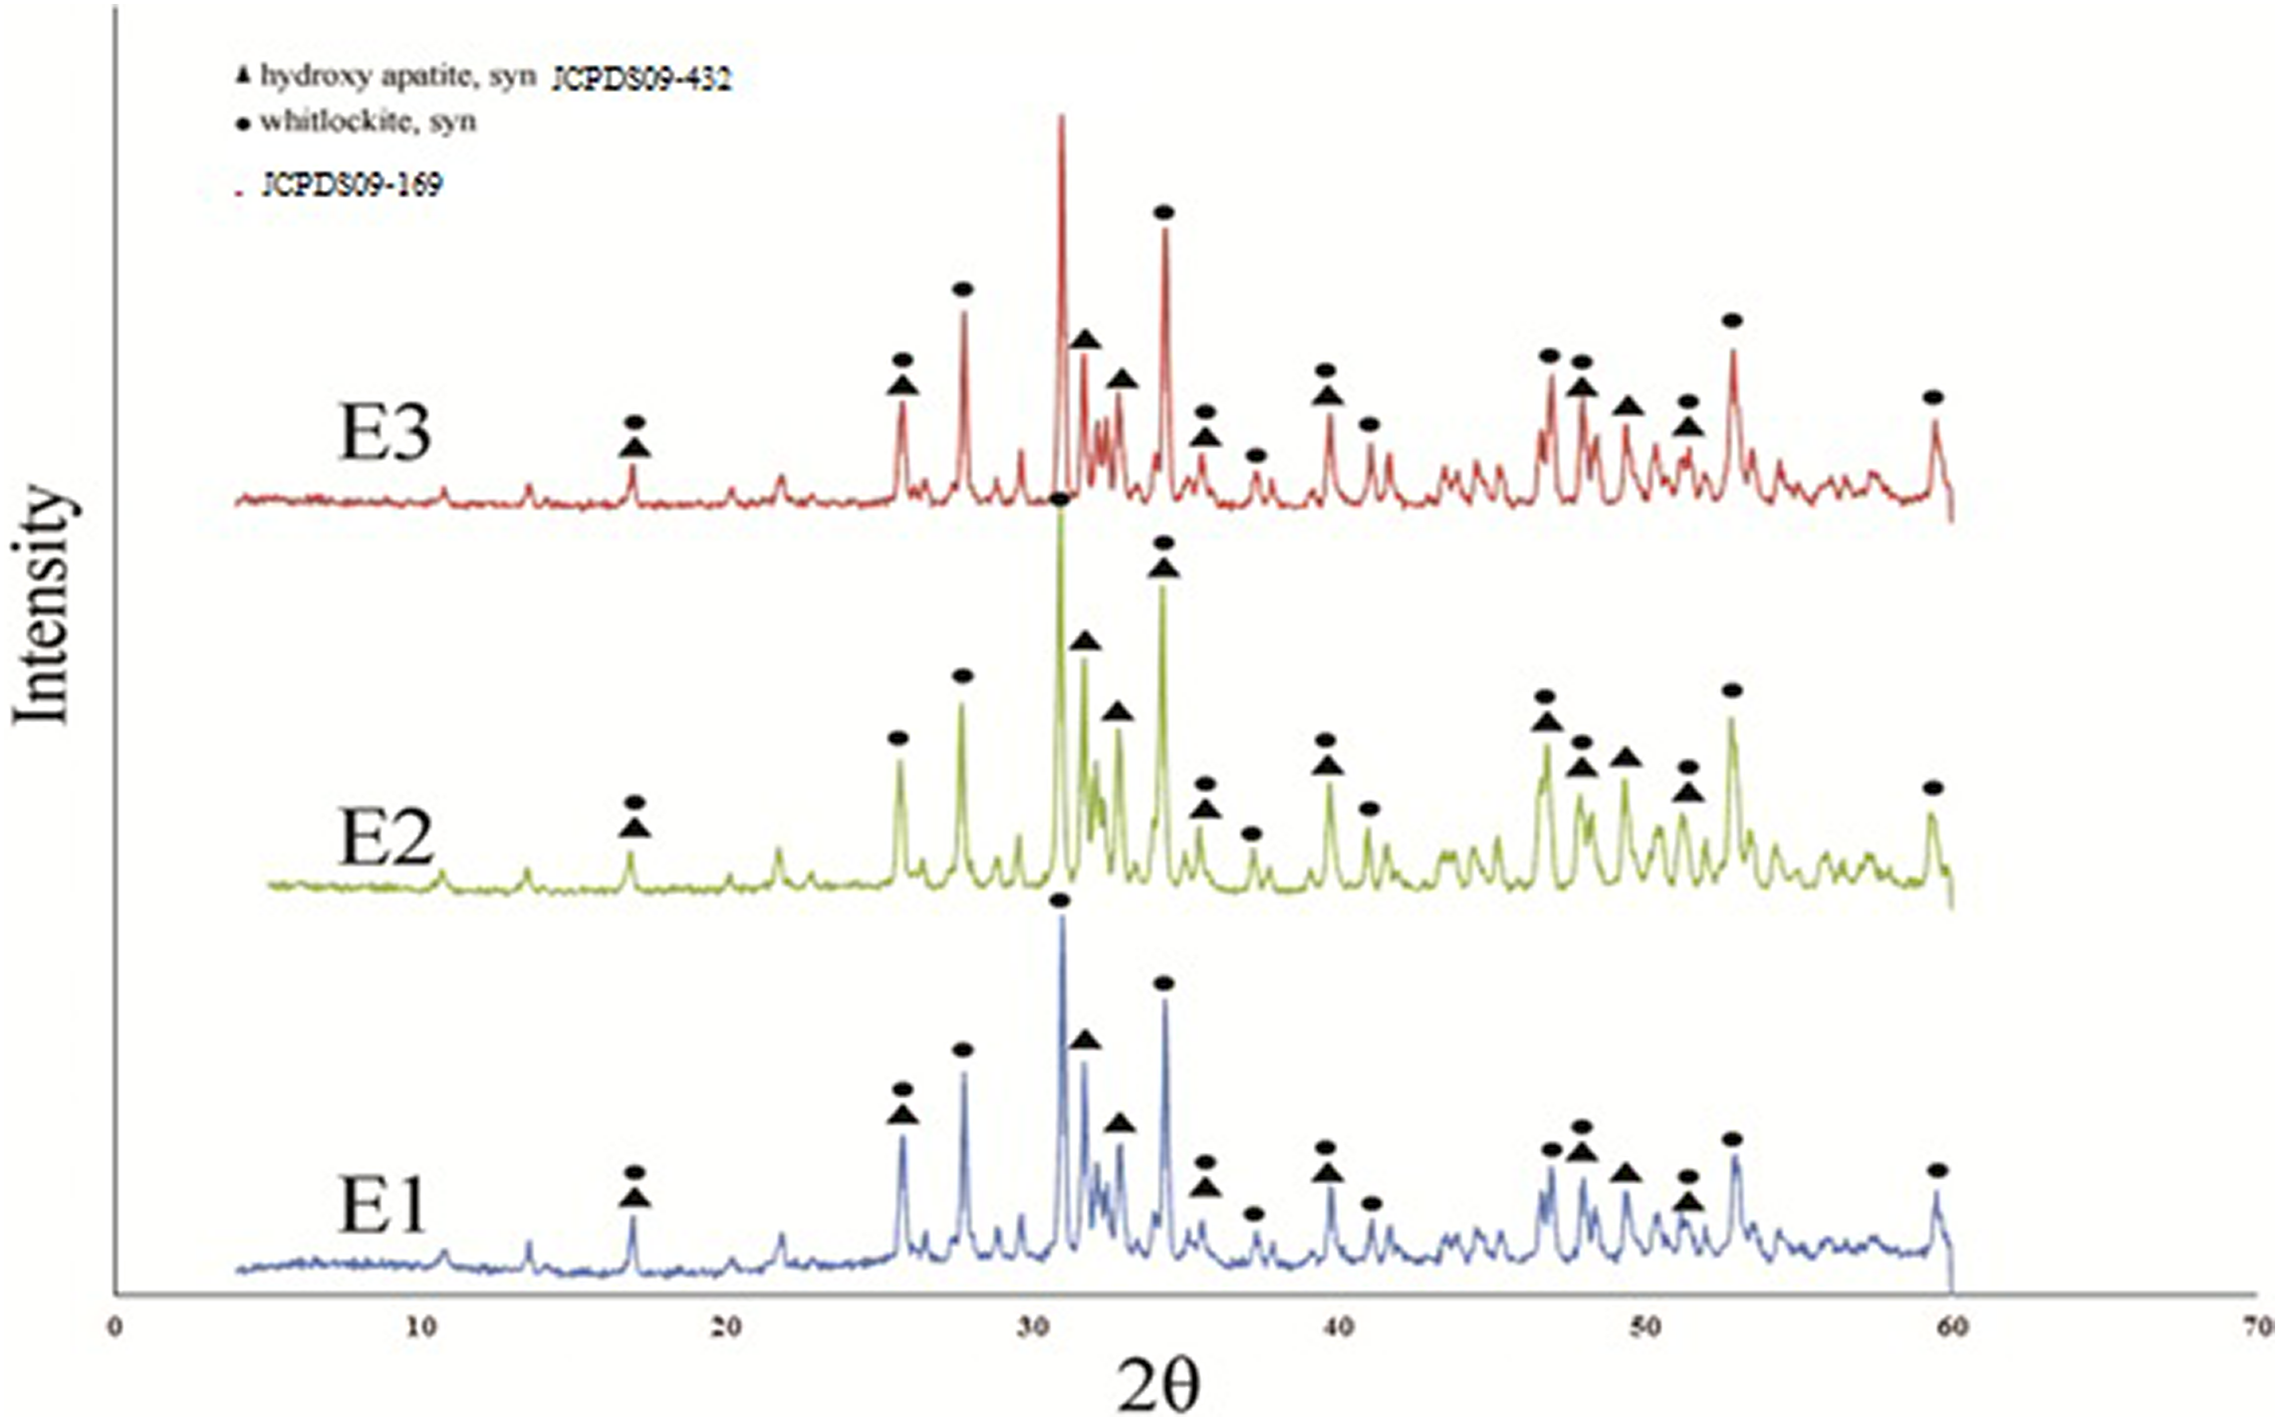
XRD patterns of β-TCP/HA nanocomposite with SPAN 20 as a surfactant at different temperatures.
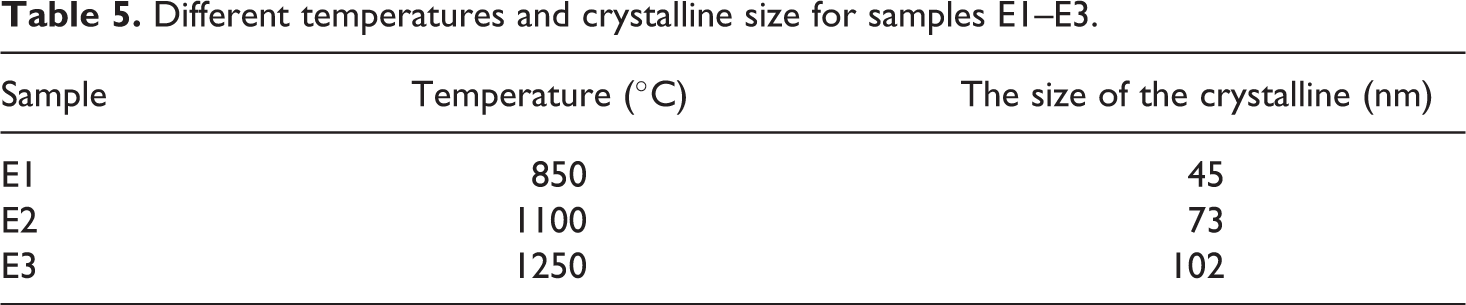
The XRD patterns revealed that the phases of all samples at different temperatures were β-TCP and HA phases. Furthermore, no significant difference was observed between them, indicating that the addition of temperature did not affect the phase structure of the final product. However, on the basis of the Scherrer equation, the crystalline size of E1–E3 samples after calcination at different temperatures for 2 h is shown in Table 5. It explained that with increasing the temperature of β-TCP/HA nanocomposite, the particle sizes were increased as shown in Table 5, which revealed a little bigger particle size and better powder crystallization.
Different temperatures and crystalline size for samples E1–E3.
The FTIR spectra of calcined β-TCP/HA nanocomposite revealing the absorption at 400–4000 cm−1 is shown in Figure 6. The FTIR shows the existence of phosphate (PO4 3−) bonds at 480 cm−1 and 600 cm−1, and 700–730 cm−1 related to P2O7 2; and HPO4 2− bonds at 800–1000 cm−1 which is related to β-TCP and the existence of phosphate at 570 and 600 cm−1 related to HA network. 27 –33 Hydroxyl (OH) bonds at 630, 1650, and 3567 cm−1and P–H band at 1989 and 2076 cm−1 related to HA network. 34,35 Existing peaks at 962 cm−1, 1043 cm−1 and 1088 cm−1 represent the stretching mode of the phosphate group in a crystalline hydroxyapatite network.
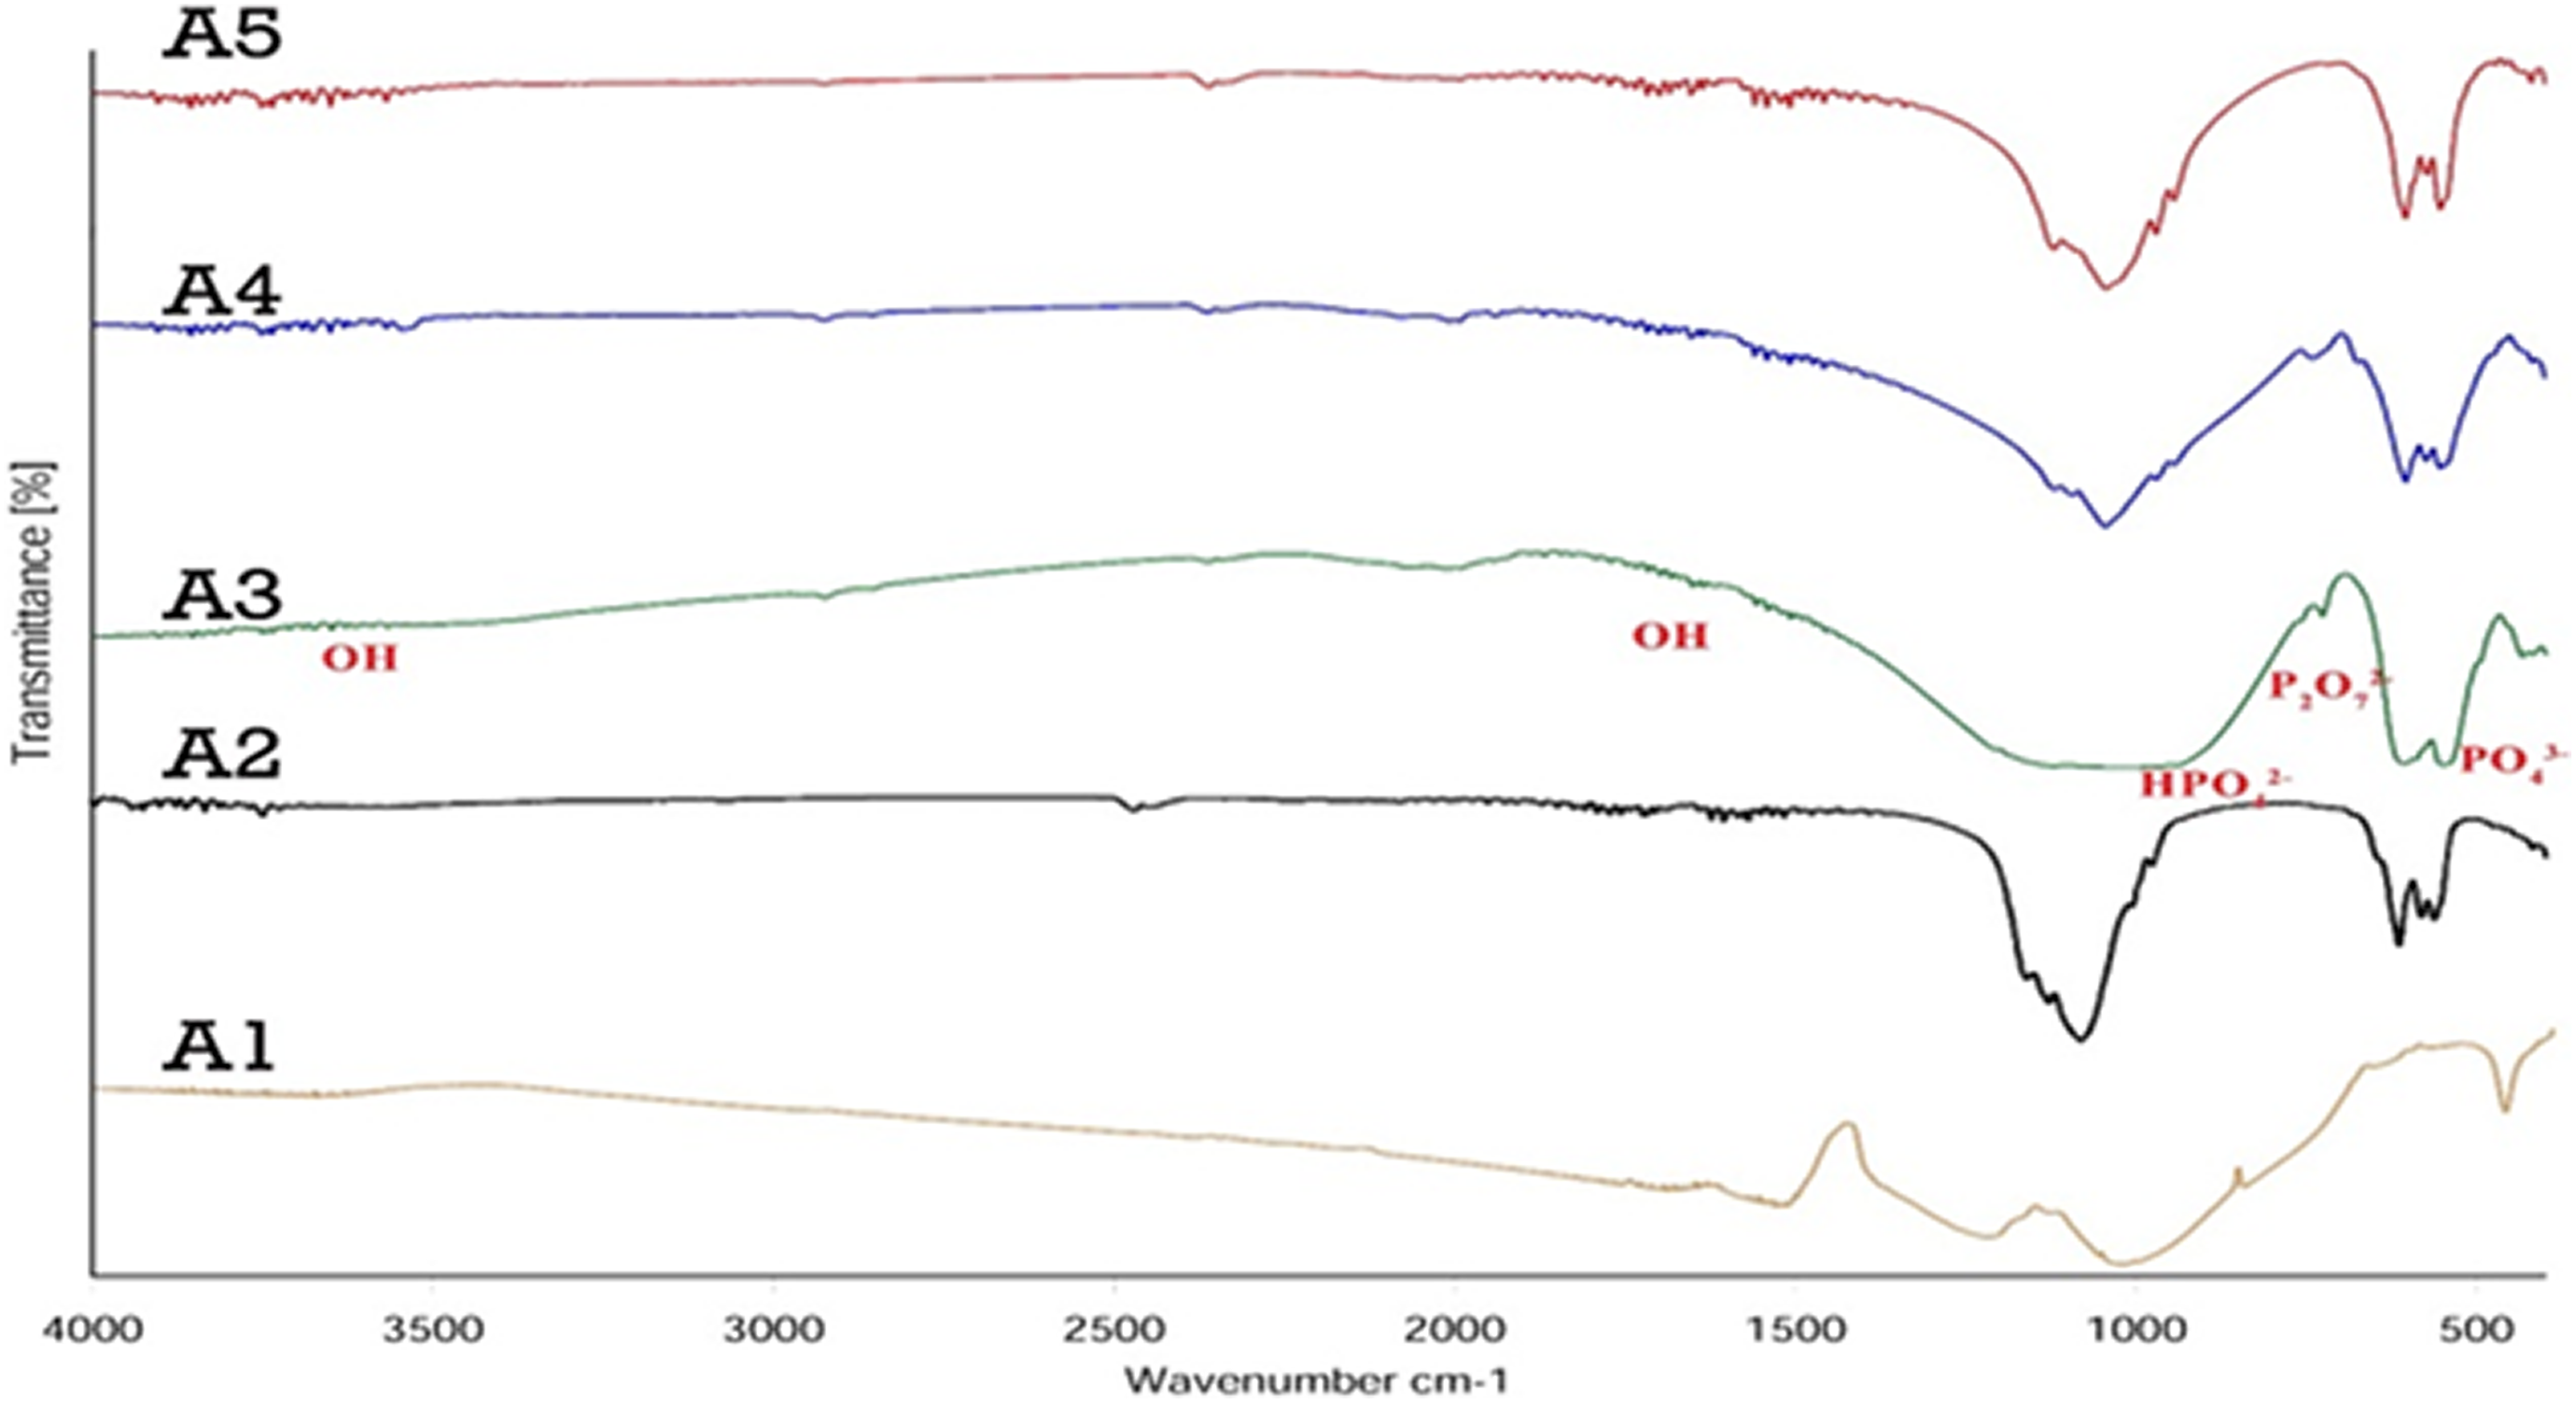
FTIR curves of β-TCP/HA nanocomposite with different Ca/P.
Peak observed at 1989 cm−1 and 2076 cm−1 could be attributed to HPO4 −2 groups. 36 –38
In addition, by comparing the graphs, it can be seen that the intensity and sharpness of the peaks were reduced by the formation of β-TCP and HA nanocomposites, and the peaks were broadened, while in the pure specimens, the peaks were thinner and sharper. These results indicated the formation of β-TCP and HA phases in A2 and A3 samples, which are consistent with XRD results, and absorption bands in the A4 and A5 samples represent HA formation, which are consistent with XRD results.
With this description, the sample A3 was chosen as the optimal sample due to the ratio of Ca/P and the presence of both HA phases (56%) and β-TCP (44%).
However, the intensity of absorption for the peak at 3567 cm−1 assigned to the OH− group decreased with decreasing input Ca/P molar ratio. This progressive reduction of the hydroxyl group could be attributed to transition from HA to β-TCP when decreasing the input Ca/P molar ratio. 1,39,40 FTIR analysis of β-TCP/HA nanocomposite with different pHs was shown in Figure 7.
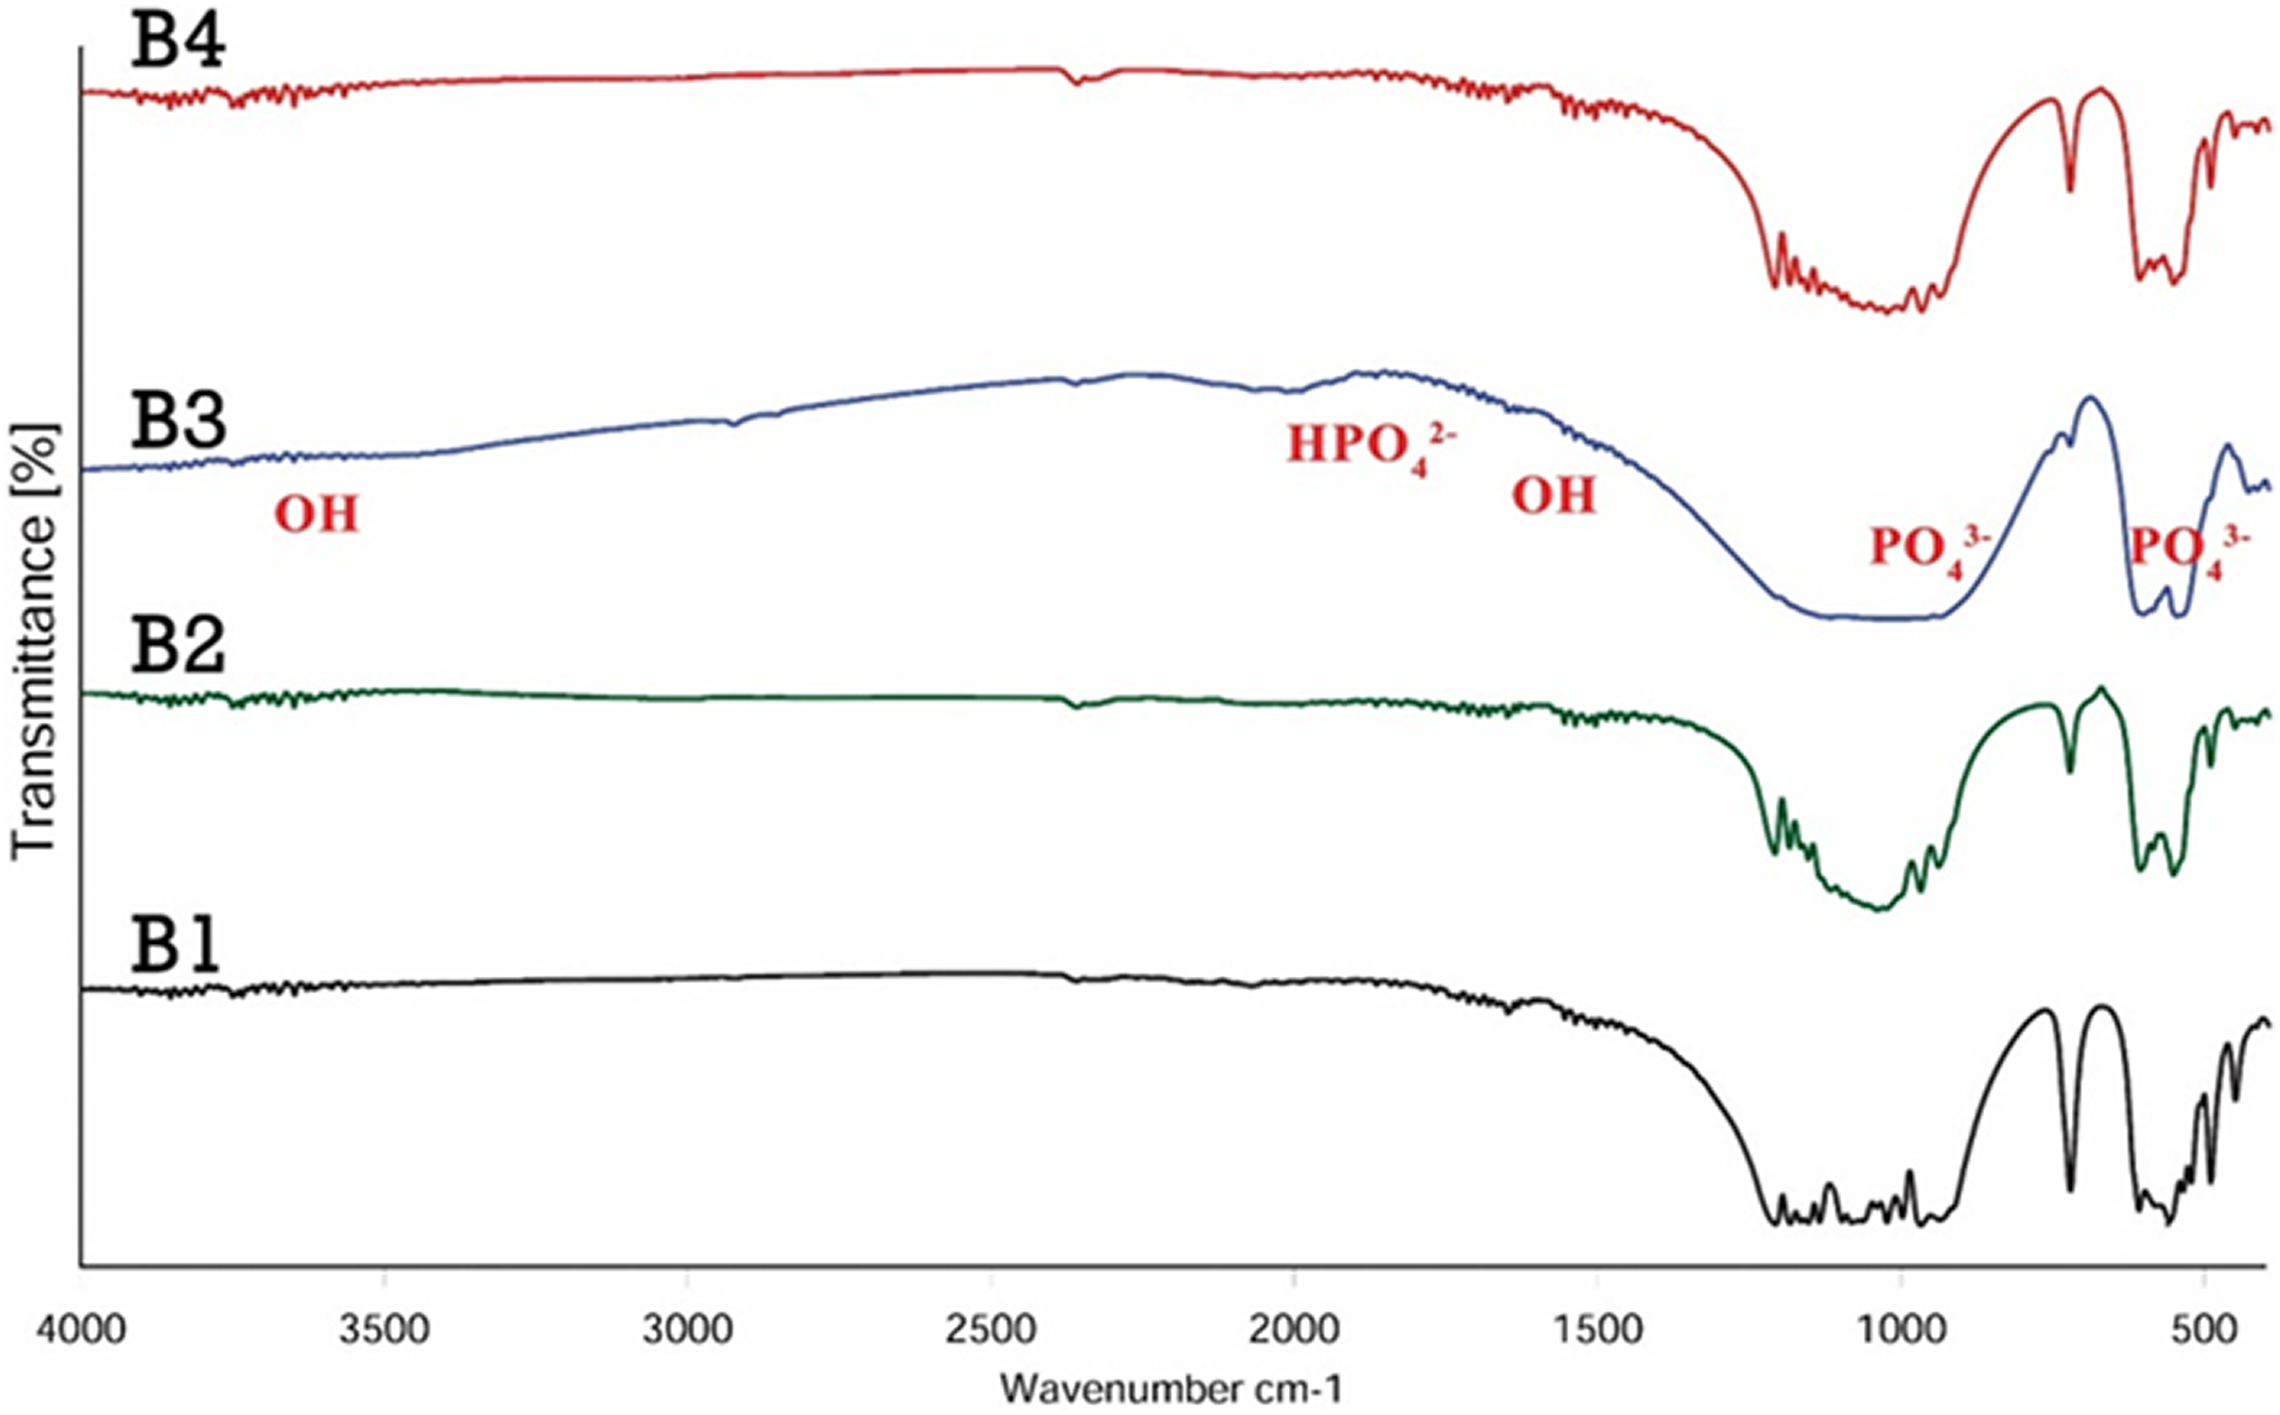
FTIR curves of β-TCP/HA nanocomposite with different pHs.
Absorption bands in the approximate regions of 570 cm−1 and 1600 cm−1 were related to the bending group movements of the hydroxyapatite crystalline network. 41,42
Peaks at wavelengths of 630 cm−1 and 3576 cm−1 represented the stretching variation of hydroxyl ions in a crystalline hydroxyapatite network. 1,43
The peaks at 962 cm−1, 1043 cm−1, and 1088 cm−1 represented the stretching variation of the phosphate group in a crystalline hydroxyapatite network. 44 The bands appearing at approximately 1650 cm−1 and 3620 cm−1 were related to the vibrational motion of the hydroxyl group of absorbed water. 45 Peak observed at 1989 cm−1 and 2076 cm−1 can be related to HPO4 2− groups. 46 Peaks at 1650 cm−1 related to the vibrational movements of the absorbed hydroxyl group, the intensity of which was reduced by increasing the pH, indicating that water exits from the powder structure. This indicated the formation of β-TCP to HA, which is consistent with the XRD results, and the sample with pH = 10, the best pH for the formation of β-TCP/HA composite is considered.
The FTIR spectra of β-TCP/HA nanocomposite with different stirring times are also illustrated in Figure 8. Absorption bands in the approximate regions of 570 cm−1 and 1600 cm−1 were related to the bending mode of the hydroxyapatite crystalline network. Peaks at wavelengths of 630 cm−1 and 3620 cm−1 represented the stretching mode of hydroxyl ions in a crystalline hydroxyapatite network. 44,47,48 The peaks at 962 cm−1, 1043 cm−1, and 1088 cm−1 represented the stretching mode of the phosphate group in a crystalline hydroxyapatite network. 11,49,50
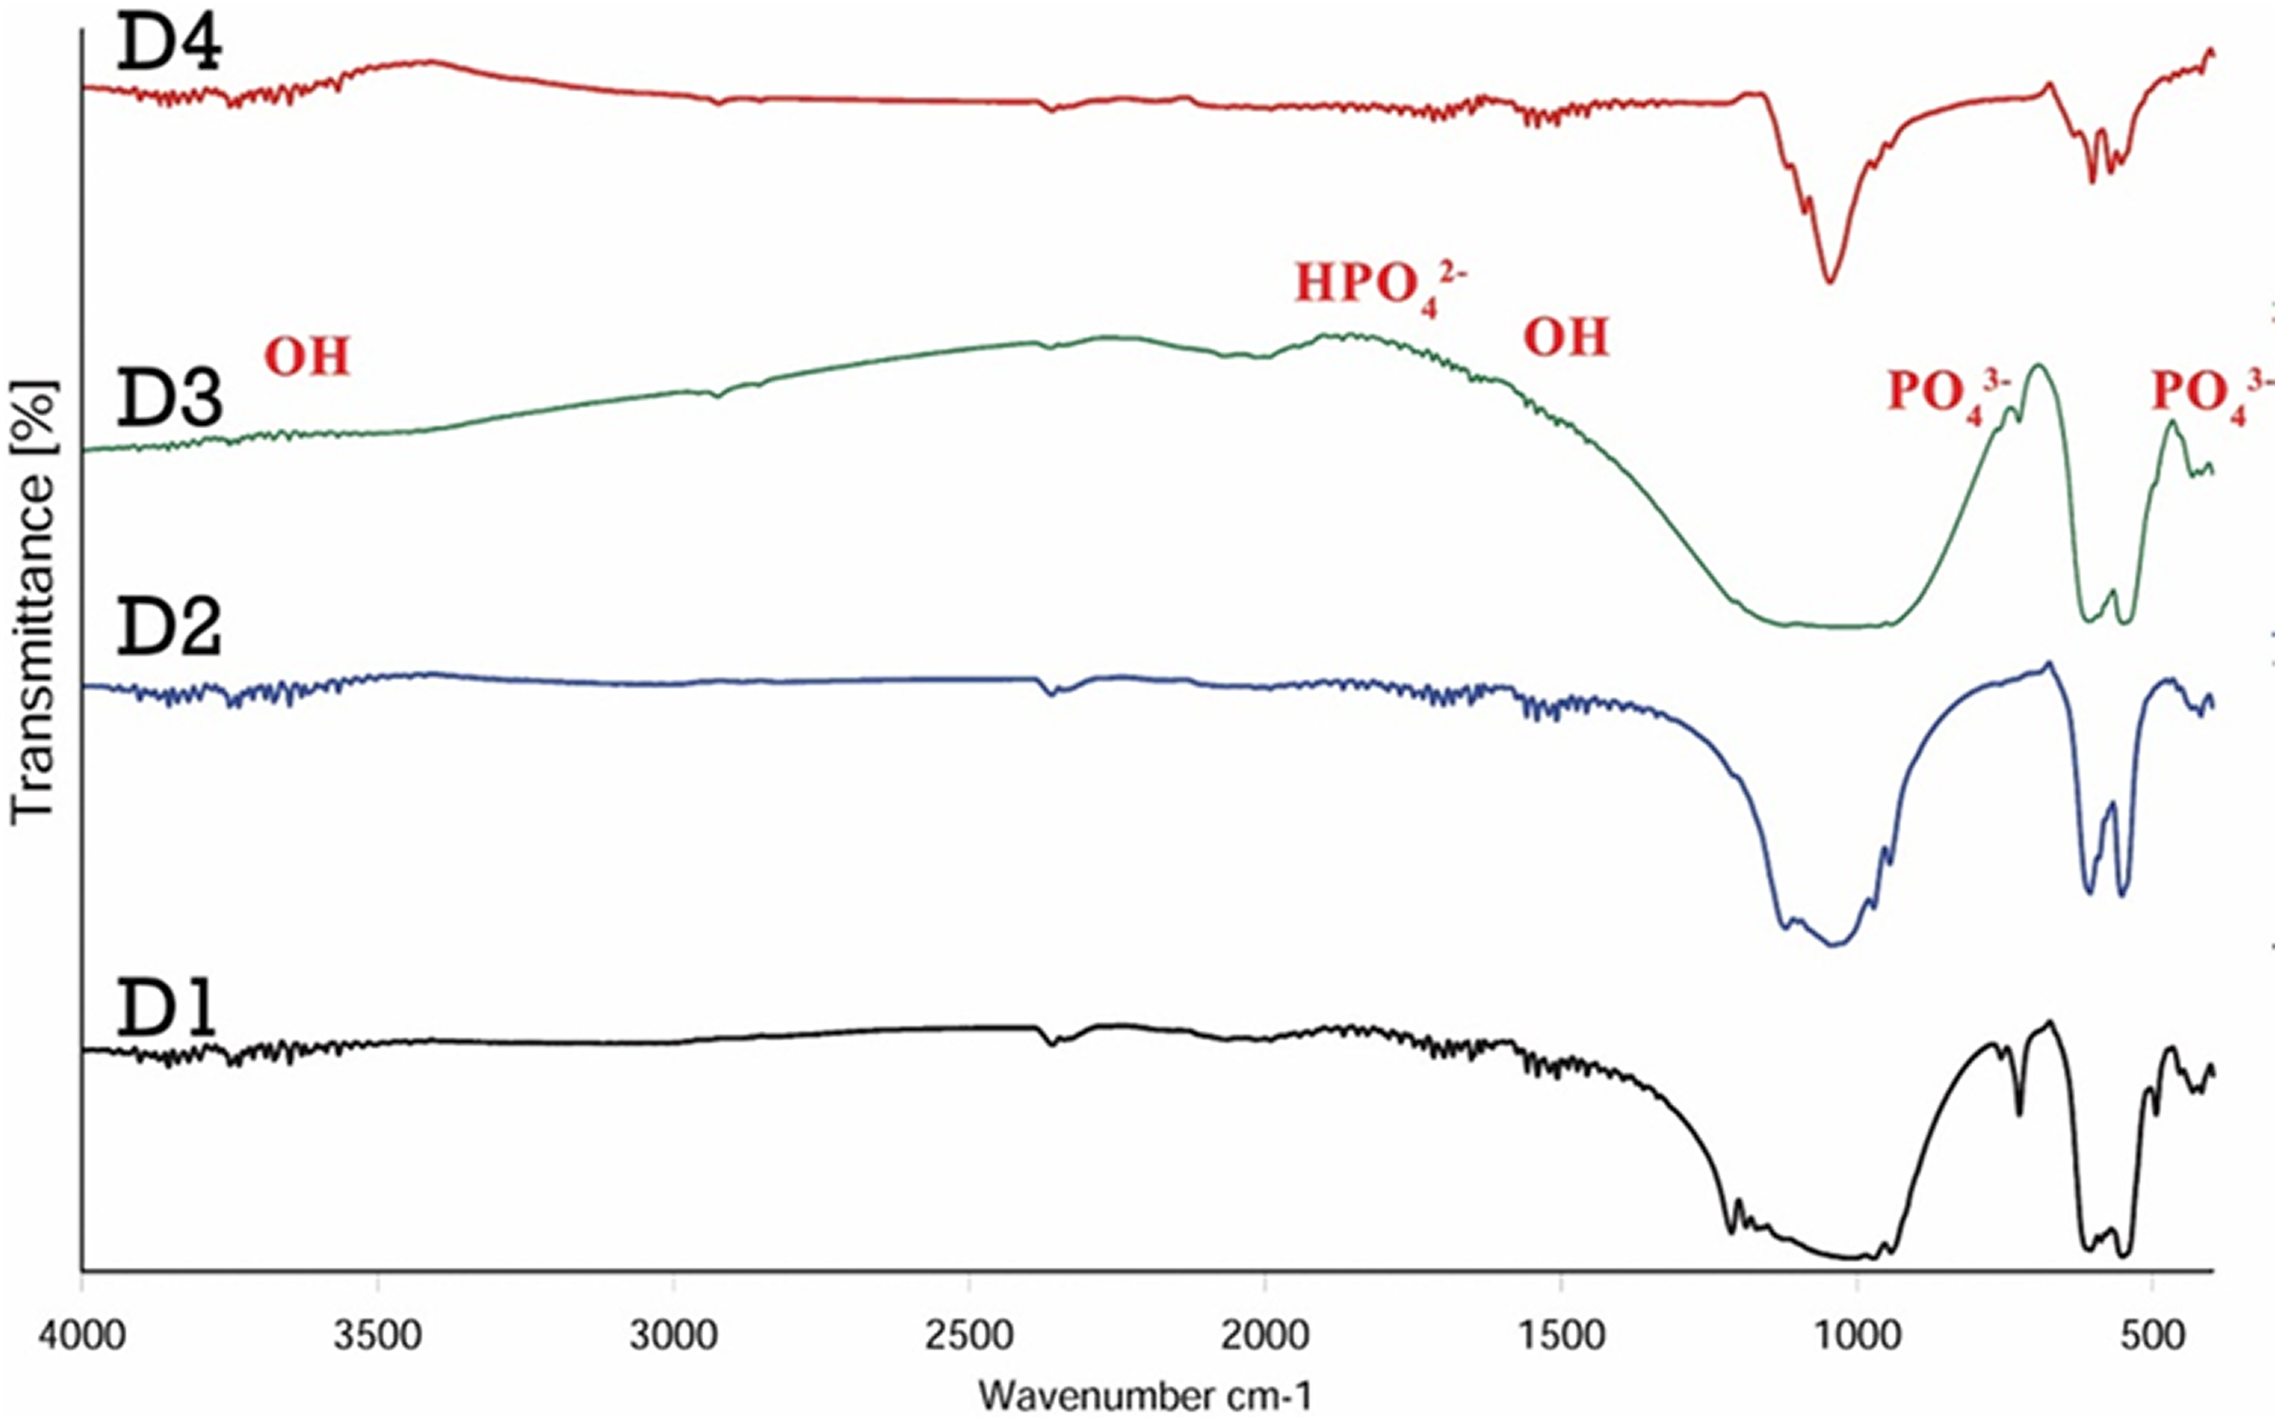
FTIR curves of β-TCP/HA nanocomposite with different stirring time.
The bands appearing at approximately 1650 cm−1 and 3620 cm−1 were related to the vibrational motion of the hydroxyl group of absorbed water, but by increasing the stirring time, the intensities of peaks at 1650 cm−1 and 3620 cm−1 decreased indicating that the water exits from the powder structure. 51
Figure 9 shows the FTIR spectra of the β-TCP/HA composite with different surfactants.
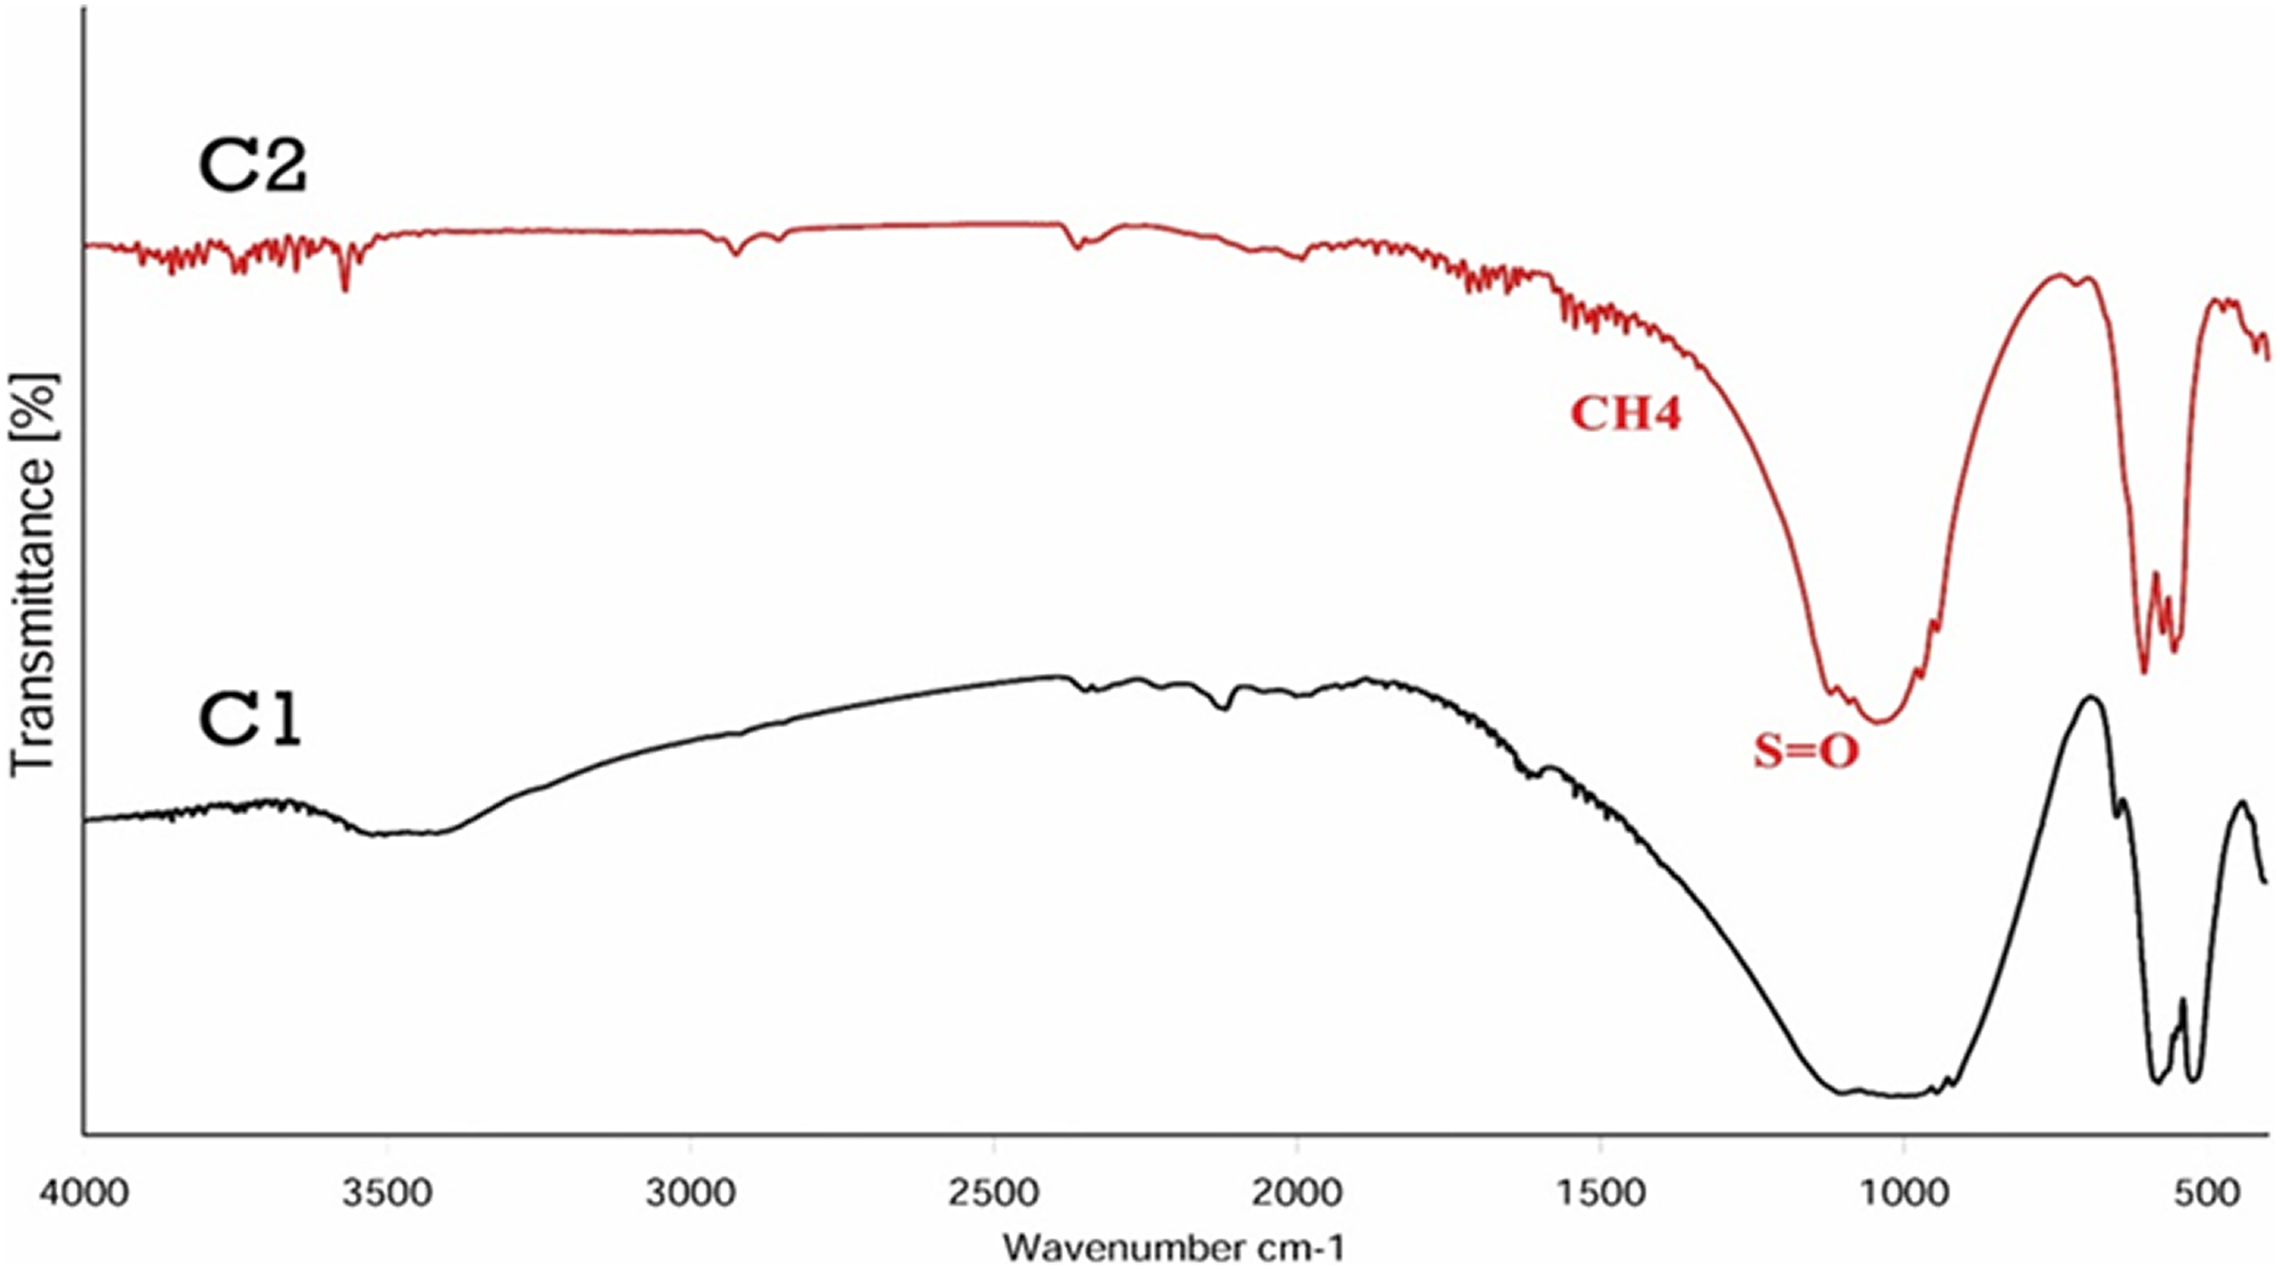
FTIR curves of β-TCP/HA nanocomposite with different surfactants.
Comparison between these two examples did not show a significant difference between them, this indicated that the dispersion has no effect on the structure of the final product. The only significant change in the wavelength was the 1650 cm−1 range, with the intensity of the spectrum increased in this area. This seems to be due to the overlapping of carbonate groups with asymmetric bending vibration of the methyl group at 1469 cm−1. 52 FTIR also exhibited peaks in the 1200 cm−1 range, which expressed the stretching vibrational mode of the sulfonic acid groups (S=O) contained in the disperser. 41,44 FTIR spectrum of E1, E2, E3 samples are shown in Figure 10. The same as previous spectra, the absorbed peaks in the range of 3000 cm−1 and 3600 cm−1 were also evident due to the hydroxyl-stretching vibration (O–H). 1,23 The absorption peaks provided at 1200–1000 cm−1 were attributed to HPO4 −2 and the bands available in 860–800 relate to phosphate bands and P2O7 −2. 25
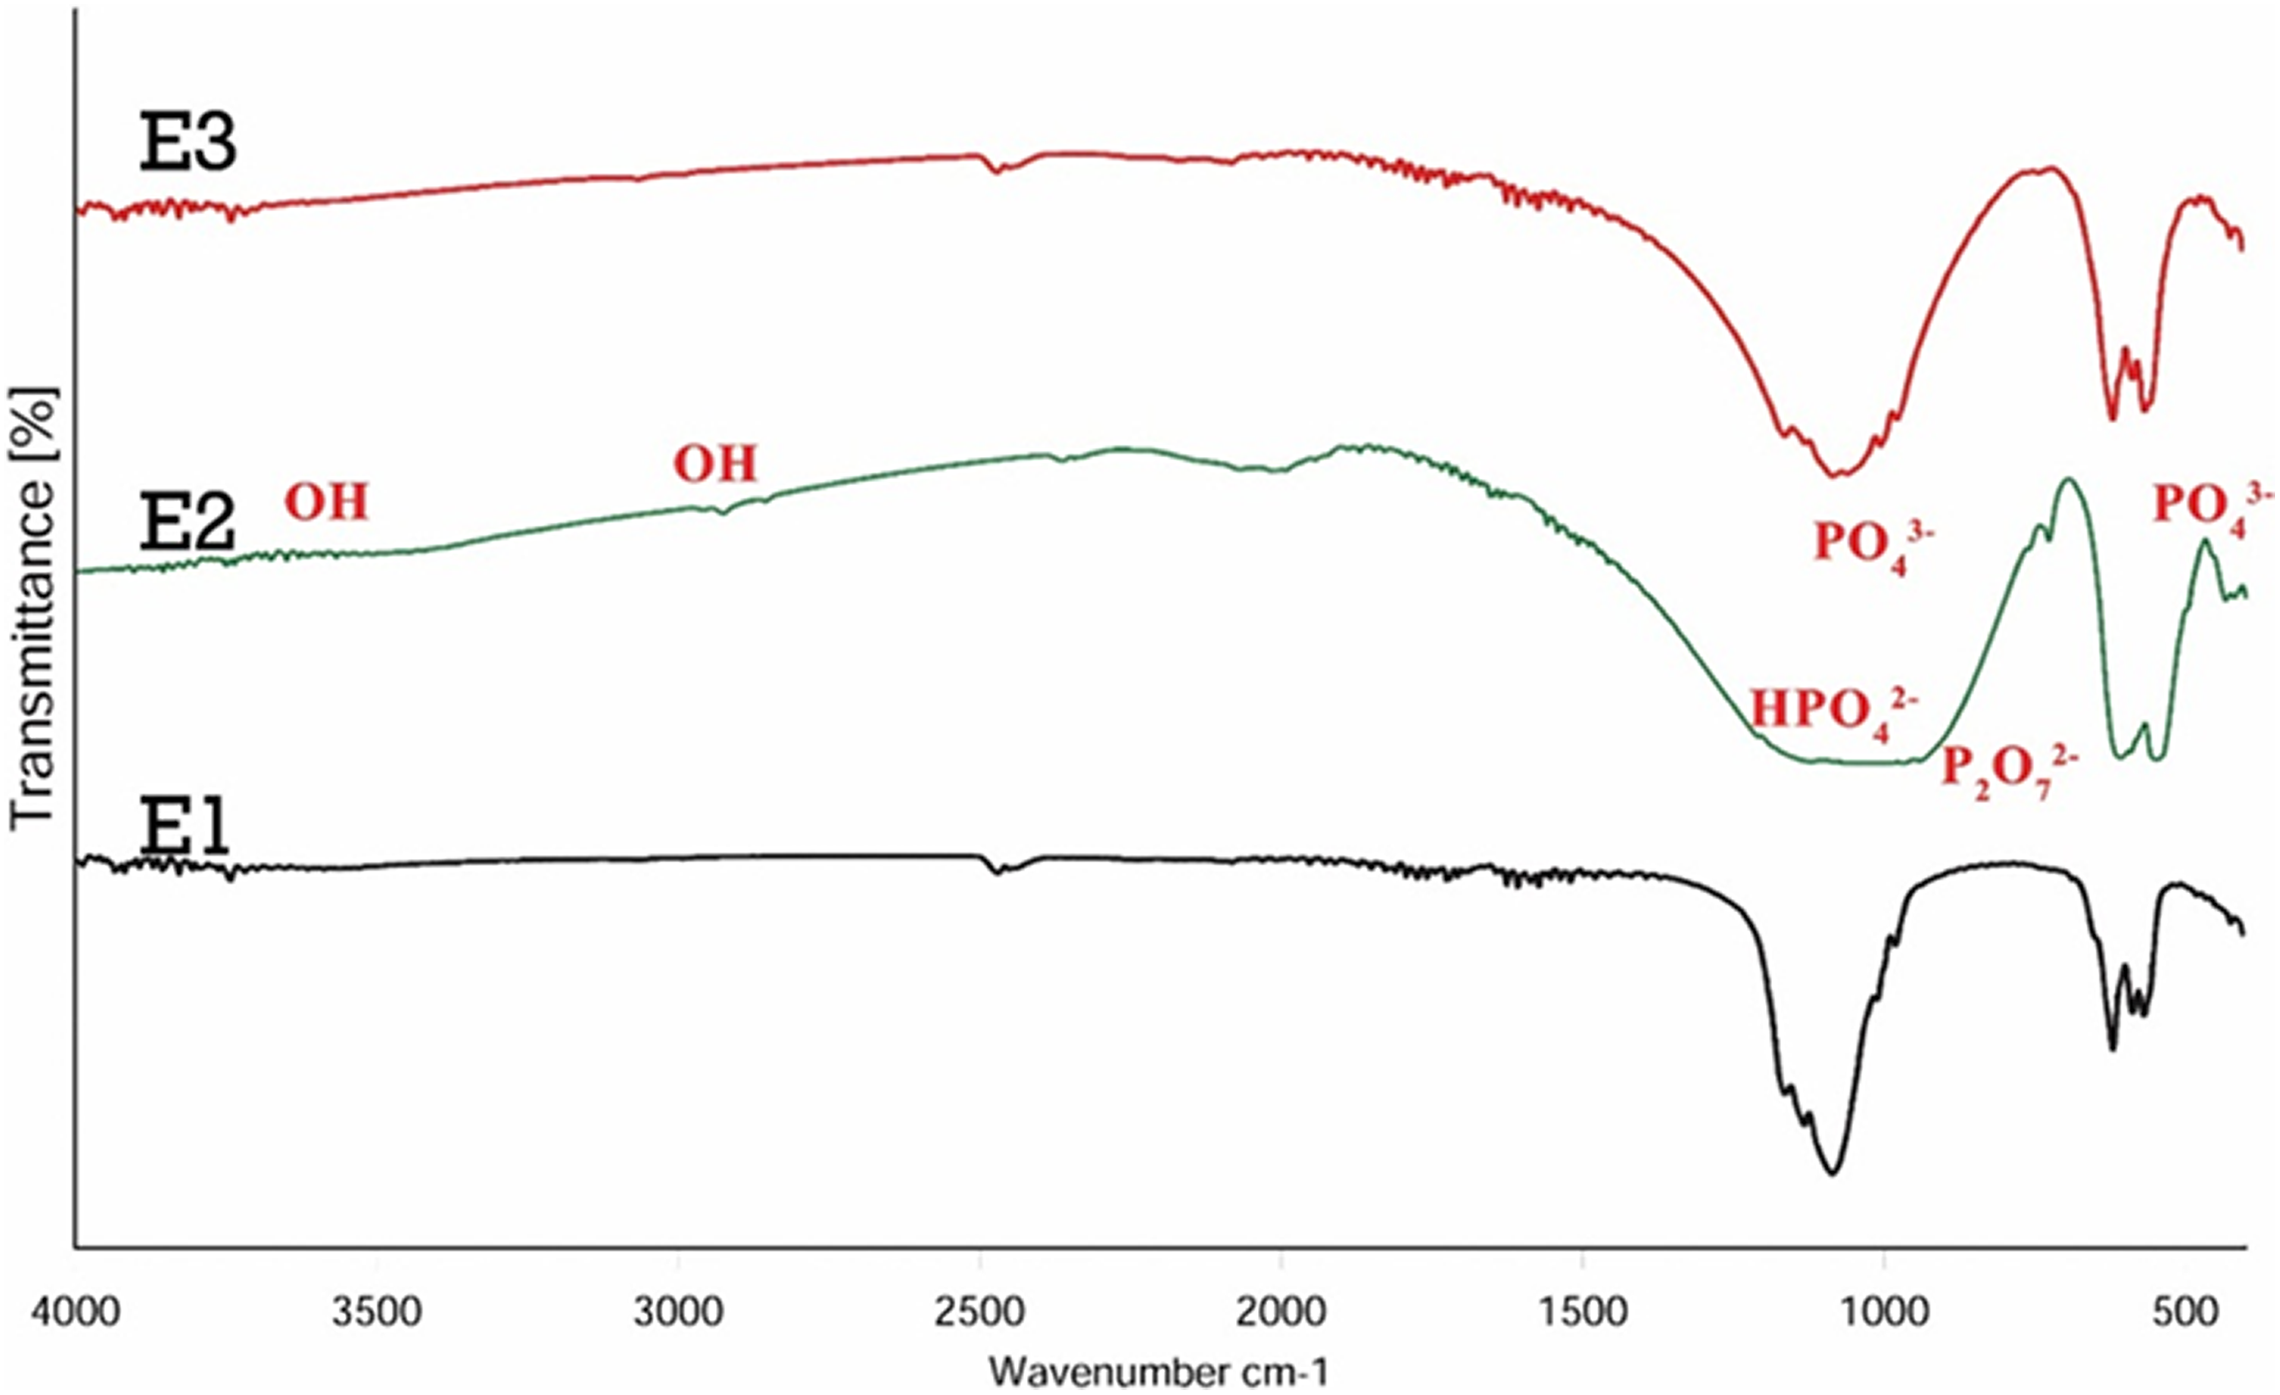
FTIR curves of β-TCP/HA nanocomposite with different temperatures.
Also, the bands formed in 600–480 cm−1 belonged to phosphate groups PO4 −3. 7,35,46 In general, the presence of stretching bands of 1120, 1100, 1006, and 945 cm−1 was related to PO4 groups of β-TCP. The bands appearing at approximately 1650 cm−1 and 3620 cm−1 were related to the vibrational motion of the hydroxyl group of absorbed water, but by increasing the temperatures, the intensities of peaks in 1650 cm−1 and 3620 cm−1 decreased, indicating that water exits from the powder structure. 18,26,32,48
Morphological properties of the β-TCP/HA nanocomposite
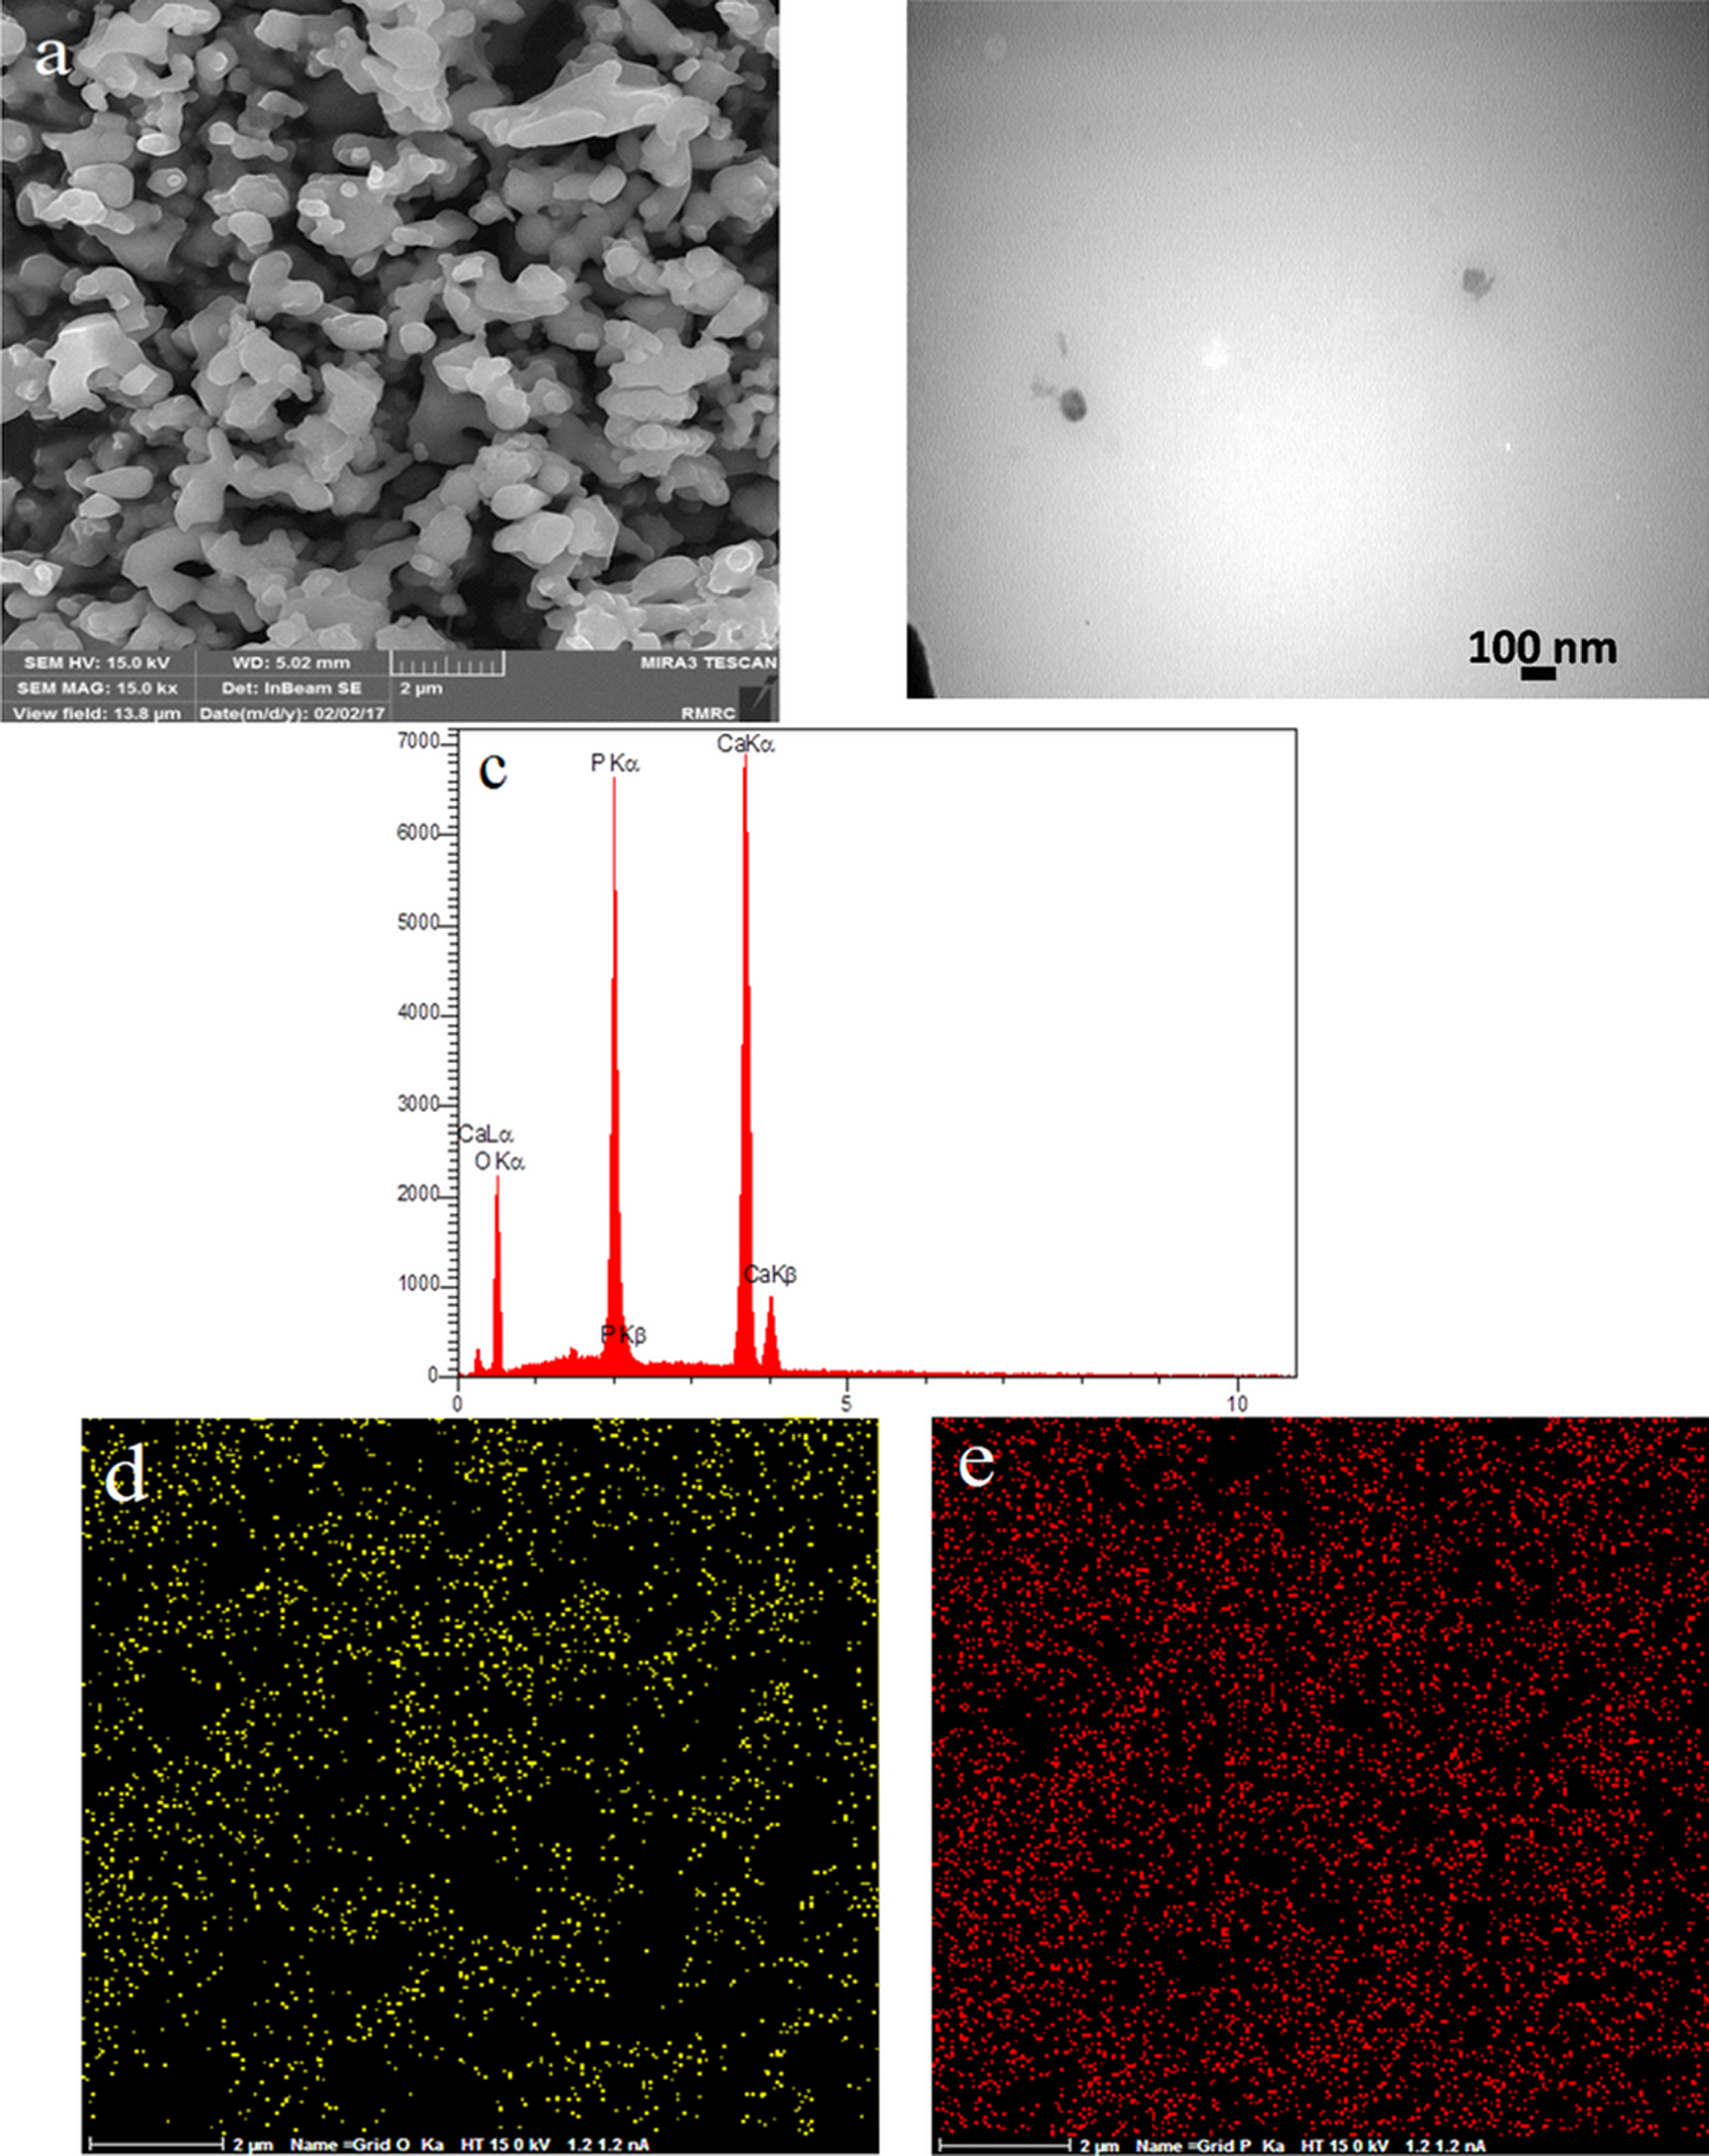
Figure 11(a) and (b) shows FESEM and TEM images of the β-TCP-HA nanocomposite with Ca/P = 1.61 and stirring time of 24 h at pH = 10 (Sample A3). As they were shown, there were a good dispersion and the particles had particle sizes about 50–60 nm with regular shape.
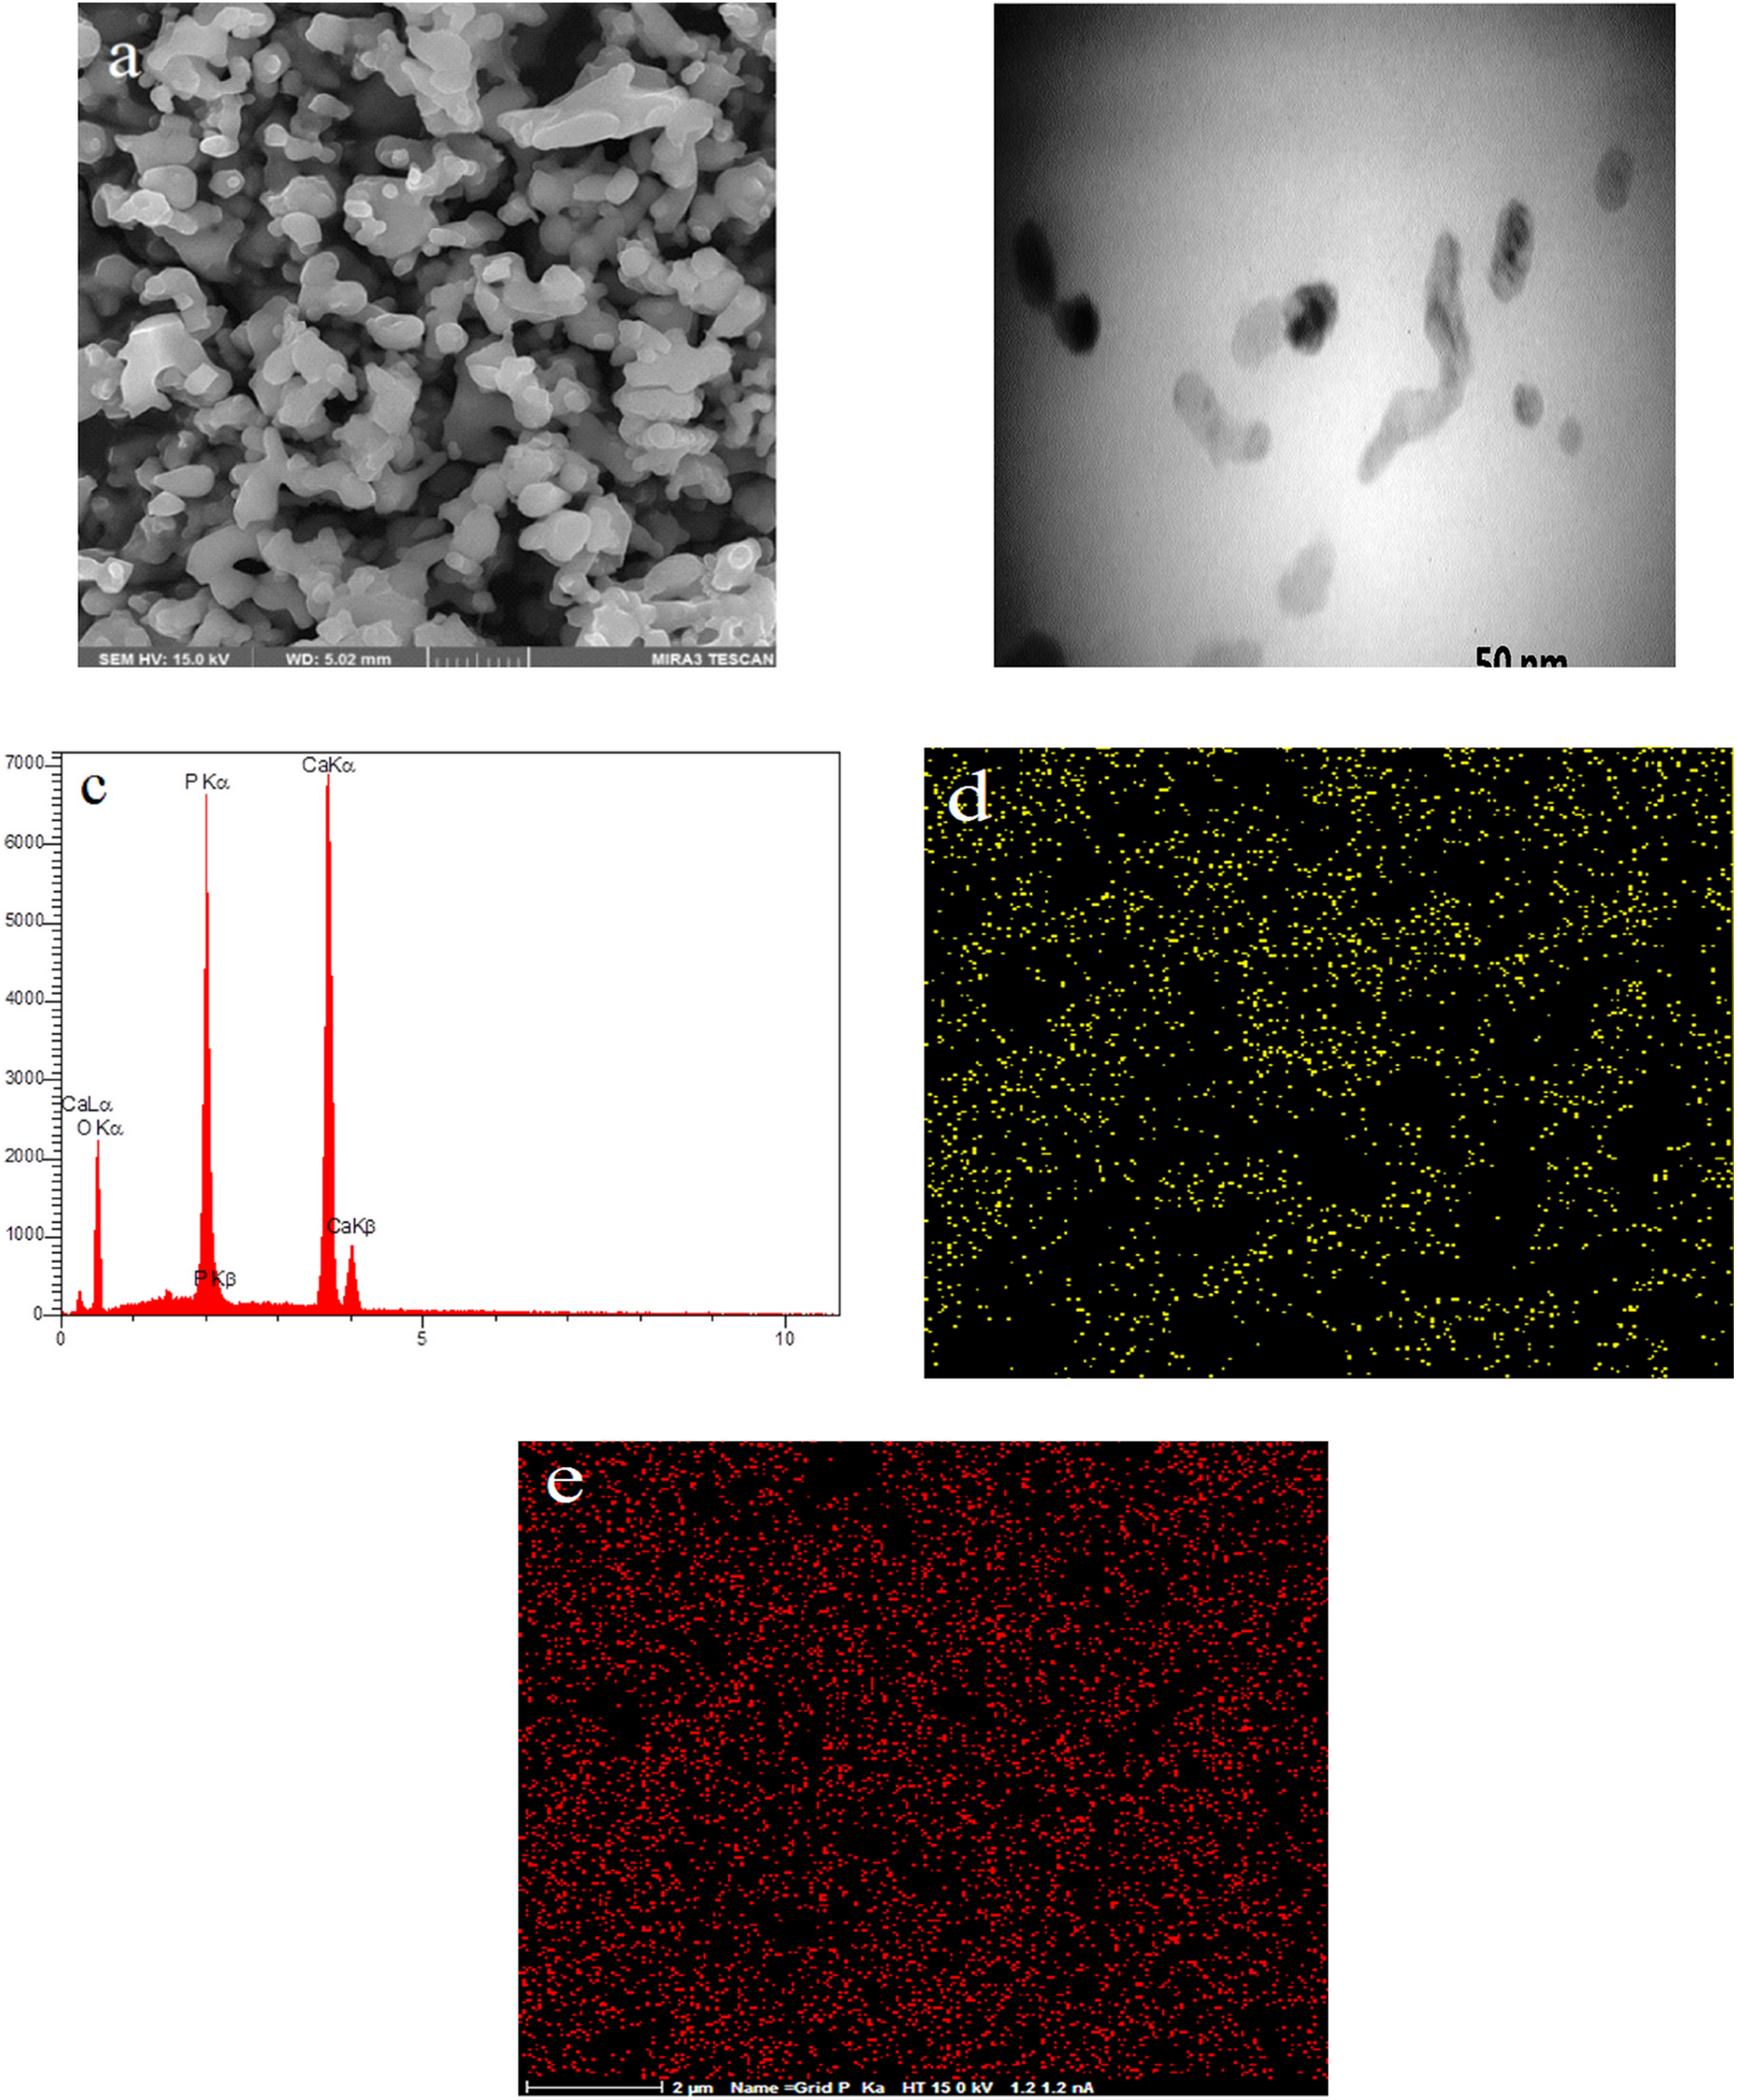
FESEM image of sample A3 (a), TEM image of sample A3 (b), EDS results of sample A3 (c), EDS map of sample A3 (d, e).
The EDS results (Figure 11(c)) indicated the presence of Ca/P elements, and the weight ratio of Ca/P was about 1.61, which was the ratio stoichiometry of β-TCP/HA structure.
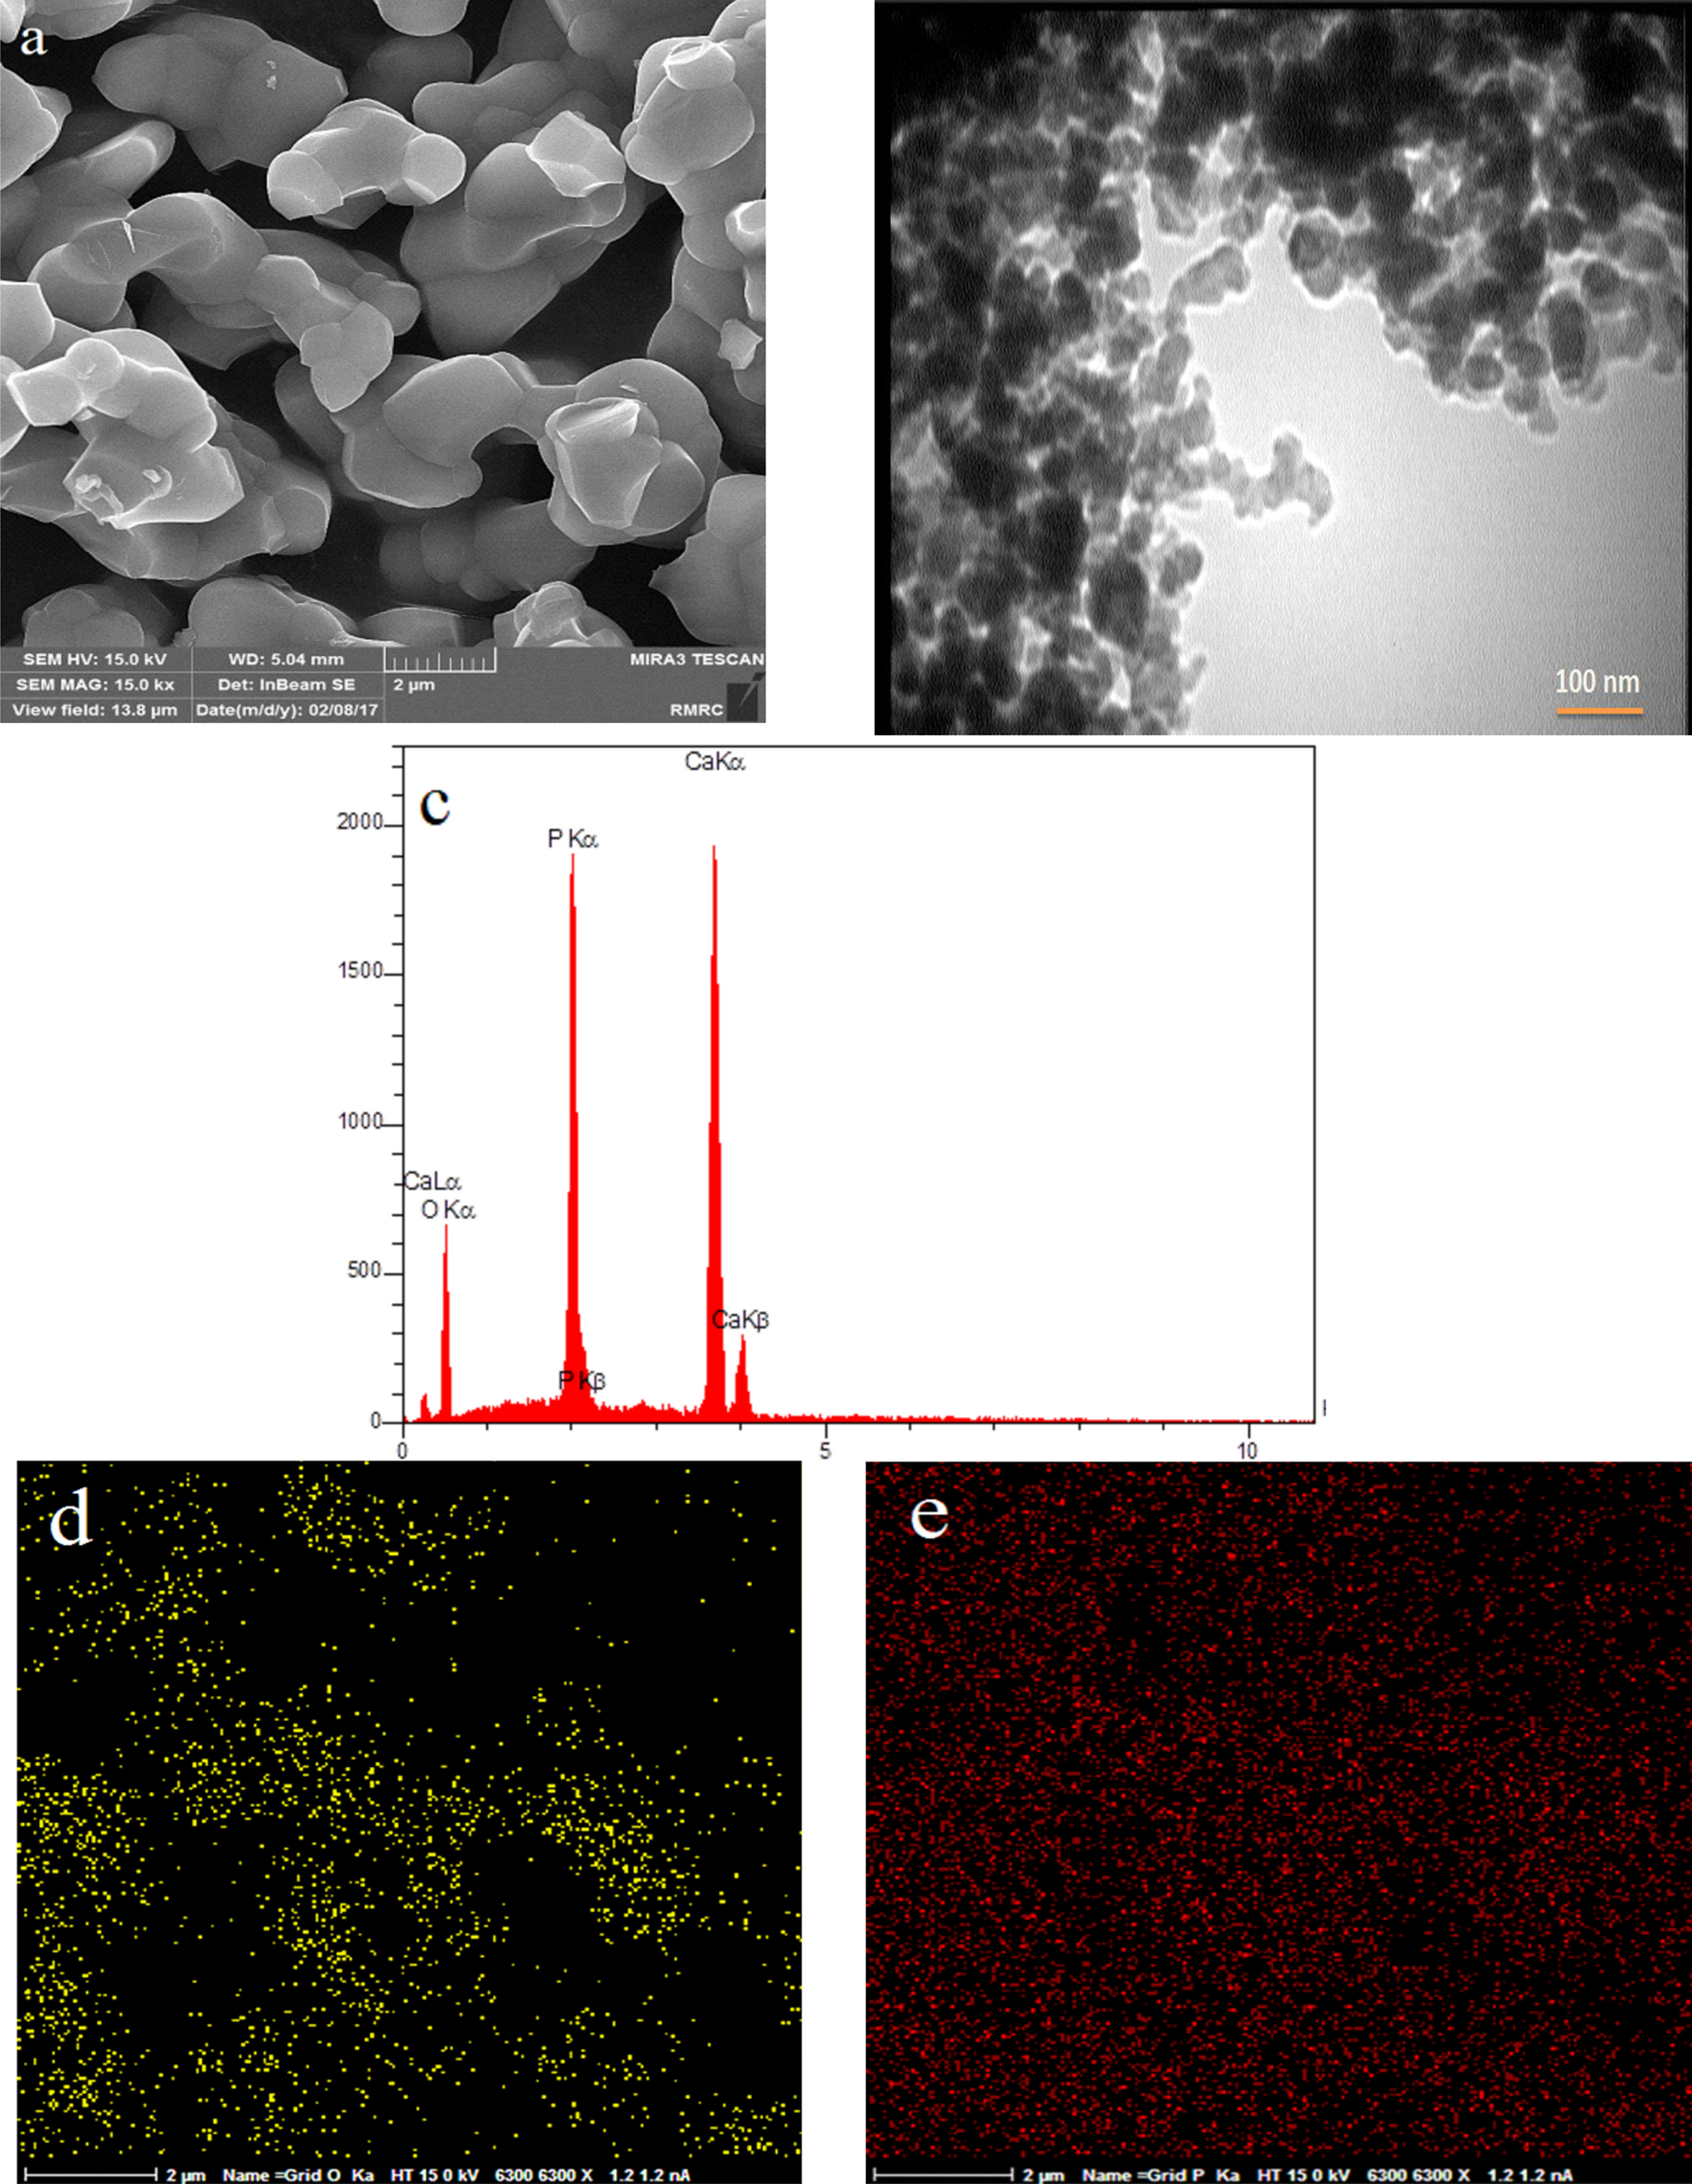
The results of EDS map (Figure 11(d) and (e)) established the uniform distribution of Ca/P of elements. Figure 12(a)and (b) shows FESEM and TEM images of the β-TCP-HA nanocomposite with Aliquad as a surfactant. Porous appearances of nanocomposite with some agglomerations were shown clearly. Synthesized powder with some agglomeration inhibited the grain growth of particles at high temperatures. Very fine-grained spherical particles could be seen on the surface particle system. The results of EDS (Figure 12(c)) indicated the presence of calcium, phosphorus, and aluminum elements. The results of EDS map (Figure 12 (e) and (d)) shows the uniform distribution of alumina in the composite field.
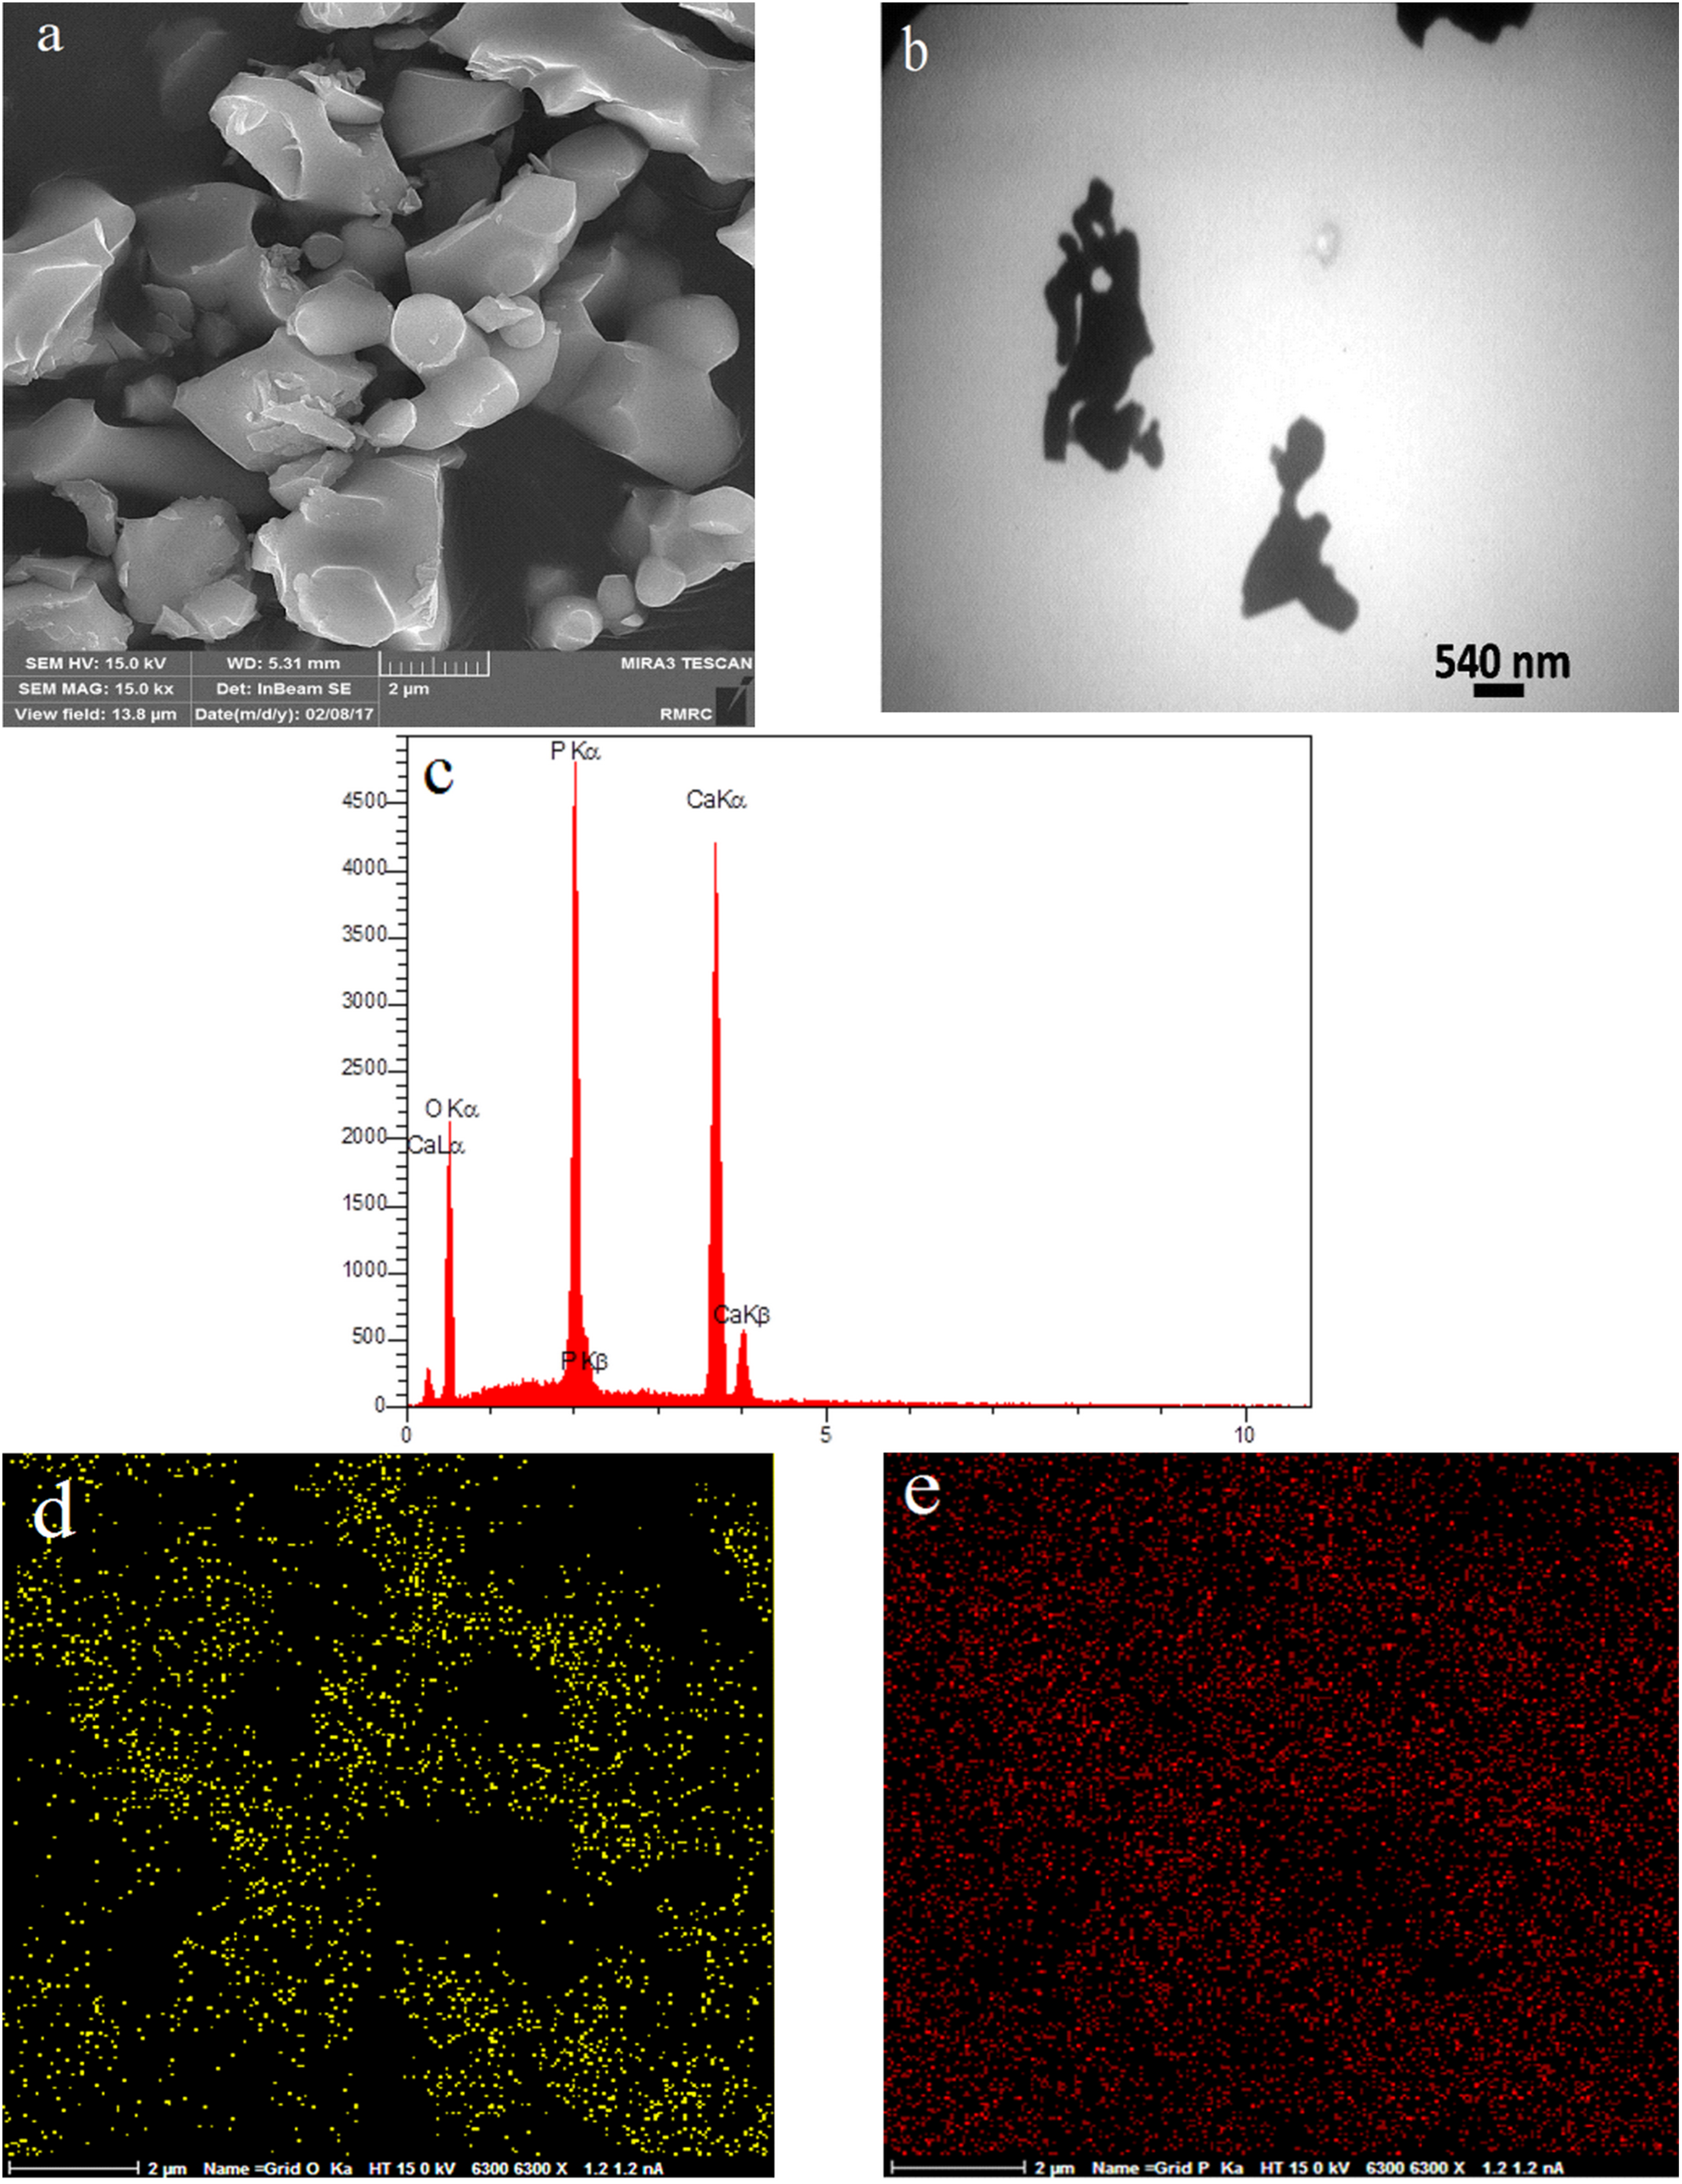
FESEM image of sample C1 (a), TEM image of sample C1 (b), EDS results of sample C1 (c), EDS map of sample C1 (d, e).
Figure 13 shows FESEM and TEM images of sample β-TCP/HA nanocomposite with SPAN 20 as a surfactant. It indicated that by adding surfactant, the dispersion of particles increased. Furthermore, the addition of SPAN 20 as a surfactant improved the dispersion and formed nanoparticles with the sizes in the range of 40–50 nm and regular geometric shape. The results of EDS map (Figure 13(d) and (e)) established the uniform distribution of calcium and phosphorus of elements.
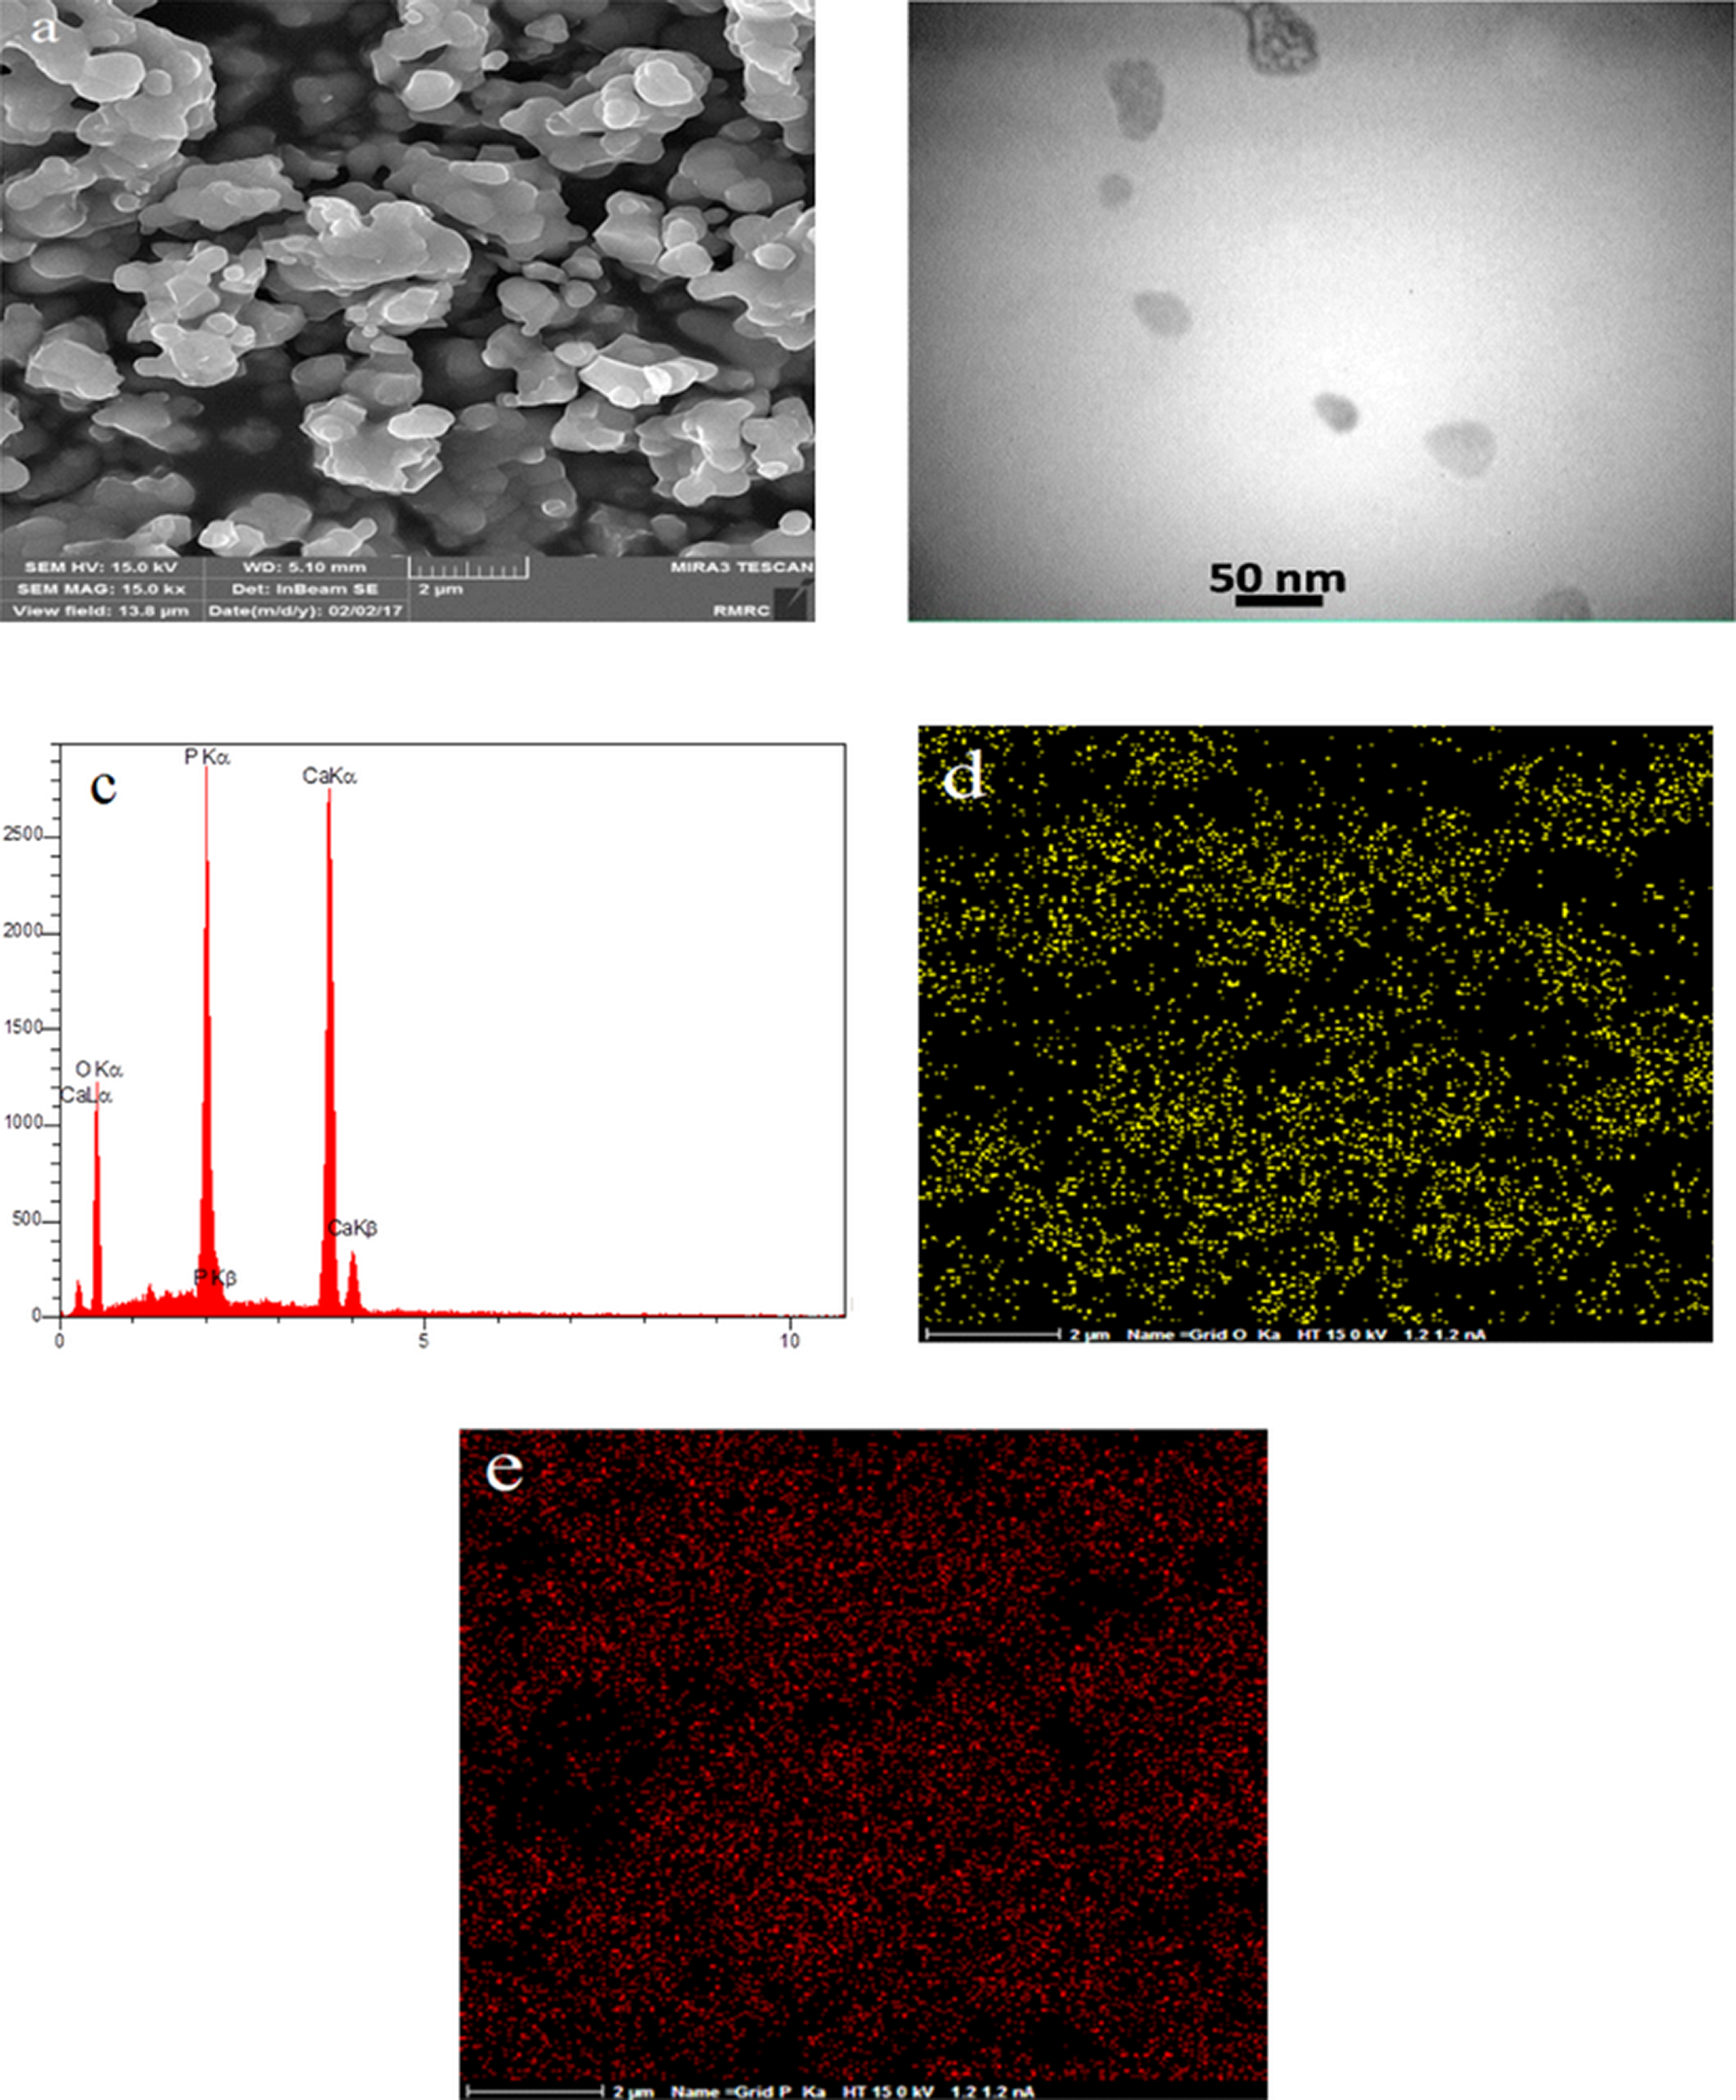
FESEM image of sample C2 (a), TEM image of sample C2 (b), EDS results of sample C2 (c), EDS map of sample C2 (d, e).
The FESEM and TEM micrographs of β-TCP/HA nanocomposite at different temperature are also shown in Figures 14 to 16.
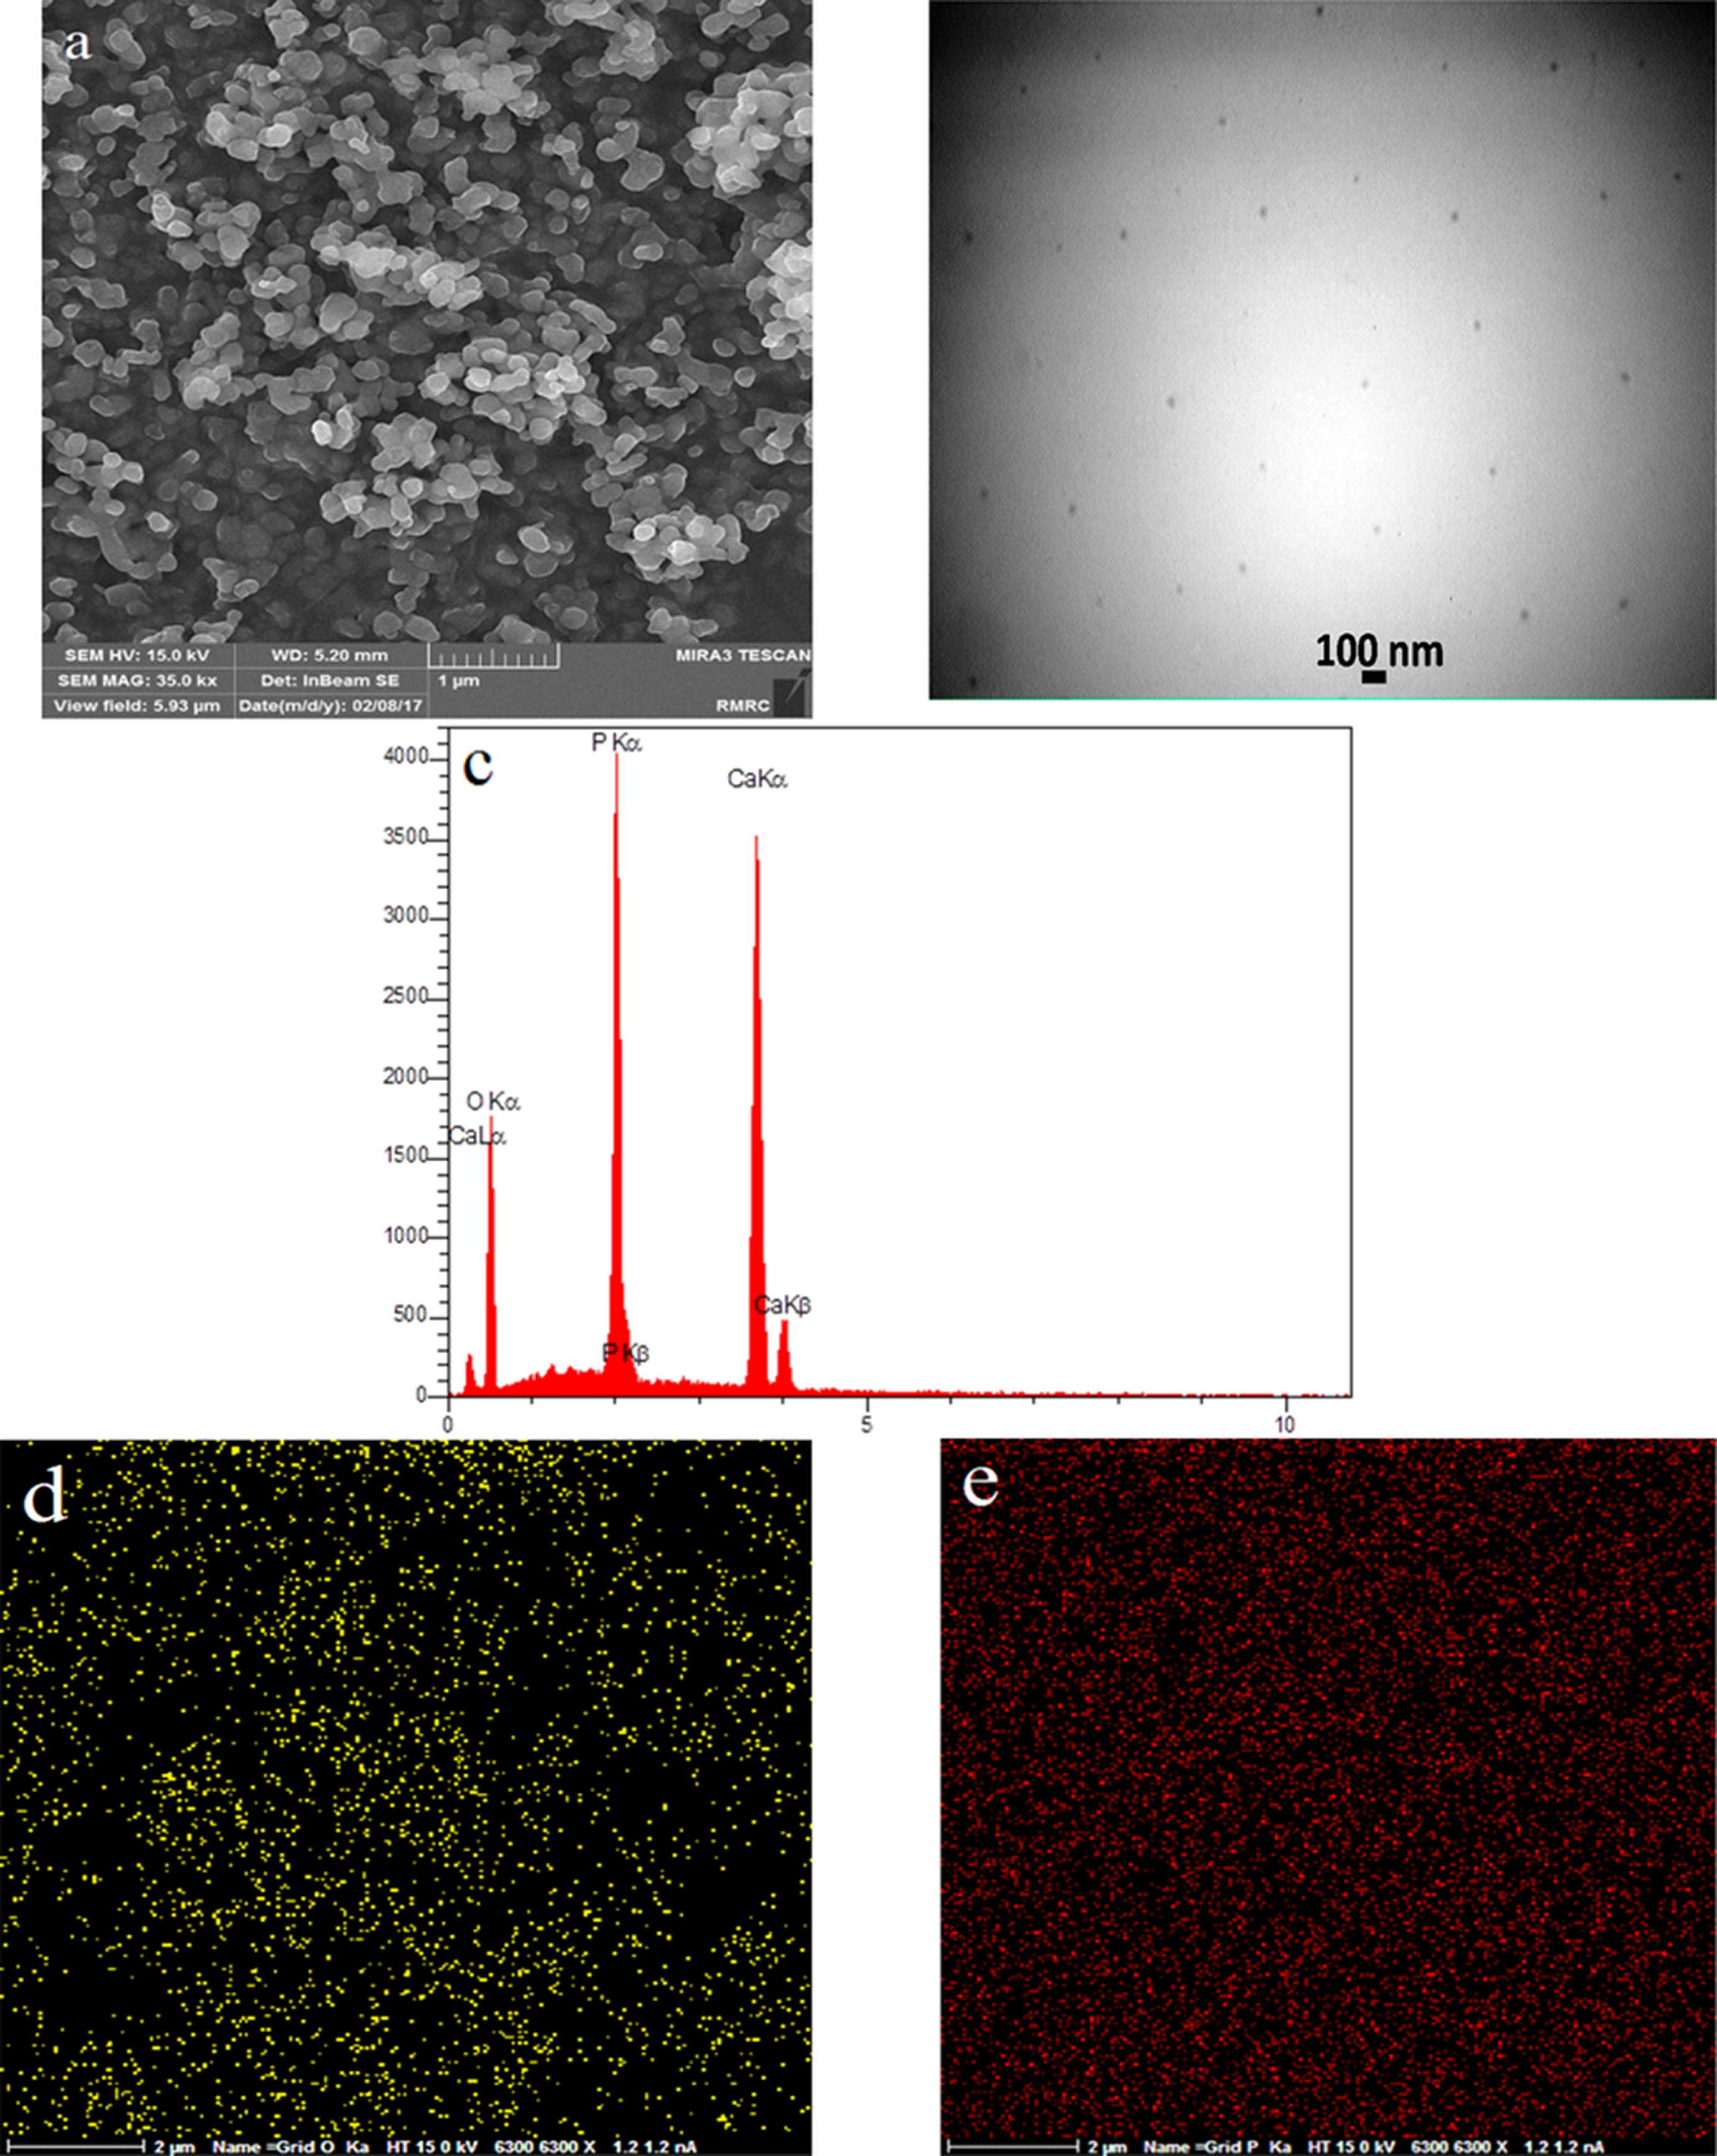
FESEM image of sample E1 (a), TEM image of sample E1 (b), EDS results of sample E1 (c), EDS map of sample E1 (d, e).
FESEM image of sample E2 (a), TEM image of sample E2 (b), EDS results of sample E2(c), EDS map of sample E2 (d, e).
FESEM image of sample E3 (a), TEM image of sample E3 (b), EDS results of sample E3 (c), EDS map of sample E3 (d, e).
It shows that by increasing the temperature from 800°C to 1200°C, the size of particles increased from 30 nm to 120 nm with regular shape and good dispersion and without any agglomeration which might be due to acceleration of the crystal growth of nanocomposite at high calcination temperature.
The results of EDS (part (c)) of all in Figure 14 to 16 samples indicated the presence of calcium and phosphorus elements which confirmed the presence of calcium phosphate phase.
The results of EDS map (Figure 16 (d) and (e)) established the uniform distribution of calcium and phosphorus of elements.
Conclusion
The β-TCP/HA nanocomposite was prepared using chemical deposition method, and it was observed that changes in the concentration of calcium and phosphate salts showed that β-TCP/HA nanocomposites with a concentration of 0.3 molar calcium salt and 0.191 molar salt phosphate compared with other concentrations due to physical and chemical properties similar to mineral inorganic apatite in the body, and the optimal sample was detected. Synthesis of nanocomposite samples at different pH levels showed that, at pH = 10 and 24 h stirring time, it was possible to form β-TCP/HA nanocomposite with a Ca/P ratio close to the bone mineral part. Particle dispersion with the SPAN 20 as a surfactant was better than Aliquat, which reduced the agglomeration of particle sizes and allowed the formation of particle sizes about 40–50 nm. It was also evaluated for calcining and increasing the crystallinity and reducing the particle size of different temperatures of 800°C, 1100°C, and 1200°C. It was observed that the temperature of 1100°C was optimized for the formation of β-TCP/HA nanocomposite.