
Abstract
The objective of this study was to clarify the mechanical properties and the non-isothermal degradation kinetics of Polyamide 66 (PA 66)/glass fiber (GF) composites. The non-isothermal degradation behavior of the samples was studied by thermal gravimetric analysis under nitrogen purge. The perfect compatibility of GFs with polymer matrix in composites was studied by scanning electron microscopy. It was found that with increasing content of GFs in samples due to good distribution of fibers in PA 66, the degradation temperature and calculated activation energy in composites increased in all heating rates. The activation energy was calculated by the Flynn–Wall–Ozawa method (isoconversional method). It was concluded that the model-free methods can be a reliable way to determine the kinetic parameters. Furthermore, the isokinetic relationship was used to estimate a model-independent pre-exponential factor (lnA) corresponding to a given degree of conversion.
Keywords
Introduction
Polyamide 66 (PA 66) is an engineering thermoplastic which has been used for its desirable mechanical properties such as high strength, wear resistance, and self-lubrication in a wide range of engineering applications. Several techniques are used in the study of pyrolysis kinetics based on thermogravimetric (TG) analysis commonly. 1 –8 Isoconversional methods are reliable techniques which determine the activation energy at fixed conversions. 7 –9 Some different kinetics models have been used to estimate the kinetics parameters of different polymers and copolymers. 10 –13 In this work, PA 66 samples were compounded with glass fibers (GF) by an internal mixer to produce PA 66/GF composites. Following that, the activation energies of composites have been calculated using Flynn–Ozawa–Wall 14 –16 method. Furthermore, the isokinetic relationship (IKR) 9 was used to estimate a model-independent pre-exponential factor for each degree of conversion.
Theoretical background
The thermal degradation rate which is dependent on the time, temperature, and mass change of the sample is defined as

where α is the degree of conversion and commonly defined as

where E is the activation energy (J mol−1), A is the pre-exponential factor (s−1), and R is the gas constant (8.314 J mol−1 K−1). The kinetics analysis of non-isothermal data is generally performed by the following equation 14

where (β = dT/dt) is the constant heating rate.
Rearrangement of equation (3) gives the following relationship for non-isothermal degradation corresponding to the given conversion
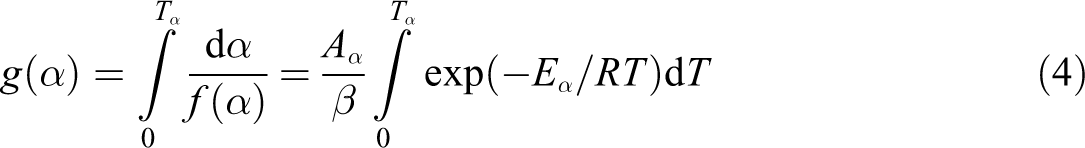
Isoconversional methods are reliable techniques which determine the activation energy at fixed conversions. 10 –16 Flynn–Wall–Ozawa method is an isoconversional method in which the activation energy is estimated without the knowledge of reaction model. The result of the integration is

This equation generates a straight line when

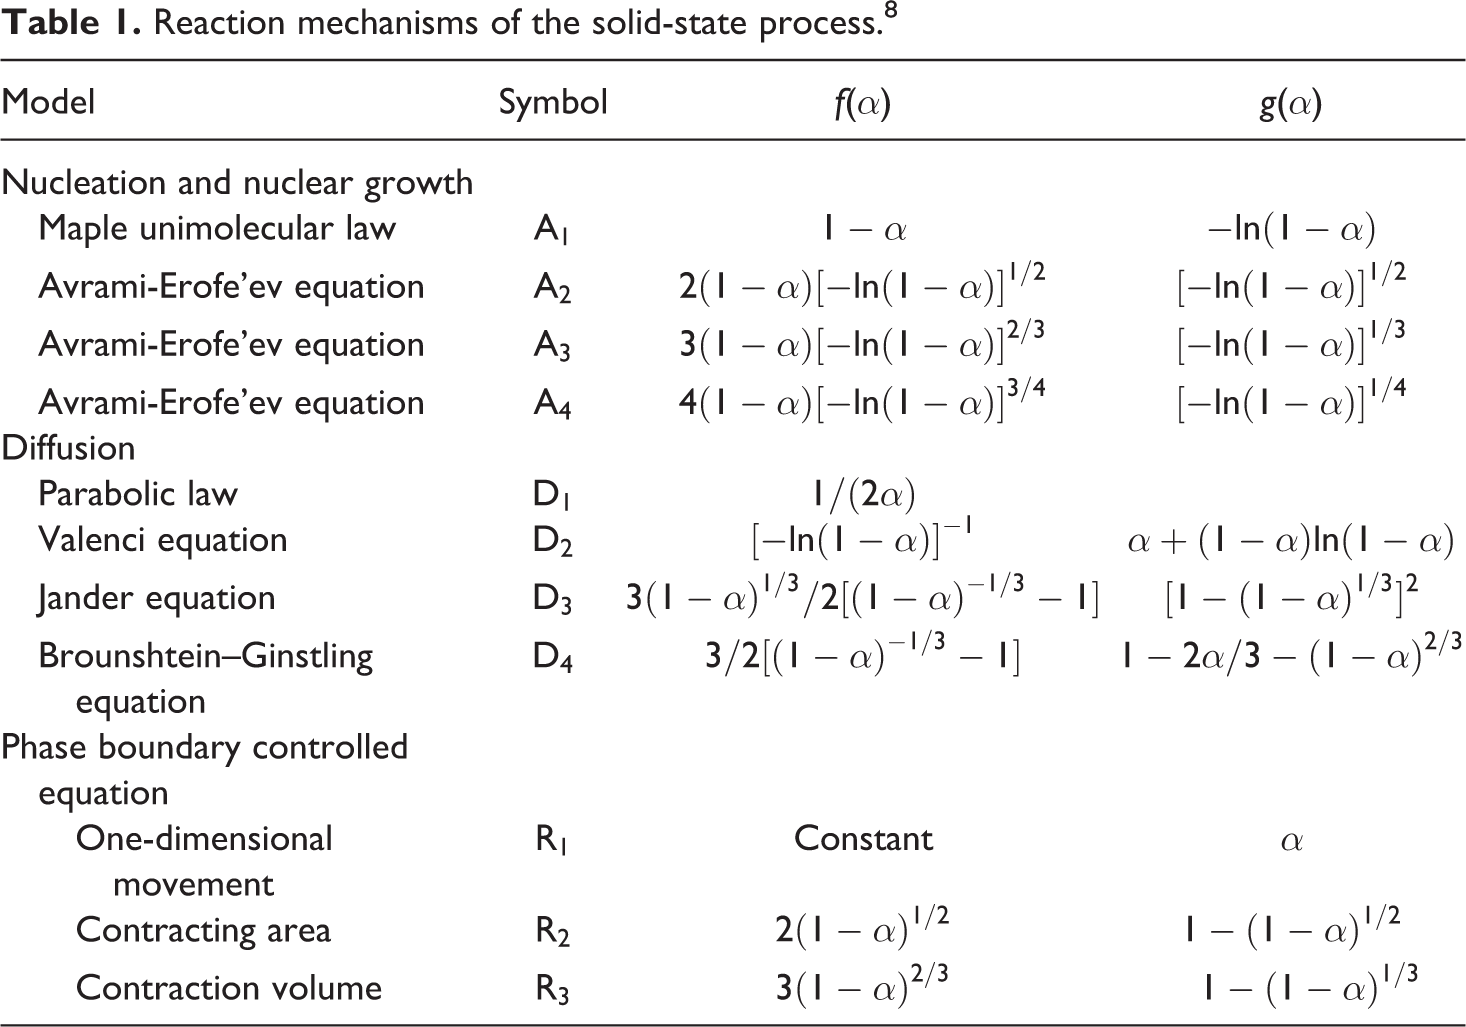
The linear plot of ln[g(α)/T 2 ] versus 1/T makes it possible to determine E and ln(A) from the slope and intercept of the graph, respectively. The pre-exponential factor can be determined by assuming different reaction models which are shown in Table 1.
Reaction mechanisms of the solid-state process. 8
A model-independent estimate of the pre-exponential factor can be obtained through the use of an artificial IKR, in which a common intersection point of Arrhenius lines is defined as T iso and k iso. These values are isokinetic temperature and rate constant, respectively, in which the relationship between these parameters is as follows

where the subscript ε refers to a factor that produces a change in Arrhenius parameters. In a general case, the actual value of lnAα can be determined by this method

where a = ln(k iso) and b = (RT iso)−1 are coordinates of the intersection point of Arrhenius lines. 10
Experimental
Materials
In this work, the laboratory grade PA 66 supplied by Tecomid® (Tehran, Iran) was used. The density and melting temperature of PA 66 are 1.14 g cm−3 and 265°C, respectively. PA 66 was dried at 80°C for 6 h prior to use to remove the possible moisture. The PA 66 granules along with two different GF contents (10 and 30) were melt-mixed in a Brabender (plastog_raph_n, Shimadzu, Japan) at a temperature in the range of 262–275°C for 10 min to achieve a reasonably uniform dispersion.
Thermal gravimetric analysis
Thermal gravimetric analyses (TGA) were carried out for PA 66 and PA 66/GF samples by a Shimadzu–DTG-60H TGA instrument. For thermal degradation experiments, 5 mg of the particles was placed in an aluminum crucible and heated from room temperature to about 600°C under nitrogen purge at different heating rates of 5, 10, 20, and 30°C min−1 and the weight loss versus temperature was recorded.
Scanning electron microscopy (SEM) was used to study the morphology of composites. All the samples were coated with a thin layer of gold before SEM examination.
Results and discussion
The weight loss versus temperature curves of dynamic thermal degradation of PA 66, PA 66/GF (10%), and PA 66/GF (30%) were obtained at different heating rates. For comparison, the thermal degradation behavior of samples is shown in Figure 1 at a heating rate of 10°C min−1. It is clear that with increasing content of GF in the copolymer, the degradation temperature increased.
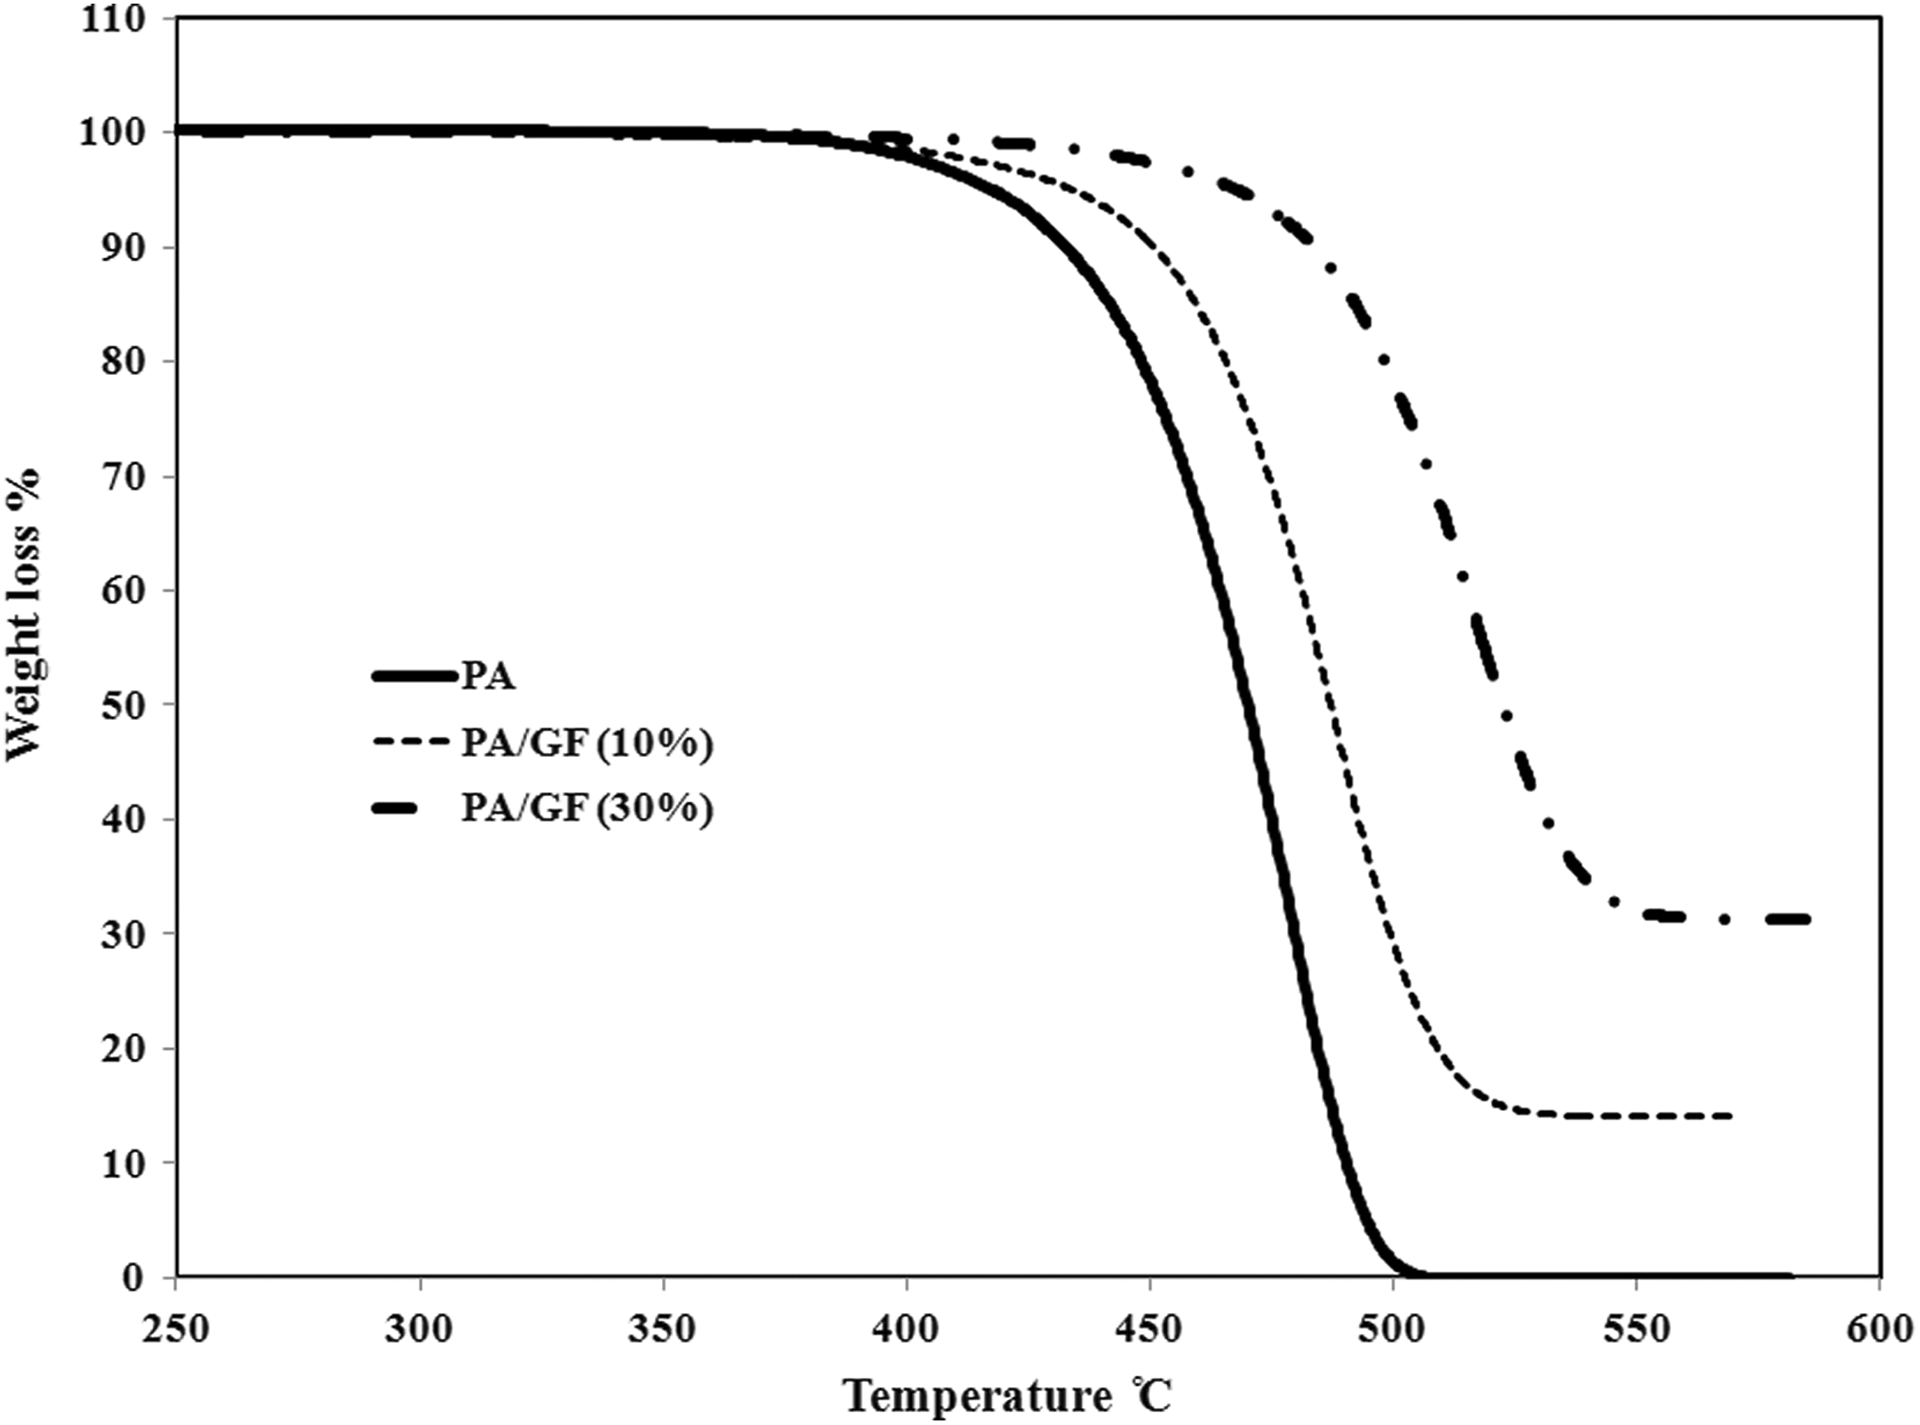
Comparison of weight loss versus temperature at β = 10°C min−1 for PA 66, PA 66/GF (10%), and PA 66/GF (30%). PA 66: Polyamide 66; GF: glass fiber.
The results of Flynn–Wall–Ozawa analysis (lnβ versus 1/T curves) shown in Figure 2 revealed that the best fitting straight lines are nearly parallel for various heating rates and different samples. Activation energies, E, corresponding to the different conversions, determined from the slope of the lines, are shown in Figure 3 for all samples.
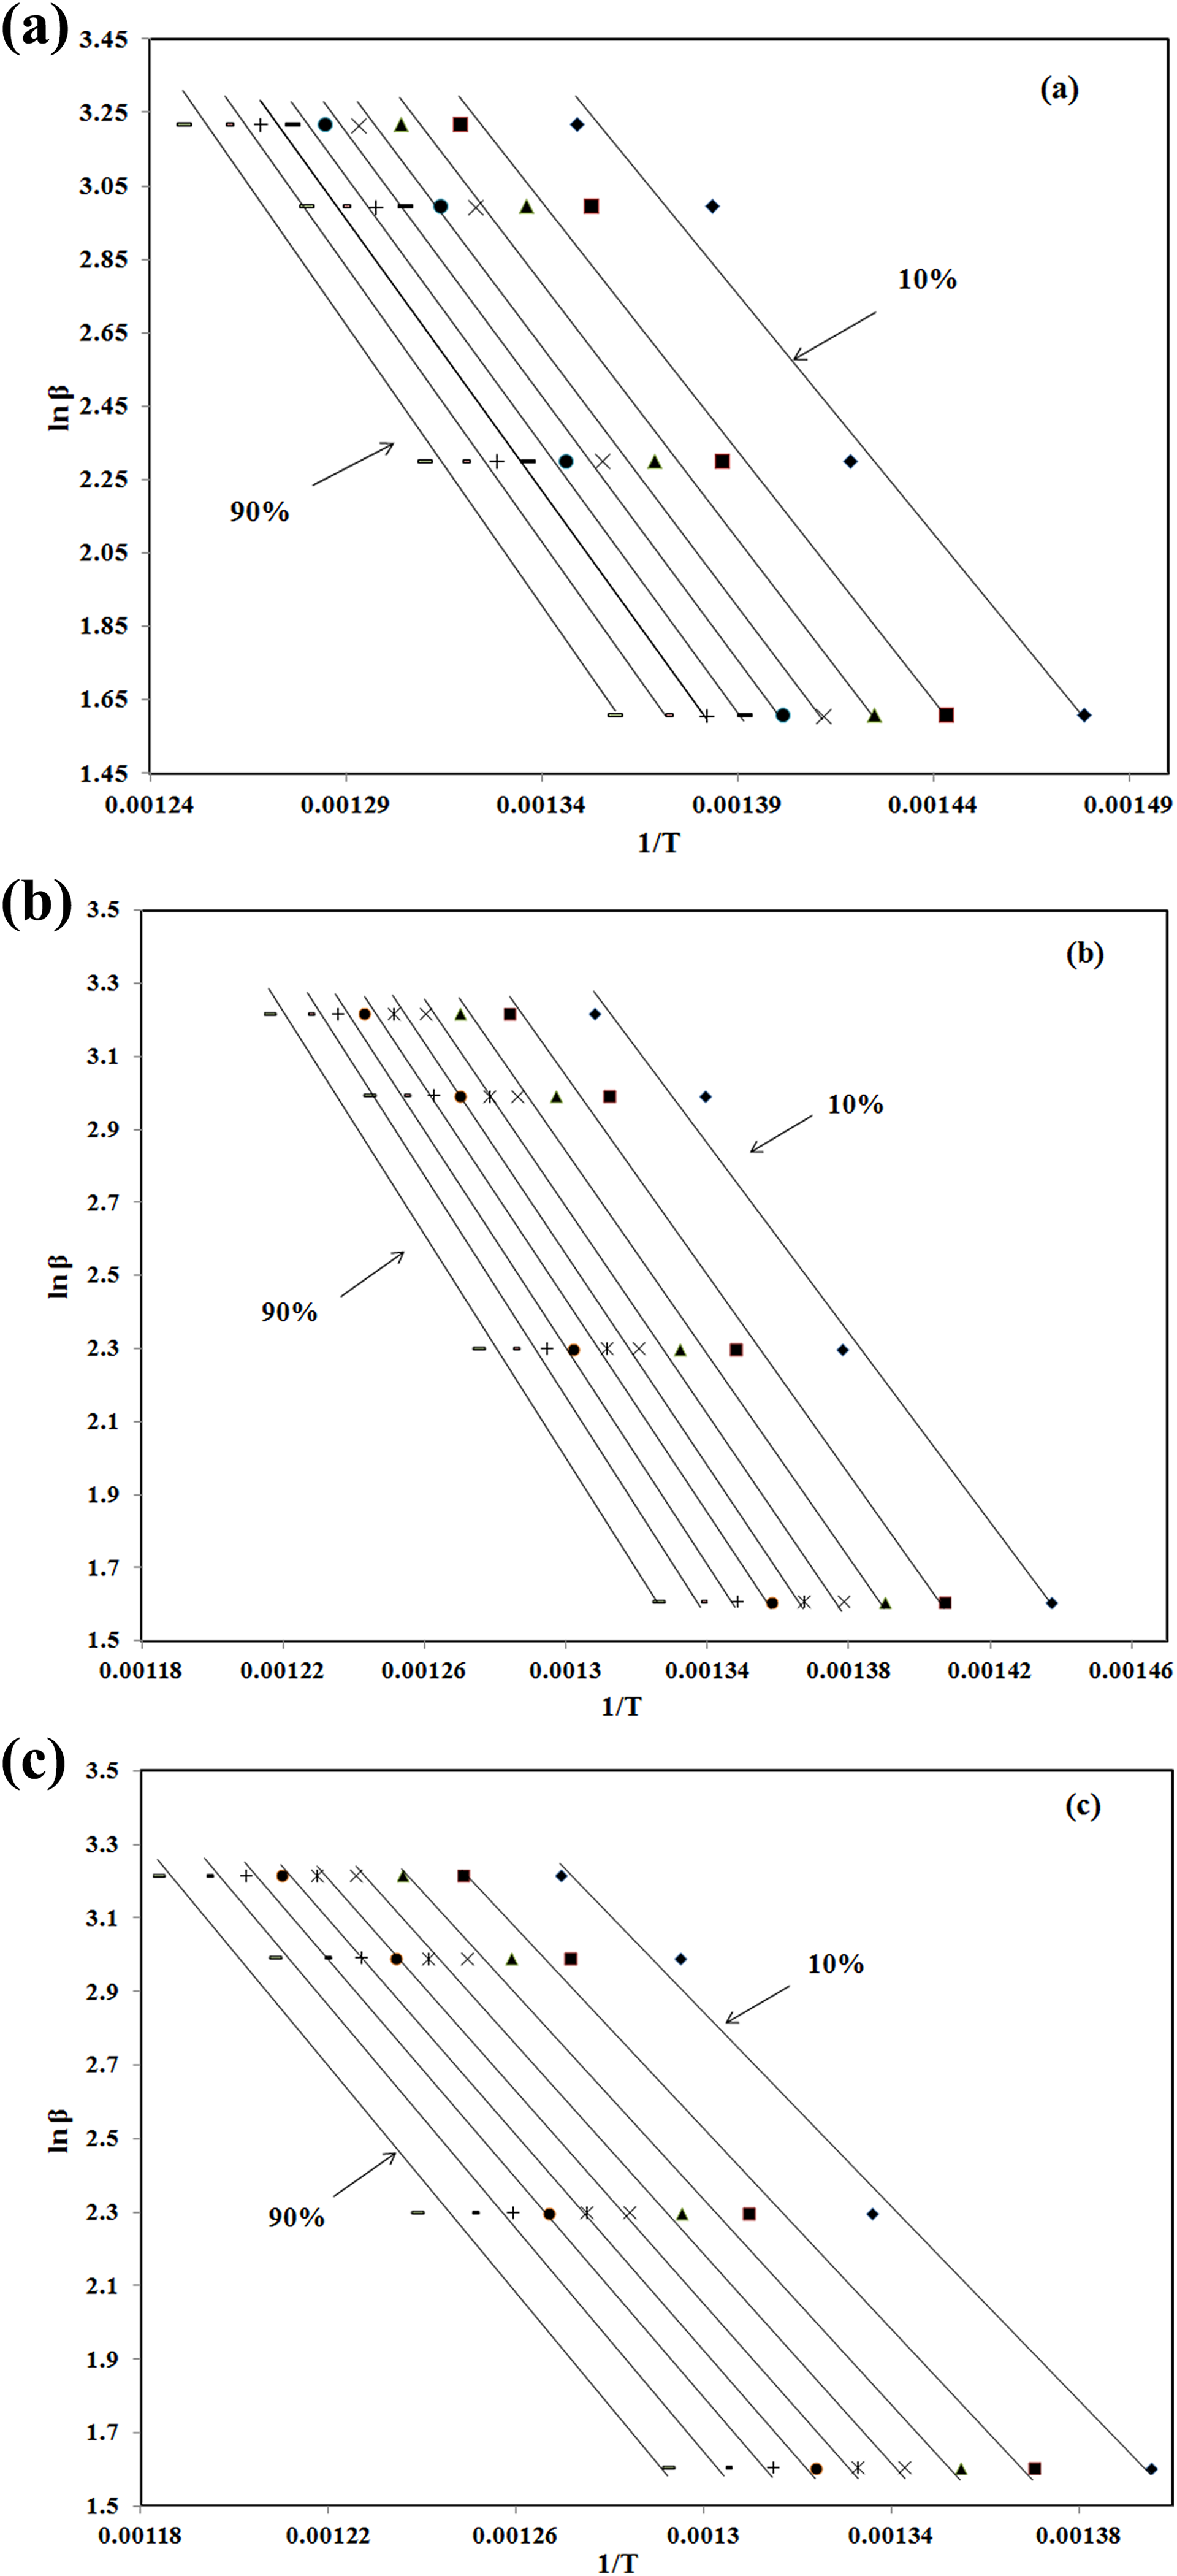
The results of Flynn–Wall–Ozawa analysis for (a) PA 66, (b) PA 66/GF (10%), and (c) PA 66/GF (30%). PA 66: Polyamide 66; GF: glass fiber.
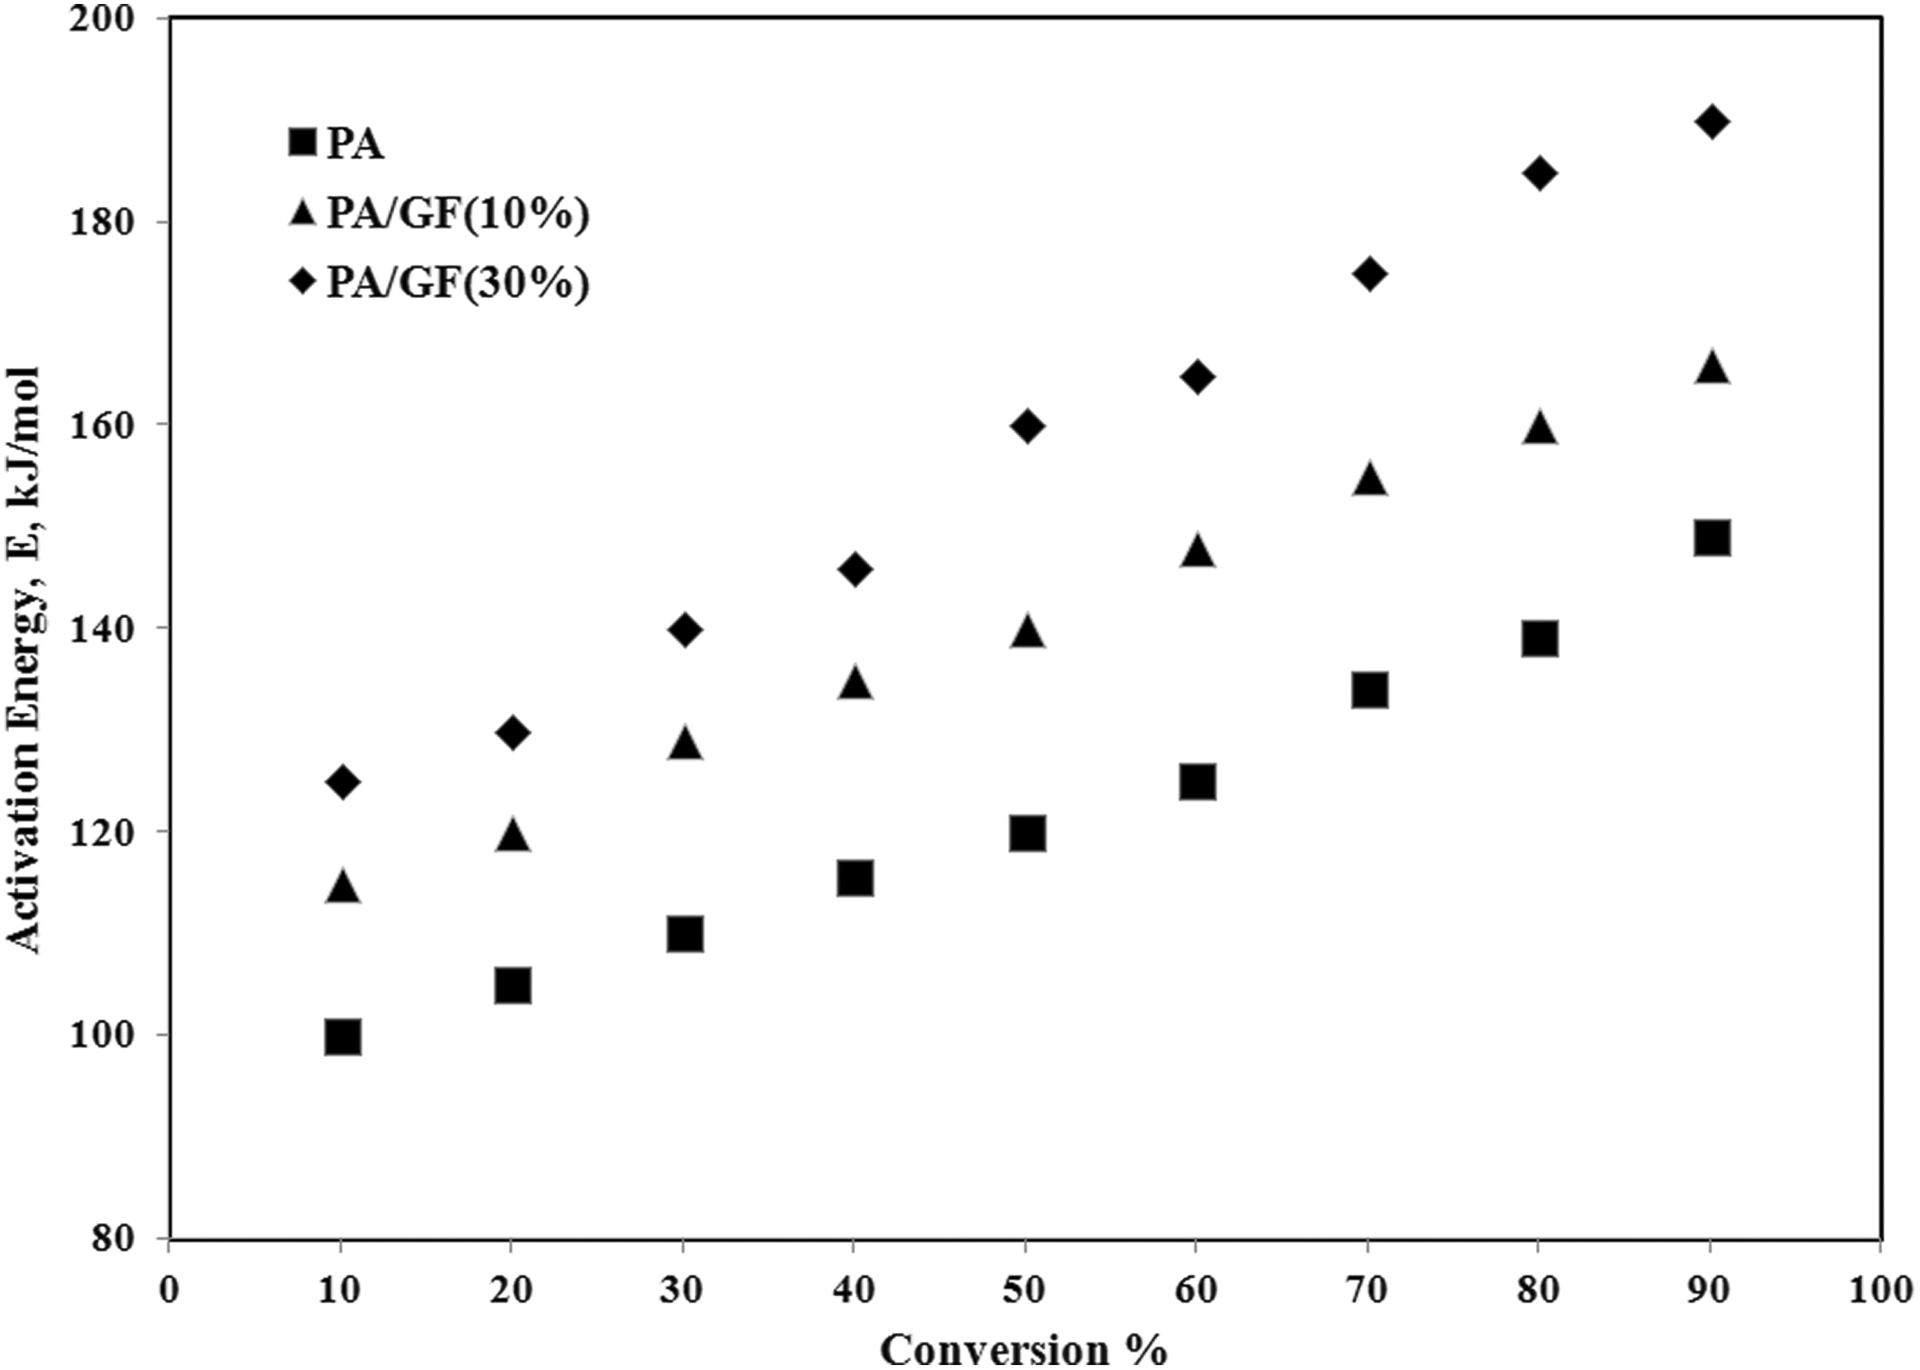
Variation of activation energy (E) versus conversion (α).
For PA 66/GF (10% and 30%), due to GF content in samples the level of activation energy in the whole conversion range is higher than pure PA 66. In all samples, the activation energy increases with conversion. With increasing content of GF in the composites, the degradation activation energy increased. As it was illustrated in Figure 1, the thermal degradation initiation temperature in the composites is increased with GF content increment. There is a relationship between the degradation behavior of samples and the corresponding activation energies in which the activation energy required to initiate the thermal degradation process increased with GF content increment in the composites. This fact is confirmed by the SEM results presented in Figure 4, which show that there is good compatibility between the fibers and the polymer matrix. The suitable melt-mixing of GFs and PA 66 matrix (Figure 4) results in a delay in the thermal degradation of composites with higher amount of GFs and an increase in the related activation energy.
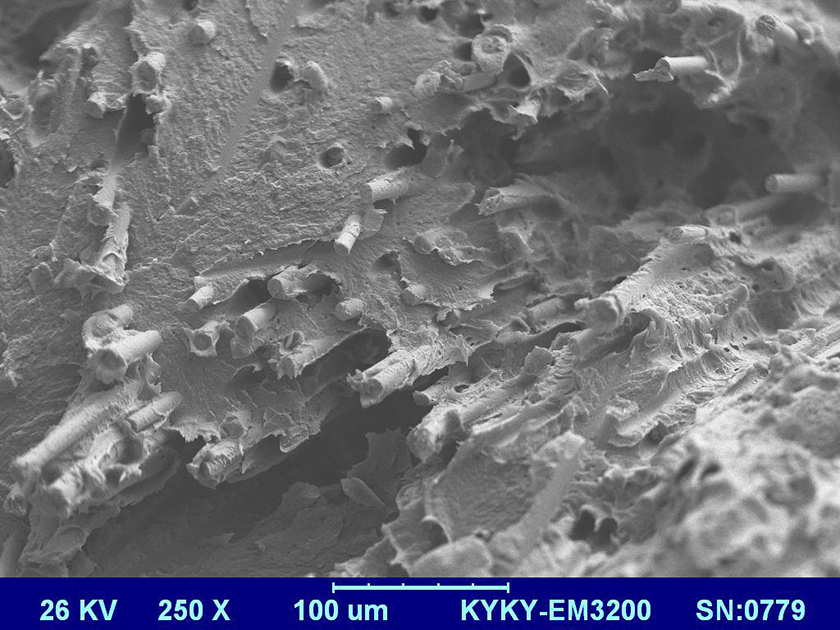
The SEM image of PA 66/GF (30%). SEM: scanning electron microscopy; PA 66: Polyamide 66; GF: glass fiber.
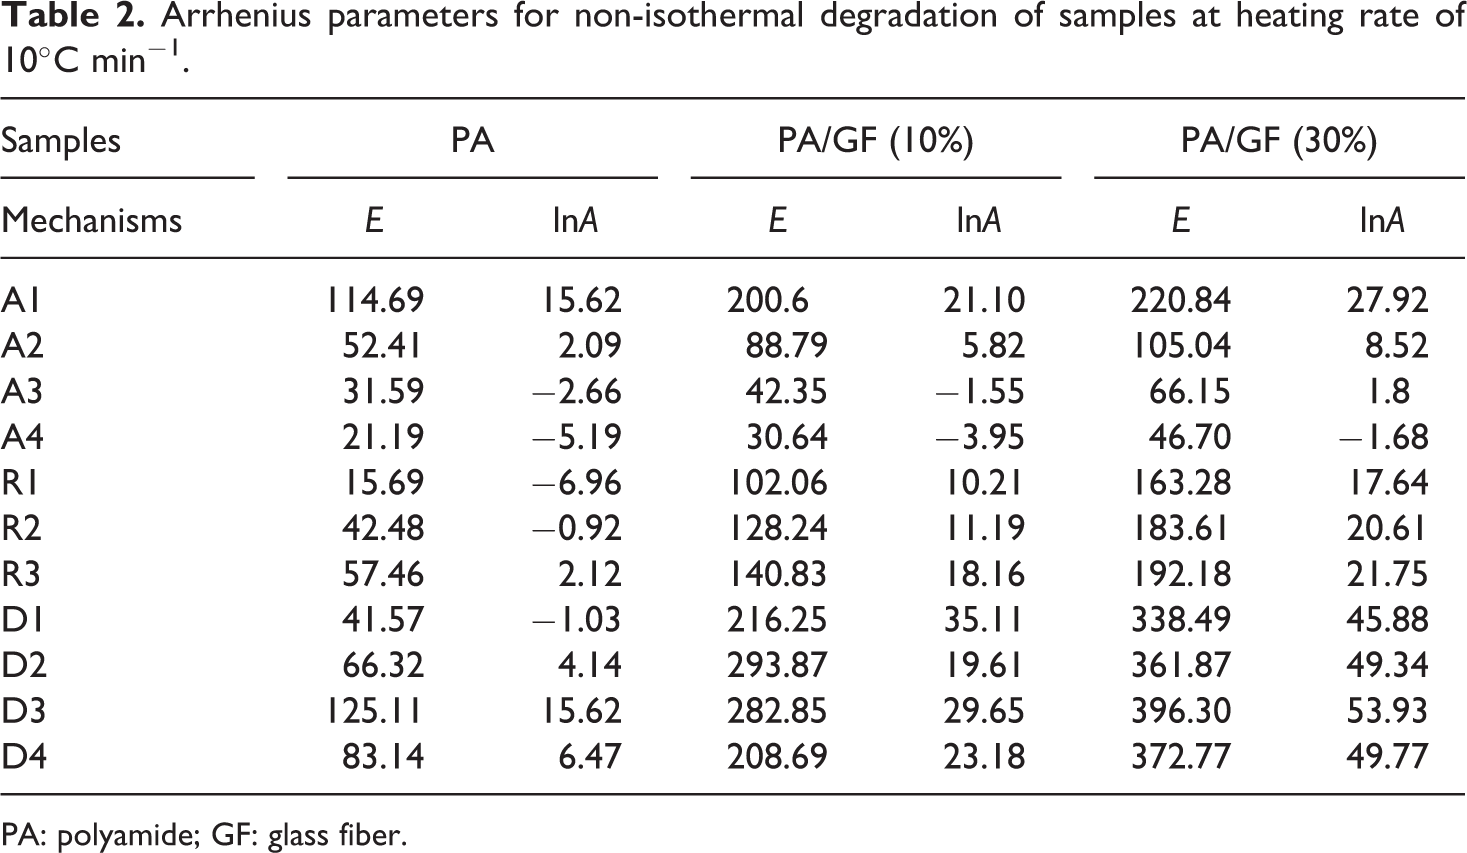
Due to increase in thermal degradation initiation temperatures, the activation energies slightly increased with GF content increment in these samples. The variation of activation energy versus conversion is an evidence of the complex degradation mechanism. 10,14–15 An increasing dependence of E on α is found for competing reactions in which this behavior was observed for all samples. 7 Based on the various reaction mechanisms, the kinetics parameters obtained from the non-isothermal TG data for samples, using Coats–Redfern equation (model-fitting method), are given in Table 2. These data are used in isokinetic calculations.
Arrhenius parameters for non-isothermal degradation of samples at heating rate of 10°C min−1.
PA: polyamide; GF: glass fiber.
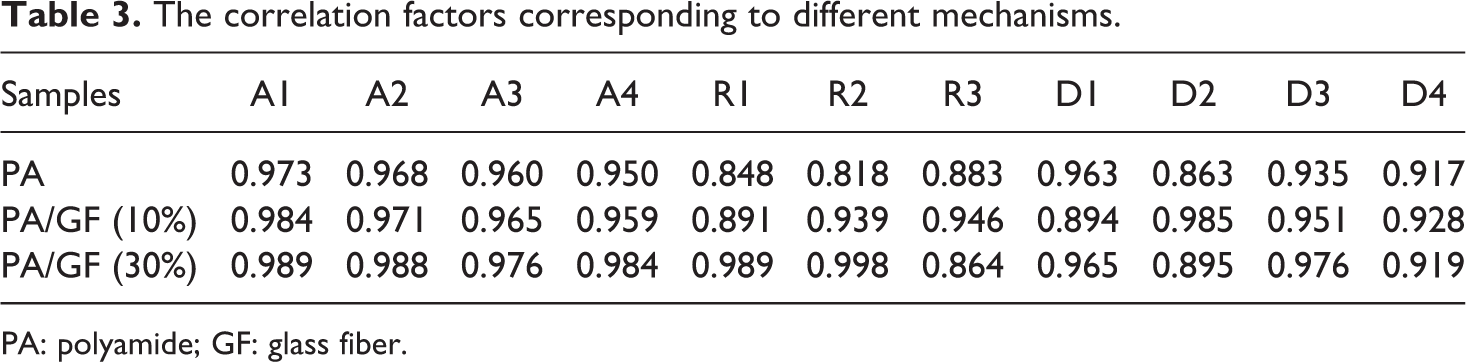
The results shown in Table 2 obviously indicate the strong dependence of the kinetics parameters on the selected reaction mechanism. Inserting different forms of these mechanisms in equation (6) results in a set of Arrhenius parameters in which the linear plot of ln[g(α)/T2] versus 1/T makes it possible to determine E and ln(A) from the slope and intercept of the graphs, respectively. The correlation factors of different mechanisms are presented in Table 3.
The correlation factors corresponding to different mechanisms.
PA: polyamide; GF: glass fiber.
As it is clear from Table 3, the correlation factors are a standard measure and therefore it is difficult to make a decision about exact thermal degradation mechanism. It is evident from Table 2 that the values of Arrhenius parameters corresponding to those models that have high correlation factors vary significantly.
The Arrhenius lines using IKR method were plotted in Figure 5, using the parameters of Table 2, for all of the samples. Therefore the intersection point corresponds to the isokinetic parameters (a and b) used in which nearly all the plotted lines converge. According to equation (7), the calculated pre-exponential factors, lnAα , correspond to Eα for each degree of conversion for PA 66, PA 66/GF (10%), and PA 66/GF (30%), as shown in Figure 6. As it is observed, the lnAα values change with conversion in different samples and this trend is comparable with the variation of activation energy versus conversion. This behavior is attributed to the linear correlation between E and lnAα .
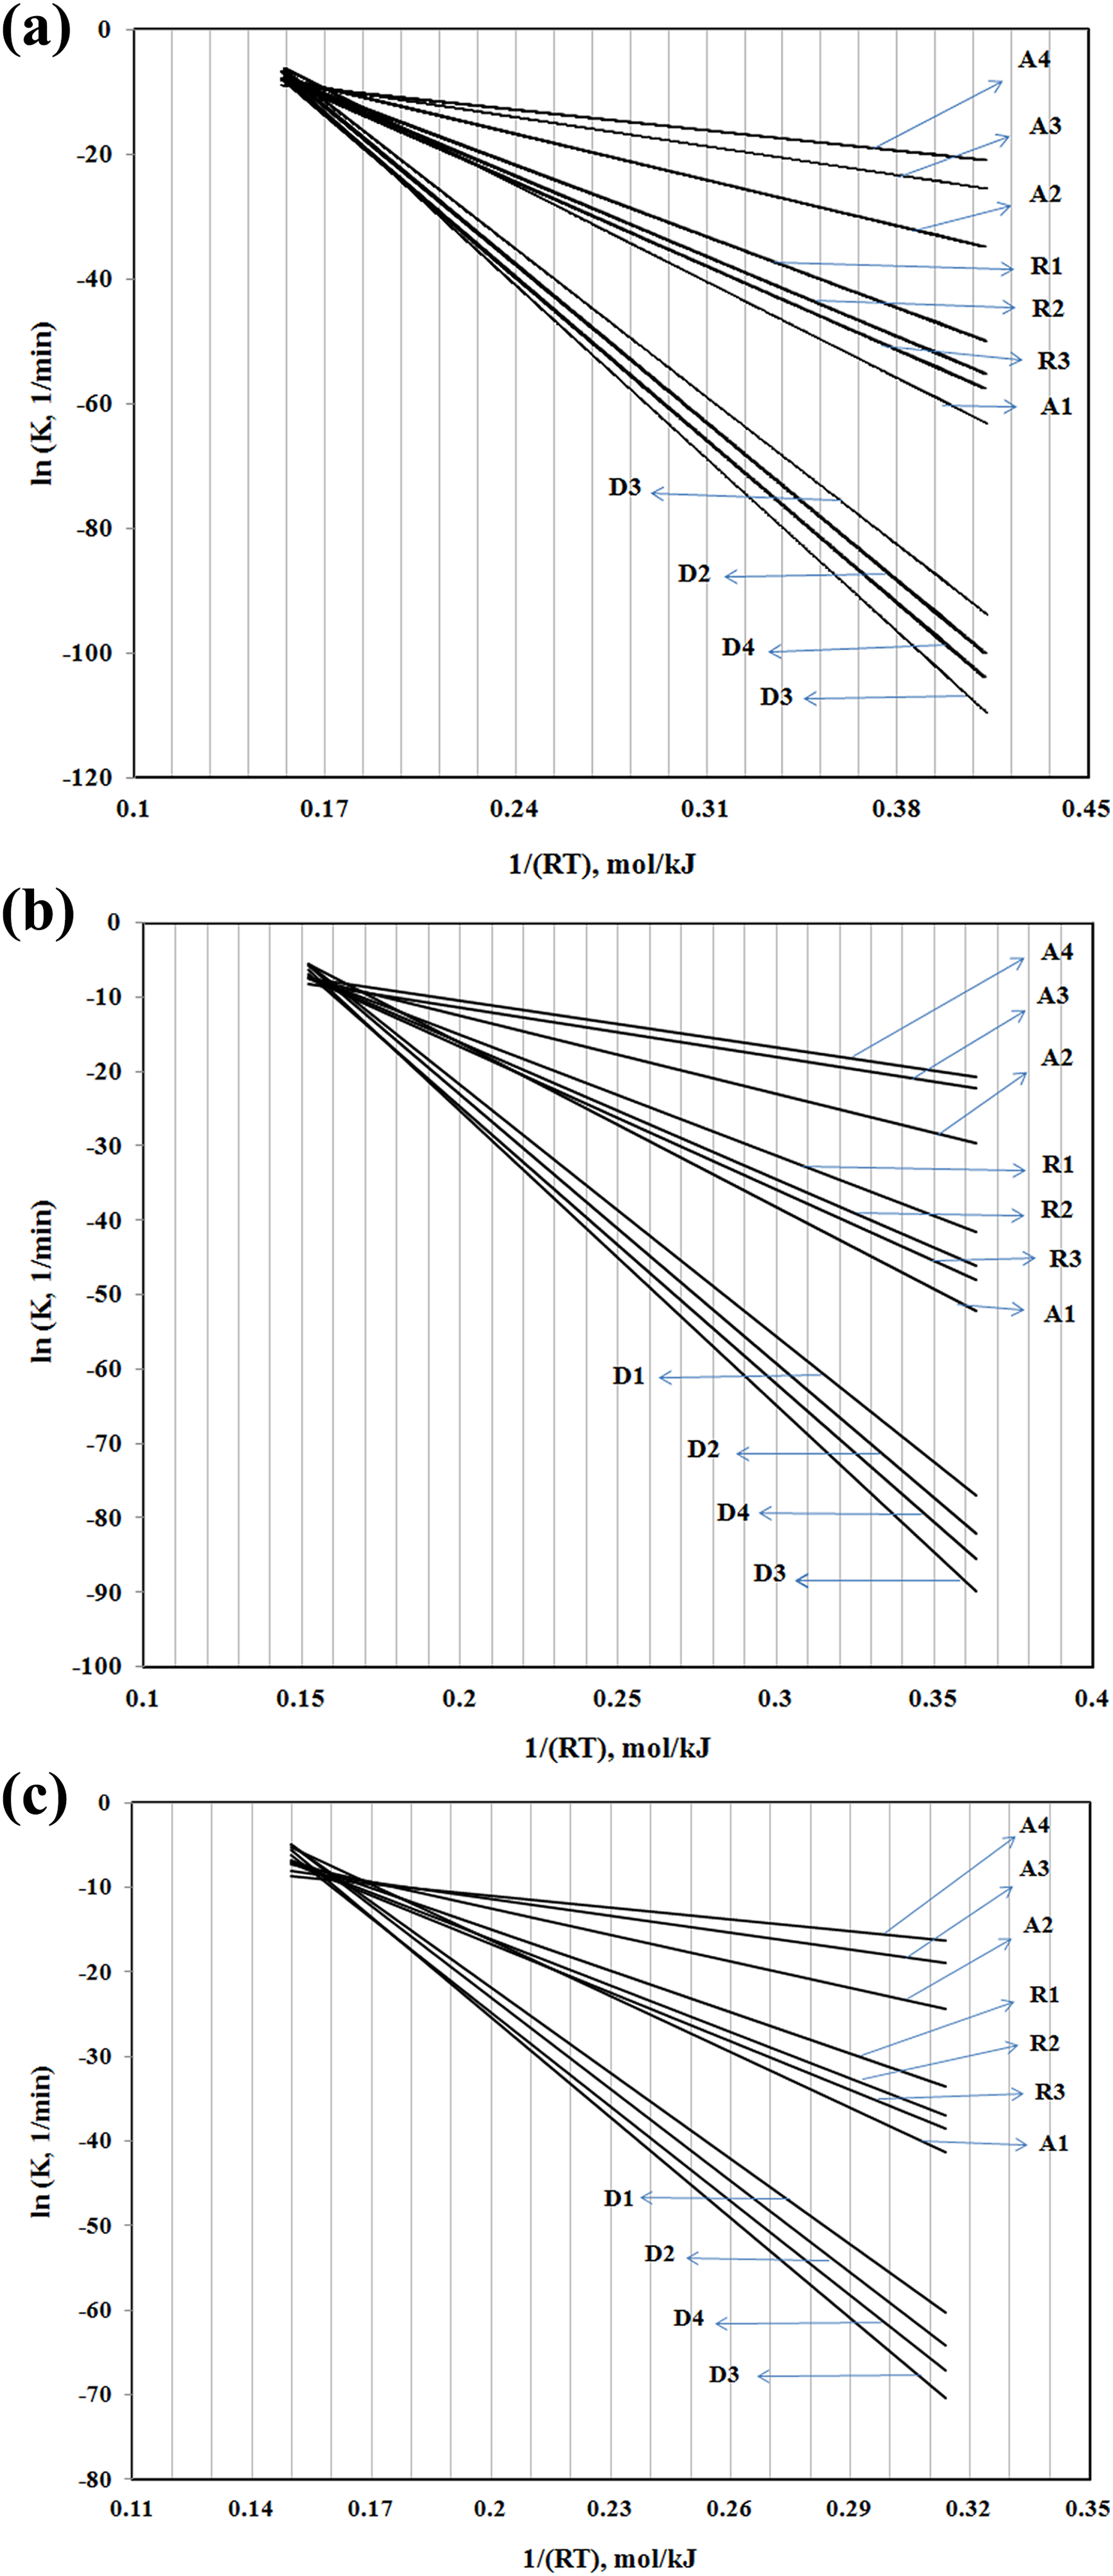
The Arrhenius lines using IKR method for (a) PA 66, (b) PA 66/GF (10%), and (c) PA 66/GF (30%). PA 66: Polyamide 66; GF: glass fiber; IKR: isokinetic relationship.
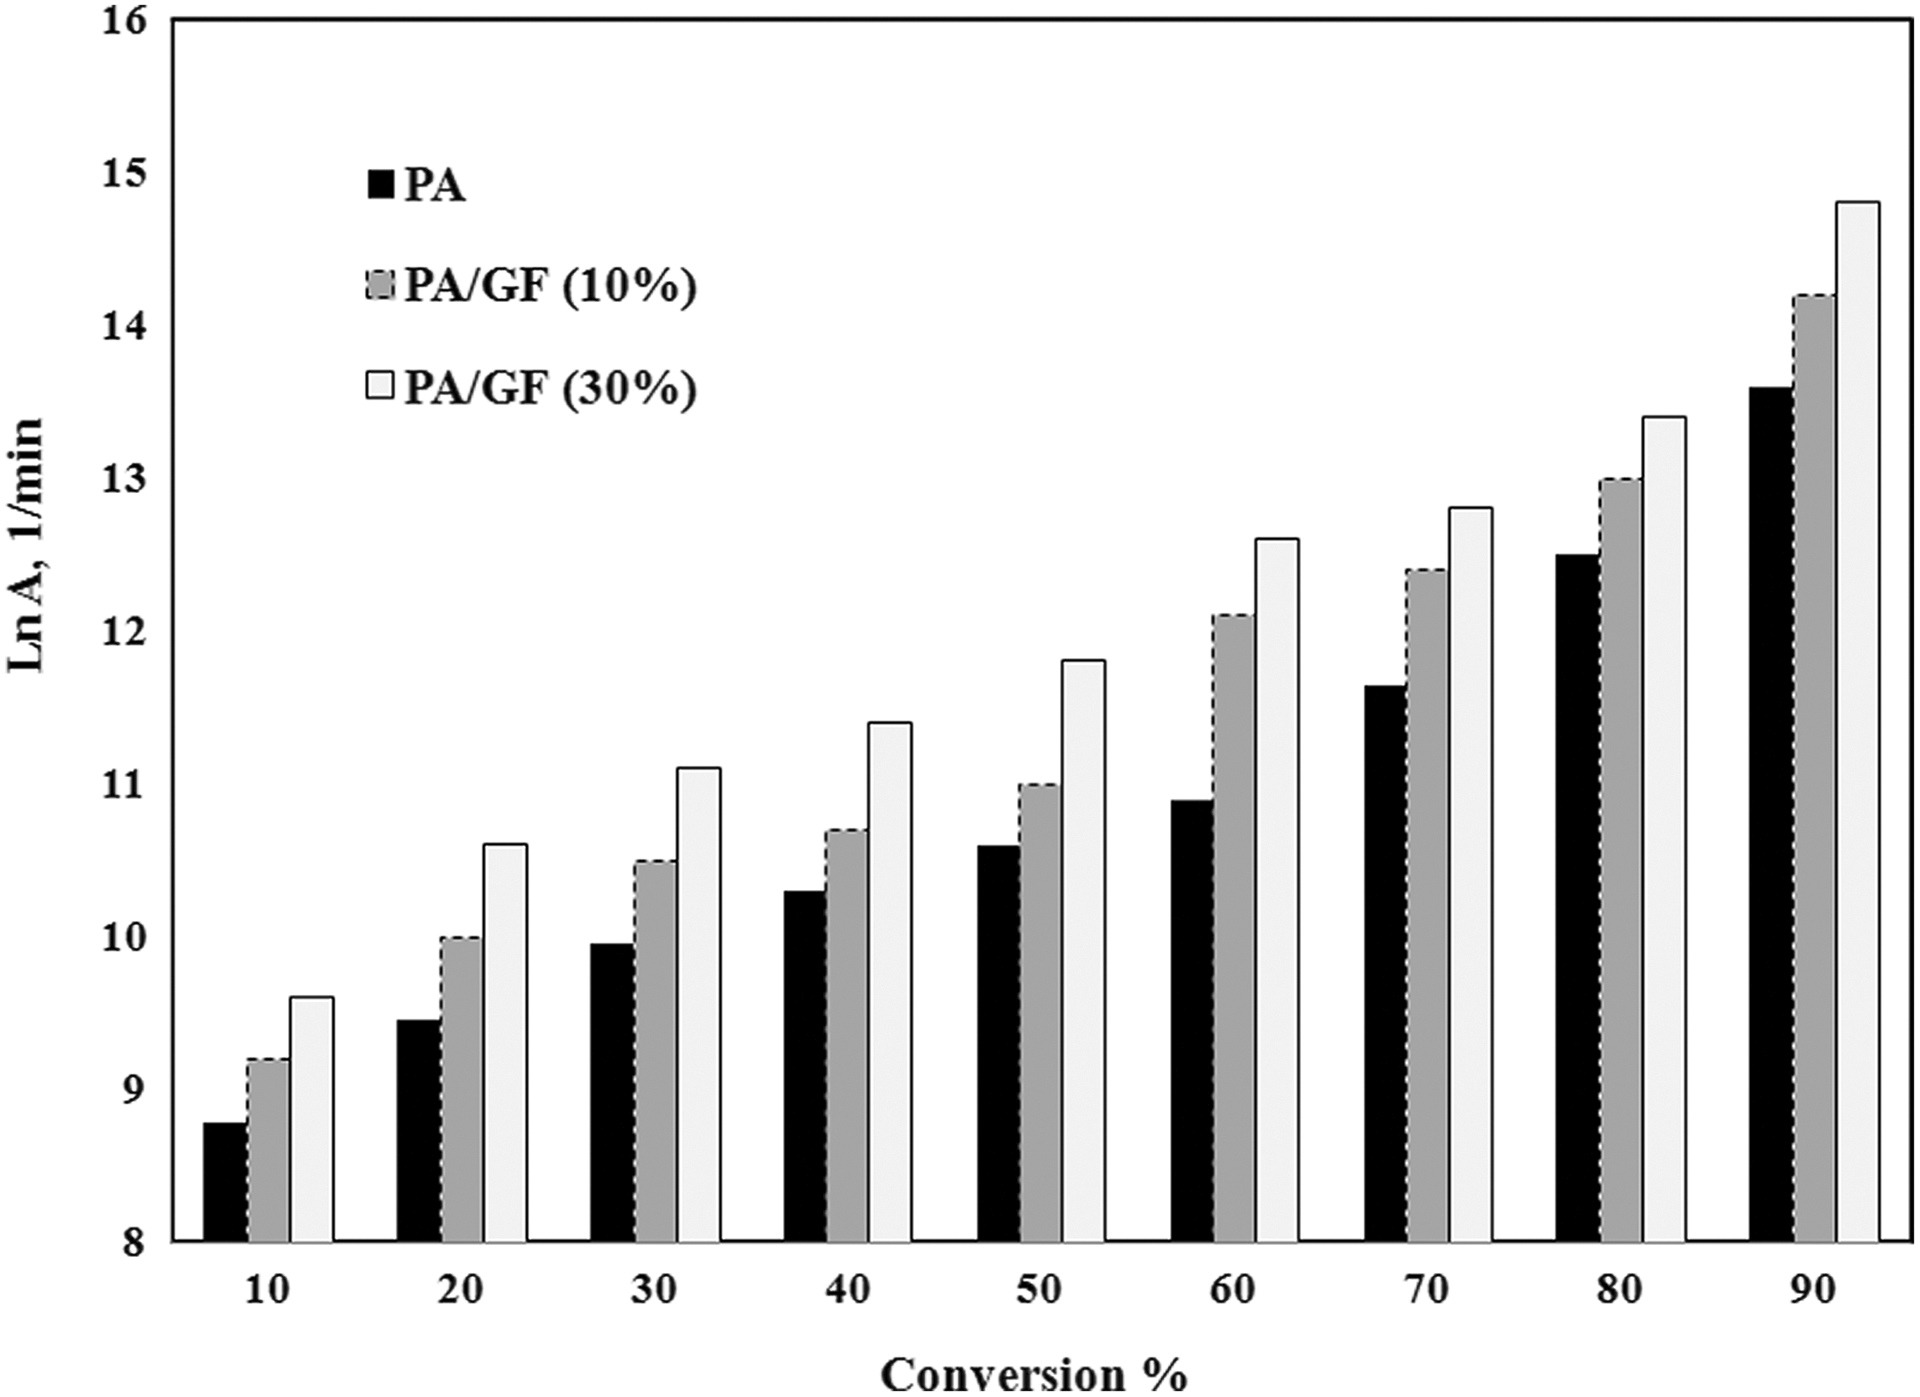
Variation of pre-exponential factor (lnA) versus conversion (α).
Conclusion
The thermal decomposition of PA 66, PA 66/GF (10%), and PA 66/GF (30%), under nitrogen purge at different heating rates by thermal gravimetric method in non-isothermal condition, has been studied. The initiation degradation temperature with GF incorporation increased at all heating rates. This behavior main reason was GF content effect on composites delay pathway in degradation. The results show the relationship between degradation behavior and the activation energy value, in which more amount of GF means higher initiation degradation temperature and so large value of activation energy in the conversion values. The fact was confirmed by the SEM results. Furthermore, the values of lnAα were determined using IKR and it was mentioned that lnAα and E and conversion changes have similar behavior. In addition, the presence of multiple-step reactions in samples indicated thermal degradation. Therefore, the model-free and isoconversional methods are believed to be an appropriate way for characterizing kinetic parameters consistently.