
Abstract
The characterization and wear sliding performance of the poly(methyl methacrylate) (PMMA) reinforced with hydrophilic and hydrophobic nanoparticles of silicon dioxide (SiO2) was studied. The final polymer matrix was treated in a water bath at a temperature of 100°C for 6 h. Steel balls were used to slide against the surface of PMMA specimens reinforced with SiO2 nanoparticles. Sliding wear tests were carried out in wet sliding conditions applying a drop of distilled water between the specimen and the ball. The tests were carried out up to 9000 cycles at room temperature. A frequency of 5 Hz, a stroke amplitude of 3 mm, and a maximum contact pressure of 1.087 GPa were selected. Fourier transform infrared spectroscopy spectrum, scanning electron microscopy, and microhardness and roughness of the pure PMMA and PMMA/SiO2 were obtained. The coefficient of friction and wear rates were calculated, and the main wear mechanisms found were adhesion wear, plastic deformation, ploughing, and pitting. The results showed that the addition of hydrophobic nanoparticles of SiO2 may be employed to enhance the wear resistance of external automotive parts made of polymeric compound matrix. Finally, the specimens showed a hydrophilic behavior (angular contact < 90°) due to the high polarity of the PMMA matrix and the incorporation of the SiO2 nanoparticles.
Keywords
Introduction
The objective of this work is to characterize and know the sliding wear properties in wet conditions of the poly(methyl methacrylate) (PMMA) reinforced with hydrophilic and hydrophobic nanoparticles (7 nm) of silicon dioxide (SiO2). The nanoparticles can be presented in different materials, which include particulate substances. Its main characteristic is a size smaller than 100 nm, which can be of different geometries. The importance in the use of these materials is that they can influence the physicochemical properties of a substance. 1 The term hydrophilic means affinity to water and hydrophobic means without affinity to water. In the scientific community, the definition that a surface is hydrophobic is recognized when the static water forms a contact angle θ with respect to the horizontal greater than 90° and is hydrophilic when θ is less than 90°. 2 In this case, the hydrophilic and hydrophobic nanoparticles were used to improve the surface and generate mechanical stability 3 for automotive applications such as headlight cover, windows, windshield, which are subjected to scratches, abrasive wear, erosive wear, and so on. The PMMA has been used in different situations, one of them is in dental application, due to its good mechanical and tribological properties. For example, Karthick et al. 4 evaluated the hardness and tribological properties of the PMMA reinforced with seashell nanopowder. They concluded that tribological performance was improved considerably at 12% seashell nanopowder content. Other works also study the behavior of PMMA as anti-wear material for dental applications. 5 –7 In their respective works, they confirmed that for dentistry, the predominantly polymer used is PMMA. Other uses of this polymer have been reported in literature. In a research work, concerning fretting wear behavior of PMMA under linear motions and torsional contact conditions was studied. 8 It was seen that for rolling conditions the progressive accumulation of debris induced the formation of a ripple. Other work reported the wear behavior of a PMMA substrate contacting against a steel ball under very small amplitude oscillating motions. 9 In this case, the contact zone kinematics has been found to have a major influence upon the wear resistance of the PMMA. In the work reported by Briscoe et al., 10 the characterization of the scratch deformation mechanisms for PMMA using surface optical reflectivity was studied. The results show that the reflectivity of a brittle fractured surface is significantly lower than that for a plastically deformed surface. In a research work, mechanical and tribological properties of PMMA composites filled with titanium oxide (TiO2) were studied. Increasing the TiO2 content in the PMMA matrix from 1 wt% to 7 wt% resulted in improved tensile strength and then decreased. The tensile and tribological properties showed that optimum TiO2 content is obtained at 3 wt%. 11 For specific applications related to automotive parts, there are two principal polymers used. One of them was the polycarbonate. It was employed mainly for headlights covers, glazing parts, headlamp lenses, and so on. 12 The other was the PMMA, used for windows, displays, screens, and so on. This polymer is a transparent thermoplastic, which was often used as a lightweight or shatter-resistant alternative to glass. 13
Experimental work
Materials
Aerosil 380 and 972 were chosen for the development of this work, which contain the hydrophilic (Figure 1(a)) hydrophobic (Figure 1(b)) nanoparticles of SiO2, respectively. It has been reported that the Si–OH groups present in the hydrophilic nanoparticles promote the absorption of water, while the CH3 groups of the hydrophobic nanoparticles prevent the absorption of water. 14
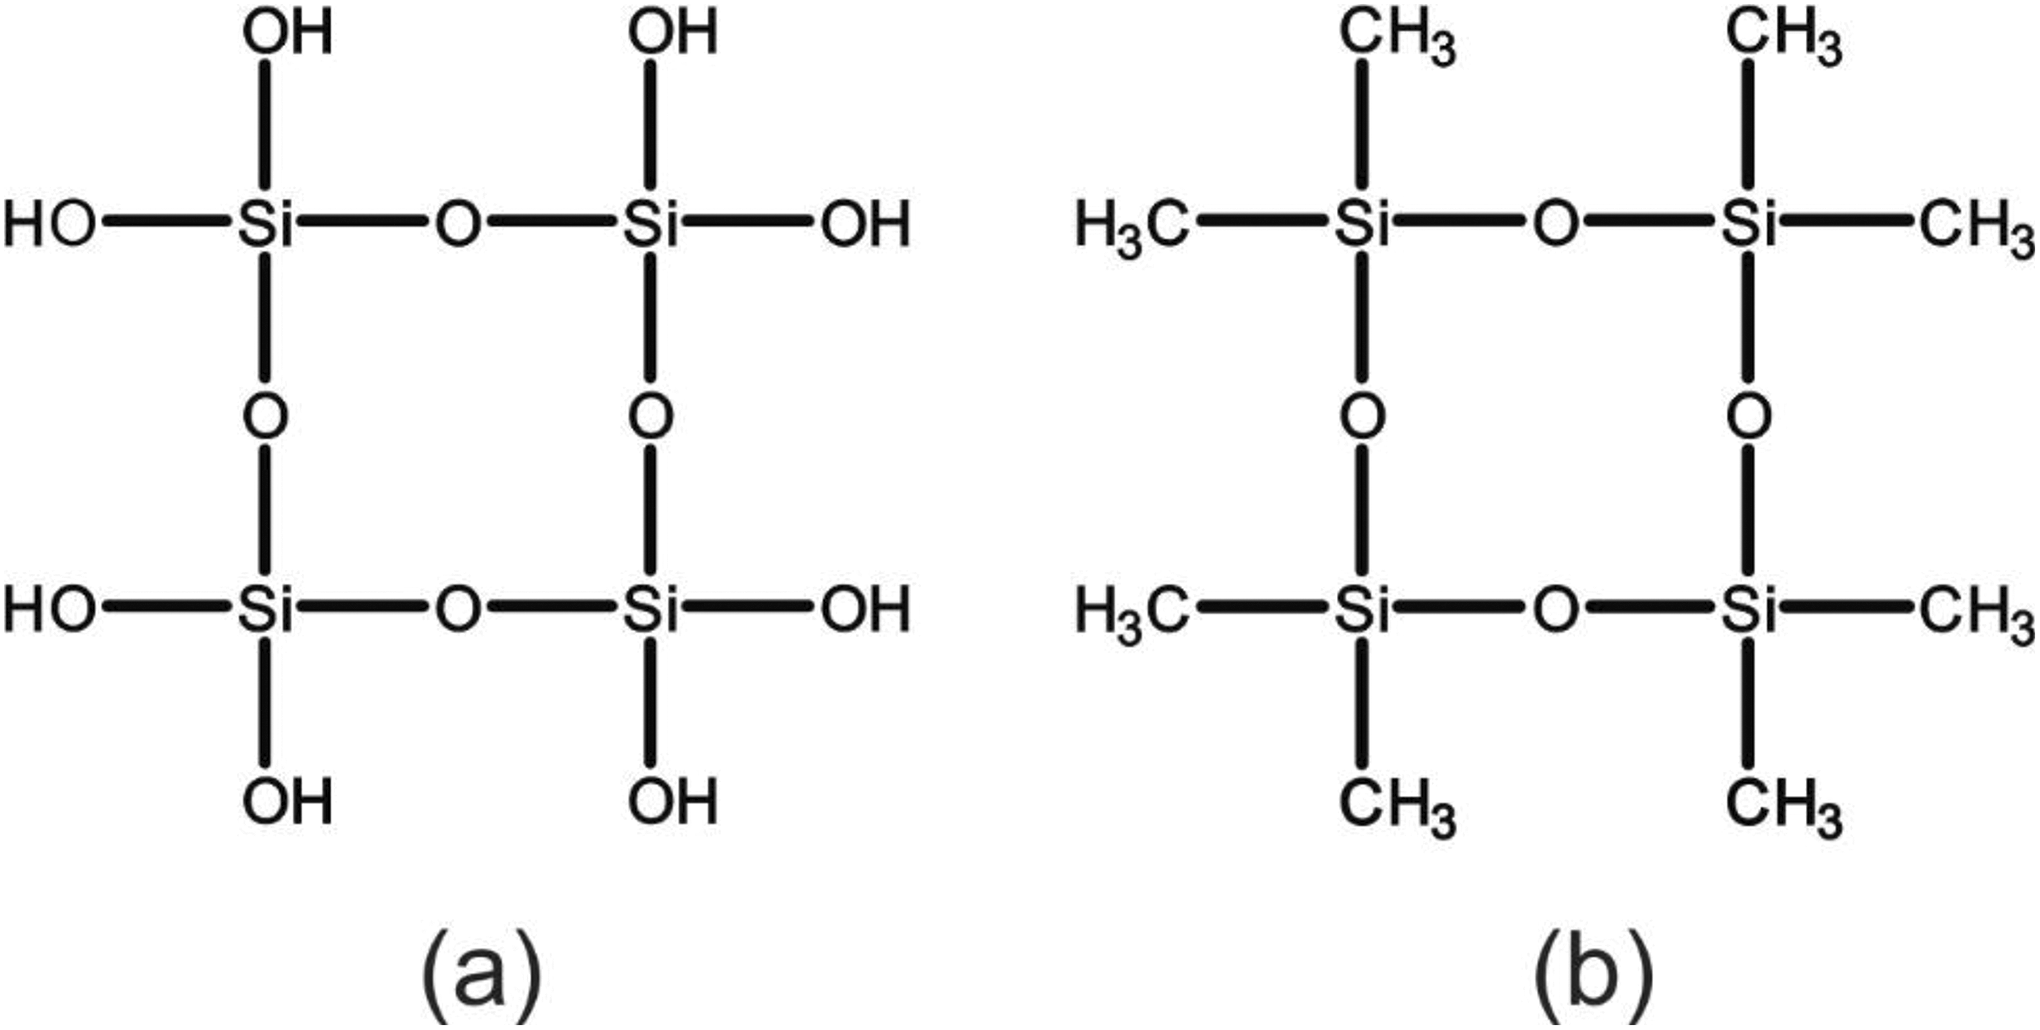
Chemical structure of (a) hydrophilic and (b) hydrophobic nanoparticles of SiO2.
The preparation of the materials or specimens was carried out from a solution of PMMA (21 g) and of hydrophobic and/or hydrophilic nanoparticles of SiO2 as given in Table 1. Subsequently, 9 g of the solution in 21 g of PMMA was added to form the polymer matrix. The final polymer matrix was placed in glass molds and treated in a water bath at a temperature of 100°C for 6 h. The final specimens had a rectangular shape with dimensions of 20 × 10 mm2 and a thickness of 3 mm.
Composition of the polymer matrix.
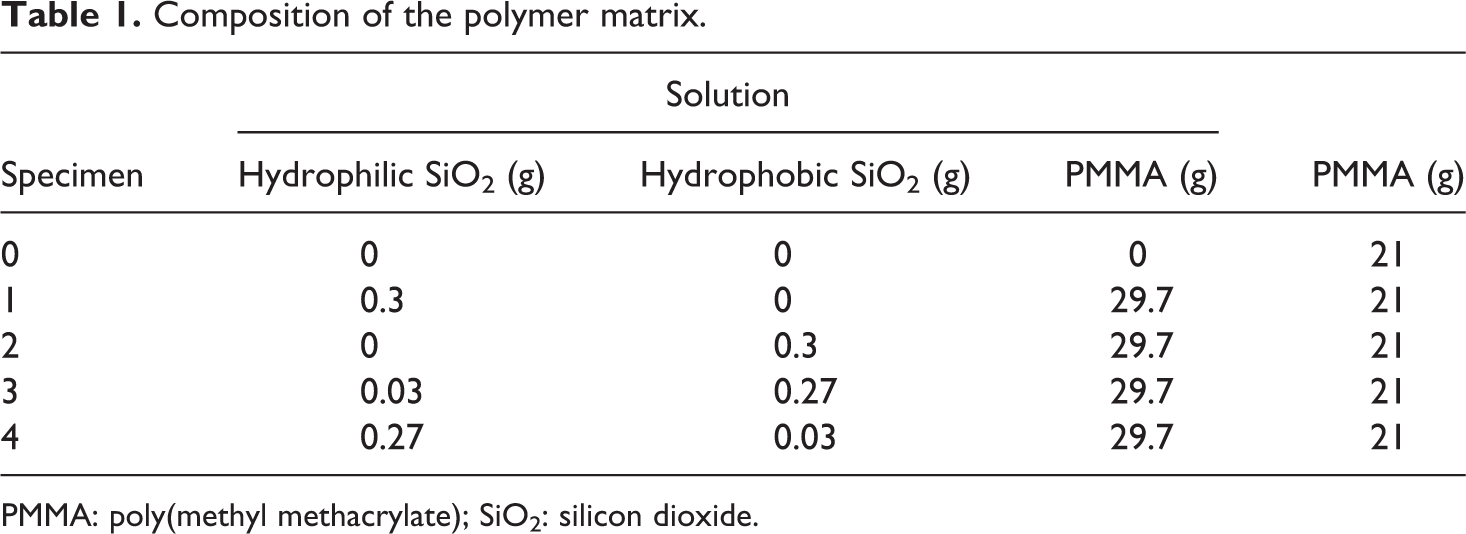
PMMA: poly(methyl methacrylate); SiO2: silicon dioxide.
Test procedure
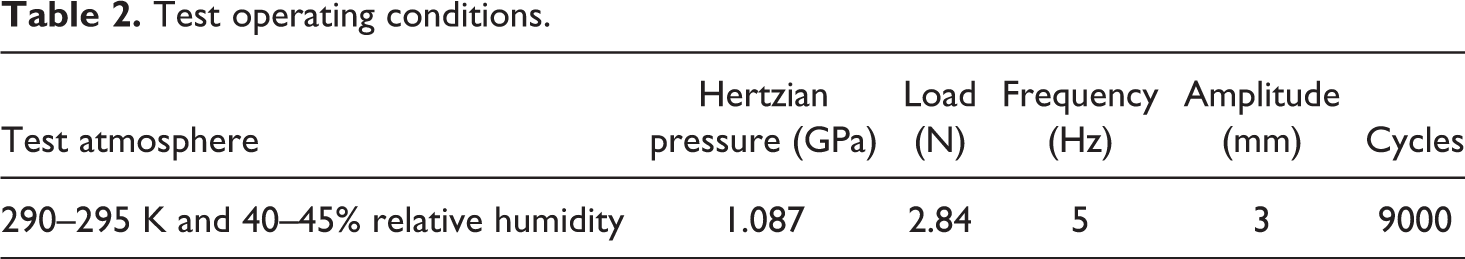
The sliding wear tests were carried out in wet conditions using a reciprocating tribometer. AISI 52100 steel balls were used to slide against the surface of PMMA reinforced with SiO2 nanoparticles. The balls used had a diameter of 4.75 mm, a microhardness of 860 HV, and a roughness (Ra) of 0.0085 µm. The specimen and ball were placed as shown in the simplified schematic diagram (see Figure 2), applying a drop of distilled water between them. The normal load is applied directly over the carrier head using weights. Before doing the tests, the ball and specimens were cleaned by washing in acetone in an ultrasonic bath (Steren USC-100). Then, test parameters such as load, frequency, and stroke (amplitude) were selected and introduced into the computer. The maximum contact pressure was selected in such a way that wear would be produced with a low number of cycles. A program collects the data generated, which was basically the friction coefficient versus time. The tests were carried out up to 9000 cycles. This was predetermined with several preliminary tests, to know how many cycles were necessary to cause damage on the surface. Table 2 provides the operating conditions of the tests conducted.
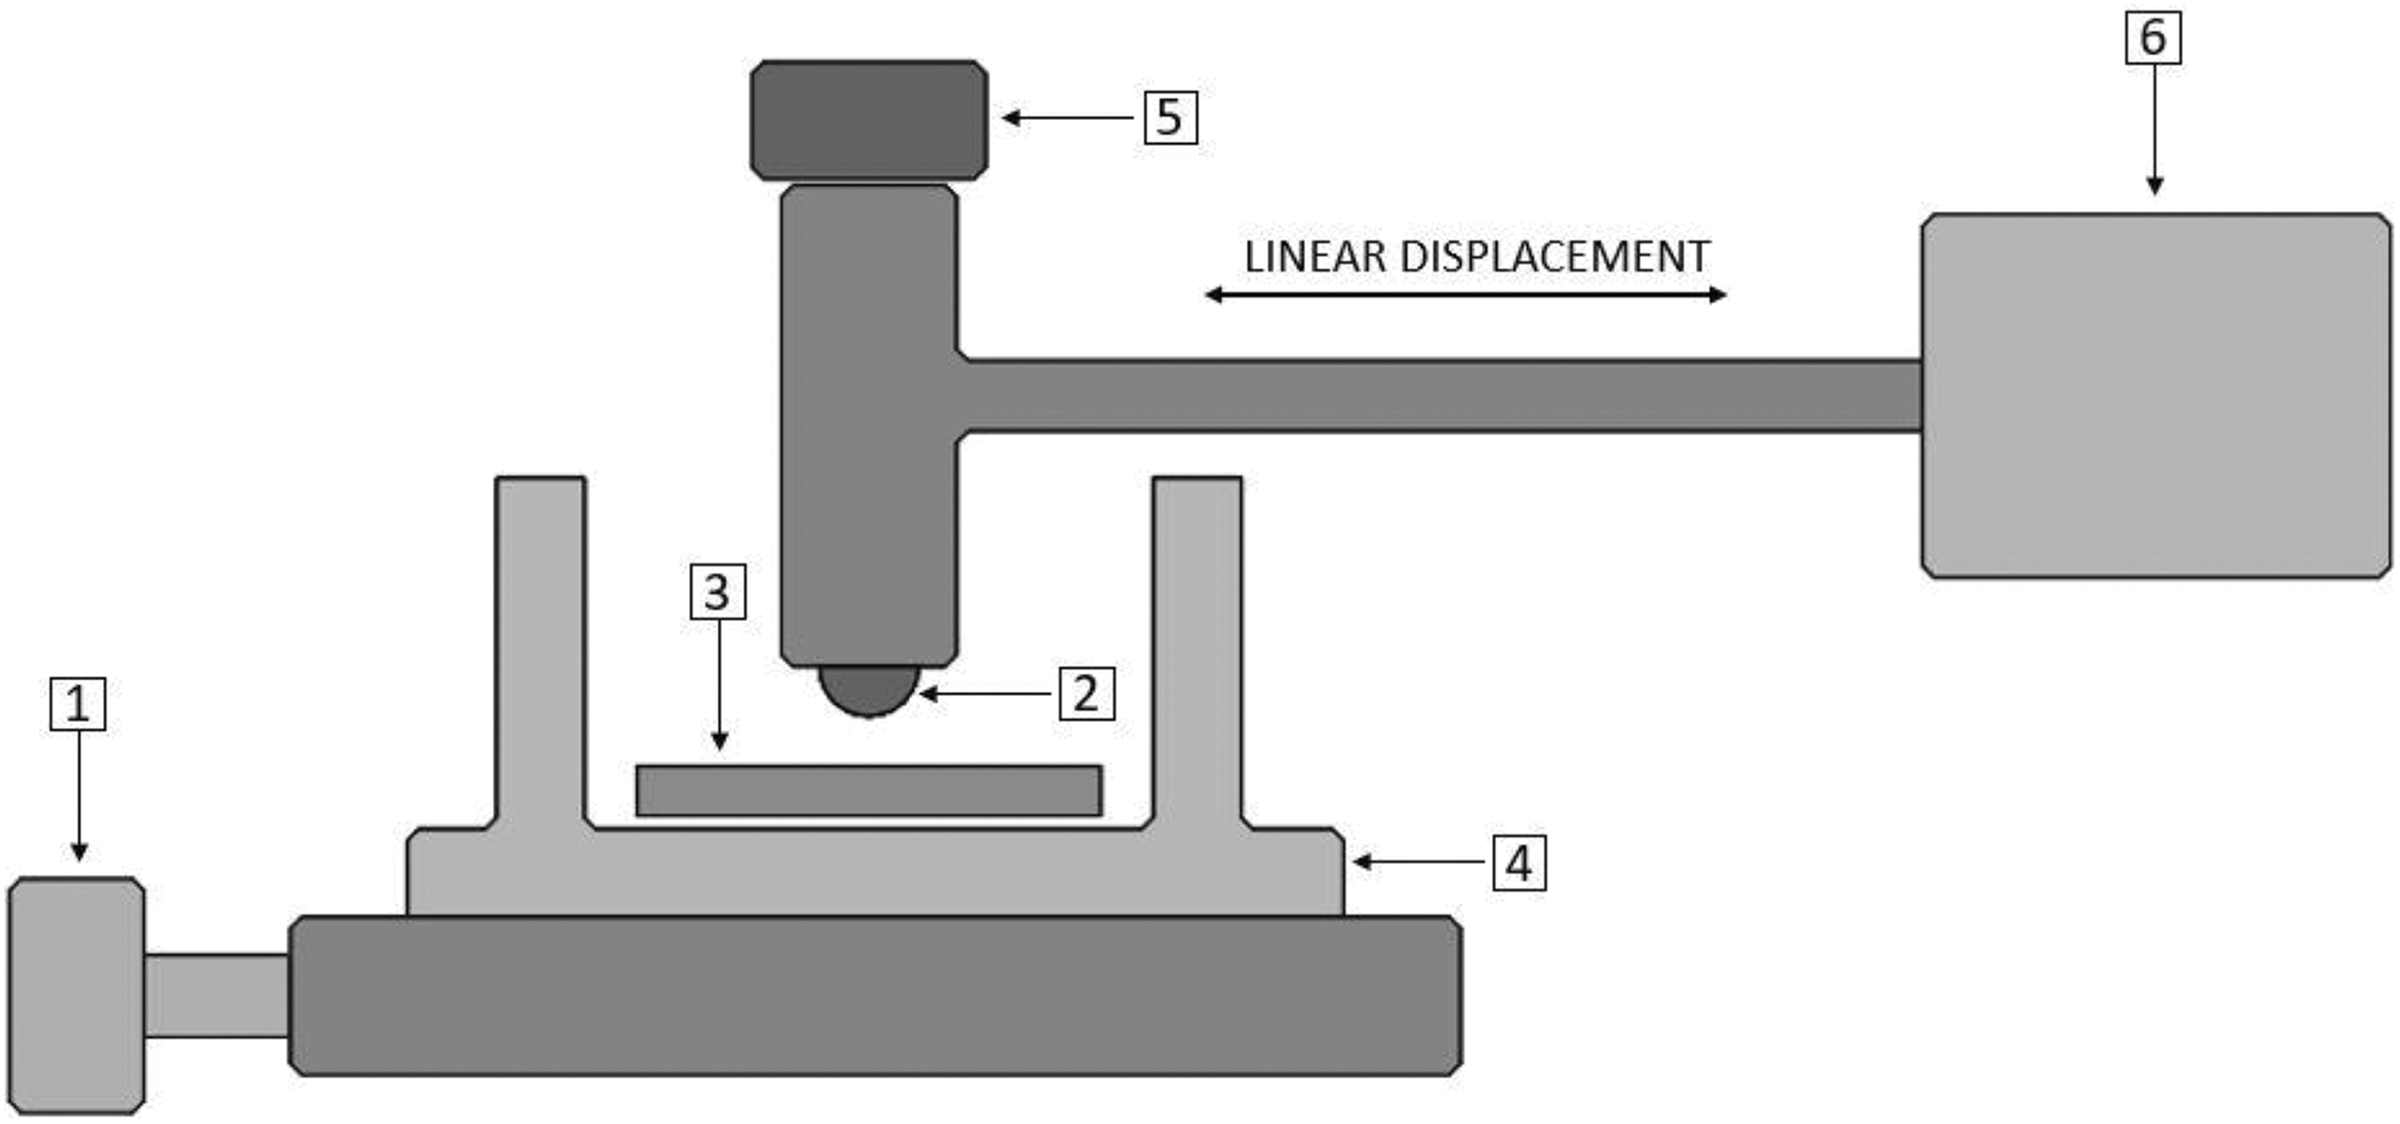
Simplified schematic diagram of high-frequency friction machine (1: friction force transducer; 2: ball; 3: specimen; 4: heater block; 5: normal load; 6: oscillator driver).
Test operating conditions.
Characterization
The composition of the materials was verified by Fourier transform infrared spectroscopy (FTIR, PerkinElmer Spectrum GX; PerkinElmer, Waltham, MA, USA) and energy-dispersive spectroscopy (EDS, JEOL JSM-6010LA, Japan). The morphologies were observed by scanning electron microscopy (SEM, JEOL JSM-6010LA, Japan). To determine the contact angle, a surface characterization equipment was used (OCA 30 dataphysics, DataPhysics Instruments Gmbh, Filderstadt, Germany). The microhardness was measured at three different locations by means of a Vickers indenter with a load of 50 g (Micro Vickers Hardness, Bowers 412 DAT, Bowers group, Camberley, UK). The roughness values were measured using a Profilometer (Mitutoyo Surftest, Mitutoyo Corporation, Kawasaki, Japan). The microscopic images were obtained using an optical microscope (Microscope PTS model MDS, Wuzhou New Found Instrument Co., Guangxi, China) with 100× magnification.
Results and discussion
Fourier transform infrared spectroscopy
Figure 3 shows the FTIR spectrum of the pure PMMA and PMMA/SiO2. It can be seen that the absorption bands characteristic of the polymer at 2992, 1431, 1192, and 964 cm−1; 2950 and 1387 cm−1; 1729, 1267, and 1240 cm−1; 1148 and 1065 cm−1; 841 cm−1; and 750 cm−1, corresponding to the bonds and shifting of oxygen bonded to CH3 (group O–CH3), CH3, stretching of the –CH3−, asymmetric stretch C–O–C, and rocking CH2, respectively. Due to the addition of hydrophobic and hydrophilic nanoparticles of SiO2, which are suspended within the matrix, the characteristic band of the vibration of the Si–O–Si group between 450 cm−1 and 400 cm−1 was found. 15 –17 The results obtained from the interpretation of the spectra indicate that the nanoparticles of silica were incorporated in the PMMA matrix surface. 18
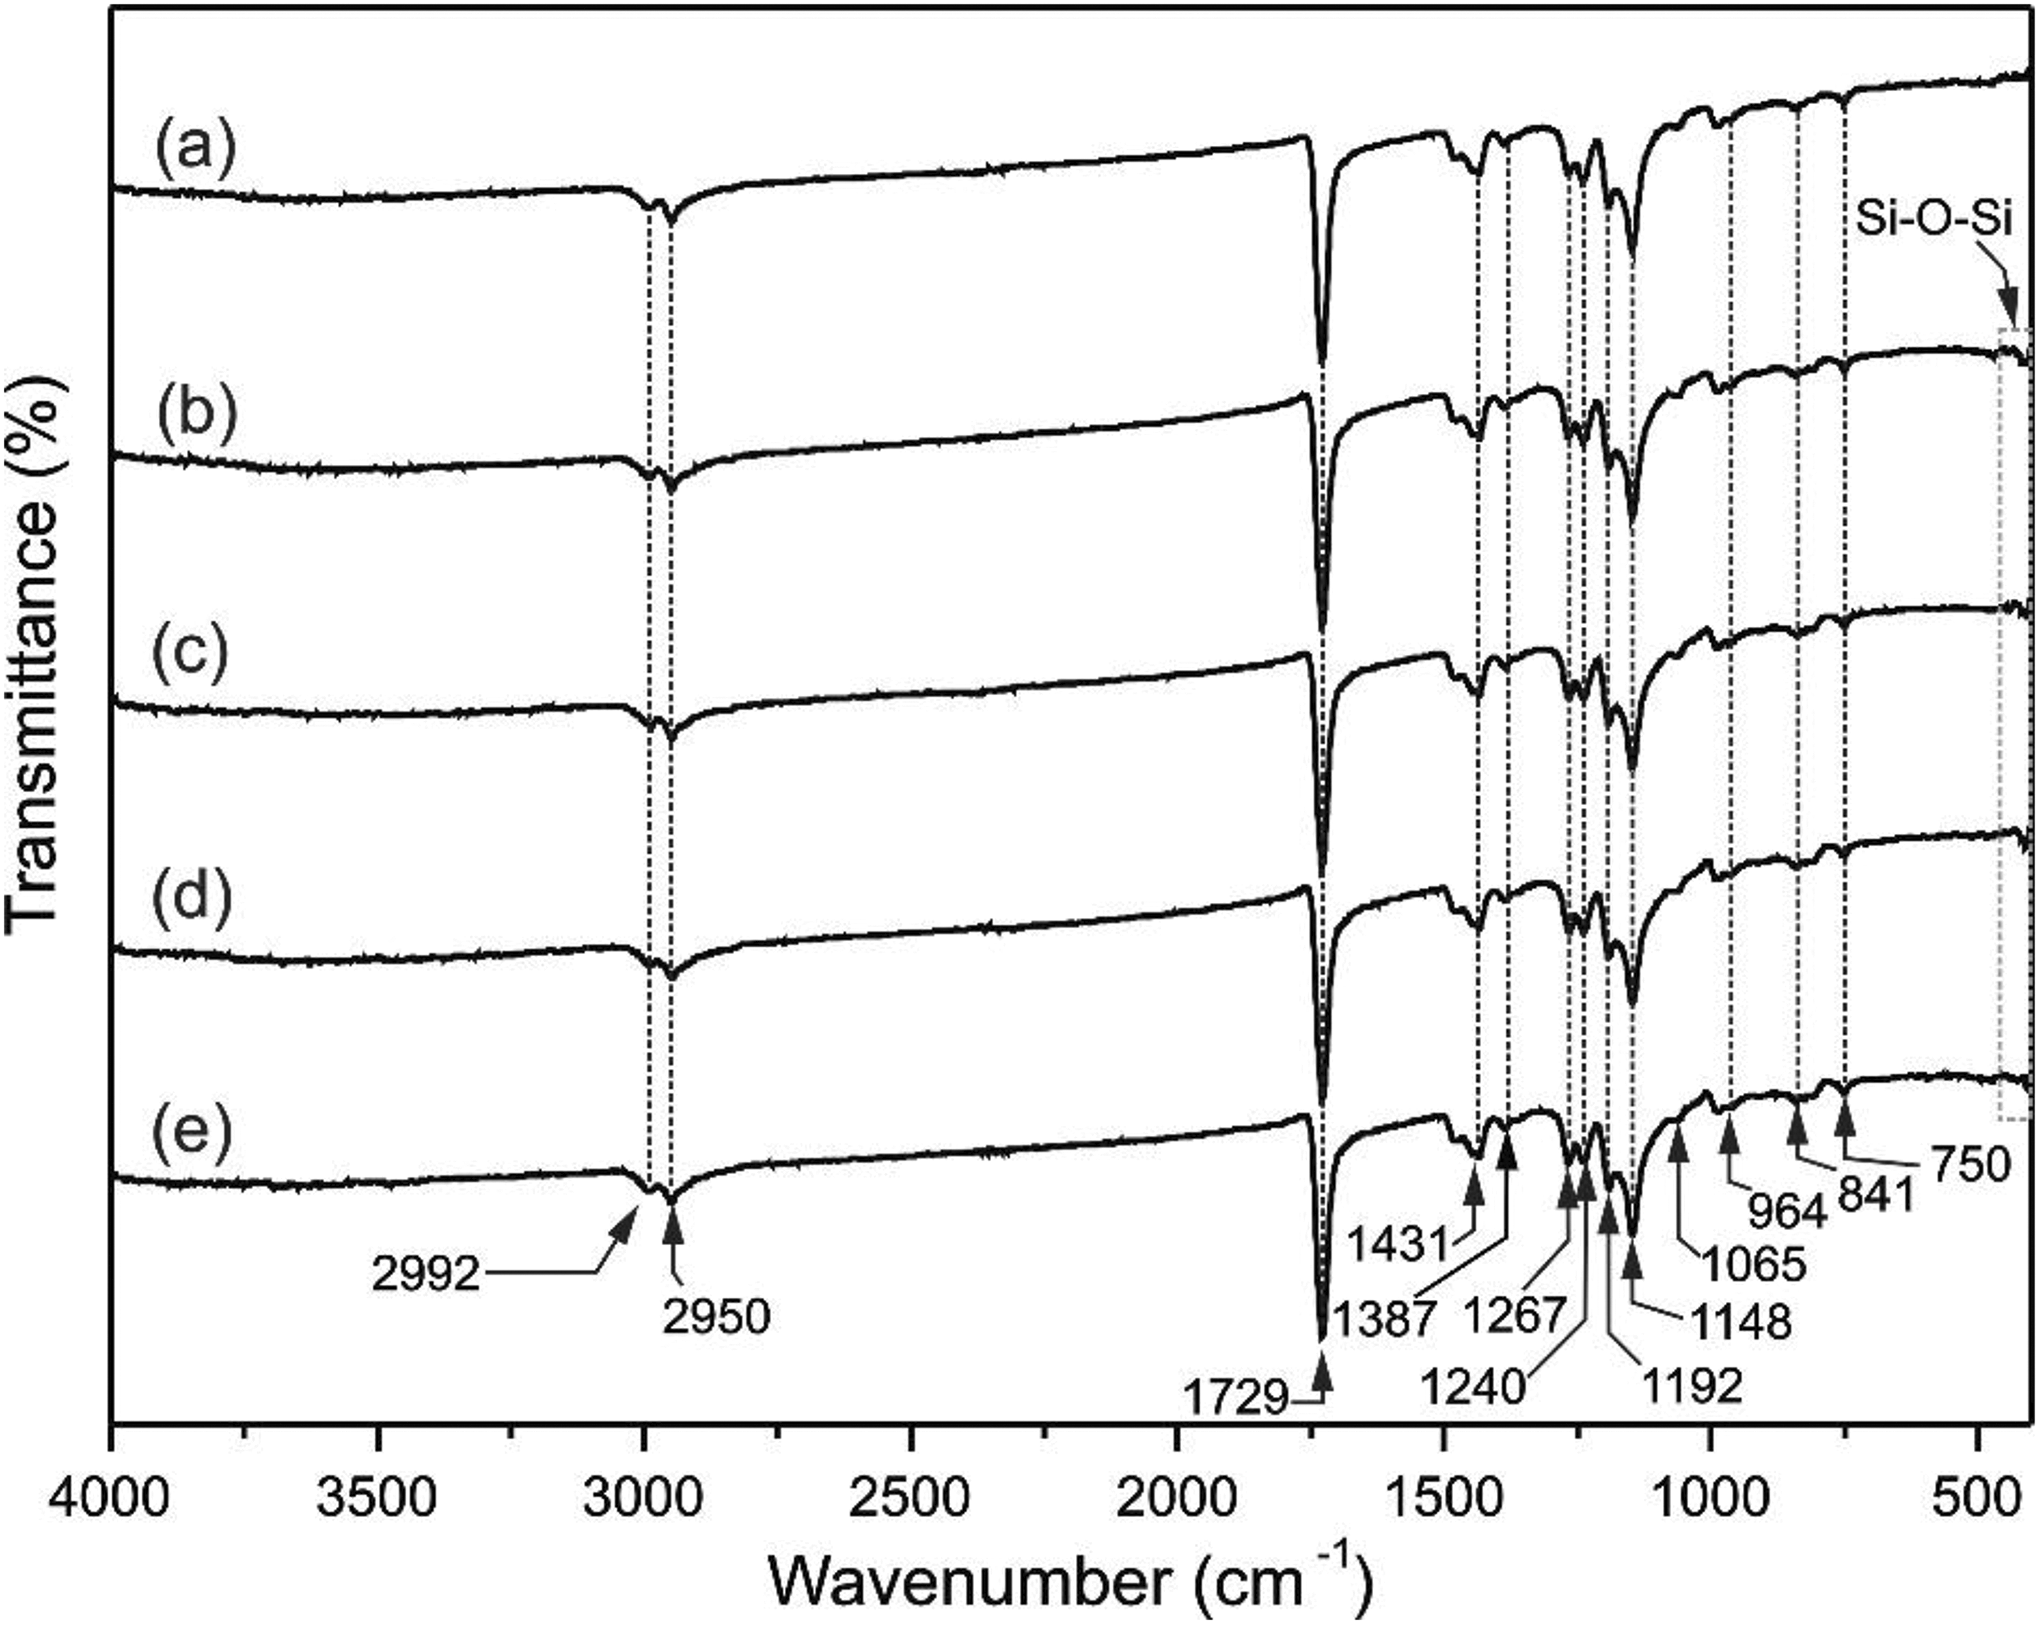
FTIR spectrum of (a) specimen 0, (b) specimen 1, (c) specimen 2, (d) specimen 3, and (e) specimen 4.
Scanning electron microscopy–energy-dispersive spectroscopy
Table 3 presents the nominal chemical composition of the specimens on the surface. The presence of gold is appreciated because all the polymer matrices were coated with this element for the observations with SEM, the presence of Si on the surface of the samples containing PMMA/SiO2 was also determined, which verifies the results obtained in FTIR. Oxygen and carbon were observed in all samples due to the chemical structure of the PMMA matrix. The region where the EDS pattern was obtained is shown in Figure 4.
Chemical composition of the PMMA and PMMA/SiO2 specimens (wt%).
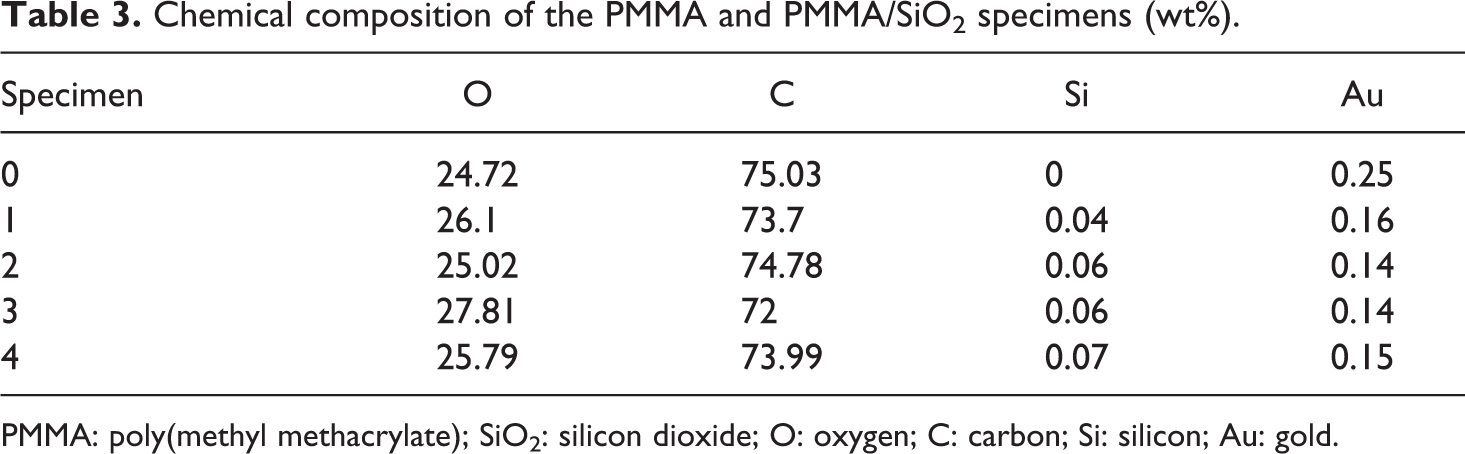
PMMA: poly(methyl methacrylate); SiO2: silicon dioxide; O: oxygen; C: carbon; Si: silicon; Au: gold.
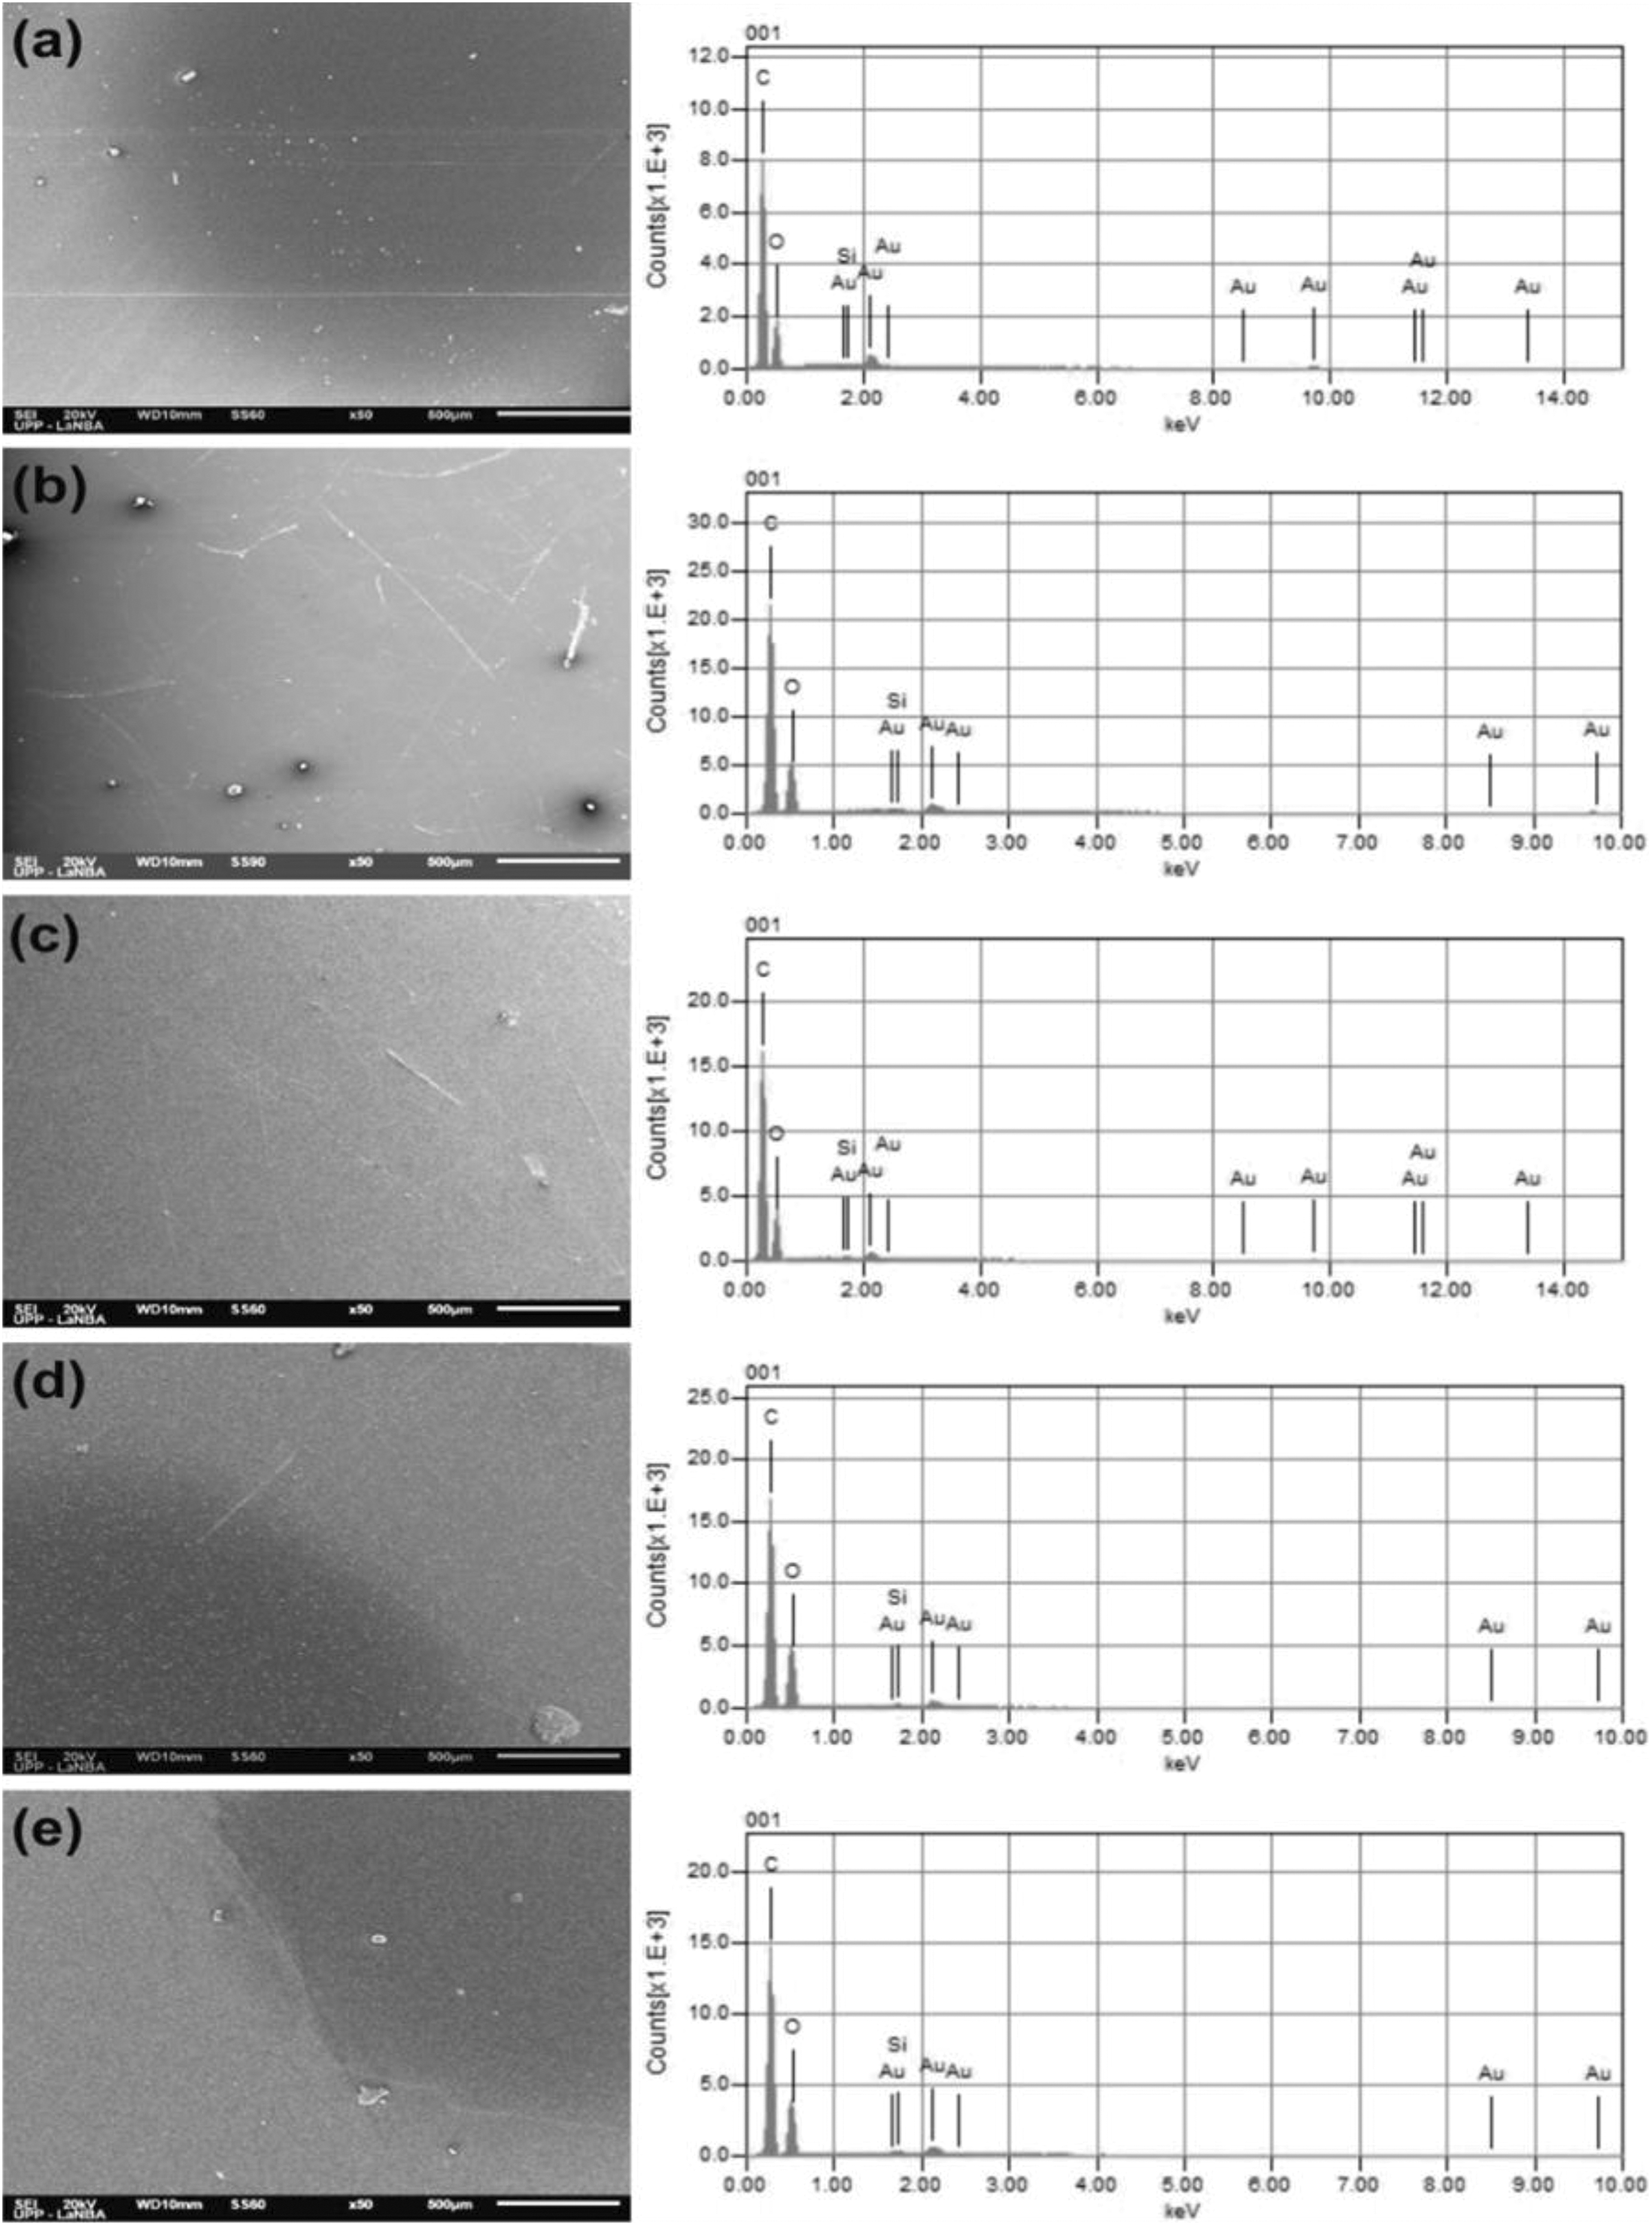
EDS pattern of (a) specimen 0, (b) specimen 1, (c) specimen 2, (d) specimen 3, and (e) specimen 4.
The surface of the specimens was observed by SEM, as shown in Figure 5. It is observed in Figure 5(a) that the specimen 0, which corresponds to the polymer matrix of PMMA, showed a highly homogeneous surface. The surface of specimens 1 (0.3-g hydrophobic nanoparticles of SiO2) and 2 (0.3-g hydrophilic nanoparticles of SiO2) that are shown in Figure 5(b) and (c), respectively, presented a homogeneous surface with minimal irregularities, while the specimens 3 (0.27-g hydrophobic and 0.03-g hydrophilic nanoparticles of SiO2) and 4 (0.03-g hydrophobic and 0.27-g hydrophilic nanoparticles of SiO2), corresponding to Figure 5(d) and (e), respectively, exhibit more pronounced irregular regions that can modify the behavior of the water in contact with the surfaces. 19
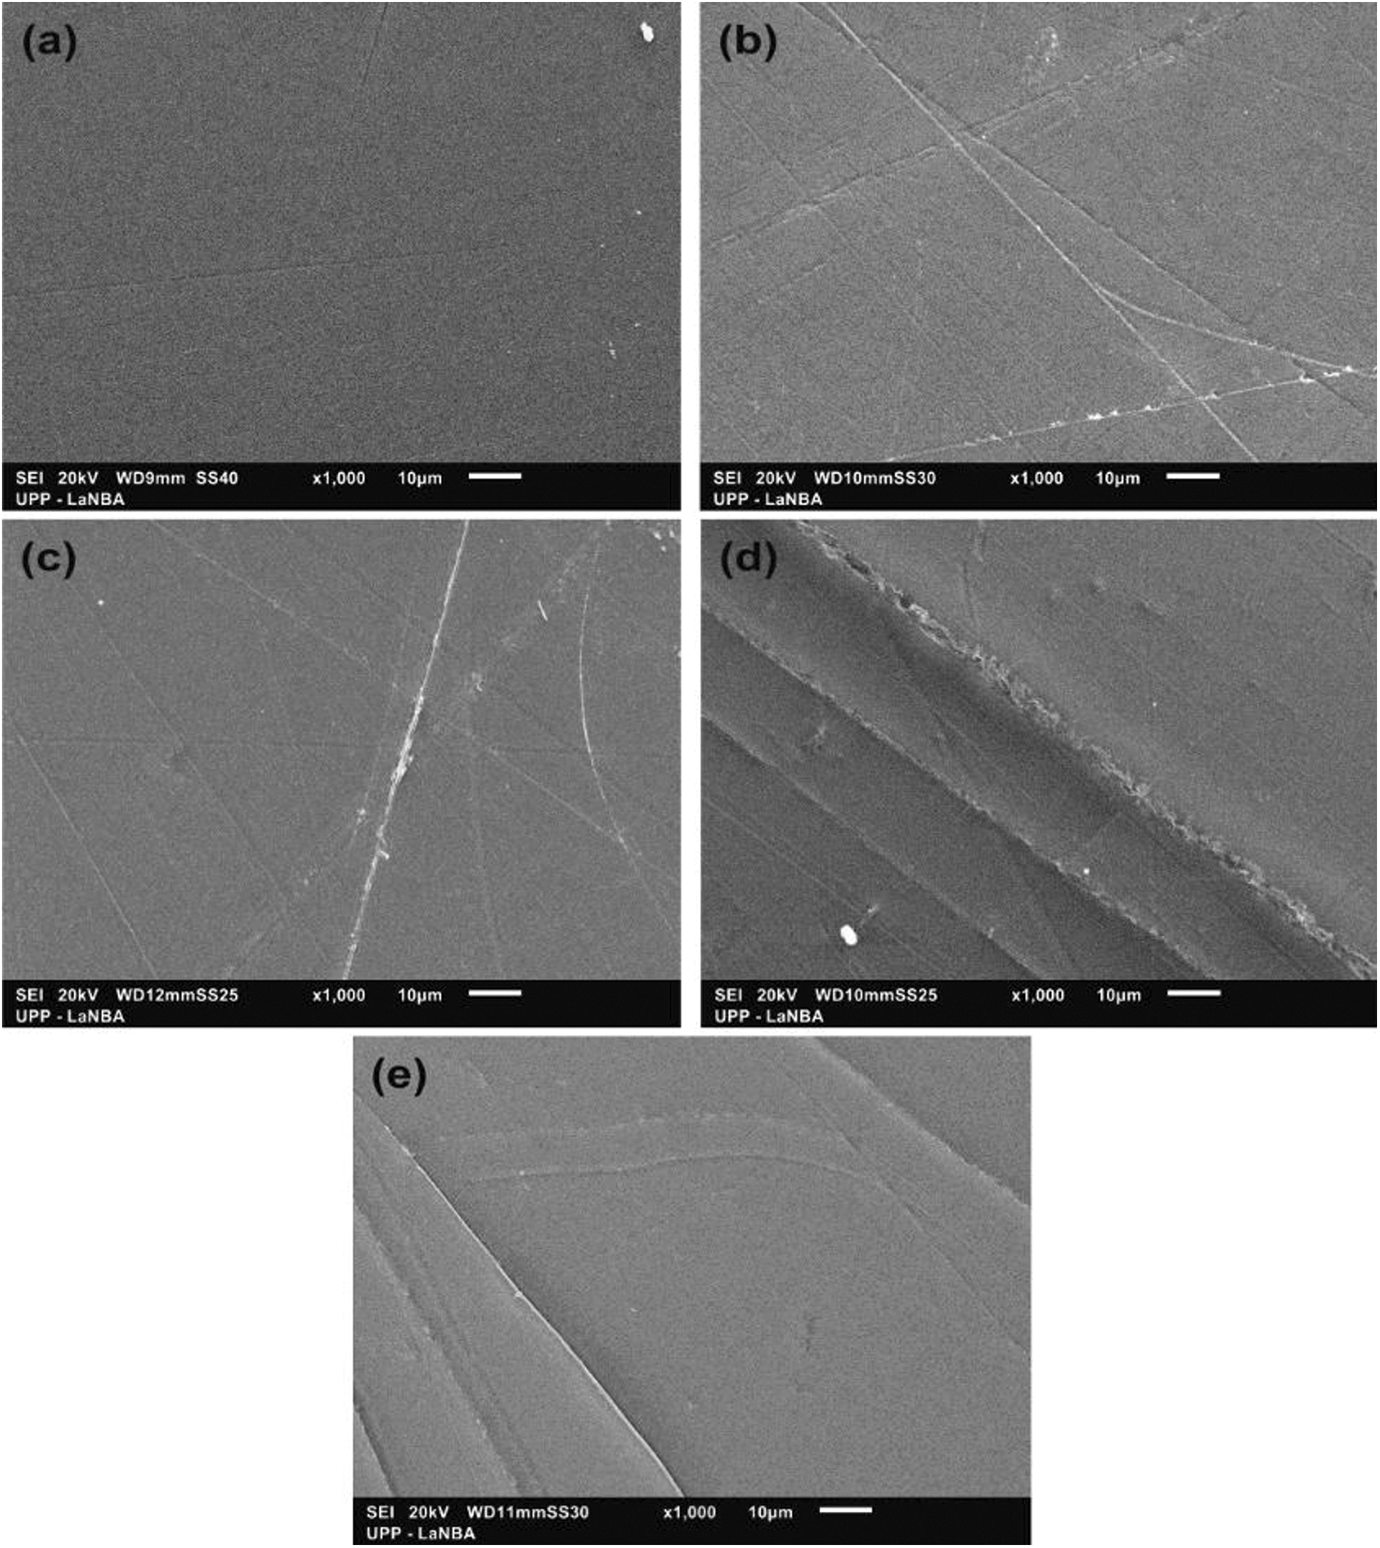
SEM images of the surface of (a) specimen 0, (b) specimen 1, (c) specimen 2, (d) specimen 3, and (e) specimen 4.
Contact angle
Figure 6 shows the water drop and the contact angle values on the surface of the reference matrix of PMMA and PMMA with hydrophilic and hydrophobic nanoparticles of SiO2 to different concentrations with a deposition time of 30 s. The specimens showed a hydrophilic behavior (angular contact < 90°) due to the high polarity of the PMMA matrix 20 and the incorporation of the SiO2 nanoparticles. 21 The specimen 0 had the greatest contact angle with a magnitude of 79.41°. An angle of 77.95° was observed in specimen 1 due to the content of hydrophilic nanoparticles of SiO2 in the polymeric matrix. Specimen 2 due to the presence of hydrophobic SiO2 nanoparticles had an angle of 79.13°. In specimen 3, the angle was 79.05°; this is due to the presence of 0.003 g of SiO2 hydrophilic nanoparticles and 0.27 g of hydrophobic nanoparticles in the matrix. Sample 4 contains in the matrix 0.27 g of hydrophilic and 0.003 of hydrophobic nanoparticles, for this reason, an angle of 72.4° was presented, which is the smallest magnitude of all the specimens.
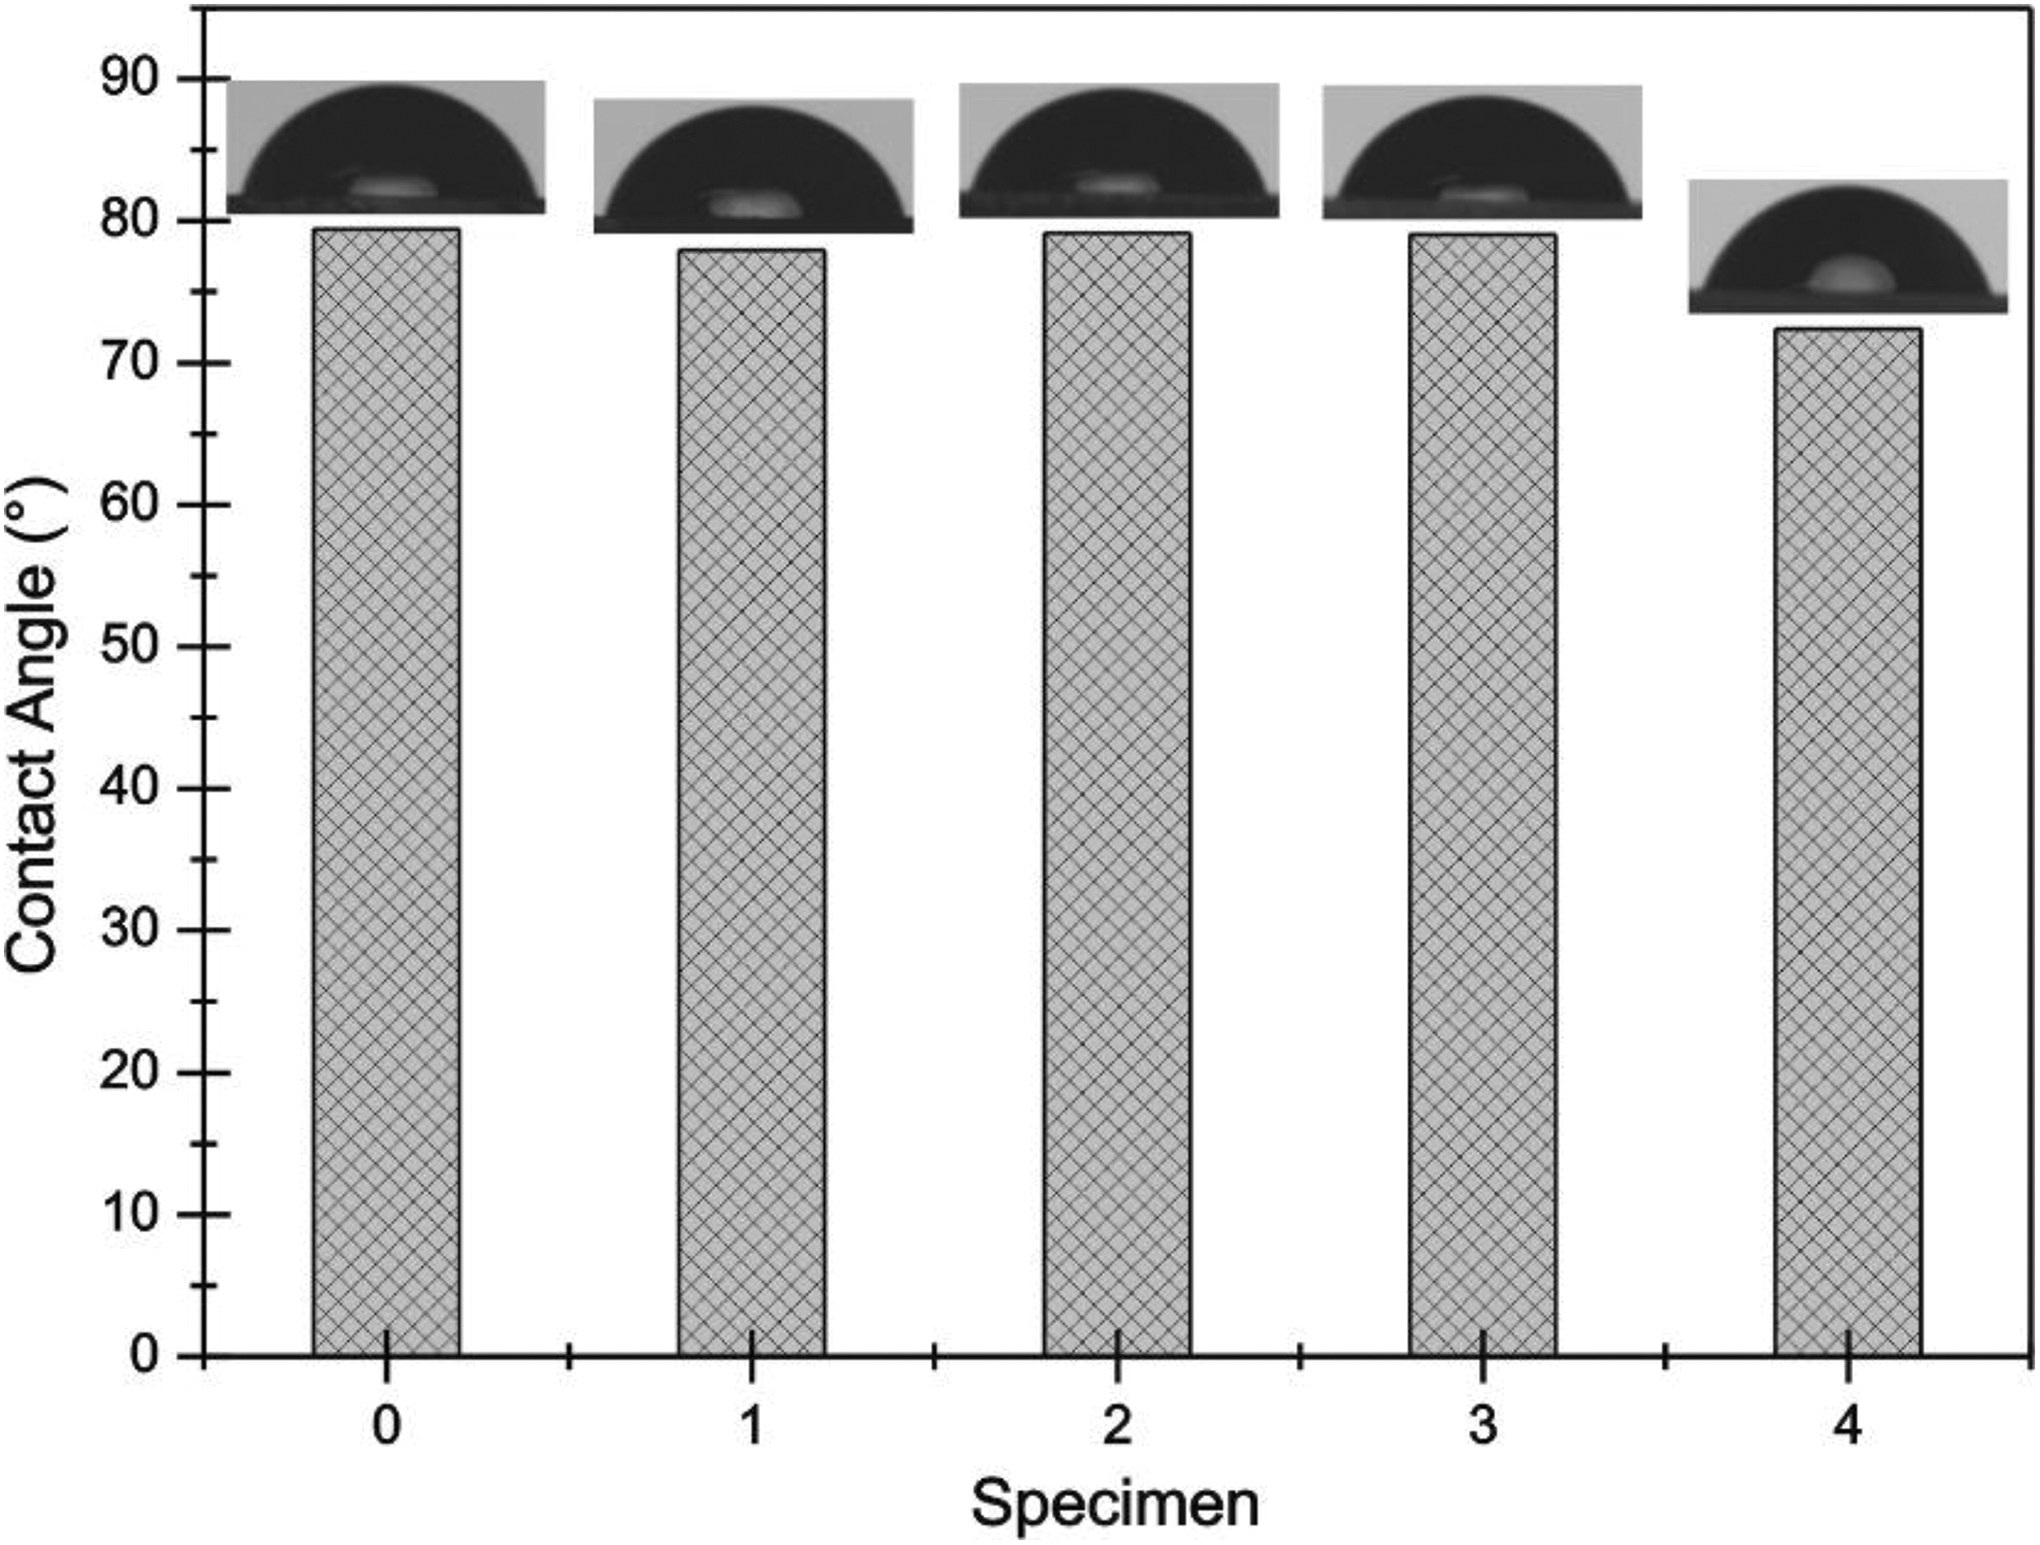
Contact angle of the specimens.
Microhardness and roughness
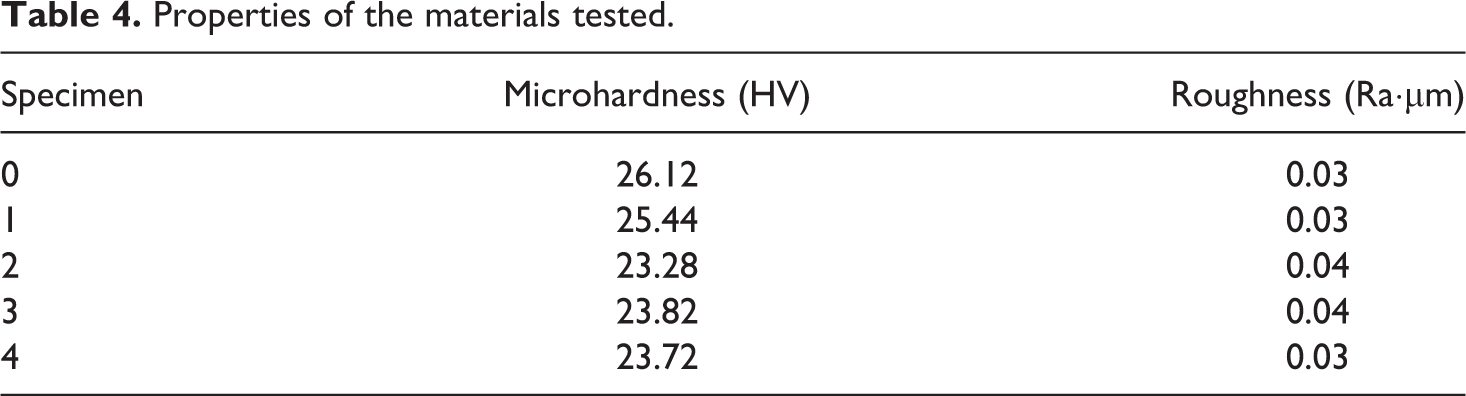
Table 4 presents the average of microhardness and roughness. Due to the process used for the synthesis of the polymers, the surface finish was very similar, resulting in a roughness almost equal for all the specimens. In the case of the hardness, some differences were obtained between the base material (specimen 0) and the specimens with SiO2 nanoparticles. This could be due to the presence of nanoparticles that modified the structure and surface of PMMA. In most of the cases, the addition of ceramic nanoparticles provides better characteristics in hardness of the base material, but it depends of different factors, for example, poorly dispersed particles, intrinsic affinity among materials, particles chemistry, size, shape, and surface modification. 22
Properties of the materials tested.
Friction coefficient
The coefficient of friction (CoF) was measured at real time in all tests via a load cell. The friction was produced by the contact between the steel ball and specimen. Figure 7 shows the graphic results of CoF from 0 cycle to 9000 cycles (for each test). Specimen 0 (base material) had a regular behavior, showing an average value of 0.06. During the first 1000 cycles, the CoF showed a decrease from 0.18 to 0.06, and then it was stabilized (see Figure 7(a)). Specimen 1 (hydrophilic 0.3 g) with a CoF average value of 0.12 had an irregular increase (0.18) between 5700 cycles and 6100 cycles, due maybe to the presence of PMMA debris trapped in the contact area (see Figure 7(b)). Specimens 2 to 4 have a similar behavior shown in Figure 7(c) to (e), respectively. The respective CoF was 0.08, 0.07, and 0.05. These results show the presence of SiO2 nanoparticles in the PMMA matrix, decreasing a little bit the CoF.
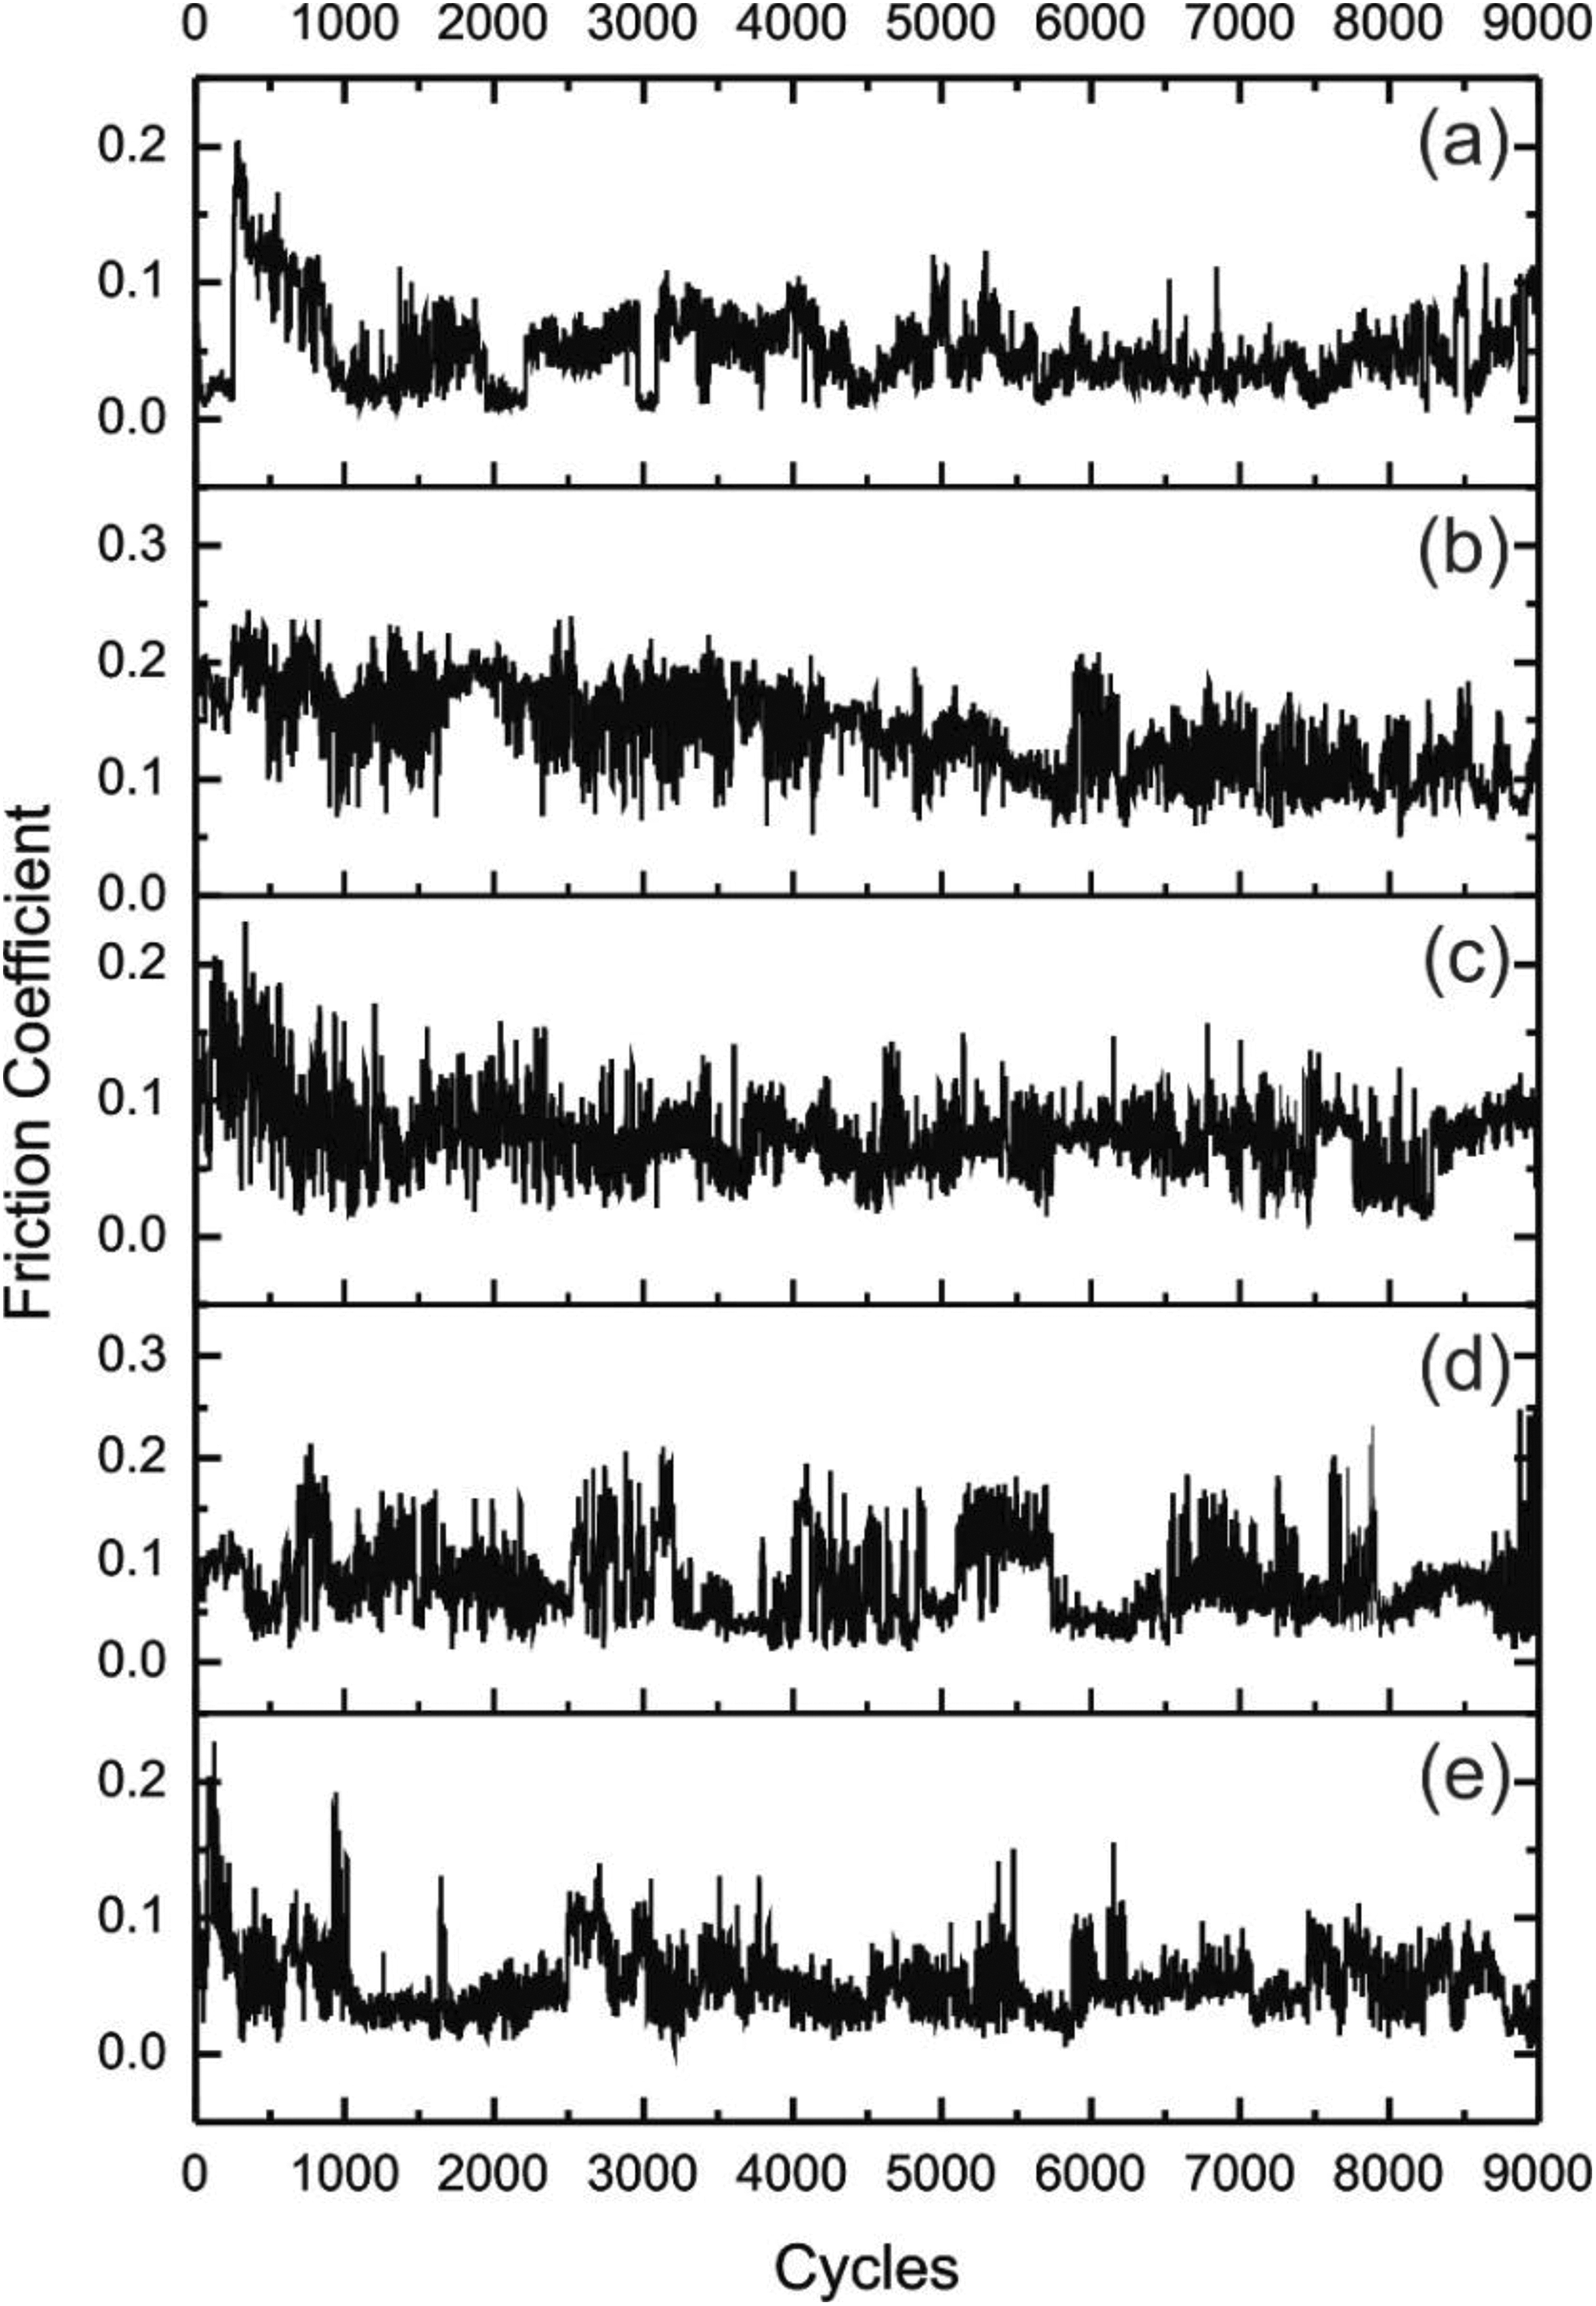
Variation of friction coefficient. (a) Specimen 0 (Avg. 0.06), (b) specimen 1 (Avg. 0.12), (c) specimen 2 (Avg. 0.08), (d) specimen 3 (Avg. 0.07), and (e) specimen 4 (Avg. 0.05).
Optical microscopy, profilometry, and SEM of scars
The surface was cleaned before the observations, and no filter was used. Figure 8 shows the wear scars produced on the surface of the specimens tested and its respective profile. The main wear mechanisms found in the specimens were adhesion wear, plastic deformation, ploughing, and pitting. Specimen 0 (see Figure 8(a)) presents defined sliding lines in both sides of the scar. This probably was produced by the PMMA debris trapped in the contact causing ploughing action combined with plastic deformation and some pitting zones. For specimens 1 to 3, there was no plastic deformation, but adhesion and pitting were found. Particularly, in specimen 1, some ploughing was observed on one side of the wear scar. In the case of specimen 4 (see Figure 8(e)), mainly plastic deformation was observed combined with some pitting around the scar. It is important to note that the base material (specimen 0) was the only one that had severe plastic deformation combined with sliding lines. As can be seen, most of the wear scars were well-defined, and this helps to measure their dimensions, including the average depth. Despite the great difference in hardness of the ball (steel) and specimen (polymer), the wear scars were not produced as rapid and their size was not as big as expected.
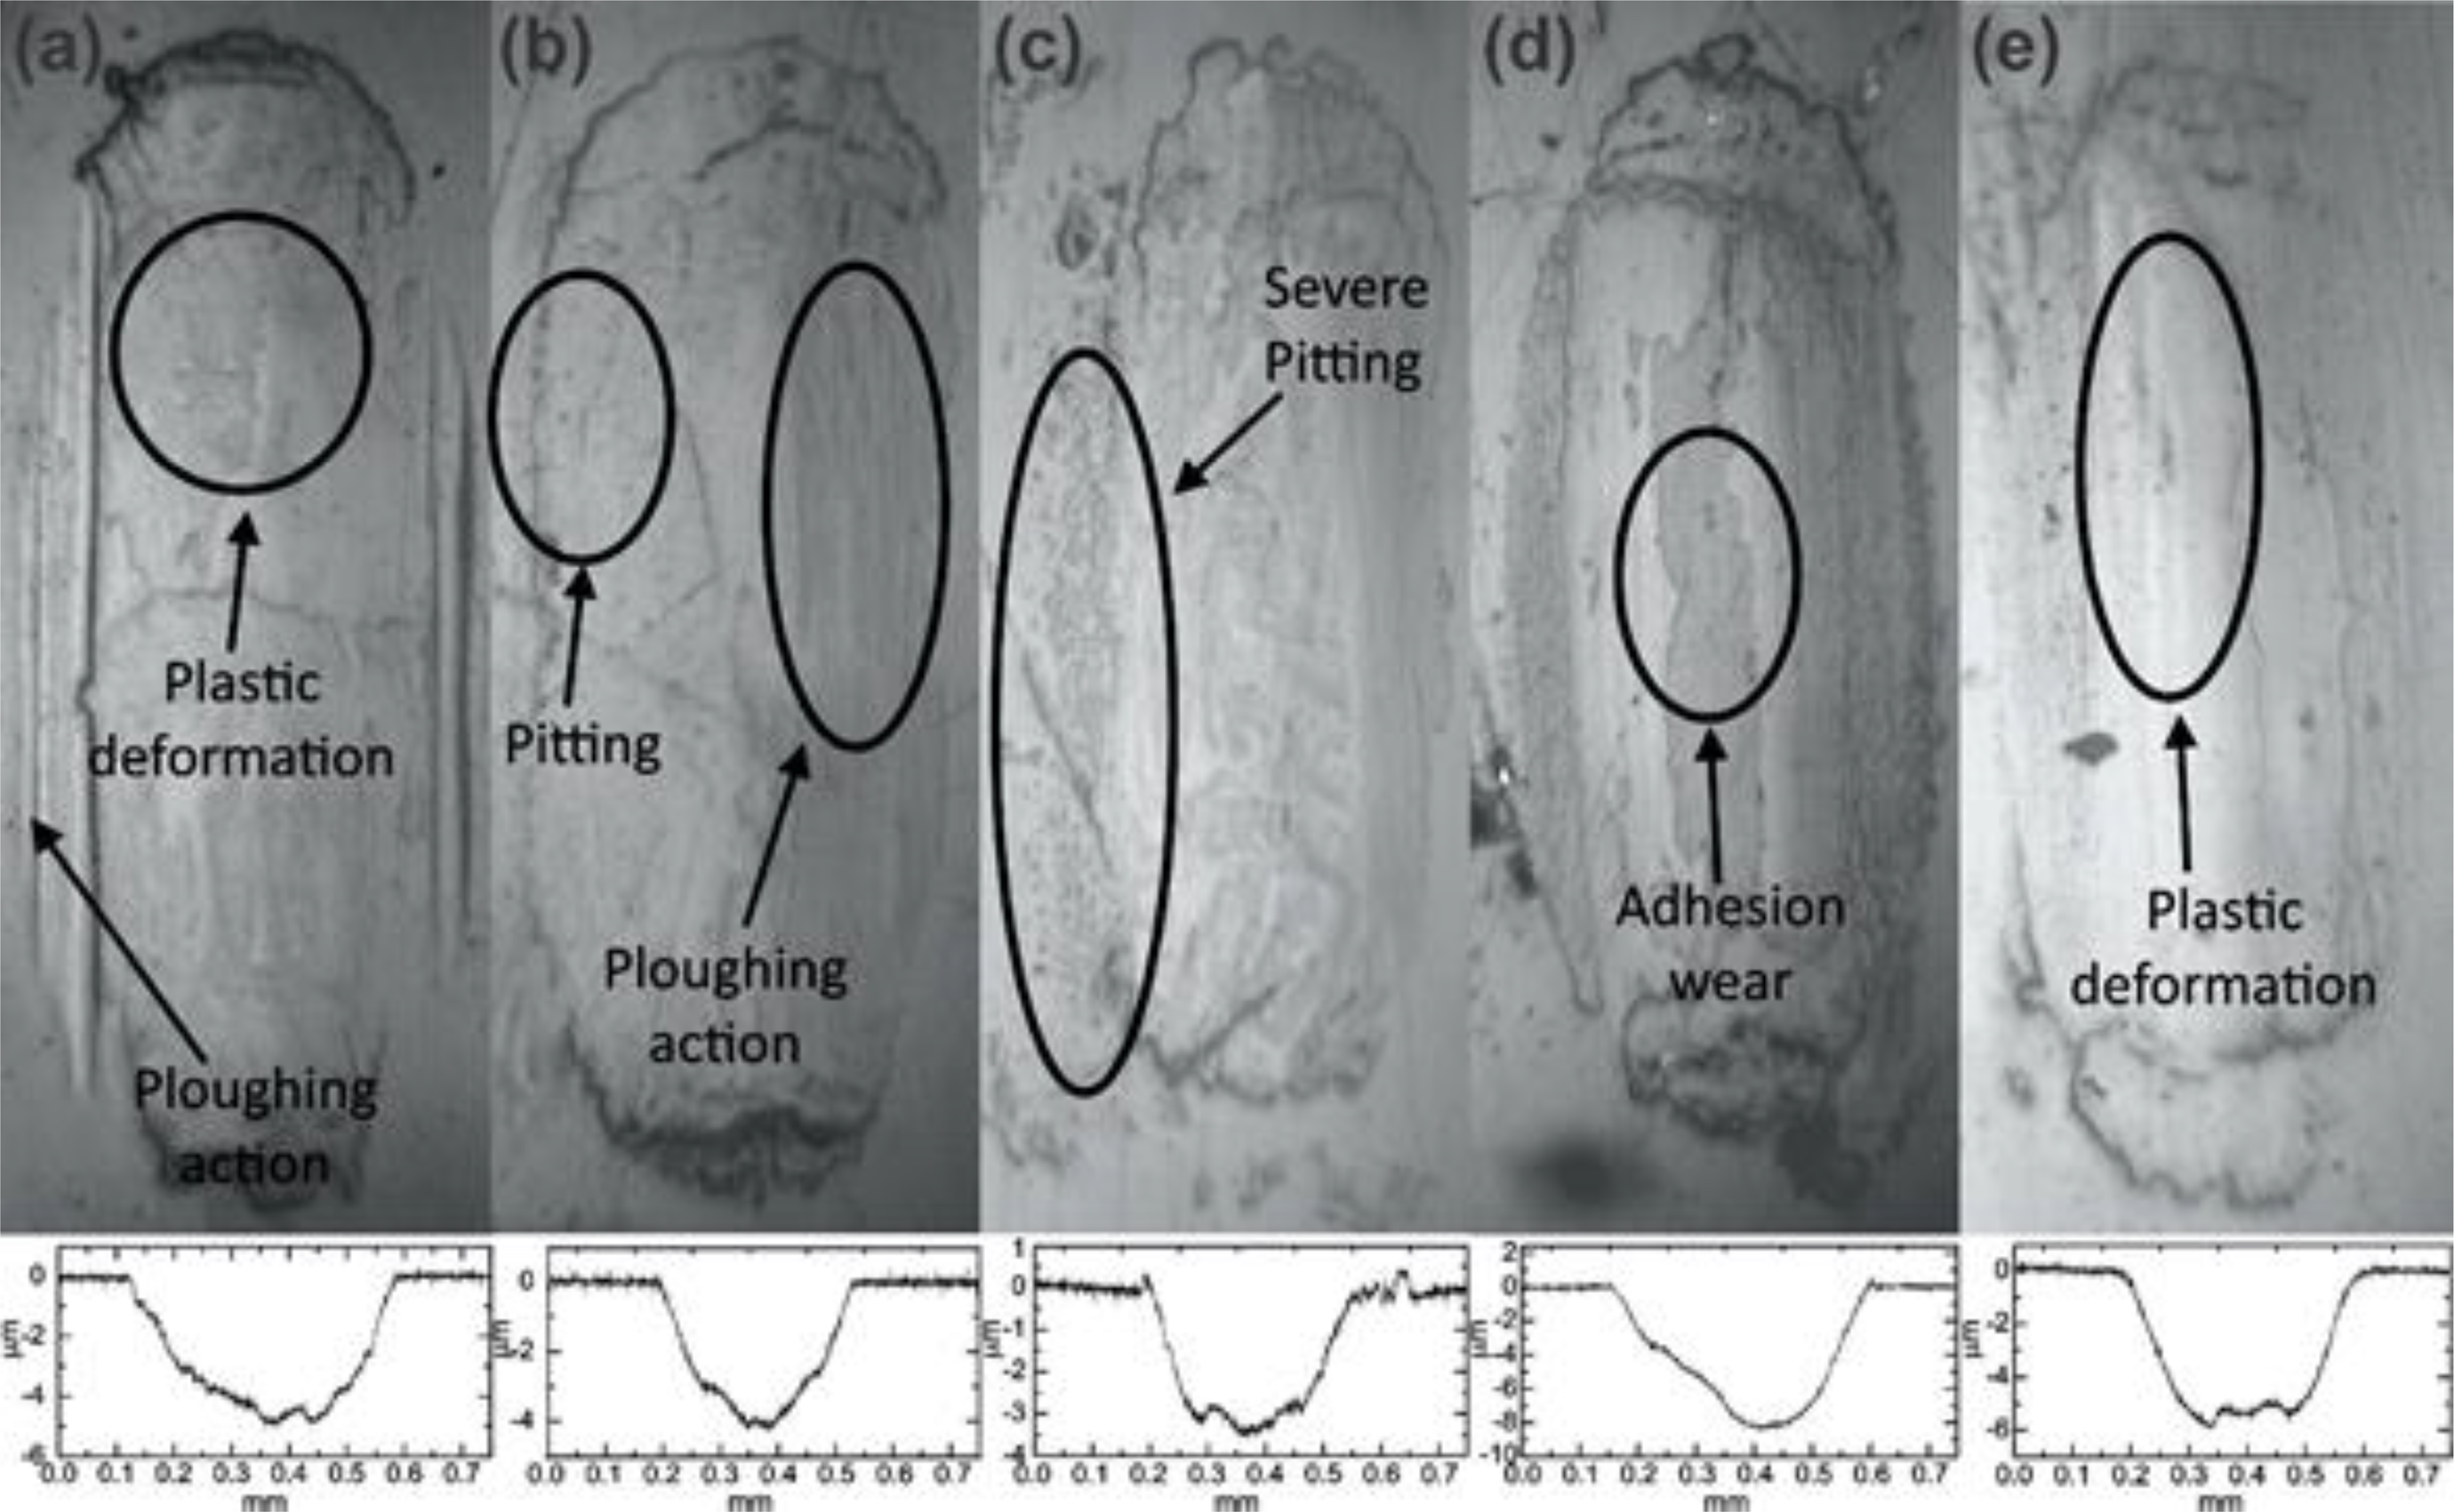
Optical microscopy and profilometry. (a) Specimen 0, (b) specimen 1, (c) specimen 2, (d) specimen 3, and (e) specimen 4.
SEM micrographs of specimens are shown in Figure 9. These micrographs were taken over wear scars. As can be seen, the specimen 0 shows a severe damage on surface mainly in the ploughing action area. The other specimens evidence the presence of pitting, adhesion wear, and scratching lines.
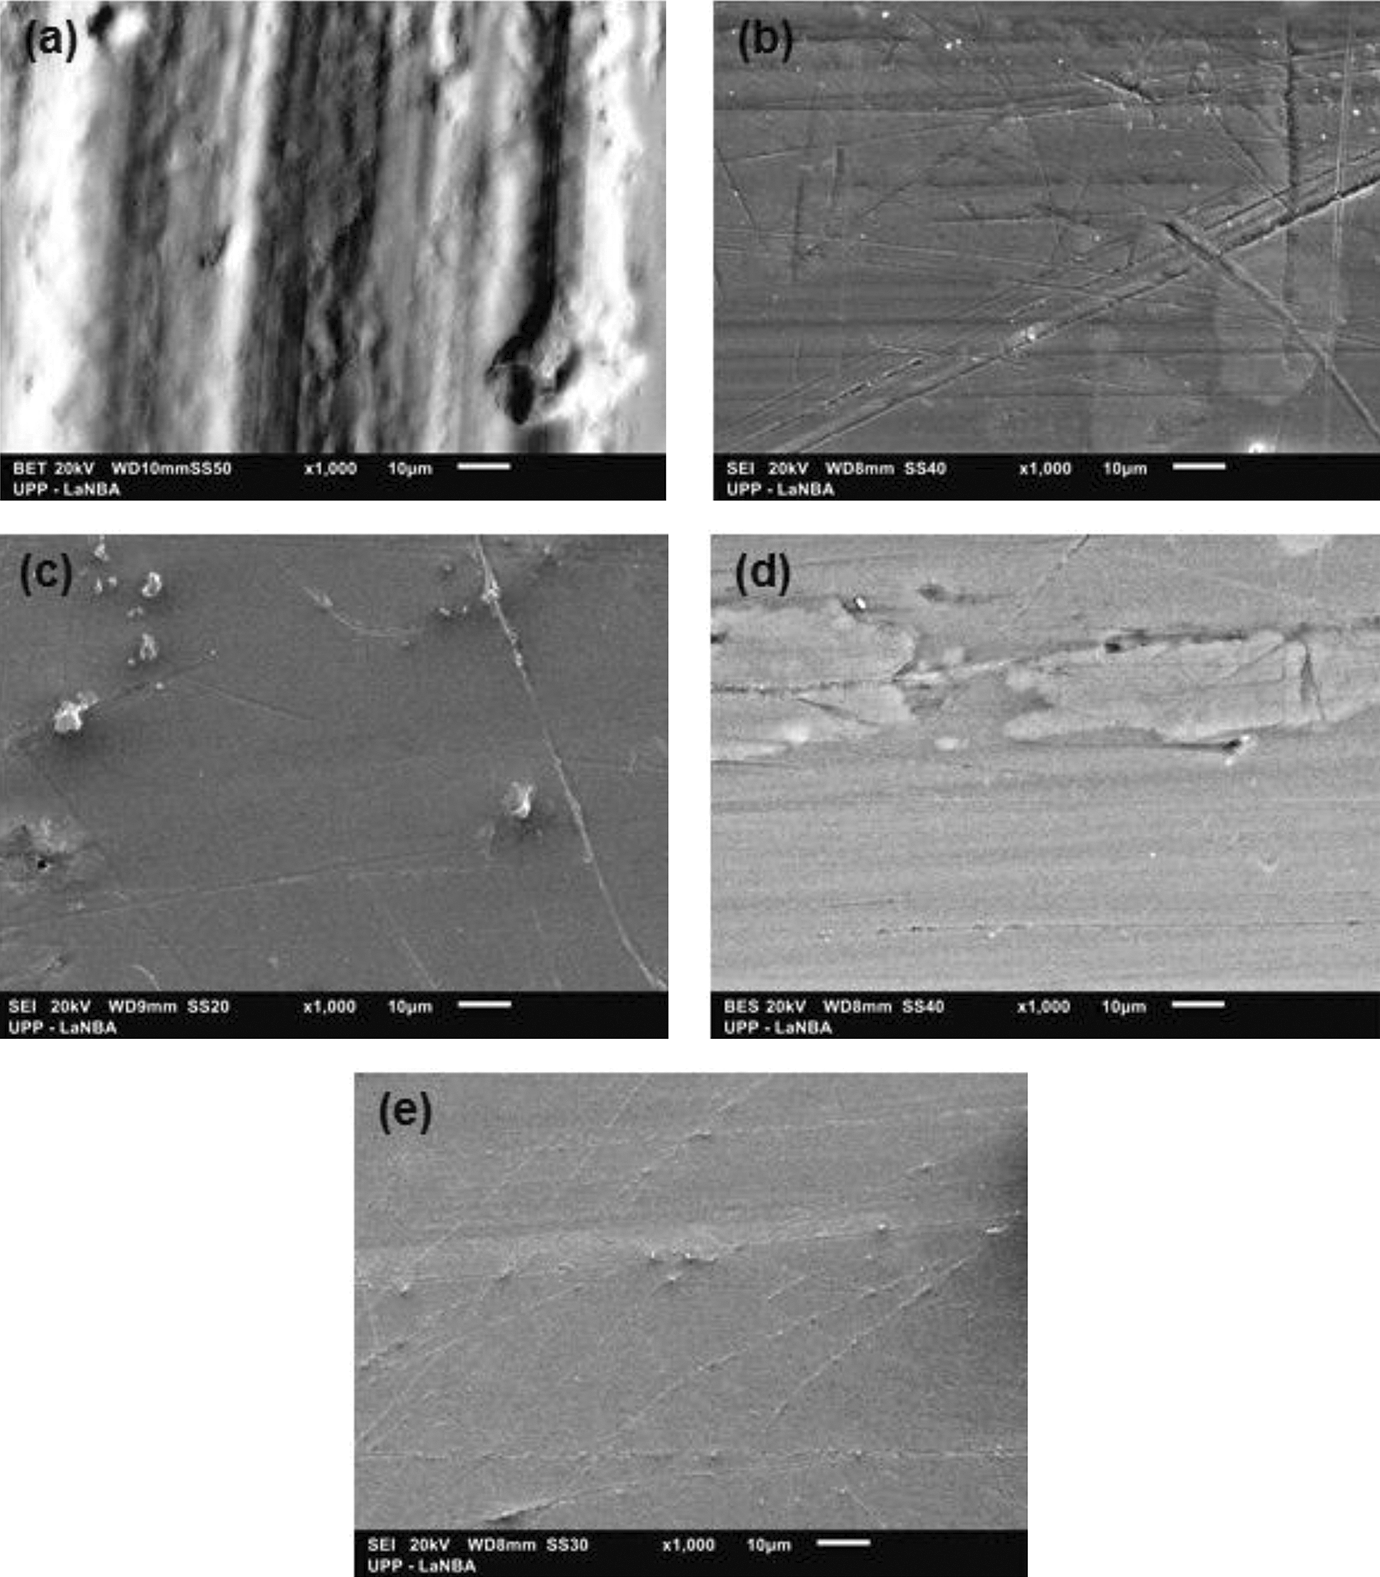
SEM of scars. (a) Specimen 0, (b) specimen 1, (c) specimen 2, (d) specimen 3, and (e) specimen 4.
Wear rate
The tests were performed in a reciprocating tribometer. AISI 52100 steel balls were used to slide against the surface of the PMMA reinforced with SiO2 nanoparticles in wet conditions. The wear on the balls was negligible compared with that on the flat specimens and therefore not measured. The wear tests produced measurable scratches (grooves) on the flat specimens (see Figure 8). The length and width of scratches were measured using a microscope and analysis software for accurate dimensioning. The wear depth of each groove was measured using a Mitutoyo Surftest Profilometer. As the depth varied along the length of the groove, a number of depth measurements were taken and with this information the wear volume was calculated. Finally, using equation (1), the specific wear rate is obtained; (V) is the relation of volume lost, (F n) is the normal load, and (S) is the sliding distance 23

Figure 10 shows the results of specific wear rate for the specimens. Specimen 2 (hydrophobic 0.03 g) has the less wear, while specimen 3 (hydrophilic 0.03 g and hydrophobic 0.27 g) has the greatest wear. There is a little difference in wear rate between hydrophilic and hydrophobic formulae and also between the specimens which combine hydrophilic–hydrophobic formula. The results indicated that the formula which combines hydrophilic and hydrophobic contents did not have a good sliding resistance, if they are compared with the separate formula. On the other hand, when the specimen is hydrophobic (repulse water), the tribology performance was better. The hydrophobic SiO2 nanoparticles tend to reduce the surface tensions of a liquid, 24 which caused the amount of adsorbed water to be lower in these specimens, helping to maintain the contact free of high Hertzian stresses.
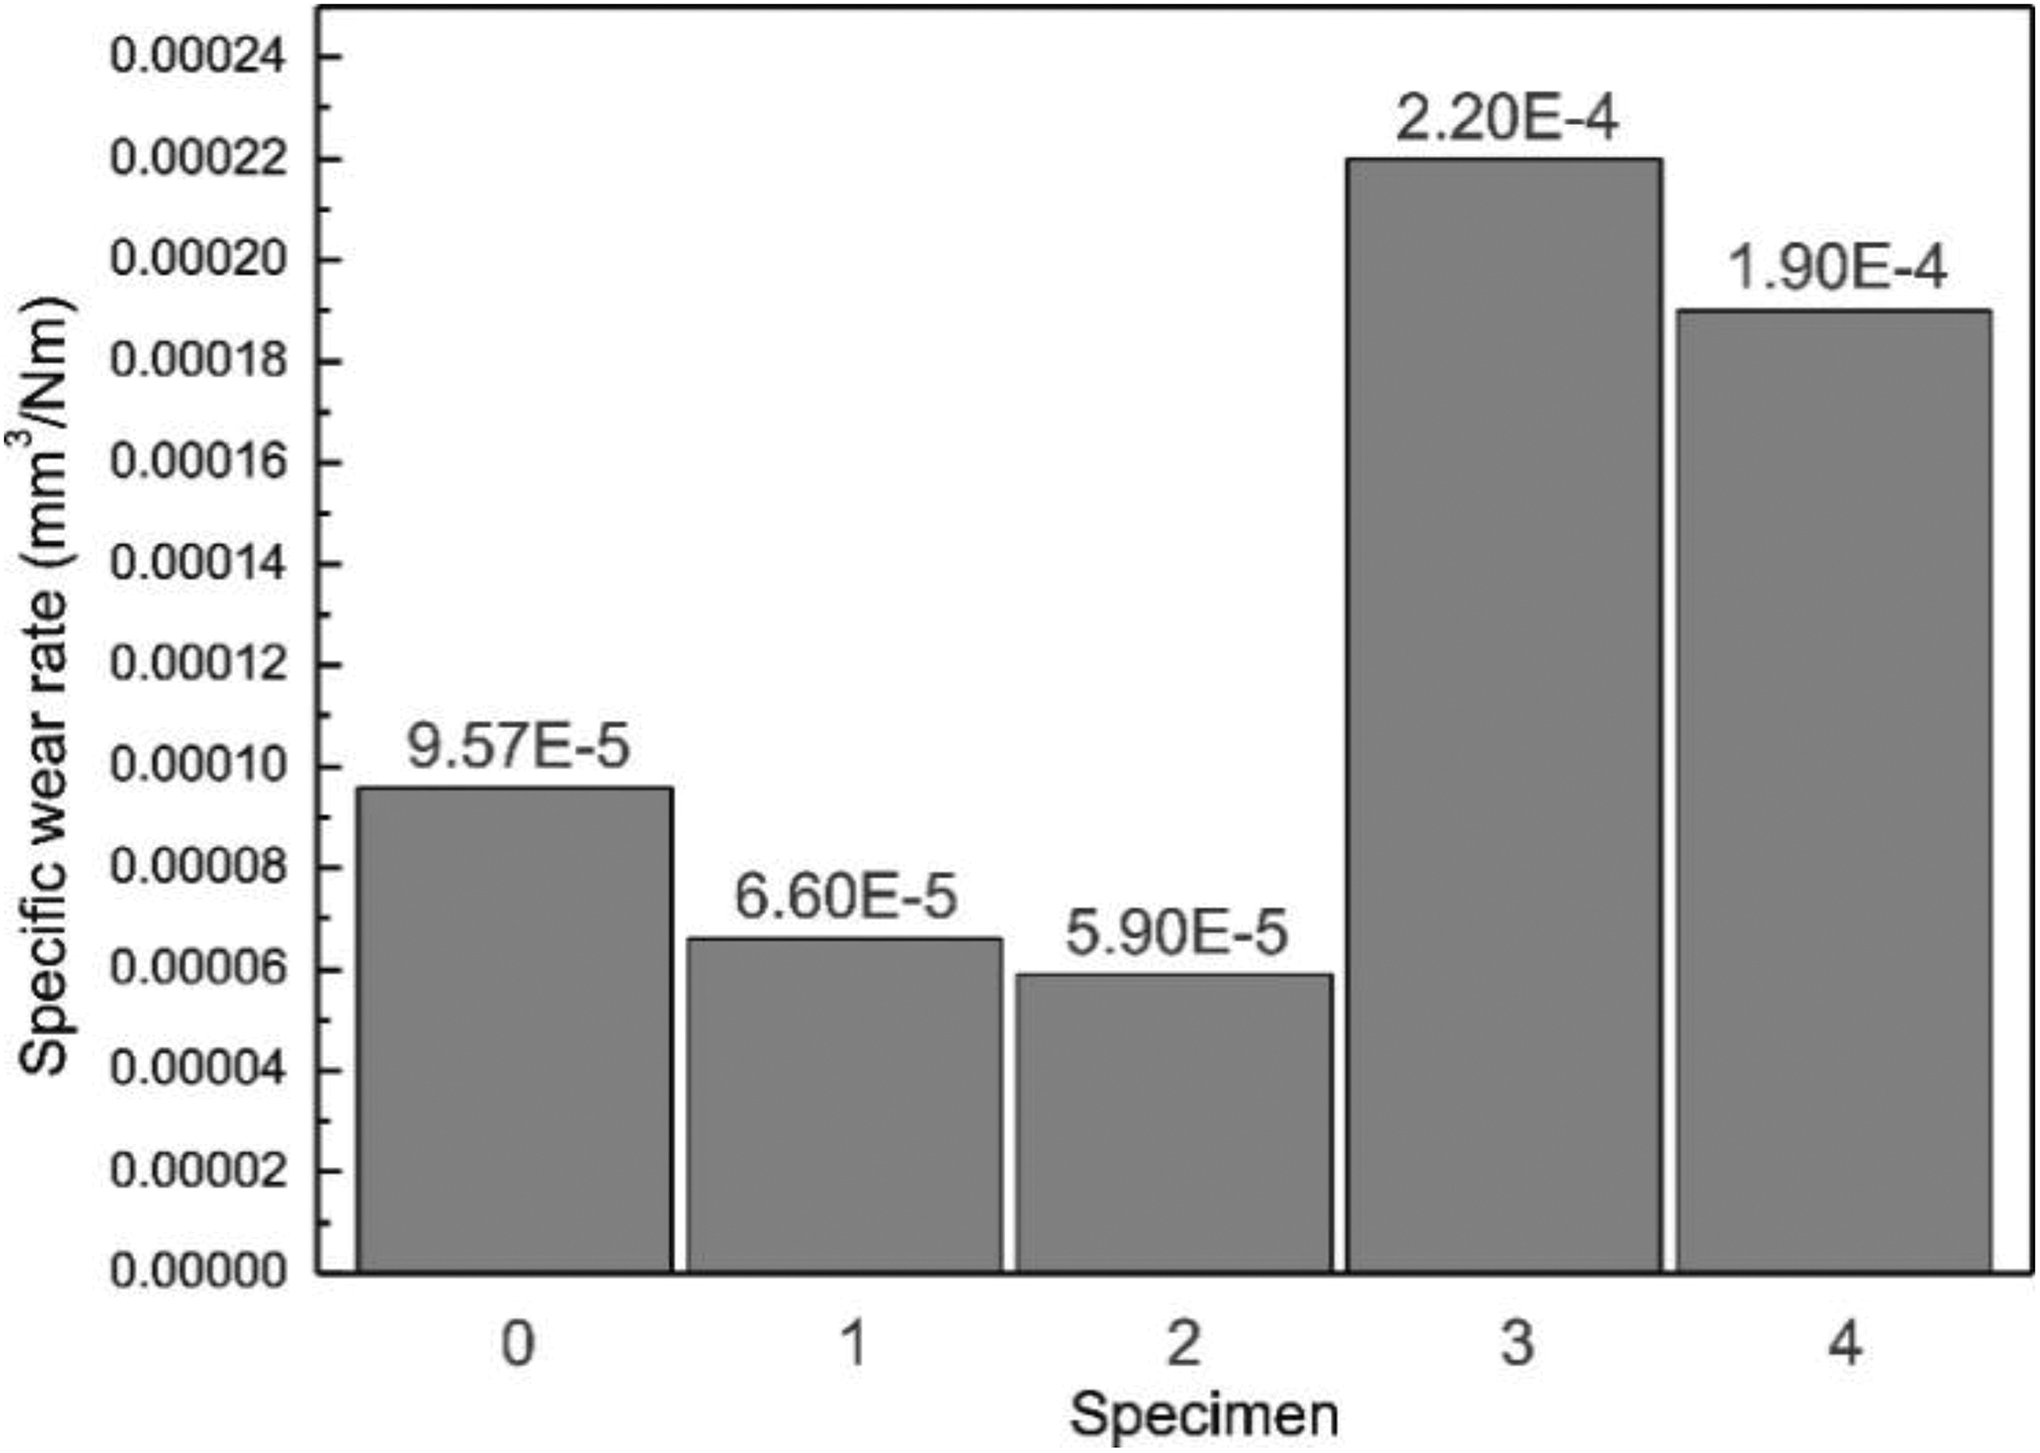
Wear rates of specimens.
Conclusions
The main conclusions of this experimental work are as follows. The specimens showed a hydrophilic behavior (angular contact < 90°) due to the high polarity of the PMMA matrix and the incorporation of the SiO2 nanoparticles. The presence of SiO2 nanoparticles in the PMMA matrix produced a reduction in the CoF compared with base PMMA material. The main wear mechanisms found in the specimens were adhesion wear, plastic deformation, ploughing, and pitting. Specimen 2 (hydrophobic 0.03 g) had the less wear, while specimen 3 (hydrophilic 0.03 g and hydrophobic 0.27 g) had the greatest wear. The results indicated that the formula which combines hydrophilic and hydrophobic contents did not have a good sliding resistance, if they are compared with the separate formula. On the other hand, when the specimen is hydrophobic, the tribology performance was better in the wear sliding conditions tested.
Footnotes
Funding
The author(s) received no financial support for the research, authorship, and/or publication of this article.