
Abstract
The mechanical behaviors of steel strip–reinforced flexible pipe (steel strip PSP) under combined axial extension → internal pressure (T→P) load path were investigated. Typical failure characteristics of pipe samples under pure internal pressure and T→P load path were identified in the full-scale experiments. A theoretical model for pipe under tension load was proposed to capture the relationship between axial extension of the pipe body and stress state of the steel strip. Numerical study based on finite element (FE) method was conducted to simulate the experiment process, and good agreement between FE data and experiment results were observed. Sensitivity study was conducted to study the effect of some key parameters on the pipe antiburst capacities in T→P load path; the effect of preloaded internal pressure on the pipe tensile capacity in P→T load path was also studied. Useful conclusions were drawn for the design and application of the steel strip PSP.
Keywords
Introduction
Pipeline plays an important role in oil and gas transportation system. 1 For the advantage of lightweight, good corrosion resistance, and convenient transportation, composite pipes are experiencing rapid application in onshore and offshore engineering. Compared to reinforced thermoplastic pipe (RTP), the steel strip–reinforced flexible pipe (as its cross-sectional structure is Plastic–Steel–Plastic, this kind of pipe is also referred to as steel strip PSP, see Figure 1 for details.) owns many advantages that RTP does not possess and is drawing much attention in recent years. The most striking feature of this kind of pipe is that its reinforcement layers are helically wound by steel strips layer by layer. This unique feature offers it good performance to undertake external pressure when applied in deeper water, and the lower manufacturing cost of steel strip compared to Kevlar fiber has made it more economical for wide application. Because of the high density of steel material, it is easy to keep the steel strip PSP steady on seabed after deployment with less or even without additional weight coating. As pipe–soil interaction is capable of providing the resistance of pipeline moving on seabed, this kind of pipe is a very promising solution for the issue of on-bottom stability (OBS). 2
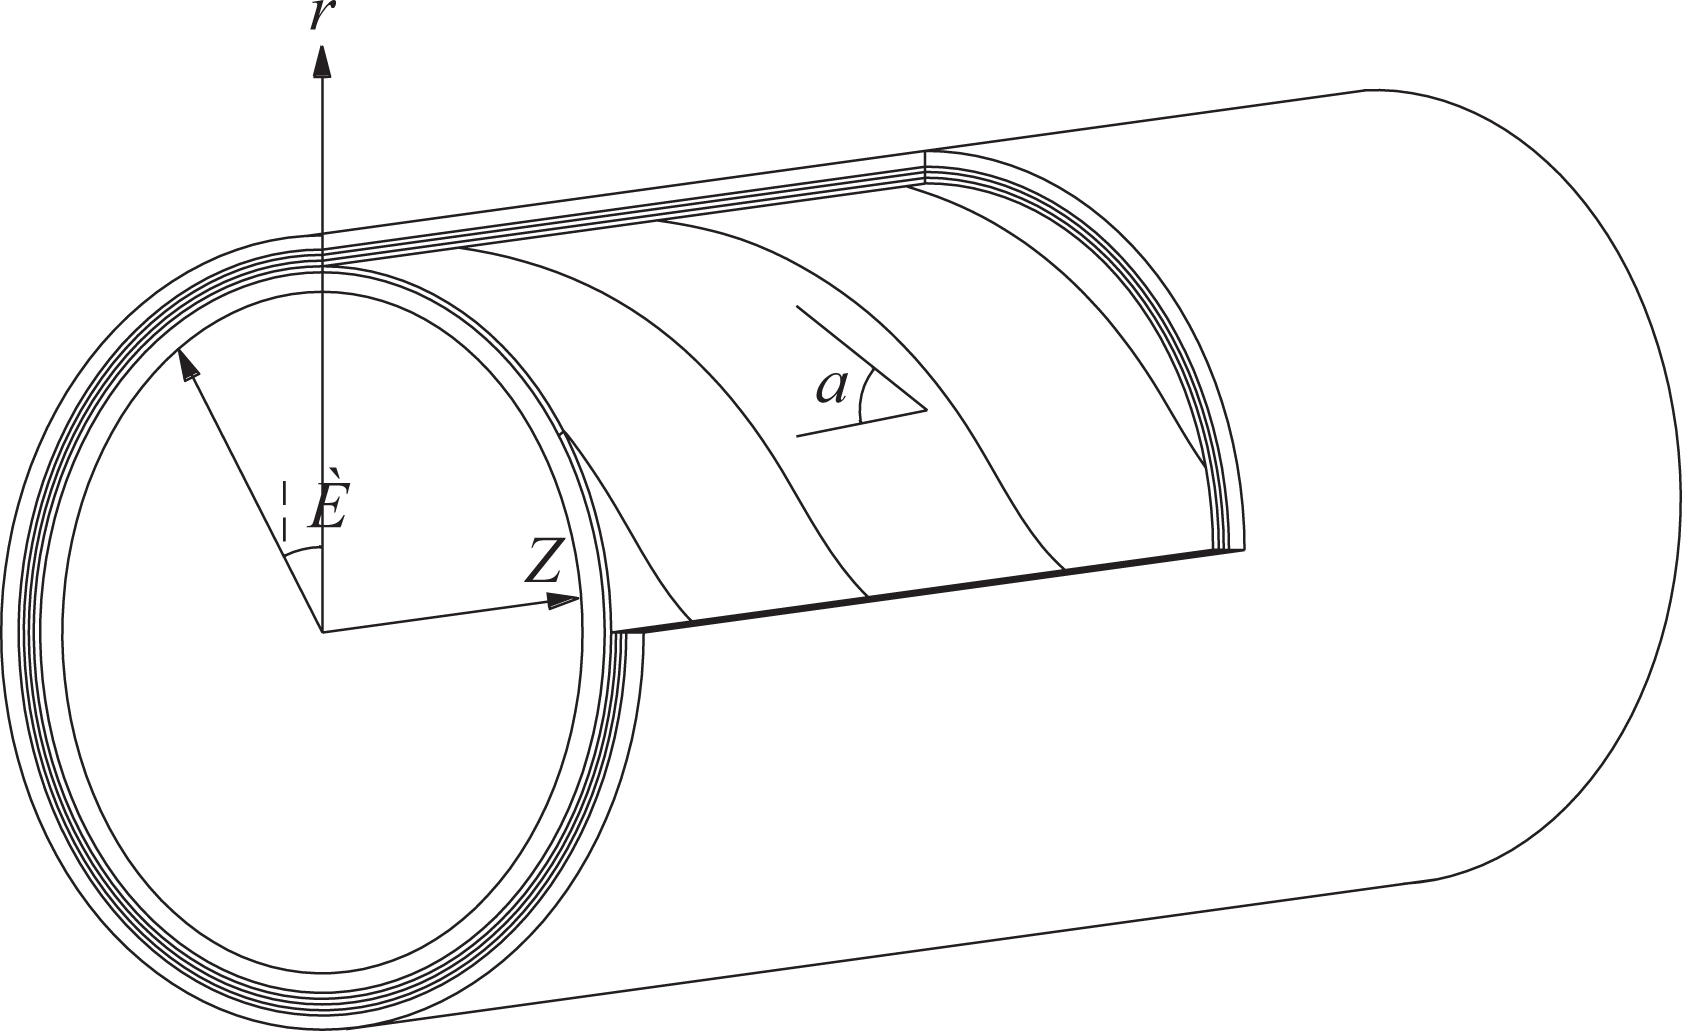
Schematic illustration of steel strip–reinforced flexible pipe.
When deployed, the pipe may subject to various loading conditions. 3 The transported oil/gas may bring about internal pressure that acts upon the pipe, Chen and coworkers discussed the mechanical properties of steel strip PSP under internal pressure based on classic elastic theory. 4 Apart from this, ocean current-induced tension load, seabed movement-induced bending load, and inherent external hydraulic pressure are other problems that need to be considered in the offshore pipeline system. Great efforts have been devoted to analyze the mechanical behavior of composite pipes that have similar cross-sectional structure as steel strip PSP under such load cases. Bai et al. developed a new model to study the mechanical behavior of RTP under tension load, and this model can take into account the interaction between high-density polyethylene (HDPE) and Kevlar wires as well as the material nonlinearity, and based on the principle of stationary potential energy, the equilibrium equations are set up and further solved with Newton–Raphson method. 5 Svein Savik presented a formulation for predicting the dynamic stresses of tensile armor in un-bonded flexible pipe under bending load, two ways are proposed in this article to treat the shear interaction between layers, and finally experimental studies applying fiber-optic Braggs are presented to validate the performance of the formulations. 6 Based on the numerical 2-D ring model, Bai et al. analyzed the mechanical behavior of steel wire–reinforced plastic pipe (PSP) under external hydrostatic pressure by taking into account the wall thickness change, transverse shear deformation, and prebuckling deformation. The external pressure–ellipticity and external pressure–hoop strain curves derived from the theoretical method and finite element (FE) method are compared and show good agreement with each other. 7
Combined loading conditions is another issue that needs to be tackled in subsea pipeline system. Many articles can be found in this aspect. Bai et al. developed a 2-D theoretical model to study the mechanical behavior of RTP under combined external pressure and tension. The external pressure–ovalization and external pressure–axial strain relations under T→P loading path (first tension and then internal pressure loading) are analyzed. Further, their group conducted some additional parametric studies and presented T→P and P→T collapse interaction envelopes. 8 Mohamadi and Heshmati analyzed the failure of glass-reinforced plastic (GRP) mortar pipe with different cores subjected to pure and combined loading conditions. Maximum normal stress, Tsai–Wu and Tsai–Hill criteria are employed for the failure analysis. 9 Rafiee studied the failure of filament-wound GRP pipes with experimental and theoretical methods and revealed that netting analysis that is widely used in GRP pipe industries cannot predict hoop and longitudinal strengths appropriately. Consequently, they developed a sequential failure model to account for Last Ply Failure (LPF) in GRP pipes considering sand layer. 10 In another paper, Rafiee and Amini presented a progressive modeling procedure to predict the functional failure pressure of GRP pipes, which could take into account material degradation. 11 This model was applied to simulate and analyze the functional failure in composite pipes subjected to internal hydrostatic pressure which could take into account the influence of the incorporated core layer. It is observed that first-ply-failure (FPF) and functional failure (FF) pressures increase linearly with increasing the core thickness. 12
In this article, the mechanical properties of steel strip PSP under combined axial extension and internal pressure are studied. Based on the theory initiated by Knapp 13 and experiment data, the feasibility and accuracy of the FE model are validated. The failure behavior of the pipe under axial tension → internal pressure load path is investigated, and finally, sensitivity study is conducted to study the effect of some key parameters on the pipe burst capacity.
Experiment
Test sample properties
Prior to pipe sample test, PE tensile test had been carried out to verify its properties. The test procedure is shown in Figure 2 and the corresponding strain–stress curve is shown in Figure 3.
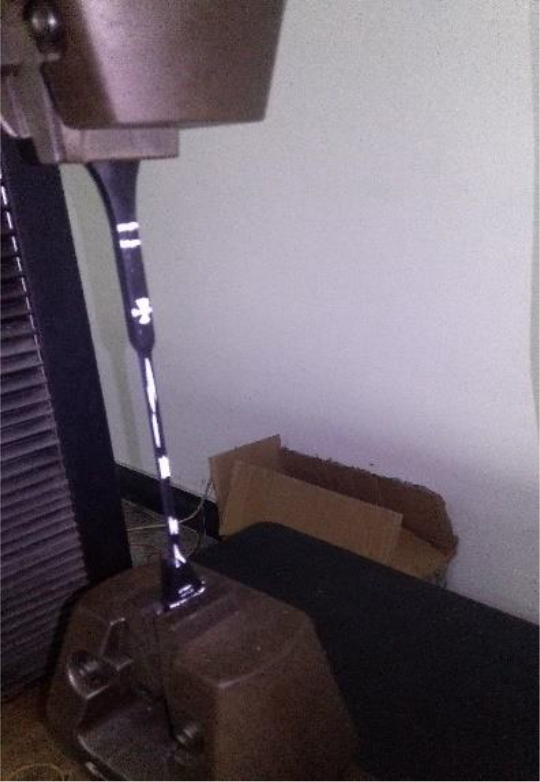
HDPE tensile test procedure.
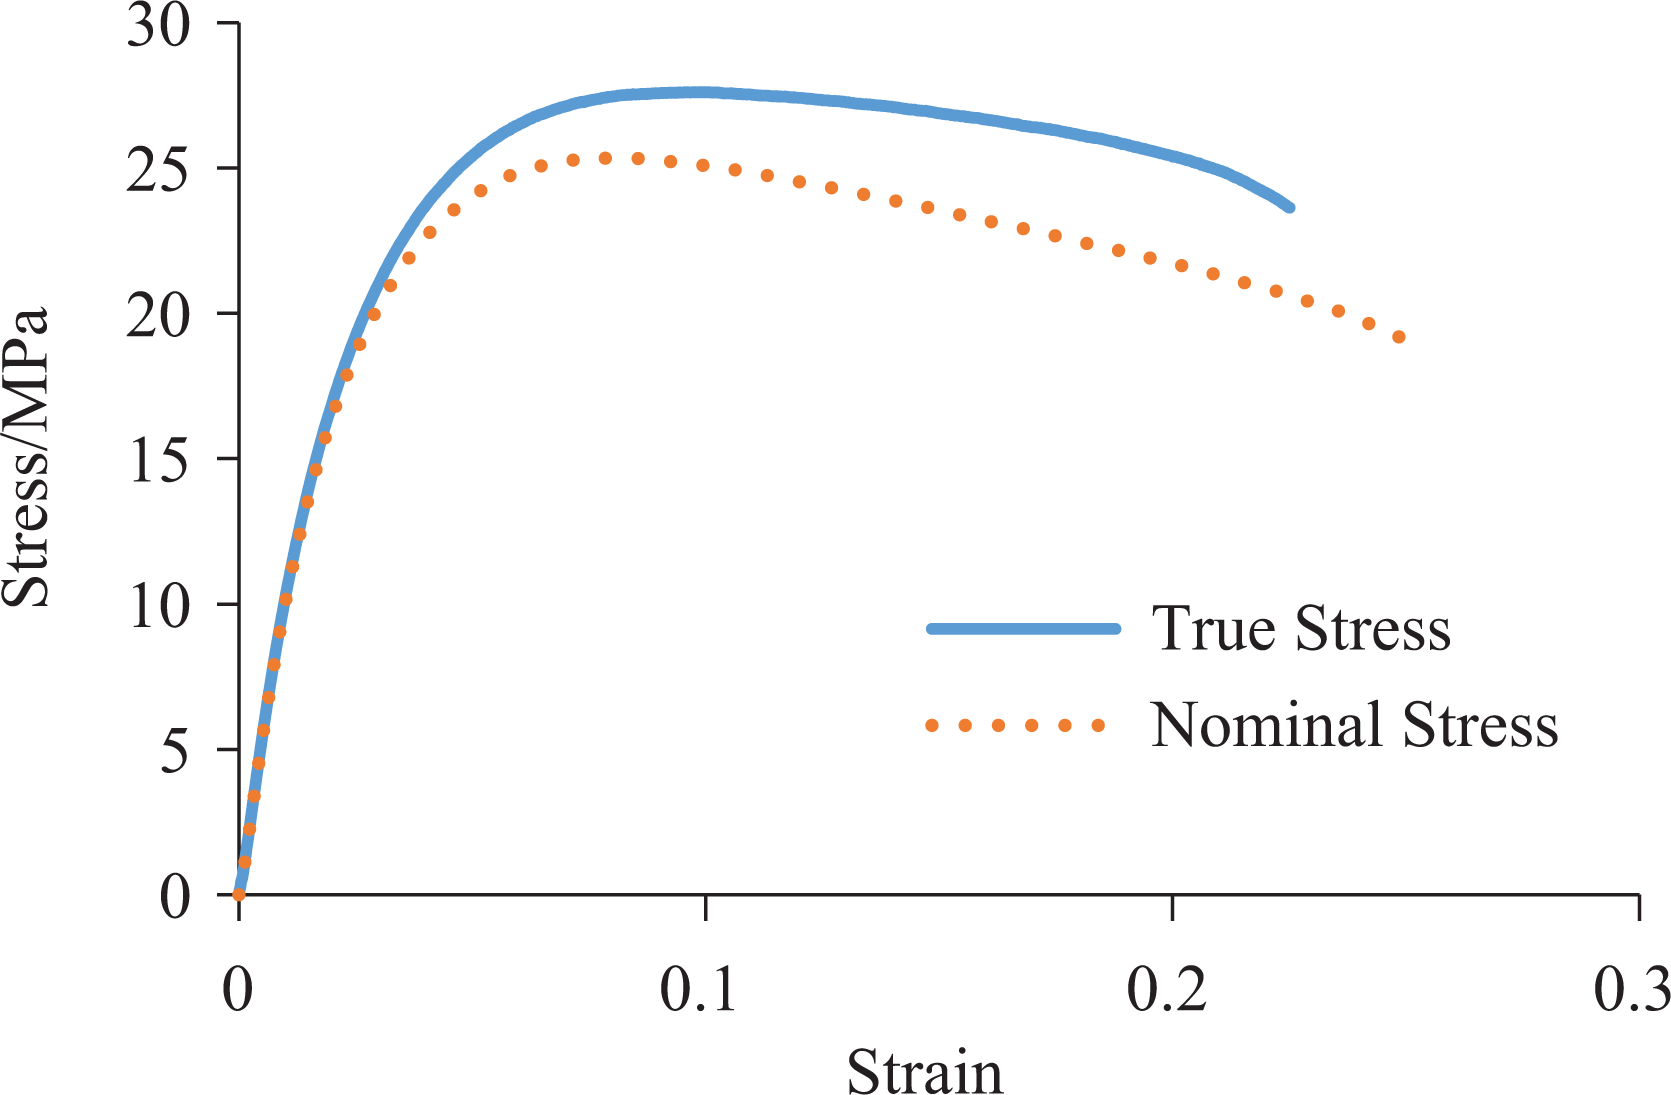
Stress–strain curve of HDPE.
In the meantime, tensile test of steel strip was also carried out, and as shown in Figure 4, an extensometer is introduced to calibrate its strain, and the corresponding stress is automatically recorded by the test machine; the loading rate is set as 0.2 mm/min. Test curve is shown in Figure 5(a), and it can be noticed that the strain–stress curve of the steel strip shows strong ideal elastic–plastic property: before yield point, the strain–stress relation meets Hooke’s law approximately; after yield point, the strain increases whereas the stress remains nearly invariant. To simplify the input procedure of steel strip attributions into pipe FE model and theoretical model, the strain–stress curve of the steel strip was fitted to bilinear plasticity model, as shown in Figure 5(b).
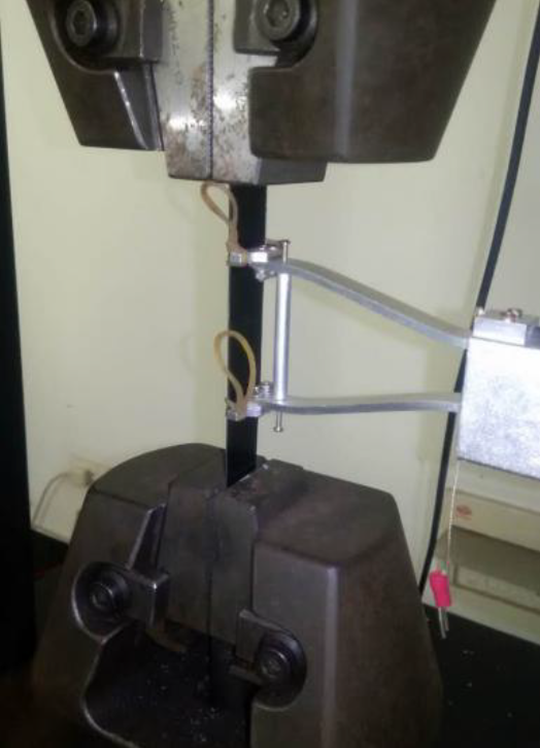
Steel strip tensile test procedure.
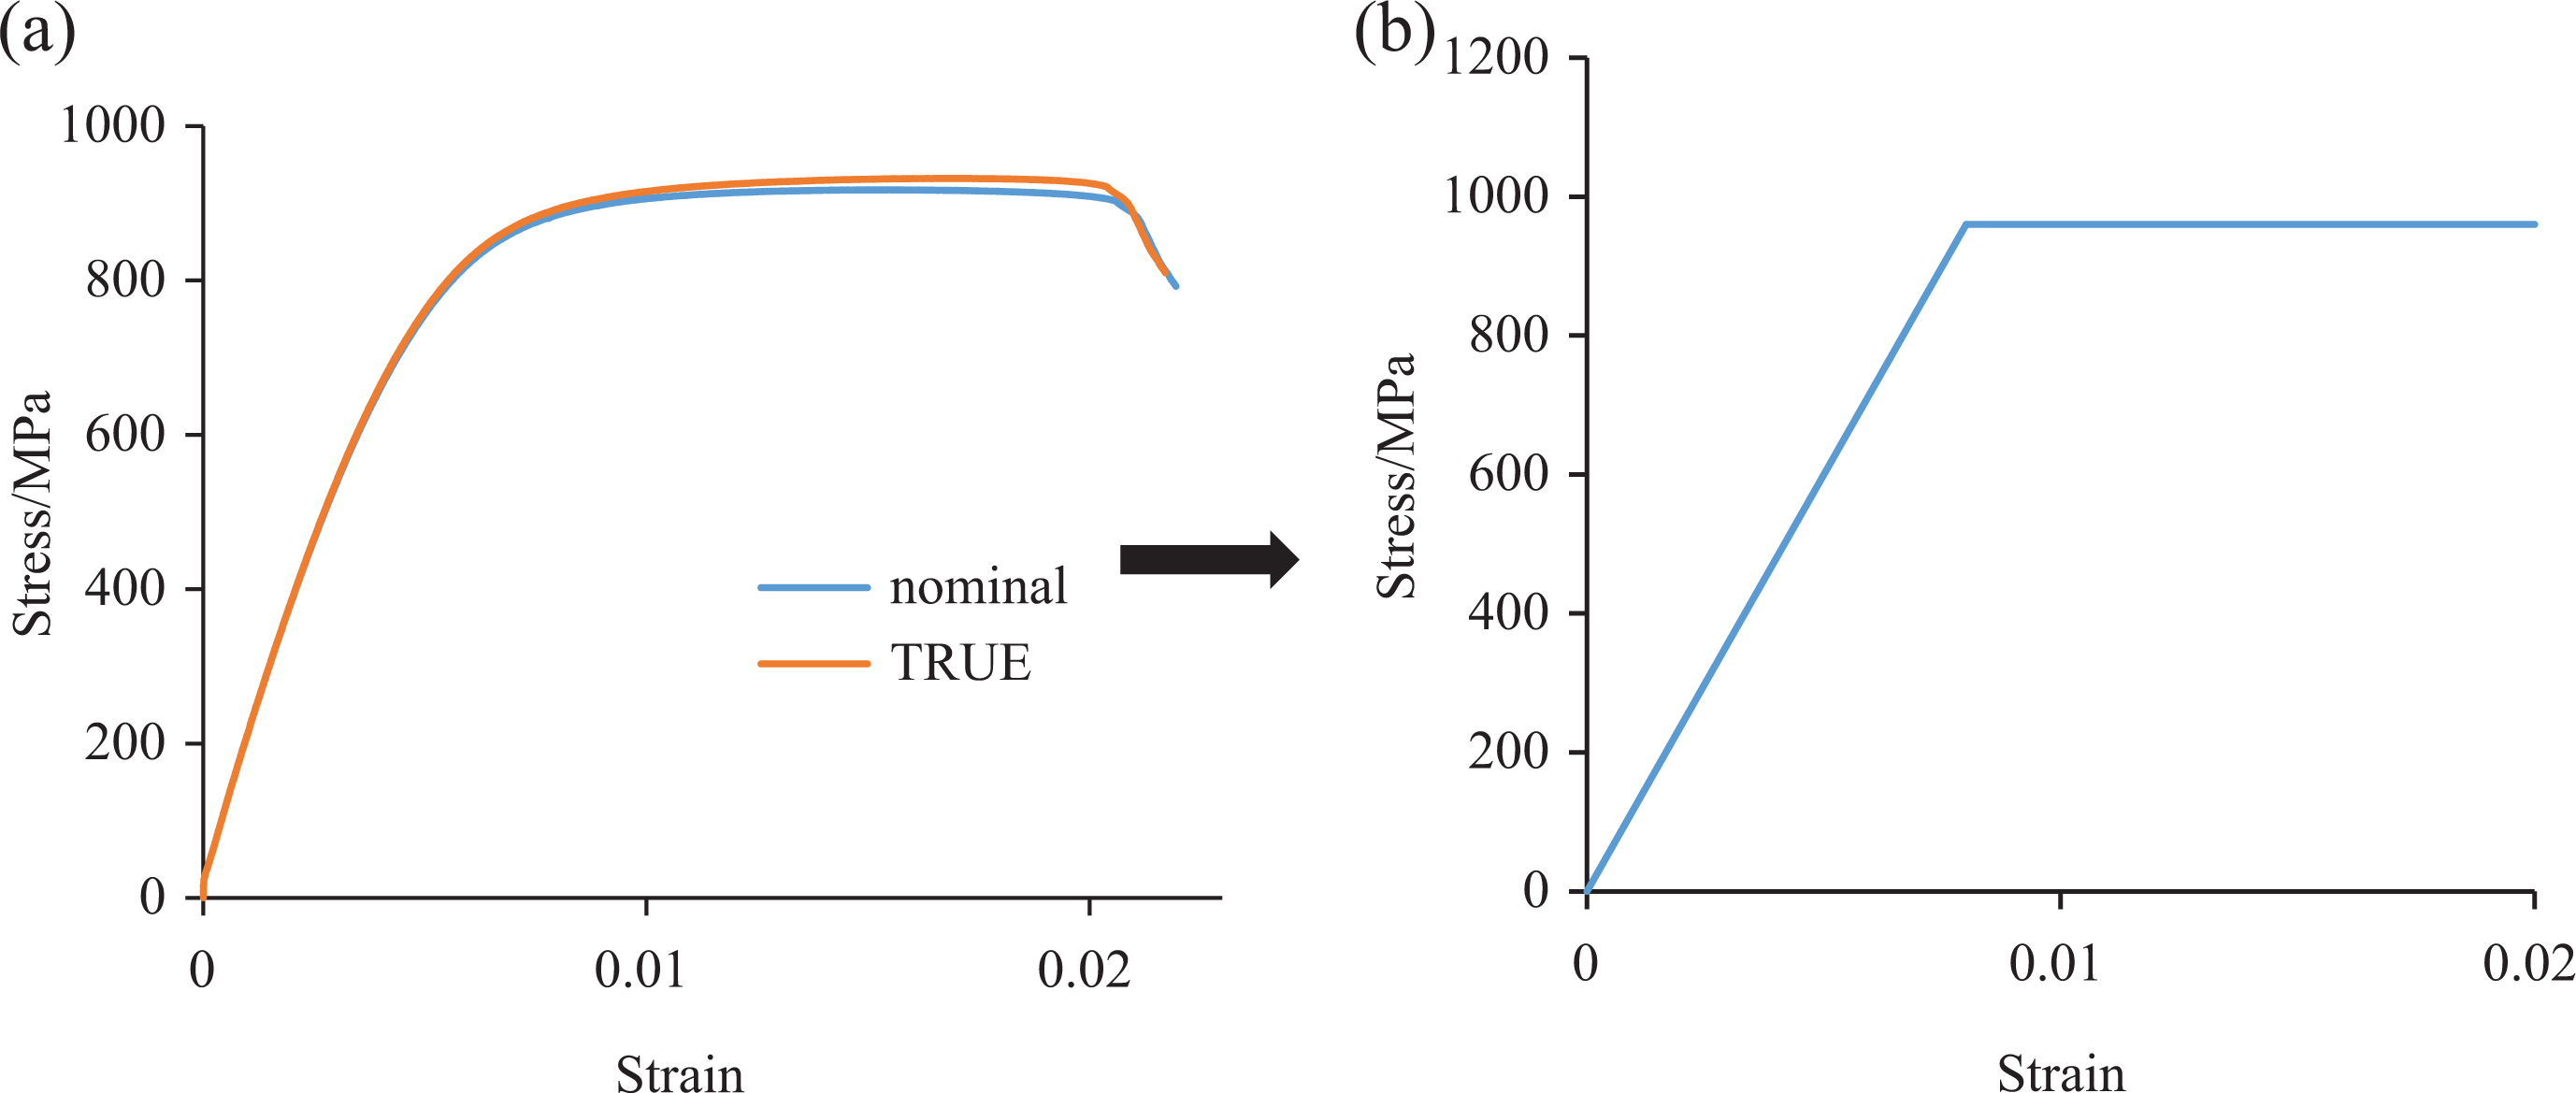
Stress–strain curve of HDPE: (a) Stress–strain model of steel and (b) bilinear plasticity model of steel.
Experiment procedure
Pipe samples are provided by Ningbo OPR Inc. (Ningbo, Zhejiang Province, China). The samples are 2 in. in diameter with six spiral wound steel strip reinforcement layers. The valid length of pipe samples is 1000 mm, and both ends of the pipe are swaged with end-fittings that could accommodate interfaces to connect to tension machine and pressure pump. Detailed configurations of pipe samples are listed in Table 1, and the illustration of the pipe’s cross-sectional structure is shown in Figure 6.
Pipe sample configurations.
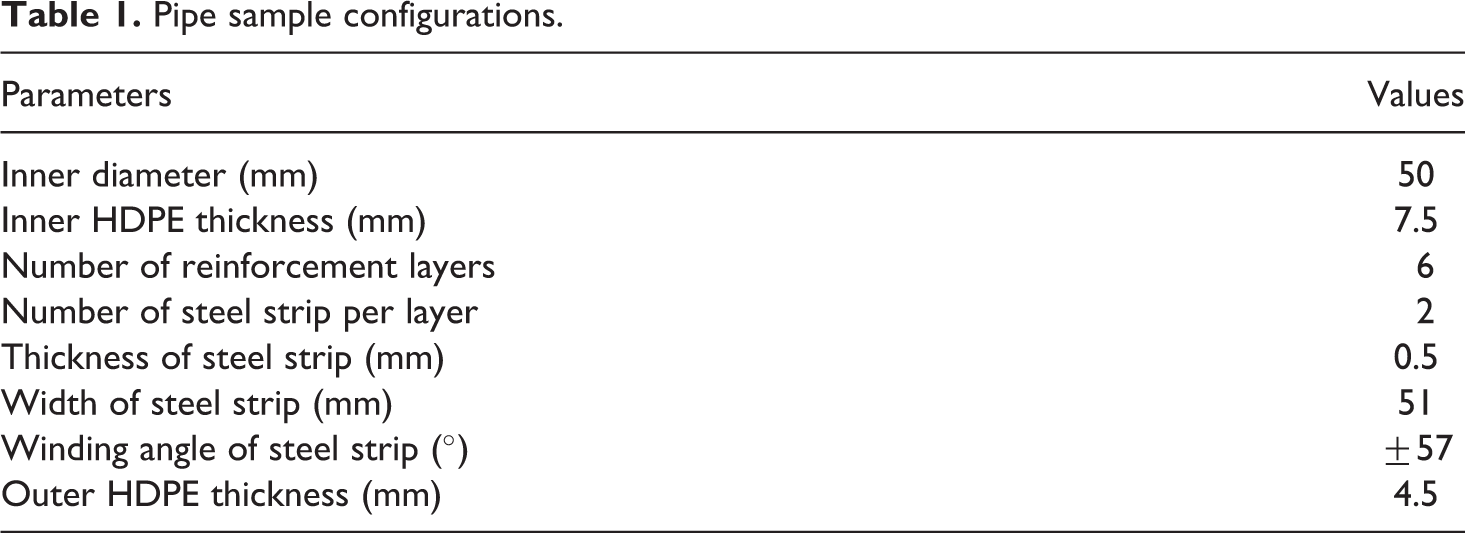
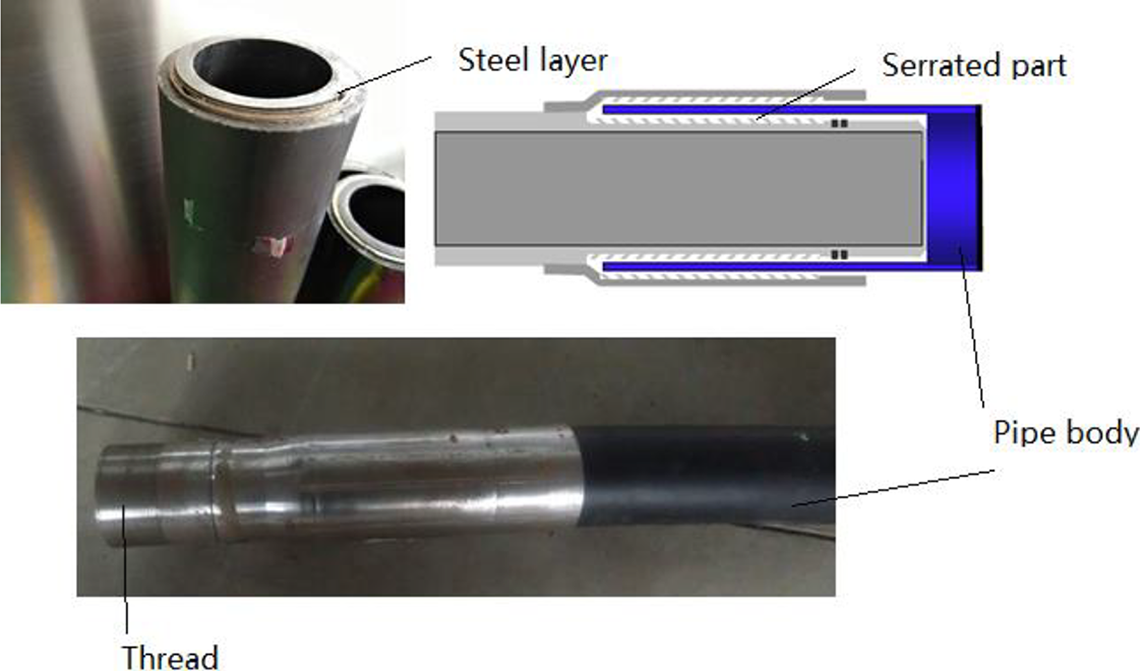
Illustration of steel strip PSP with swaging end-fitting.
The experiment involves conducting a series of full-scale axial extension→ internal pressure test (T→P) upon pipe samples. Test apparatus are shown in Figure 7.
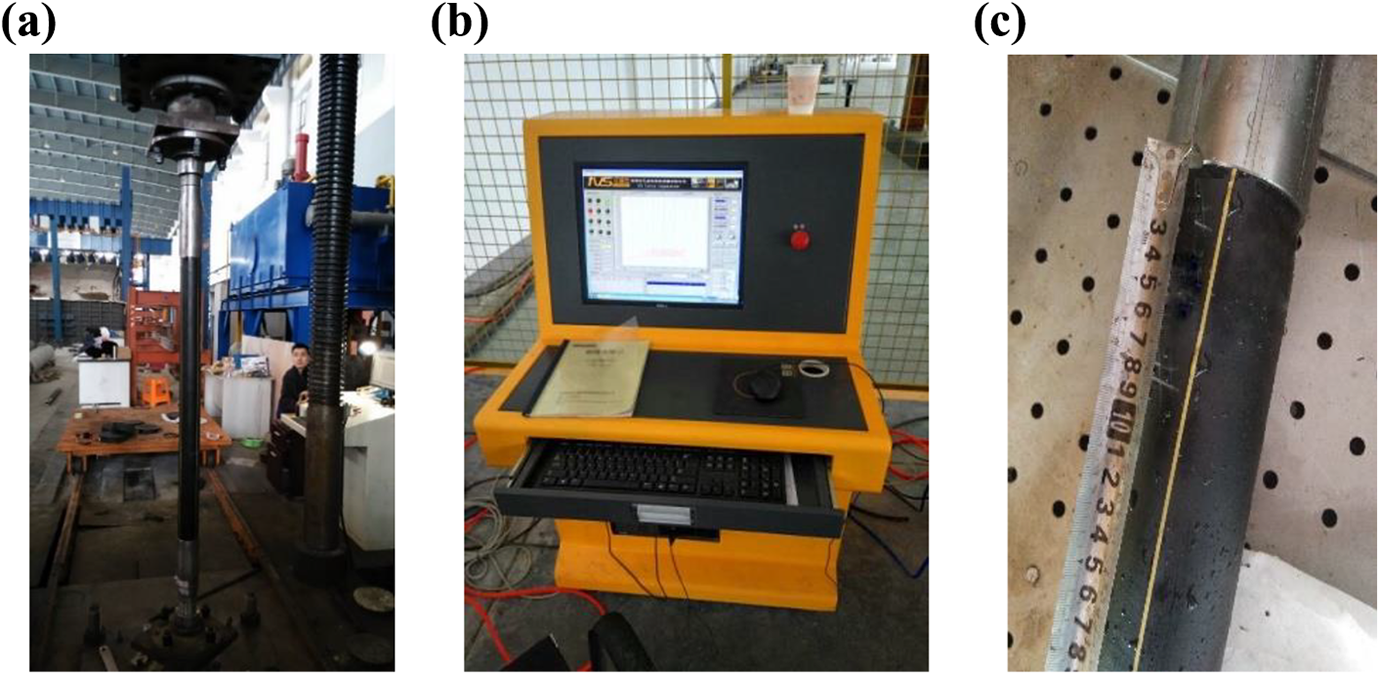
Pipe sample test apparatus: (a) tension test; (b) pressure pump control unit; (c) pipe sample in safe-tank.
Before setting up the test, the samples are conditioned in room temperature for 40 h. In the first stage of the experiment, the test sample is installed to tension machine and is tensioned to target tension force within 1 min. After that, the control system will keep the tension force as constant, and the pipe sample is conditioned under this situation for 30 min. This measure is to make sure that the tension load has led to permanent change in the inner/outer HDPE layers and reinforcement layers, and the influence of such change on the pipe antiburst capacity will be investigated in the following internal pressure test.
In the second stage, the axial load is unloaded, and the pipe sample is then flooded with water and connected to the pressure pump. The internal pressure test contains two phases; in the first phase, the pressure is loaded up to 20 MPa at 1 MP/s, and this pressure value is kept constant for about 180 s. After that, the pipe sample will be pressurized to burst. The failure of the pipe sample is defined by a sharp drop of pressure curve accompanied by a loud noise indicating pipe burst. Illustration of the test process is shown as a flowchart in Figure 8. After completion of the test, data of axial load–axial extension and time–internal pressure were collected for further analysis.
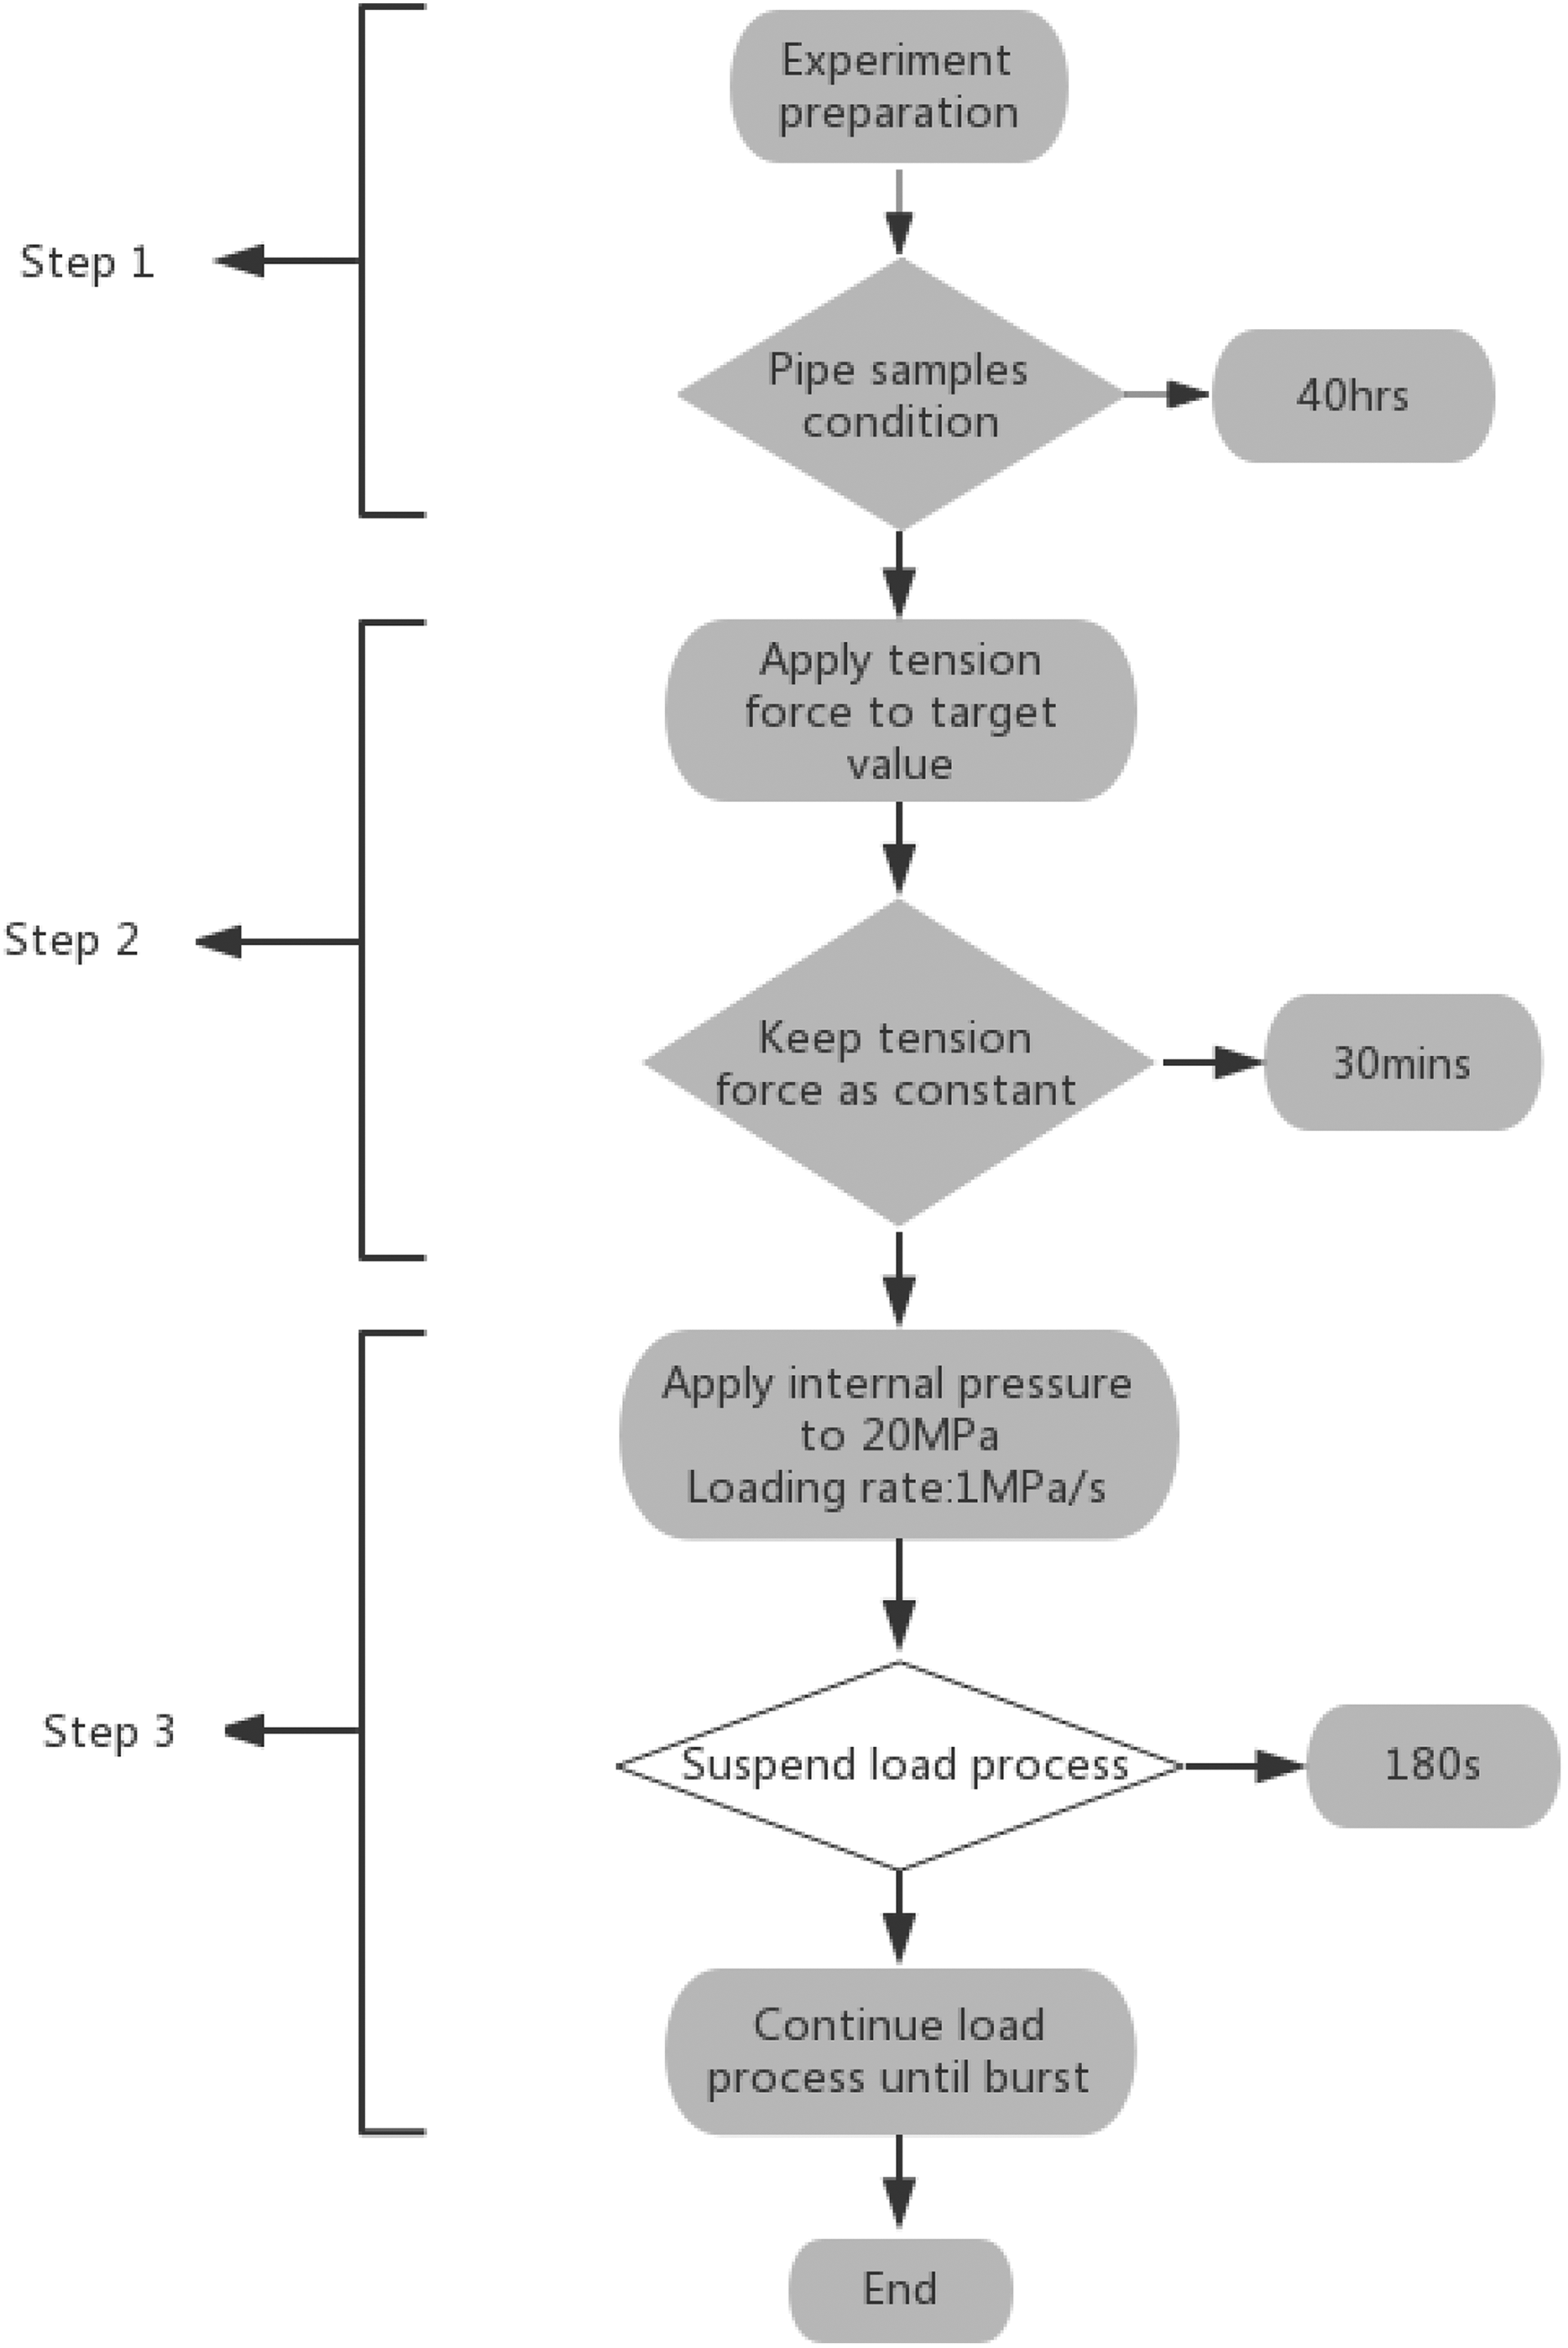
Flowchart of axial extension → internal pressure (T→P) test process.
Figure 8 describes the complete procedure of axial extension → internal pressure (T→P) test. It should be noted that in order to figure out to what extent the axial extension would affect the pipe antiburst capacity, a pure internal pressure burst test was also carried out in the meantime. This loading process only contains steps 1 and 3 of that presented in Figure 8.
Experiment results
Bursted pipe sample under T→P load path is shown in Figure 9, and the axial load–axial extension and time–internal pressure curve of test sample are presented in Figure 10. Pipe sample after pure internal pressure test is shown in Figure 11, and the corresponding time–internal pressure curve is presented in Figure 12. It can be found from Figures 9 and 11 that the burst point is about 40 cm away from the end-fitting in the case of T→P load path and 16 cm away from the end-fitting in the case of pure internal pressure load. Figure 10(a) shows that the axial tension load has caused an axial extension of 20 mm in total. Neglecting some small fluctuating parts, the axial load–axial extension curve shows good linear relation during the loading process. Thus, it is reasonable to treat the pipe as an elastic material during tension load process.
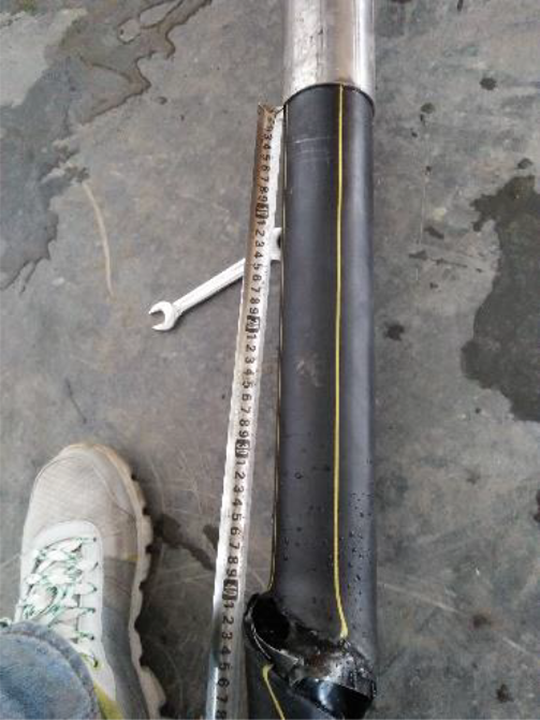
Pipe sample after burst under T→P load path.
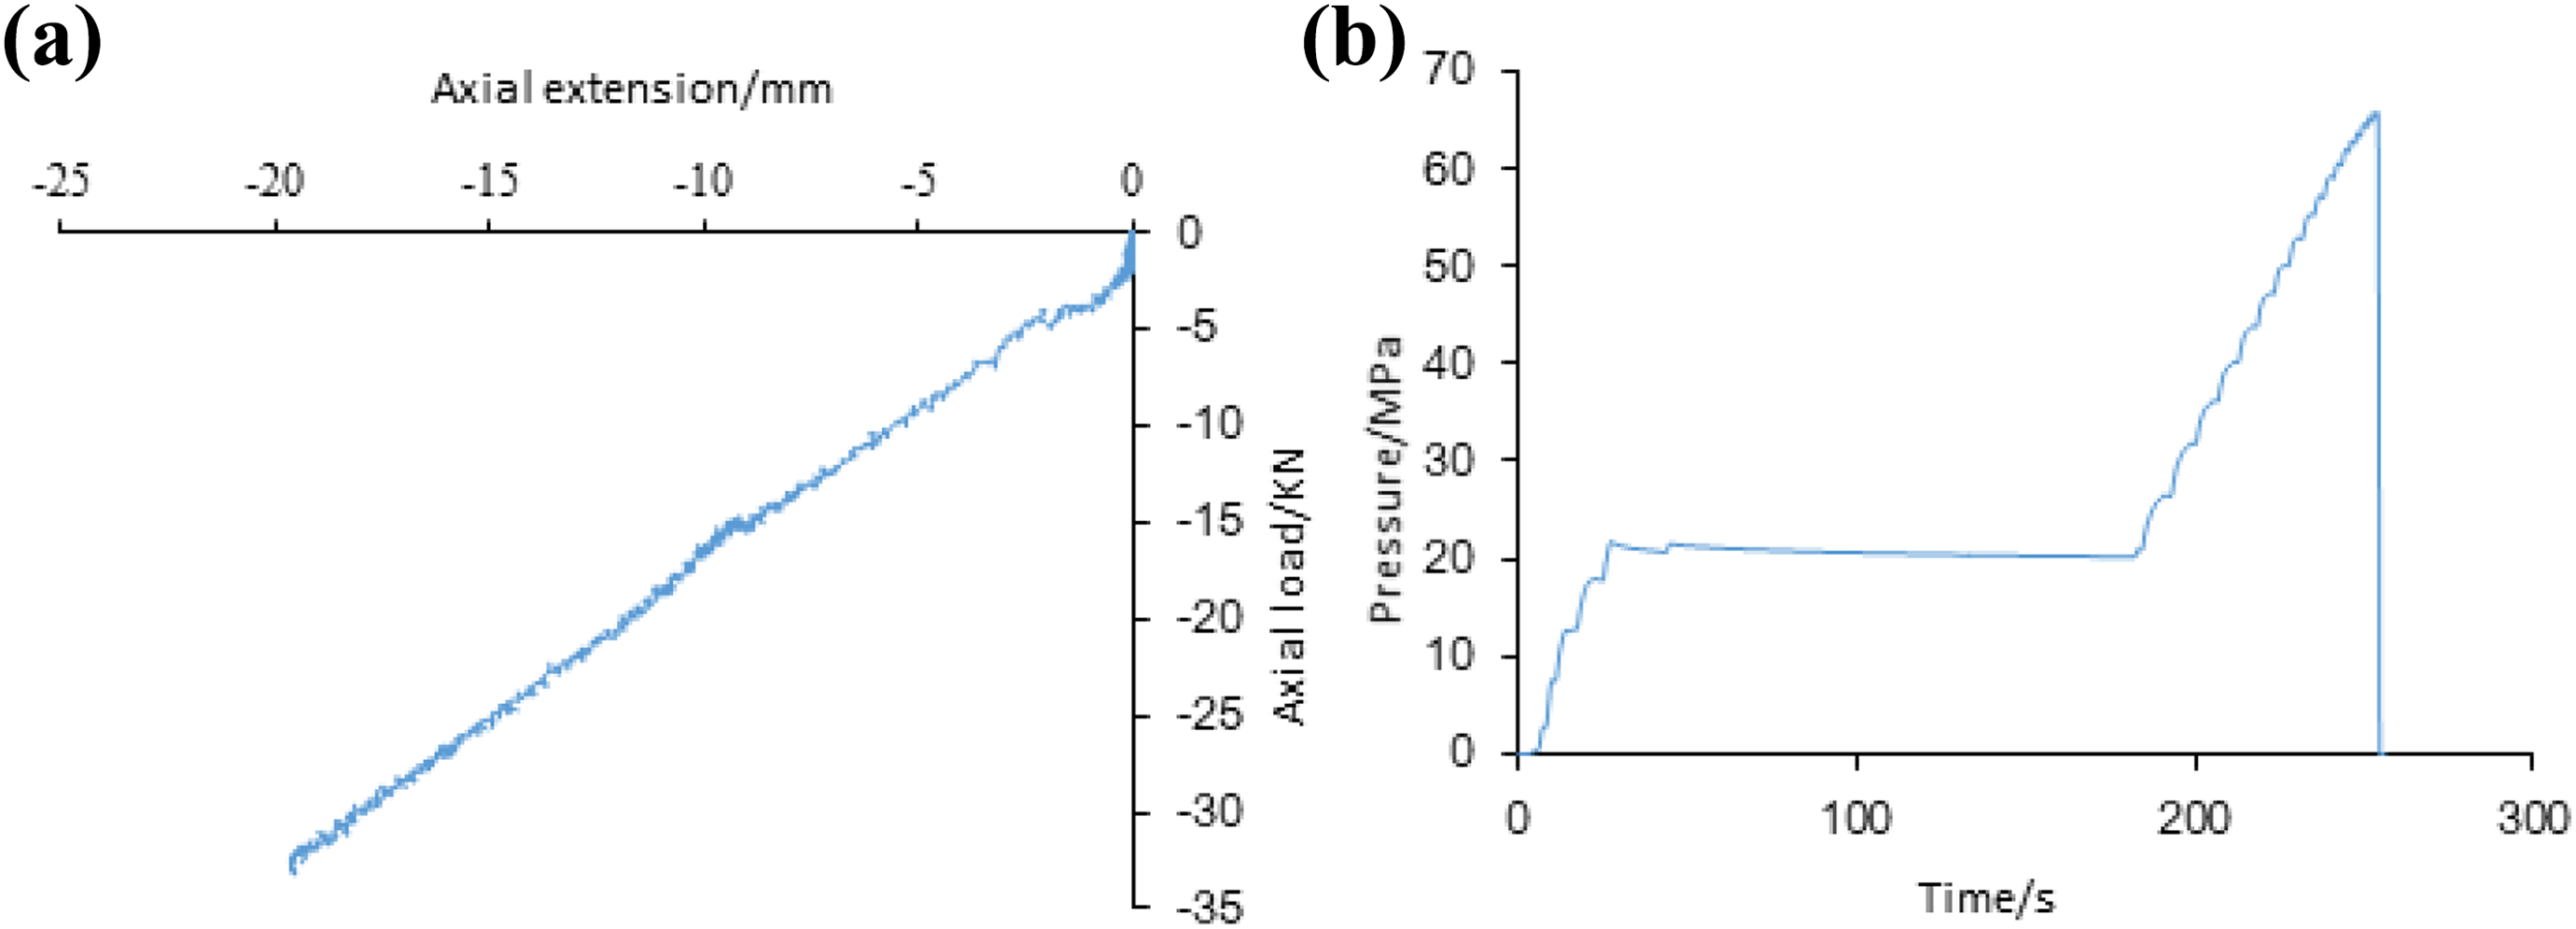
Tension load and internal pressure load curve of pipe sample under T→ P load path: (a) axial load–axial extension curve and (b) time–pressure curve.
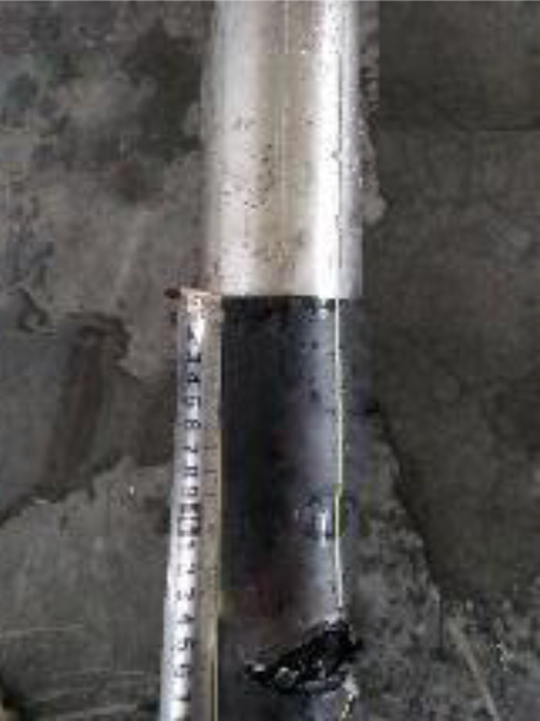
Pipe sample after burst under pure internal pressure load.
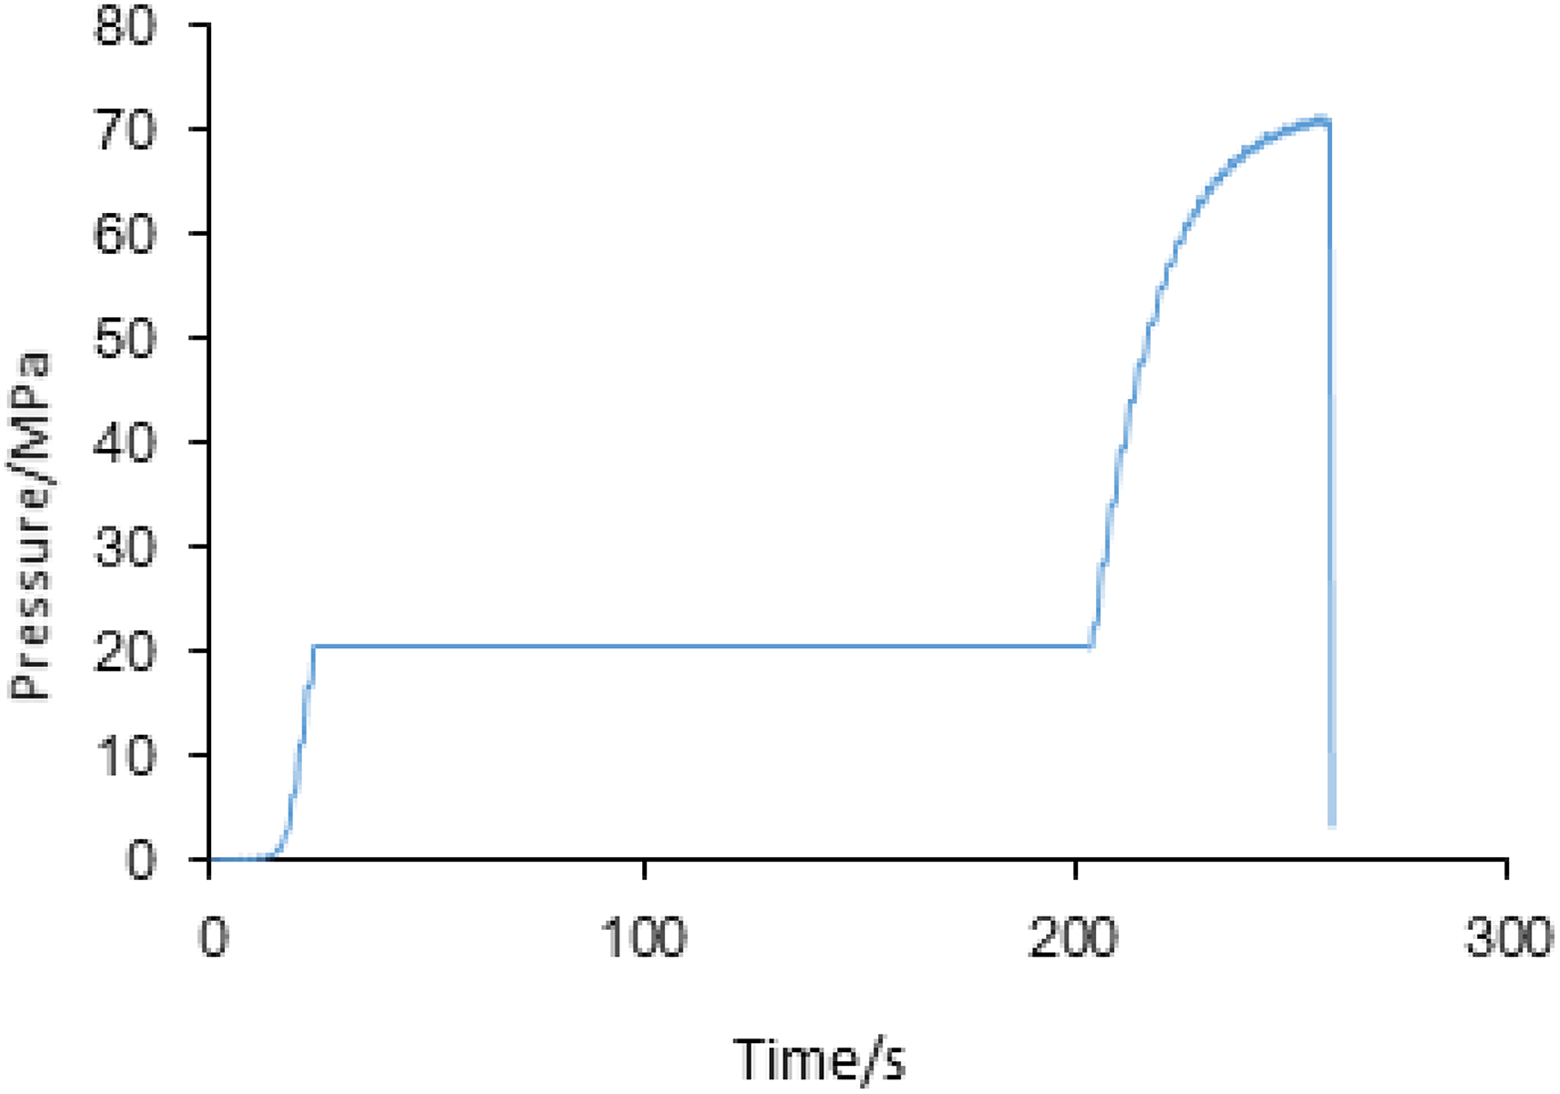
Time–pressure load curve for pipe sample under pure internal pressure test.
The burst pressures for pipe samples under pure internal pressure load and T→ P load are 71.5 MPa and 65.8 MPa, respectively, as shown in Figures 10(b) and 12.
Theoretical assumption for steel strip PSP under extension load
Axial extension will lead to a certain deformation on steel strip layers and HDPE layers of steel strip PSP, which will surely affect the burst capacity of the pipe. As the steel strip layers are the dominant parts that contribute to the pipe burst capacity, it is of importance to capture the relationship between stress state of steel strips and preloaded axial extension.
Knapp 13 has developed a nonlinear model to analyze the mechanical properties of helically armored cable under tension and torsion. This model has proved to be a valid analyzing method for a broad category of cable as well as composite pipe that has the similar structures as helically armored cable. In this part, the model is adopted and modified to explore the variation trend of steel strip tensile stress along winding direction under axial extension load.
As mentioned earlier, pipe samples can be treated elastic under tension load. For a certain length of pipe, say one pitch
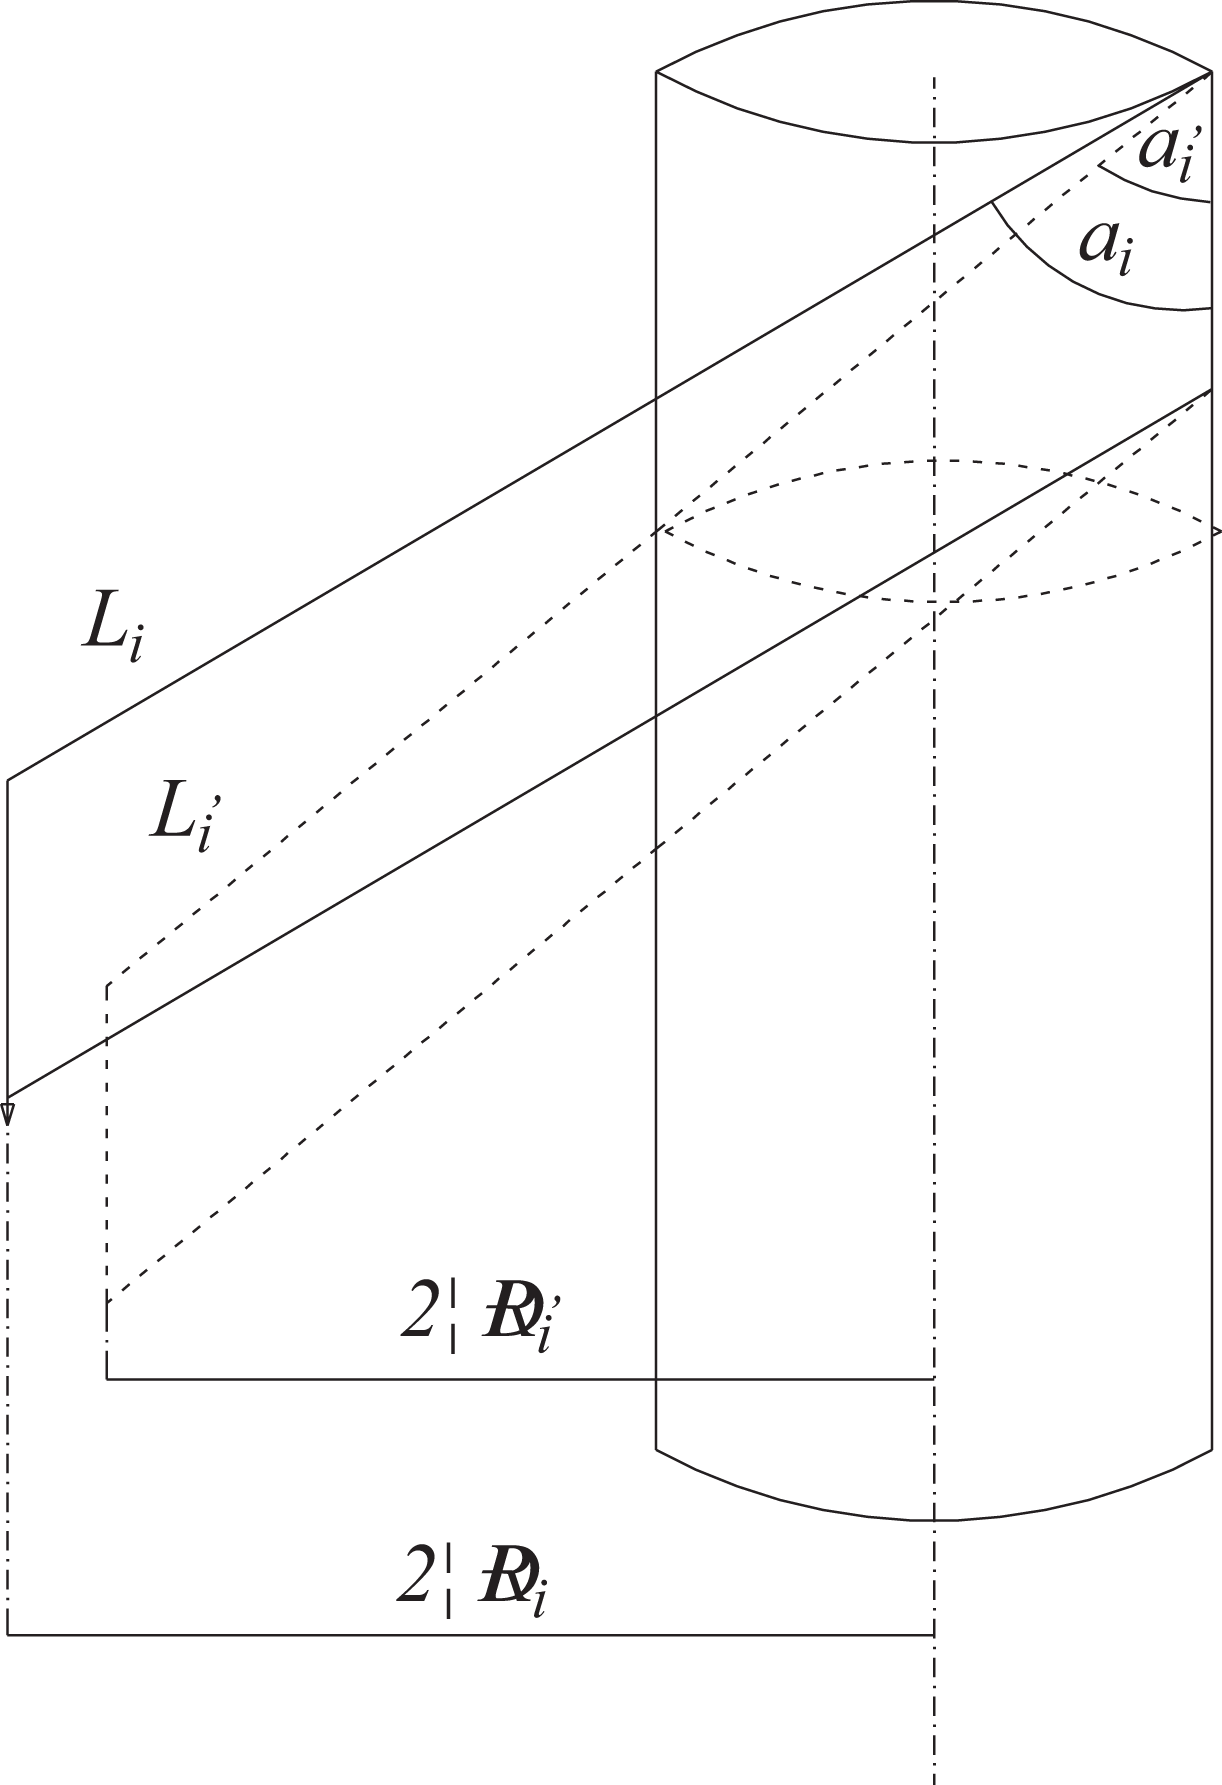
Illustration of the winding angle and the winding pitch change before and after tension load. ai/ai ′ denote the winding angle before/after load, Ri/Ri ′ denote the winding radii before/after load, and Li/Li ′ denote the winding length of steel strip in one pitch.
As the axial strain of pipe is expressed as:
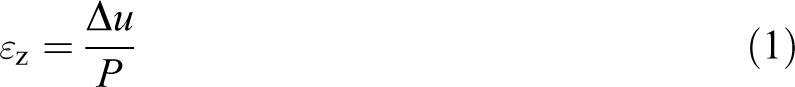
where Δu denotes the extension of pipe in one pitch.
And the axial strain along winding direction of the steel strip reinforcement is
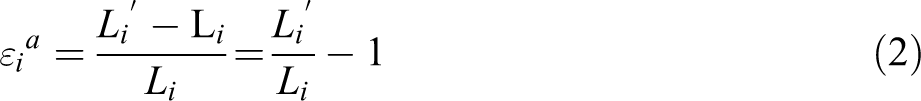


Substituting equations (3) and (4) to equation (2), the axial strain along winding direction of steel strip reinforcement can be rewritten as 14 :

where
Equation (5) reveals the relation between pipe axial strain and reinforcement layer axial strain along the winding direction. Define E steel as the elastic modulus of steel and combining equations (1) and (5), one can obtain:
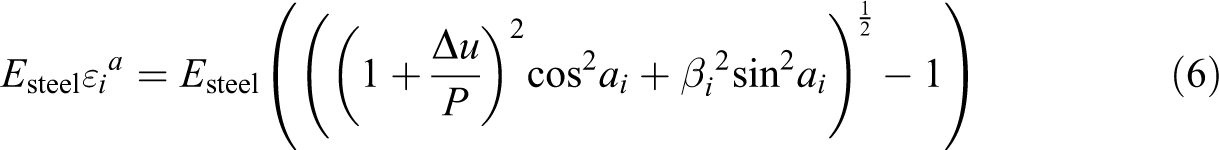
Equation (6) presents a simplified equation between the steel strip axial strain along the winding direction and pipe axial extension.
Numerical analysis
FE model establishment
Geometric modeling
A FE model is also established to simulate the mechanical behavior of steel strip PSP under combined tension and internal pressure. As the tension load has caused some permanent deformation on the pipe’s cross-sectional structure, the FE model should be capable of simulating such change as well as the influence of such change on the pipe antiburst capacity. The geometry, boundary condition, and applied loads are illustrated in Figure 14. The right end of the pipe is coupled to a reference point RP1 and is set as “All-fixed,” whereas the left end is coupled to RP2 to apply tension load. To take into account the slide phenomenon between layers, the interaction between steel strip and HDPE layer is defined as “surface-to-surface” contact with a tangential coefficient of friction of 0.22. Interaction between steel strips is also defined in this way but with friction coefficient of 0.35. A “hard contact” is used to define its normal behavior to prevent penetration between the upper and the lower layers.
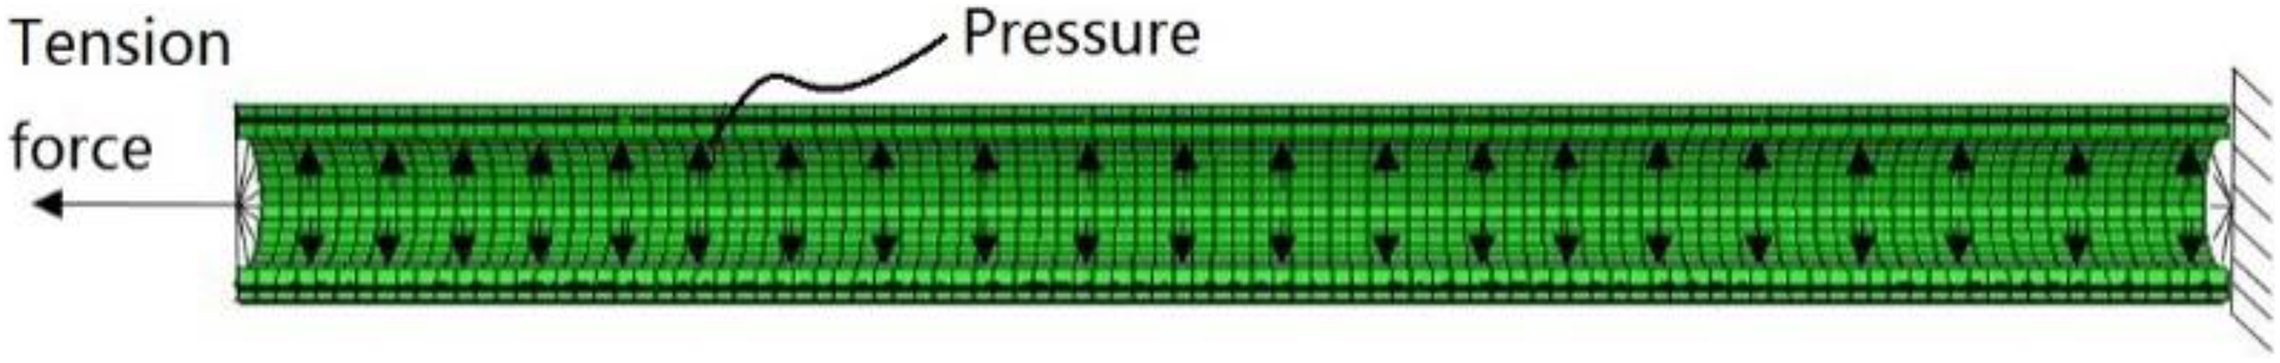
Cross-sectional view of pipe with boundary condition and applied load.
Material properties
The elastic parameters of HDPE and steel are obtained from material tensile test, as presented in Table 2. The plastic parameters of HDPE are also obtained from material tensile test and are input into FE model using a tubular format that contains more than 100 discrete points, whereas the plastic properties of steel are defined by Johnson–Cook model, and this model is presented by the equation:

in which σeq is the equivalent stress, εeq is the equivalent plastic strain,
Material constants.
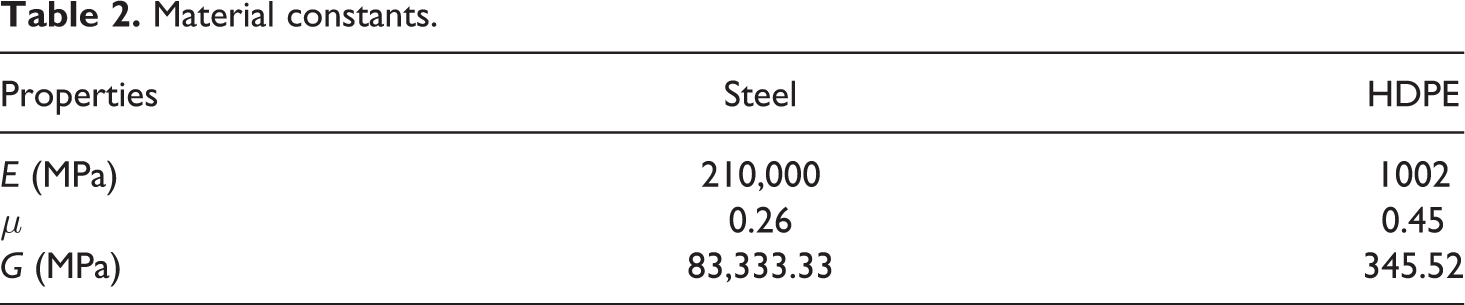
A, B, C, m, and n are user-defined parameters in ABAQUS. These parameters can be derived with combined experimental and FE methods.
Loading method
As the applied tension force has caused 20 mm extension of the pipe body in total, to simulate the loading procedure, two loading steps are applied in FE model. In the first step, the pipe model is stretched to 20 mm and kept constant, and internal pressure is then applied until burst in the second step. During this process, the axial load–axial extension relation and strain–stress variation of each layers are recorded for further analysis.
Results and discussion
Validation of FE model
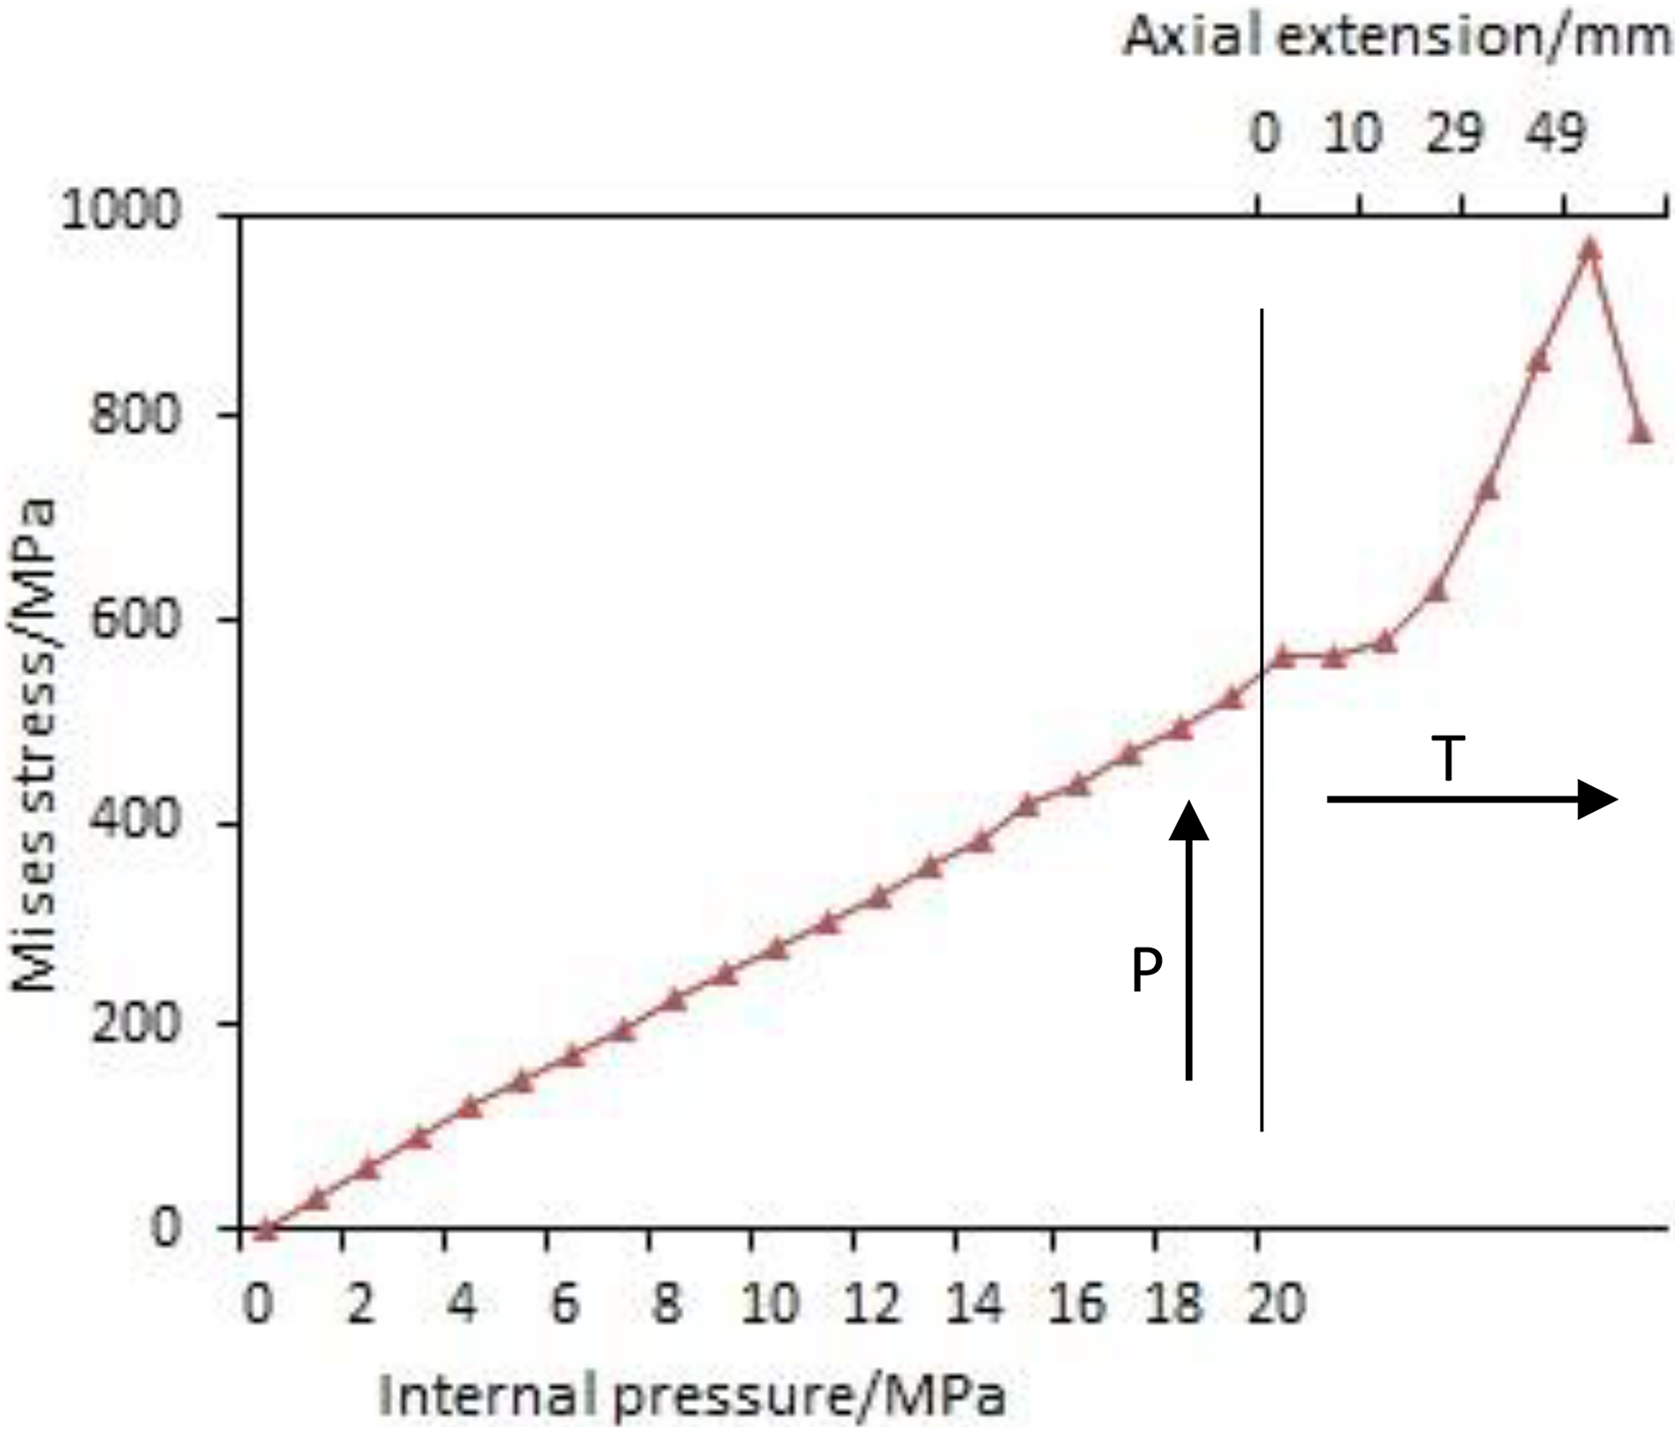
Zheng et al. 15,16 have revealed that for multilayered flexible pipe under internal pressure load, stress of the inner layers is slightly larger than that of the outer layers. In this study, Mises stress of the innermost steel layer is set as criteria to predict the burst strength of the pipe: As the Mises stress of this layer reaches its ultimate strength, the pipe is deemed to fail, and the corresponding applied internal pressure is regarded as its burst pressure. Figure 15 shows the Mises stress variation of the innermost steel layer under axial extension → internal pressure load path, and it can be found that the corresponding internal pressure is 67.3 MPa as the Mises stress of the innermost steel layer reaches its ultimate stress of 960 MPa. Compared to experimental data of 65.8 MPa, their difference is less than 10%.
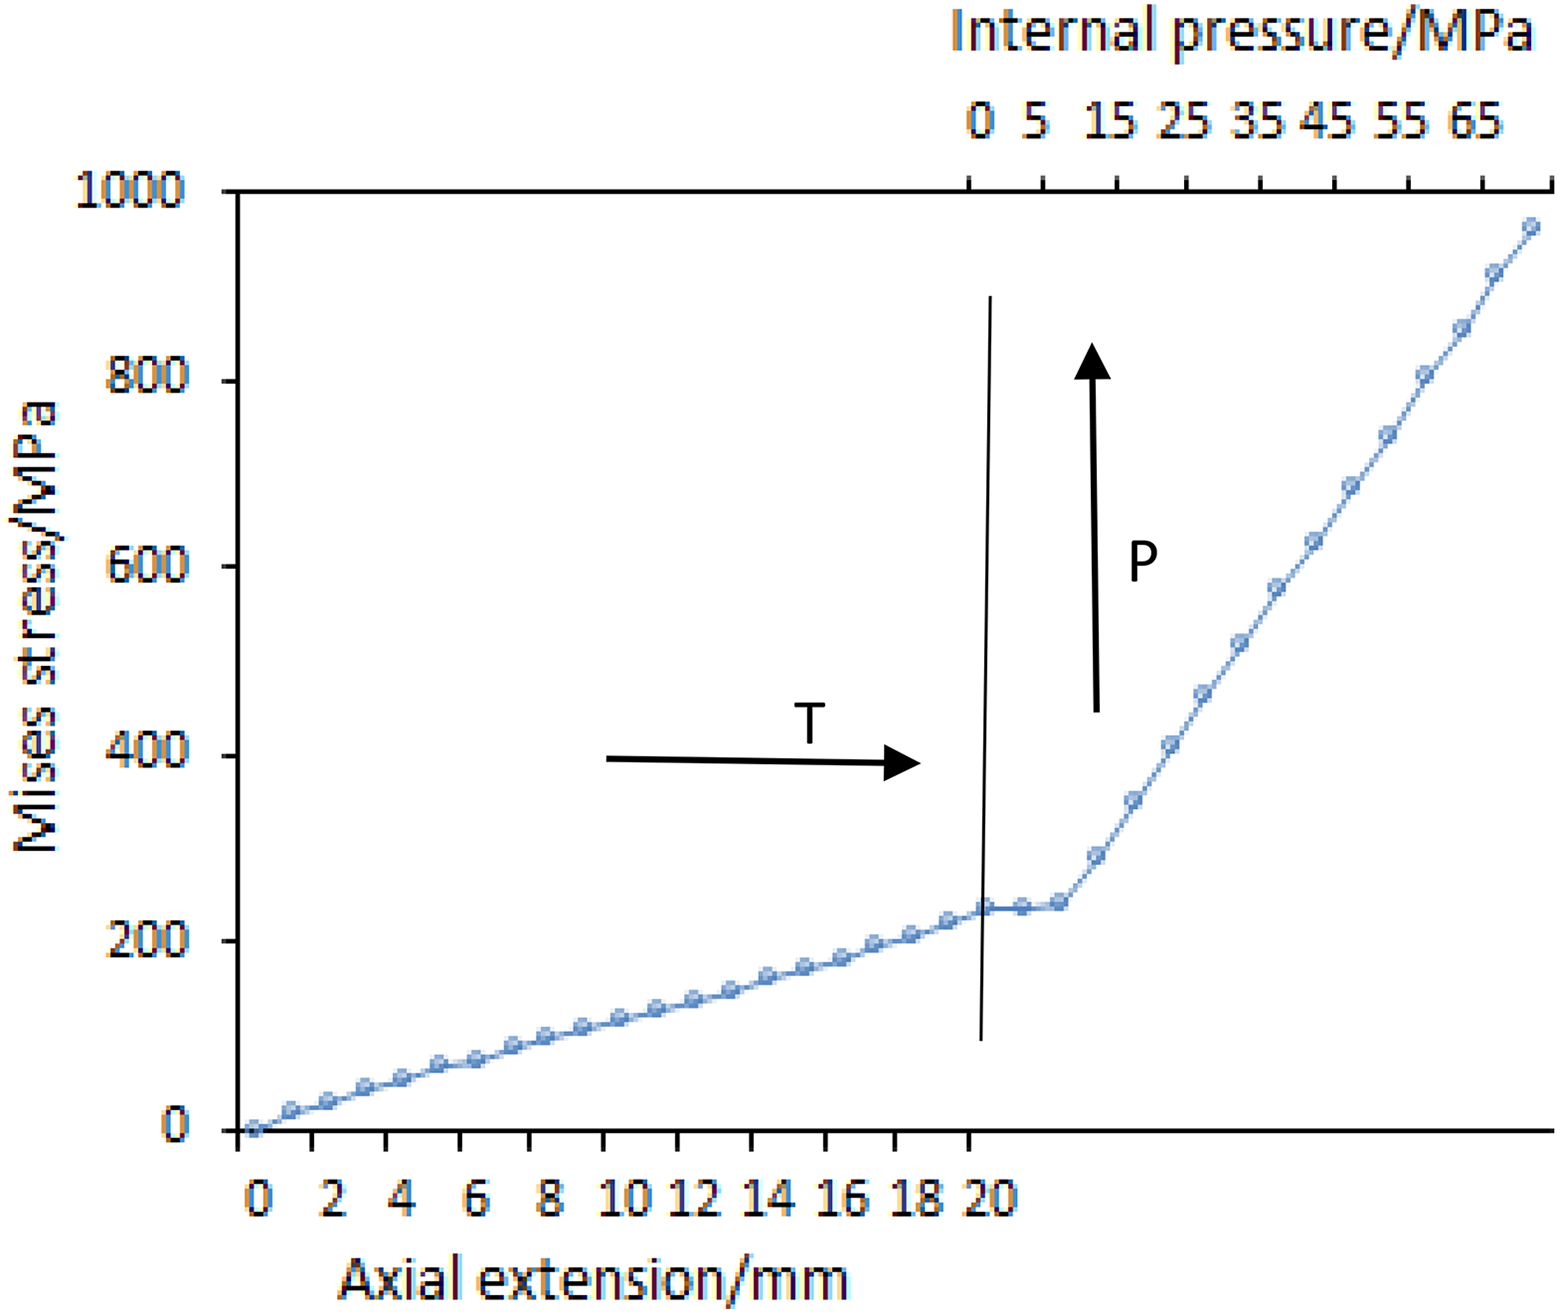
Mises stress variation of innermost steel layer under axial extension → internal pressure load path.
The axial load–axial extension data extracted from FE model are also compared with the experimental data. As shown in Figure 16, data from the FE model are slightly larger than that from the experiment as the axial extension reaches 20 mm, but, in general, they coincide with each other very well. In another figure (Figure 17) that describes the relation between the axial extension and the tensile stress along the winding direction, one can find that although data from FE model increase with fluctuations, it shares the similar variation trend with that from the theoretical model. The theoretical model, which is presented in equation (6), has proved to be feasible for analyzing the mechanical behaviors of helically armored cable that has the similar cross-sectional structure to the steel strip PSP. Thus, it is reasonable to believe that this FE model is capable of simulating the mechanical behavior of the steel strip PSP under combined tension and internal pressure load.
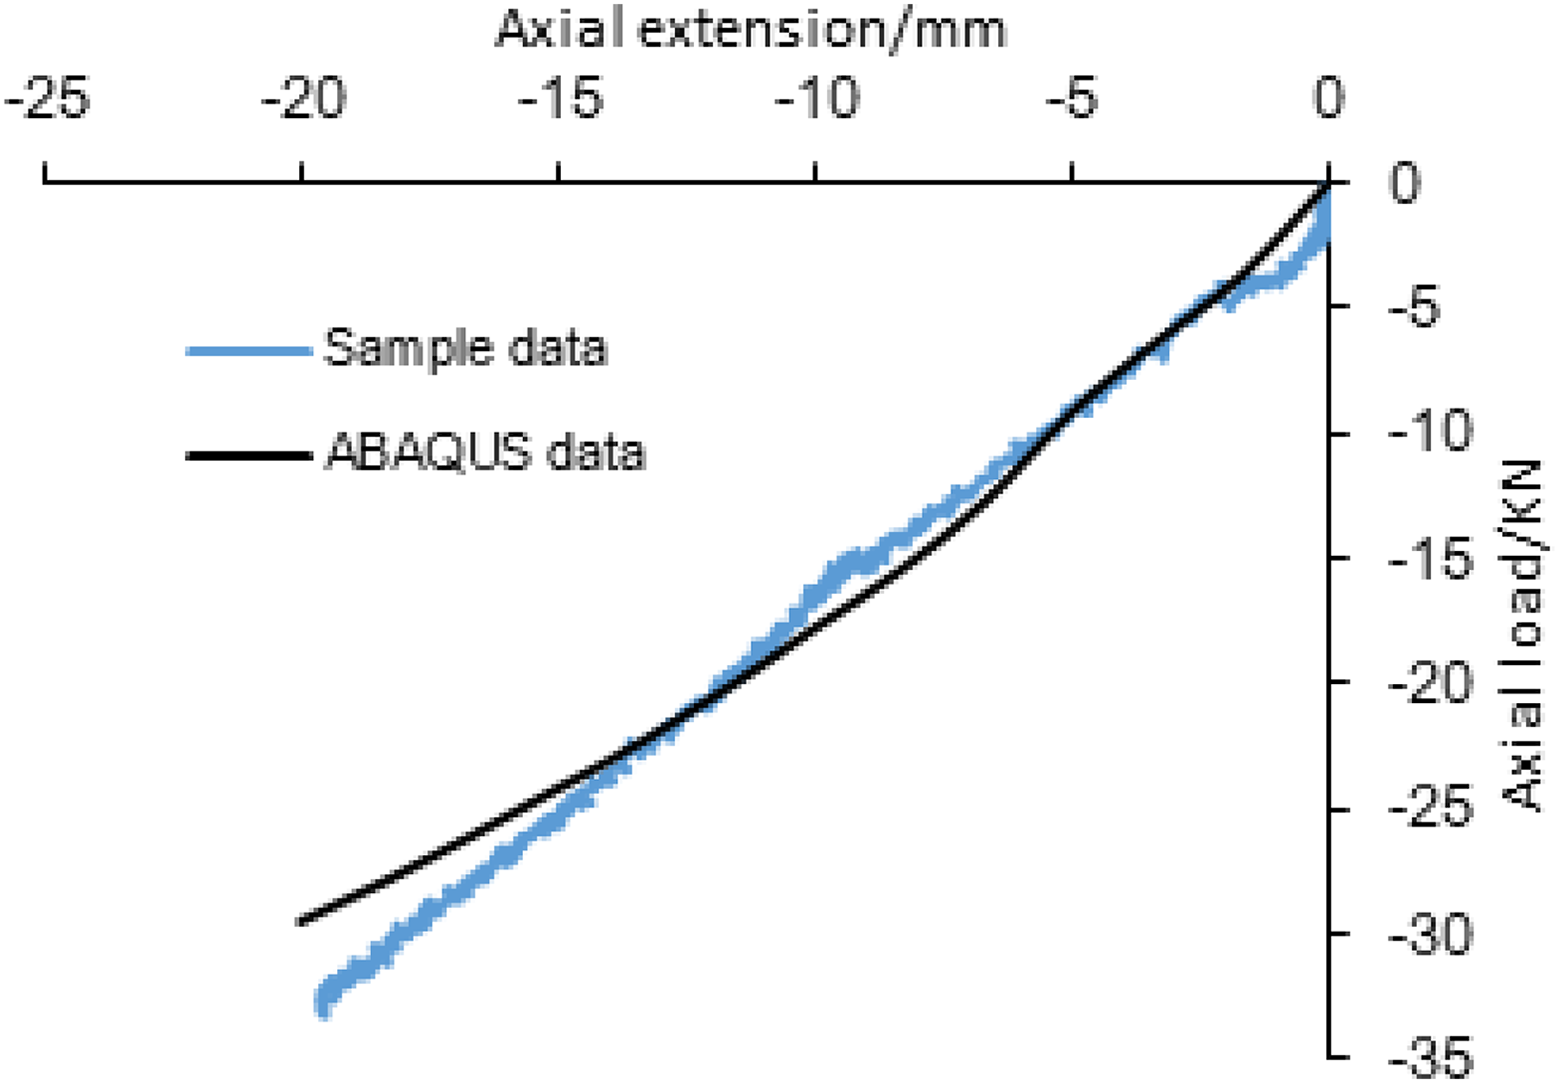
Comparison of axial load–axial extension of pipe sample between FEM data and experiment data. FEM: finite element method.
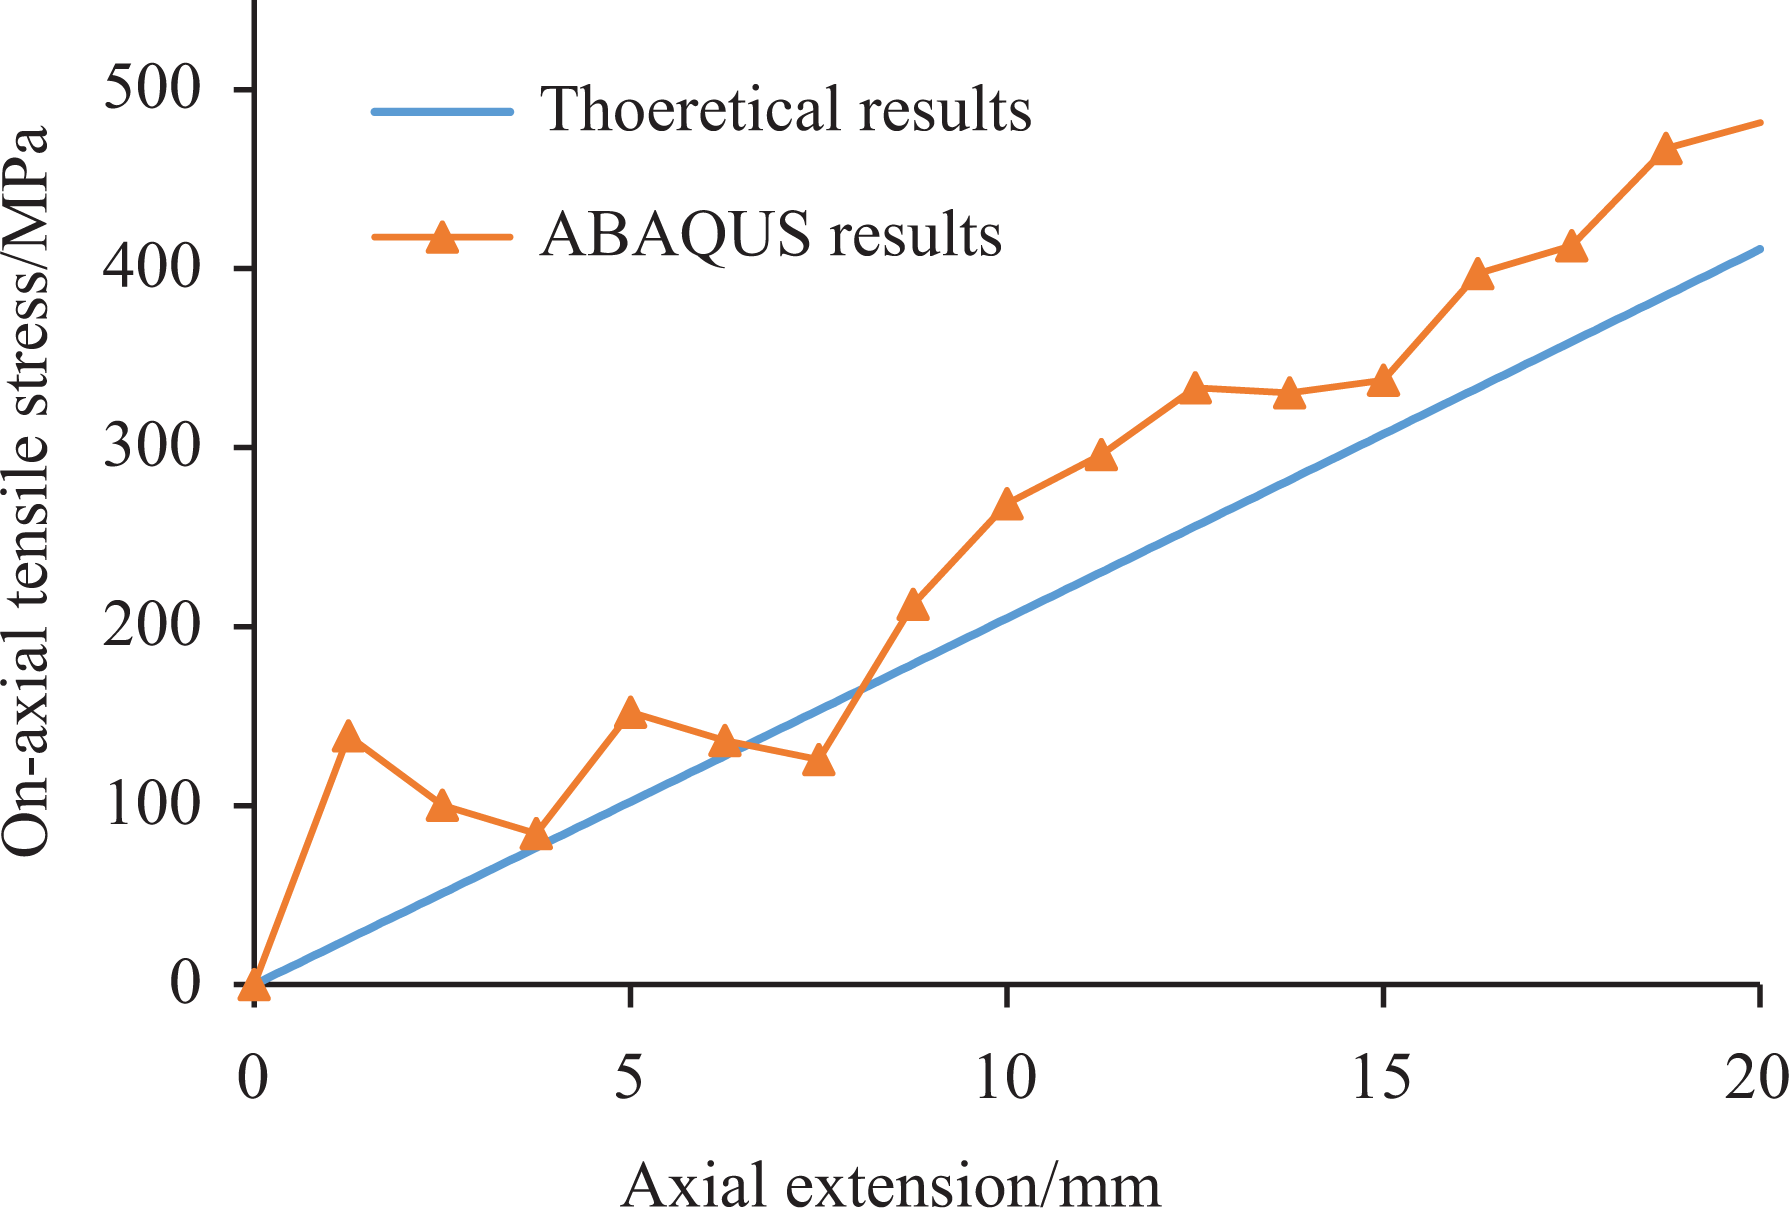
Comparison of tensile stress along the winding direction of the innermost steel layer between the theoretical and the FE model. FE: finite element.
Mechanical behavior of steel layers
When subjected to tension and internal pressure, three types of deformation within the pipe body exist: (i) radial shrinkage due to Poisson effect under tension load; (ii) radial compression effect caused by reinforcement layers under tension load; and (iii) cross-sectional expansion in radial direction under internal pressure. In addition, due to “endcap effect,” the pipe sample will extend to some degree in axial direction. “Endcap effect” means that for a pipe with both enclosed ends, when subjected to internal pressure, it will generate outward axial force under the pressure that acts on the pipe endcap. This force brings a trend to stretch the pipe axially and makes the pipe shrink in radial direction, coupled with the third deformation type, the pipe layers will be subjected to complex stress status. Figure 18 shows the Mises stress variation of each steel layers under axial extension → internal pressure load, it can be easily noticed that Mises stress of the innermost steel layer (first steel layer) is the greatest among six layers.
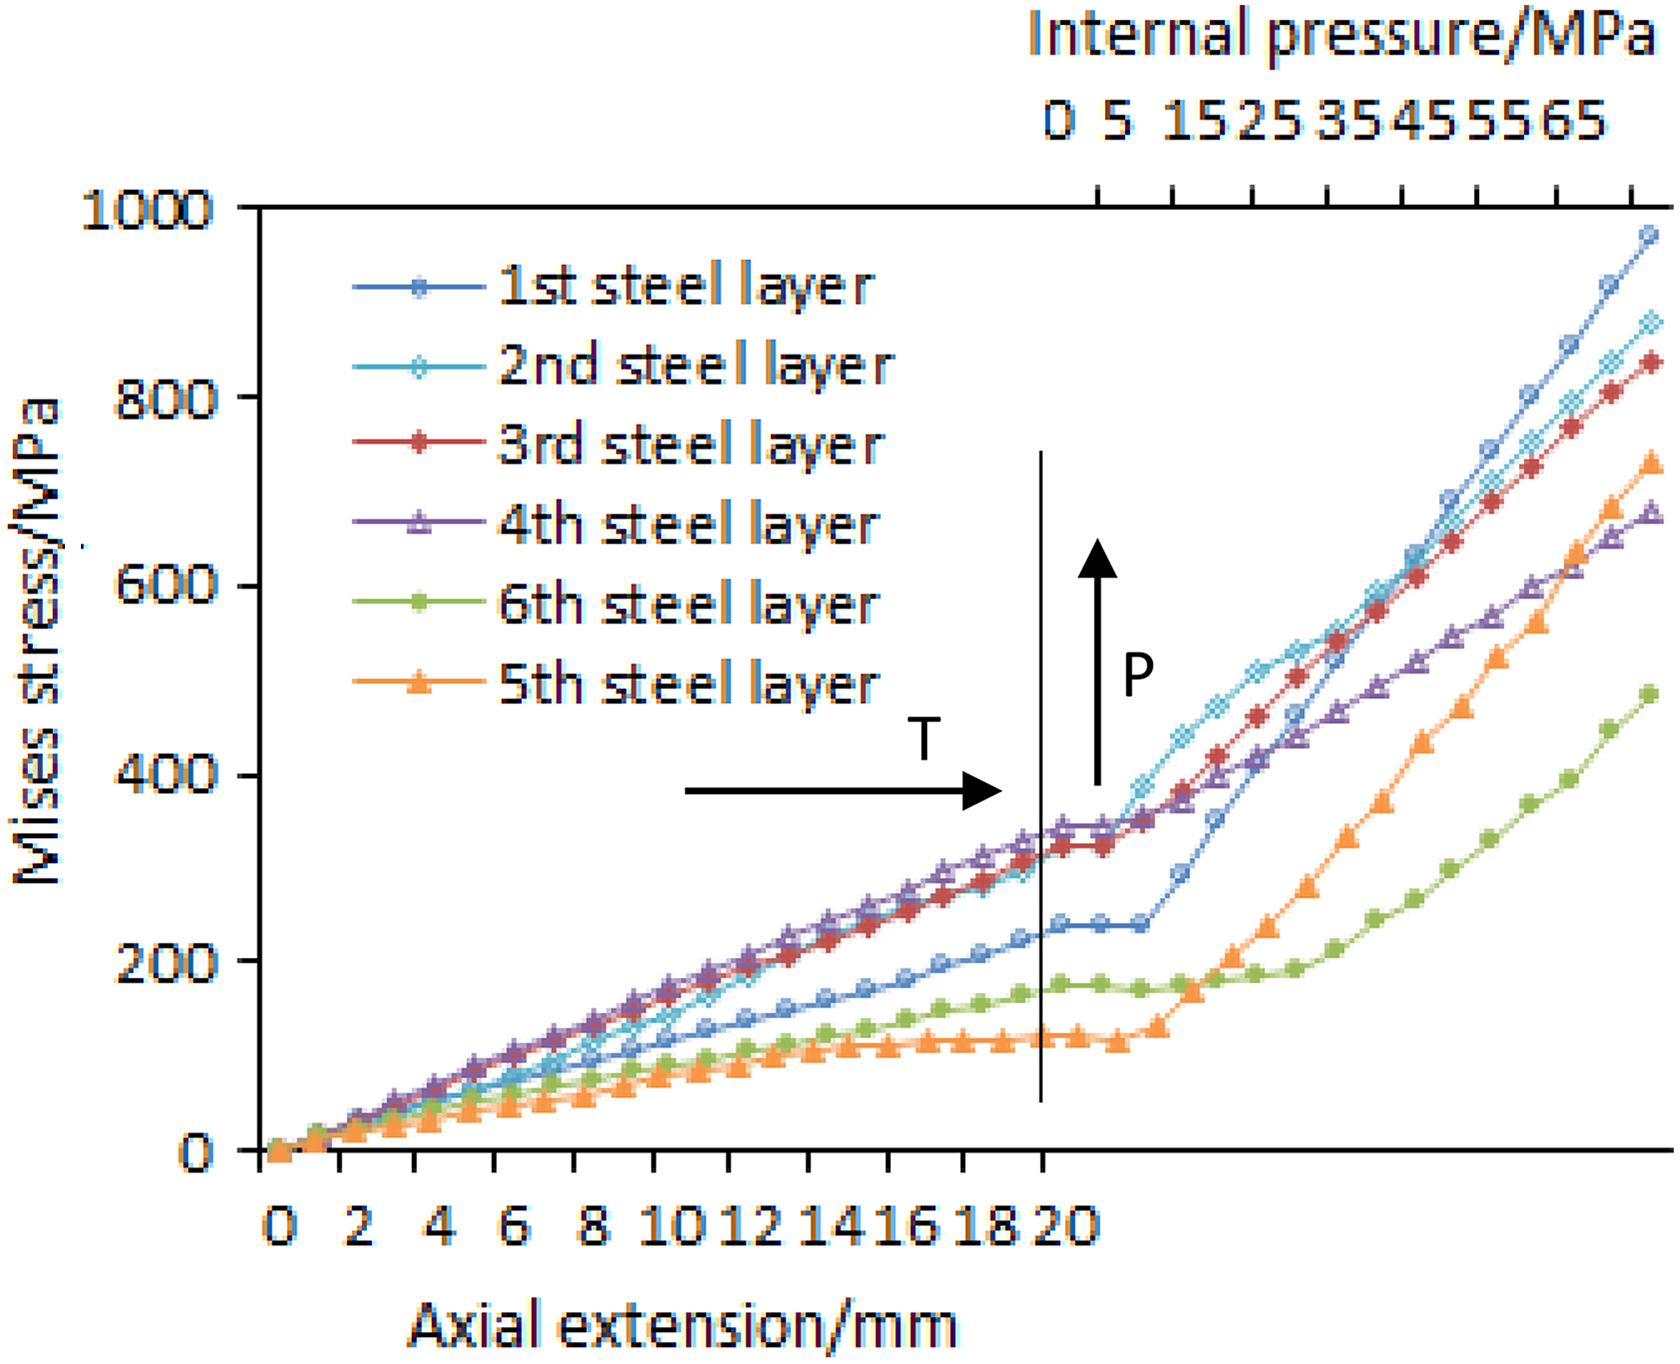
Mises stress variation of each steel layers under axial extension → internal pressure load.
Another phenomenon in Figure 18 that is worth noting is that Mises stress increases faster in an internal pressure step than that in an axial extension step. This phenomenon can be explained by “strip-slack effect,” 17 which means that there exists a certain margin lengths of steel strip relative to the pipe geometry. In the first step, the pipe body is stretched axially and the margin lengths of steel strips are consumed gradually; in the second step, the steel strips are already pull taut and begin to undertake the burden from internal pressure. 18 Stress nephograms of the innermost steel layer in Figure 19 also suggest that Mises stress does not increase much in the axial extension step. When the axial extension reaches 20 mm, Mises stress of the innermost steel layer ranges from 100 MPa to 420 MPa, while in the pressure step, it experiences rapid ascent. As the internal pressure reaches 50 MPa, Mises stress on much area of this layer has exceeded 700 MPa.
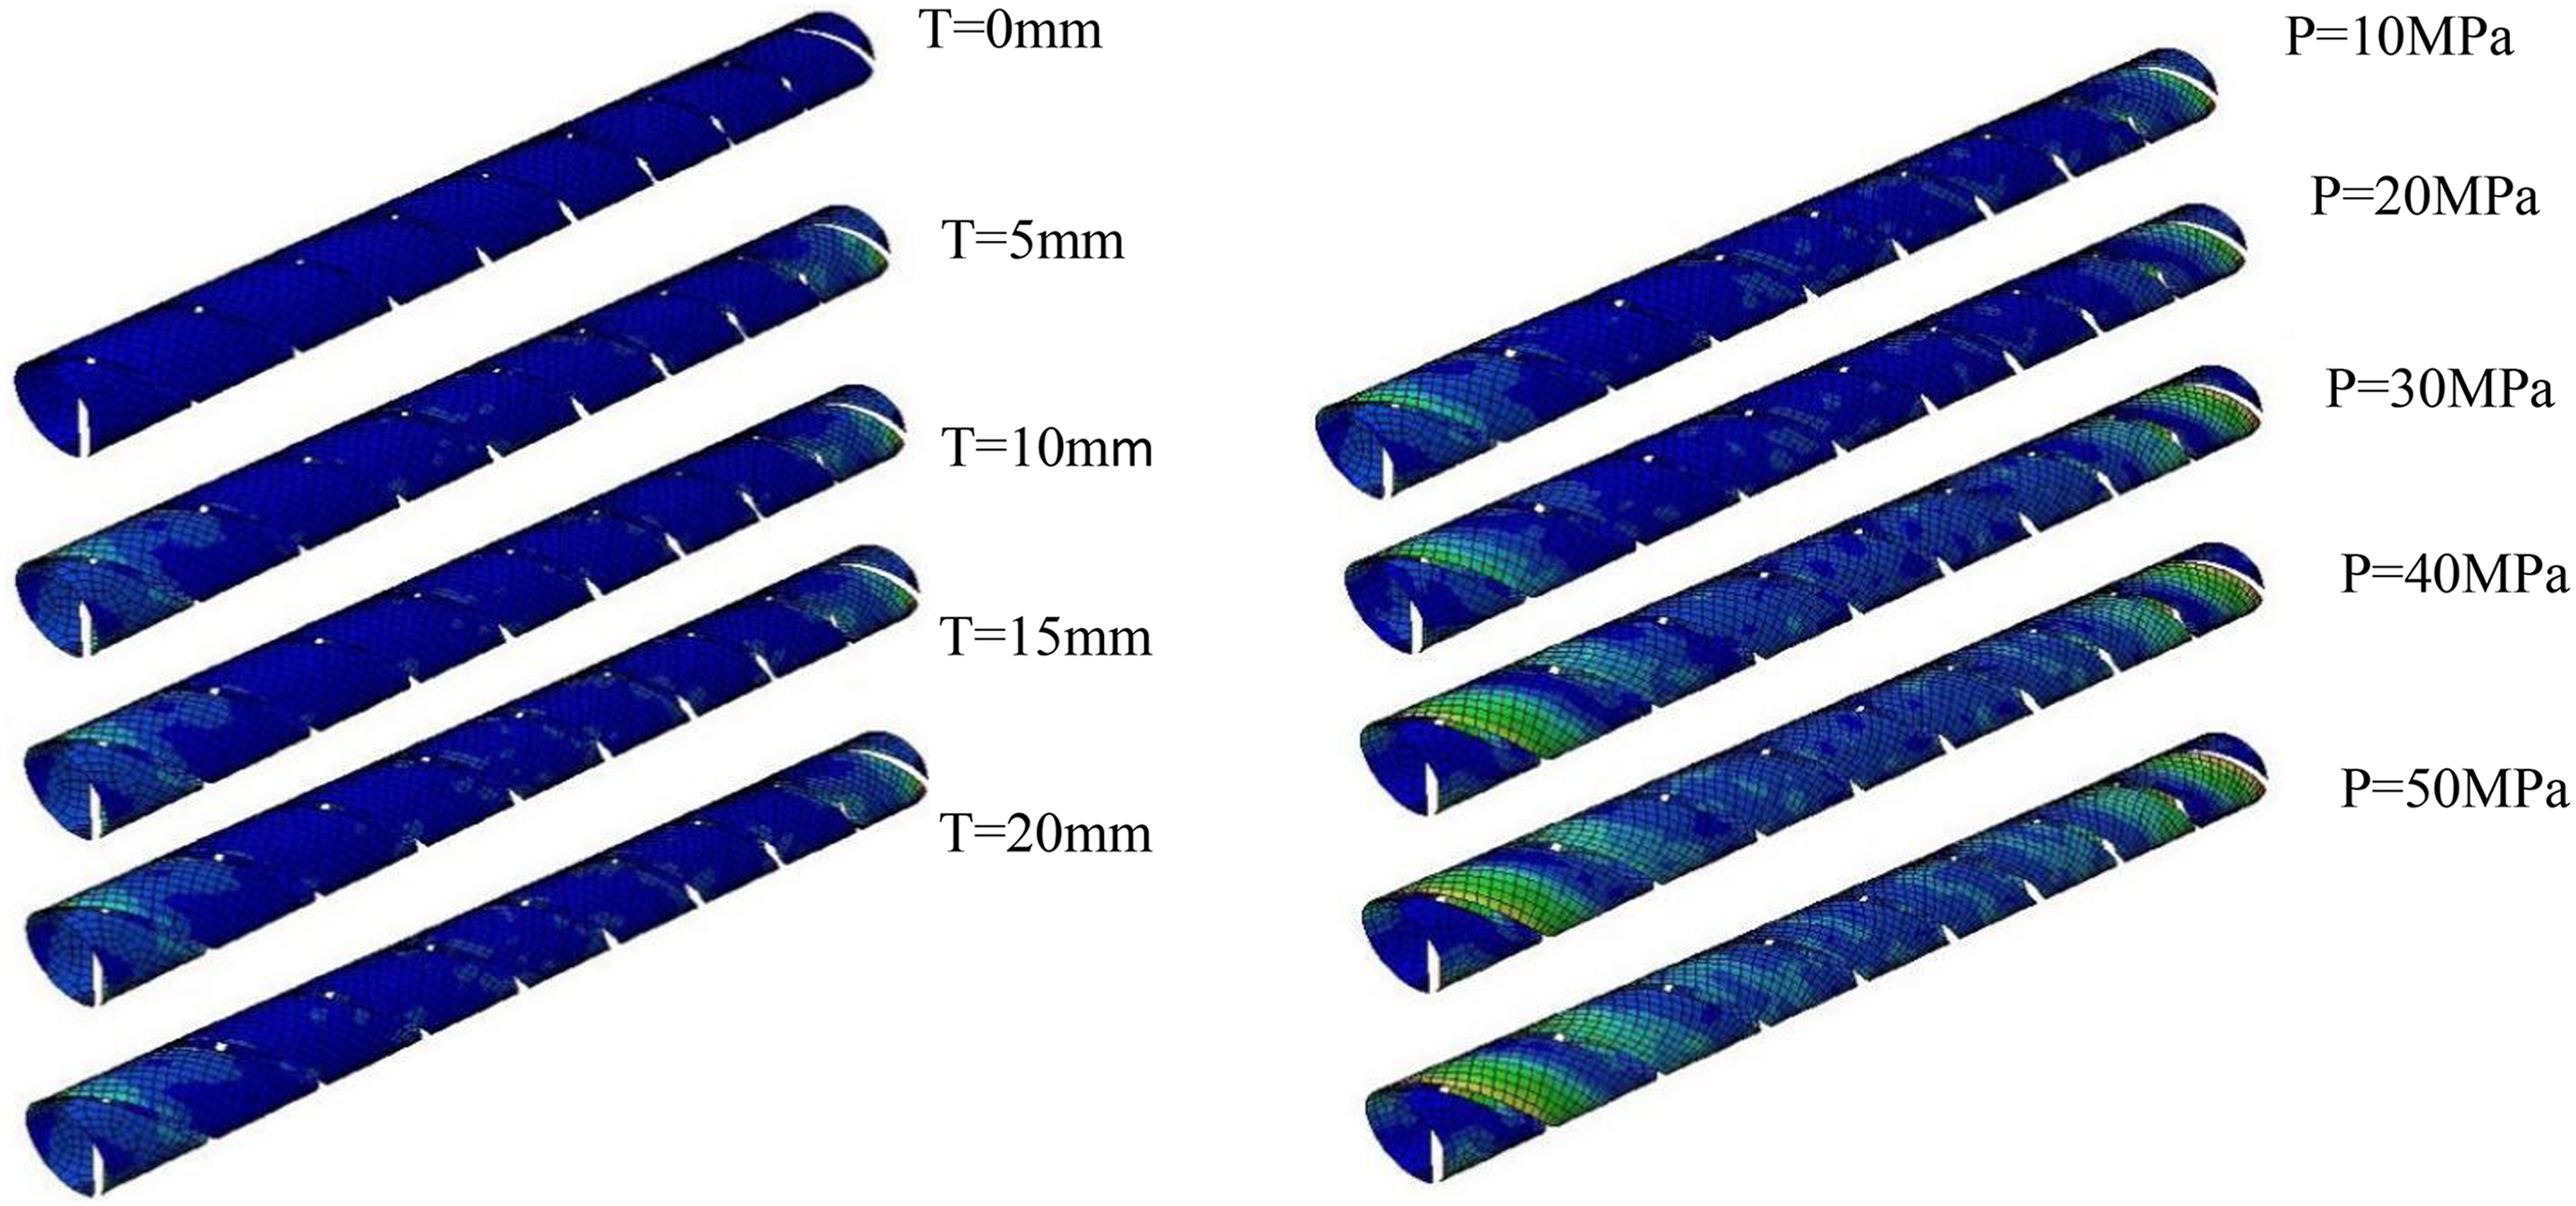
Sequence of Mises stress variation of the innermost steel layer under axial extension → internal pressure load.
As the applied internal pressure develops, the pressure acting upon the endcap also increases, and the axial force generated from such pressure will stretch the pipe axially, on the one hand; on the other hand, under such pressure, the pipe radius is expanded, and the pipe may be drawn back axially to make the deformation compatible, such that some part of the pipe may be elongated while some parts may shrink in axial direction in the second step. To demonstrate the pipe deformation status, three nodes on the innermost reinforcement layer are chosen to represent the displacement situations of the pipe. The location of these nodes are node 574 near the pipe end where the pipes are fixed, node 1062 at the middle part of the pipe, and node 1567 near the other end where the tension force is applied, as shown in Figure 20.
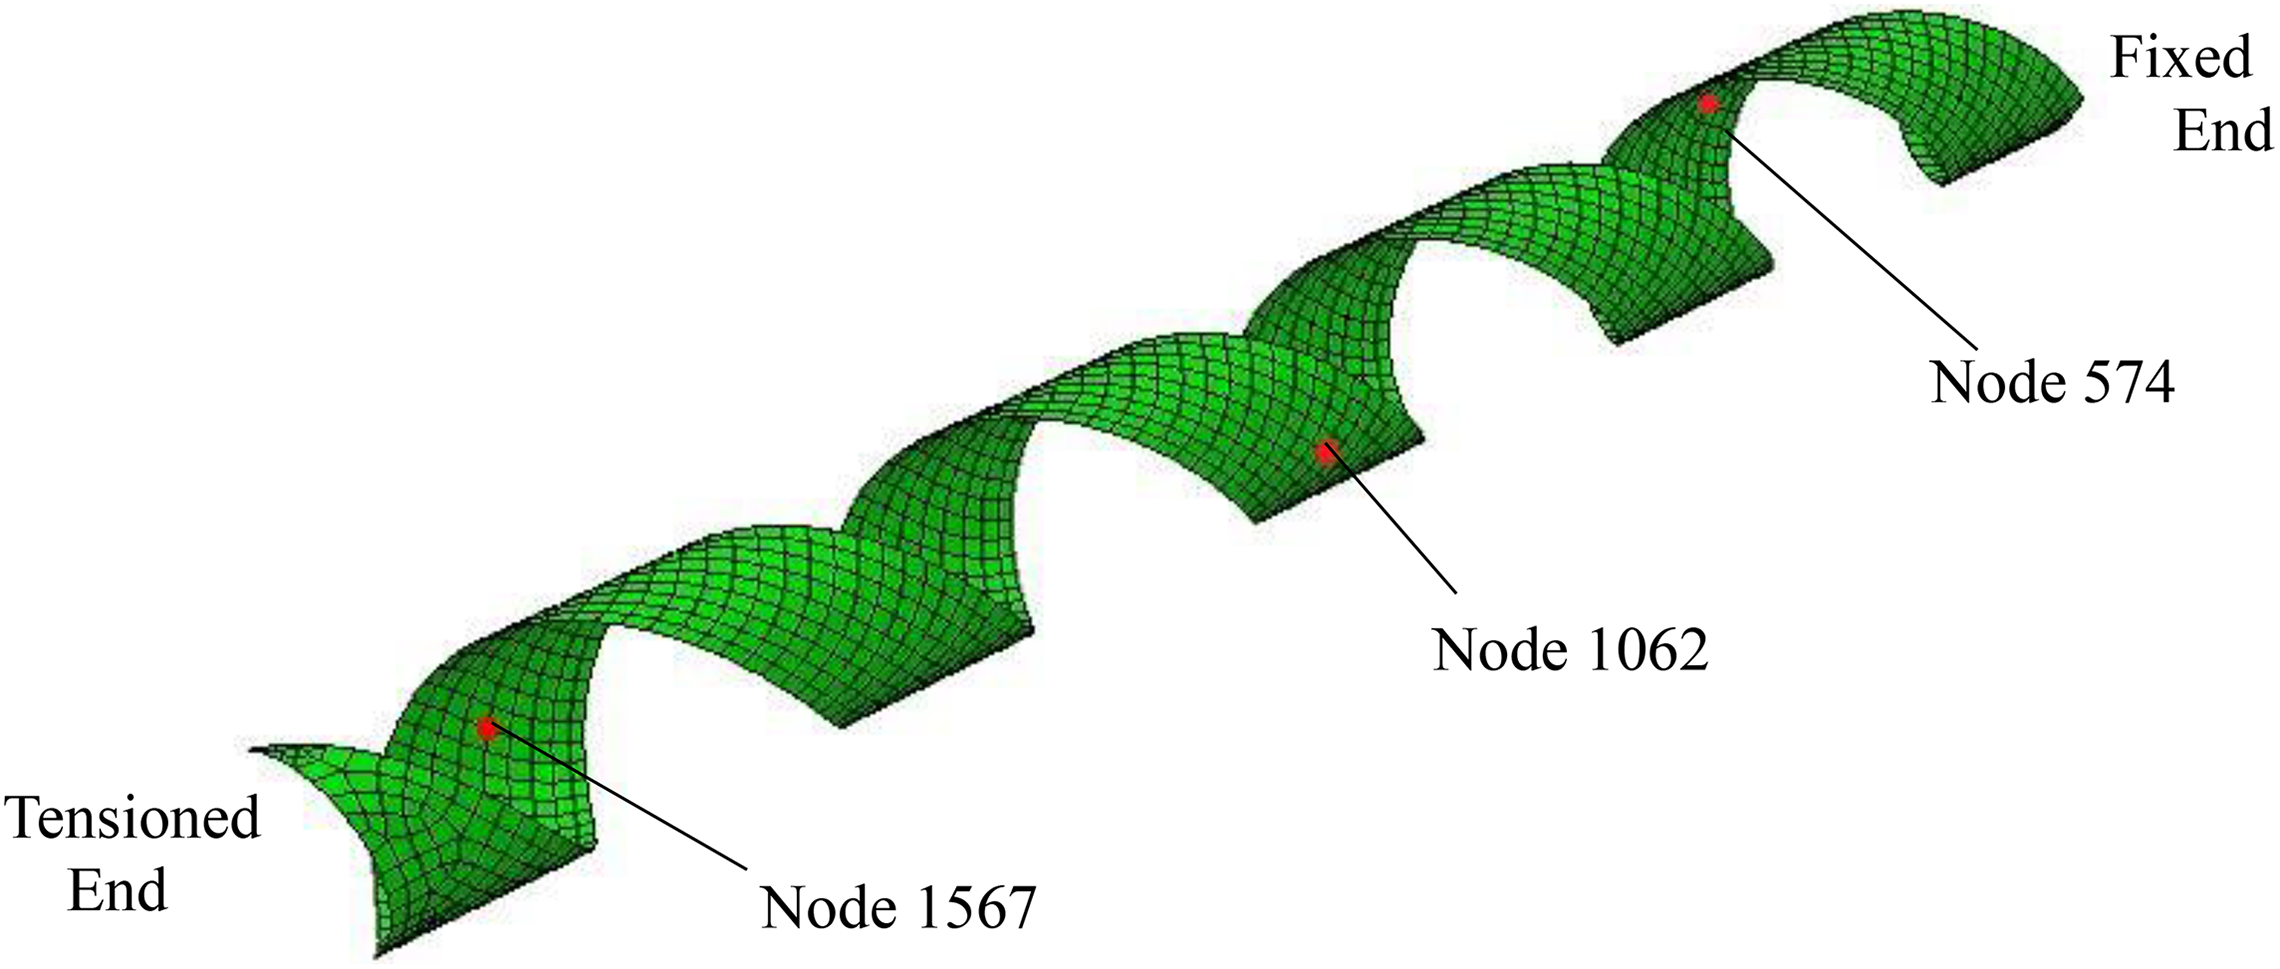
Location demonstration of three chosen nodes.
The original displacements of node 574, node 1062, and node 1567 after tension load are 3.182, 12.850, and 23.226 mm, respectively. After pressure load, the displacement data on node 574 show that this part has shrunk a little, as shown in Figure 21(a), and the axial displacement dropped from 3.182 to 3.079 mm. As node 574 is located near the fixed end and the deformation of this area is relatively uniform, the pressure–displacement curve of it appears to be very smooth. However, for node 1062 in the middle area of the steel strip, it experiences an undulating rising process from 12.851 mm to 12.875 mm, which means that this area is subjecting to complex stress status, the axial displacement due to endcap effect and radial expansion due to pressure are taking precedence over the other by turns, as is shown in Figure 21(b). Relation curve in Figure 21(c) shows that the displacement of node 1567 experience an ascending trend and then a descending trend. In the first half stage, the axial stretch due to endcap effect is greater than the influence of radial expansion and the pipe is elongated from 23.227 mm to 23.328 mm, and the corresponding loading pressure is 22.5 MPa. However, in the second stage, the influence of radial expansion due to pressure has dominated the deformation that the pipe displacement shrinks to 23.317 mm at the pressure of 35 MPa.
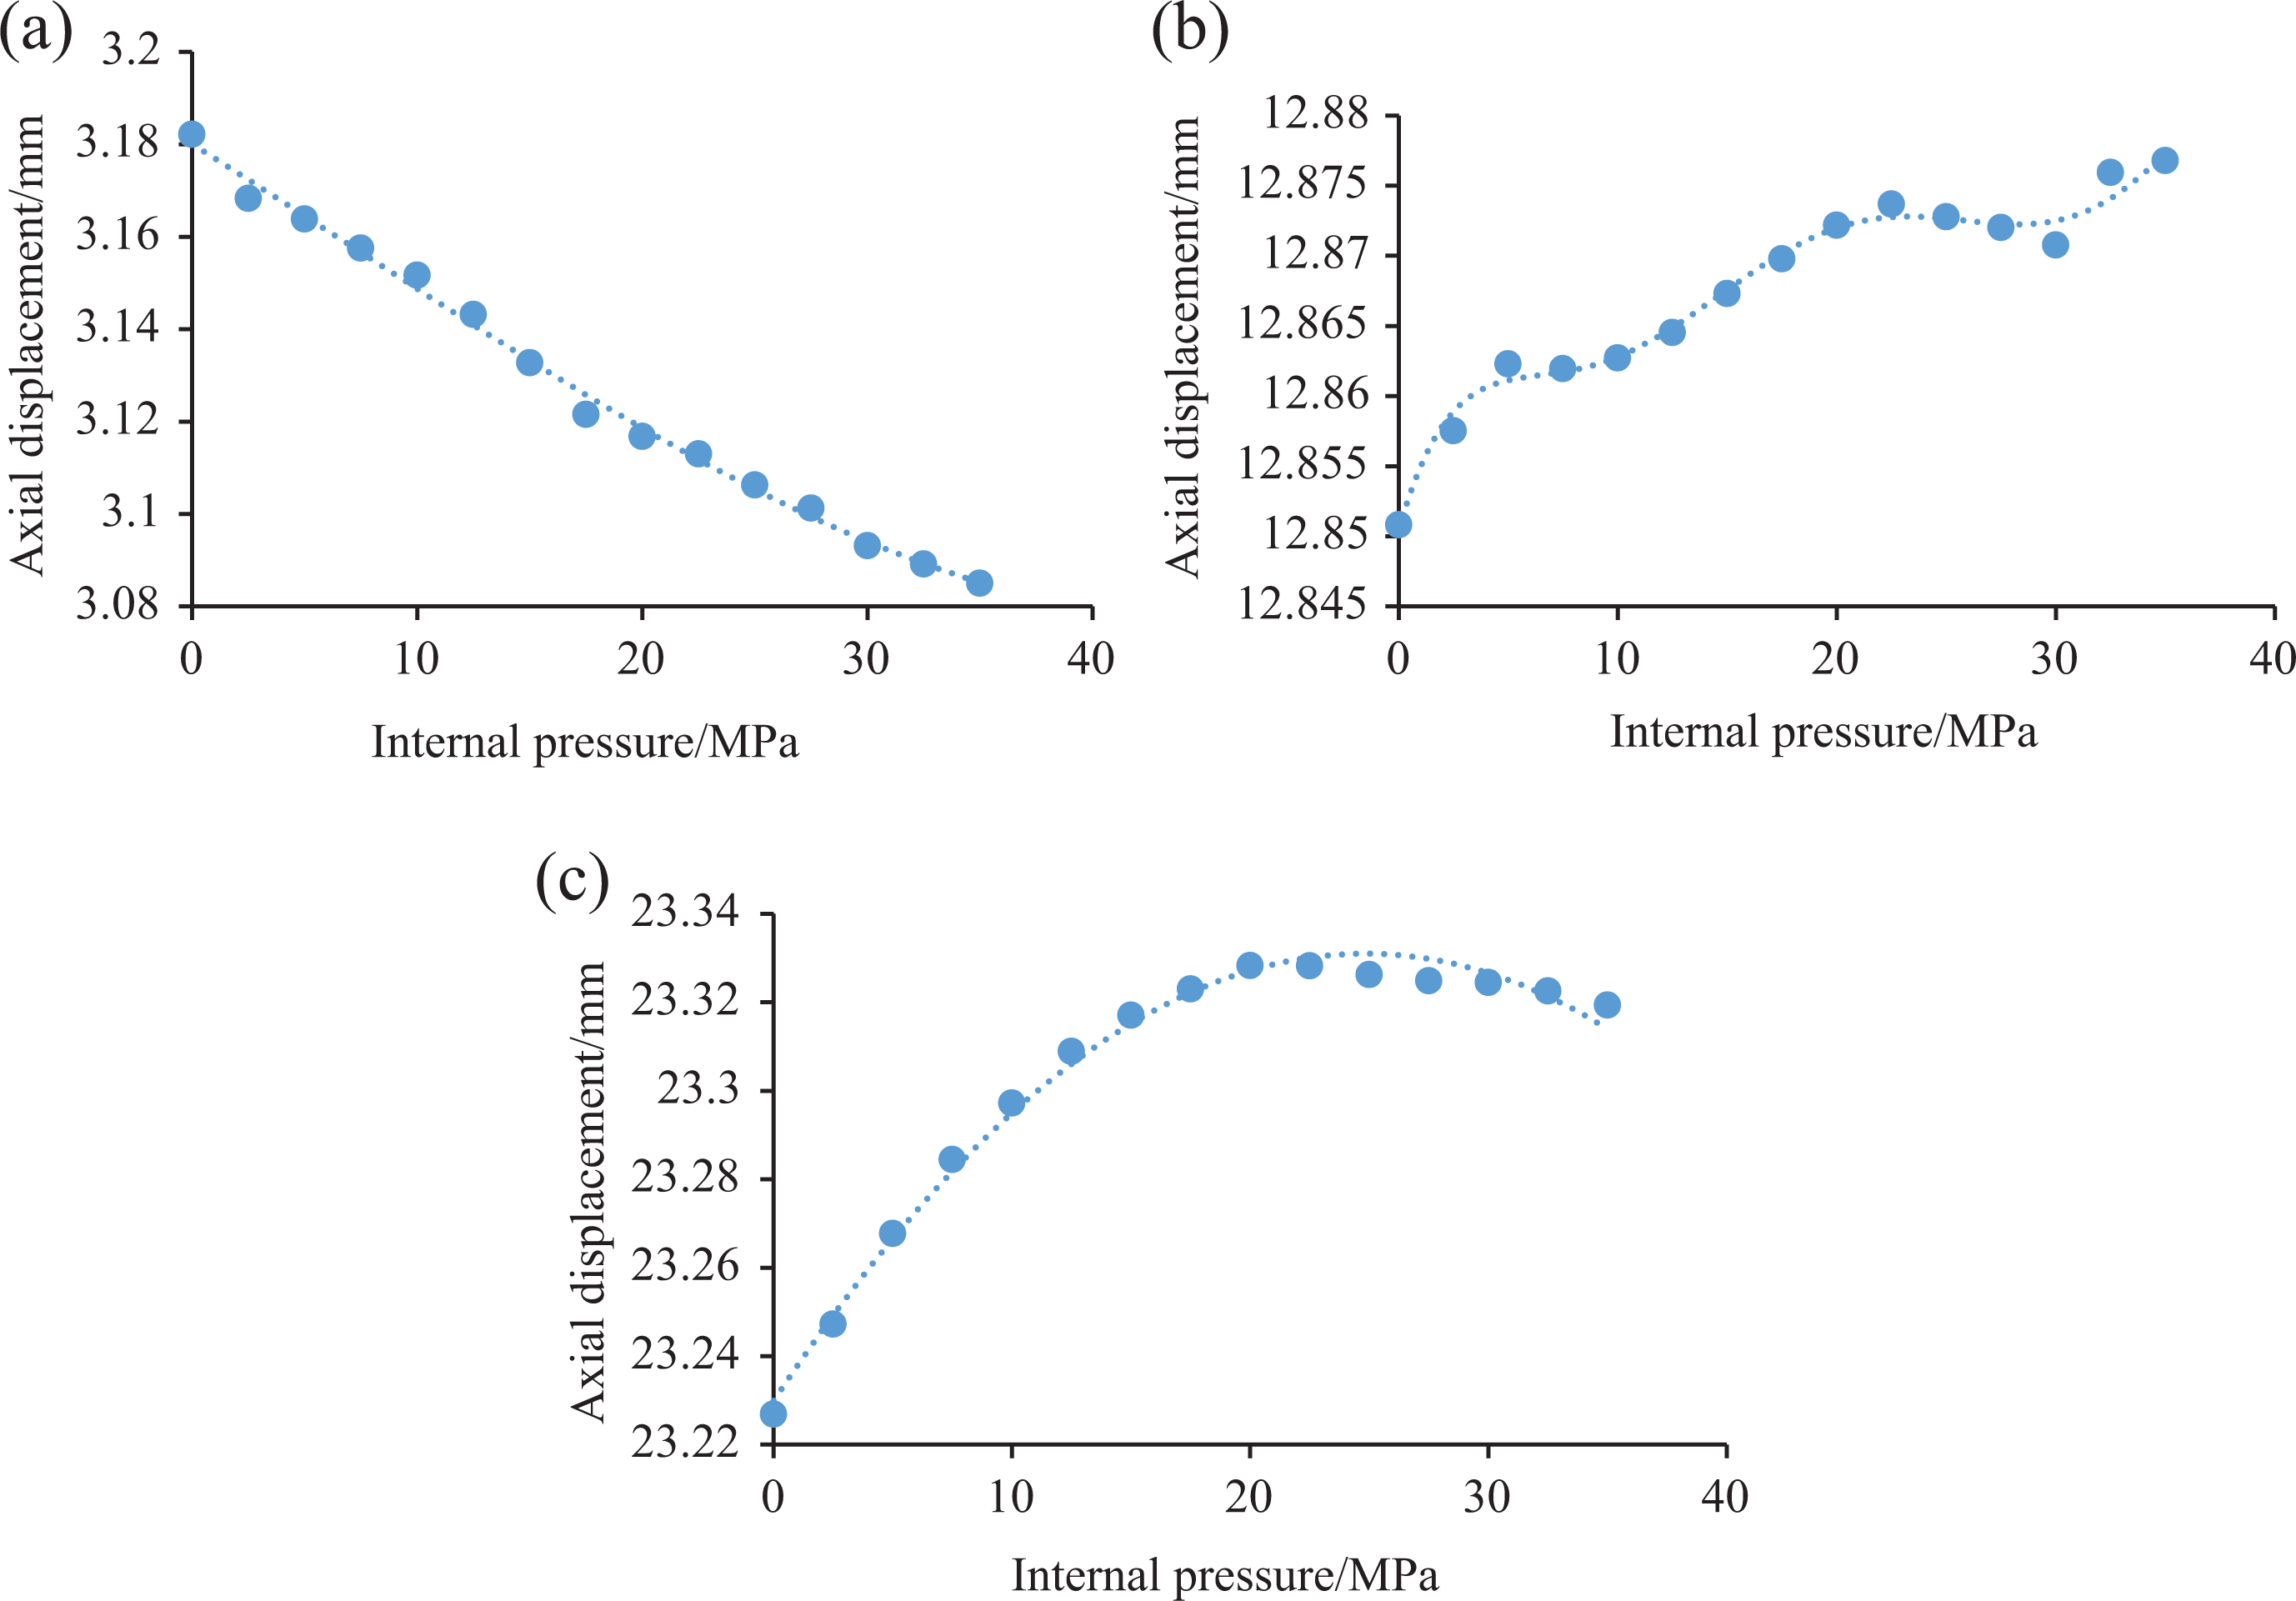
Axial displacement–pressure response of three chosen nodes. (a) node 574, (b) node 1062, and (c) node 1567.
Mechanical behavior of HDPE layers
When subjected to tension load, the pipe’s steel strip layer has strong tendency to shrink, and the inner HDPE layer provides a resistance to stop them from such deformation. While under internal pressure, the steel strip layer will resist to stop the inner HDPE layer from expanding. Therefore, the two mentioned layers have strong interaction with each other. Because of the manufacturing technique, a certain width of gap exists between the steel strips within the same steel layer. The Mises stress nephogram in Figure 22 has shown that there is an obvious narrow strip stretching along the winding direction, indicating that the Mises stress of HDPE materials that in the gap area and steel strip covered area are different. Quantitative comparison of their Mises stress is presented in Figure 23.
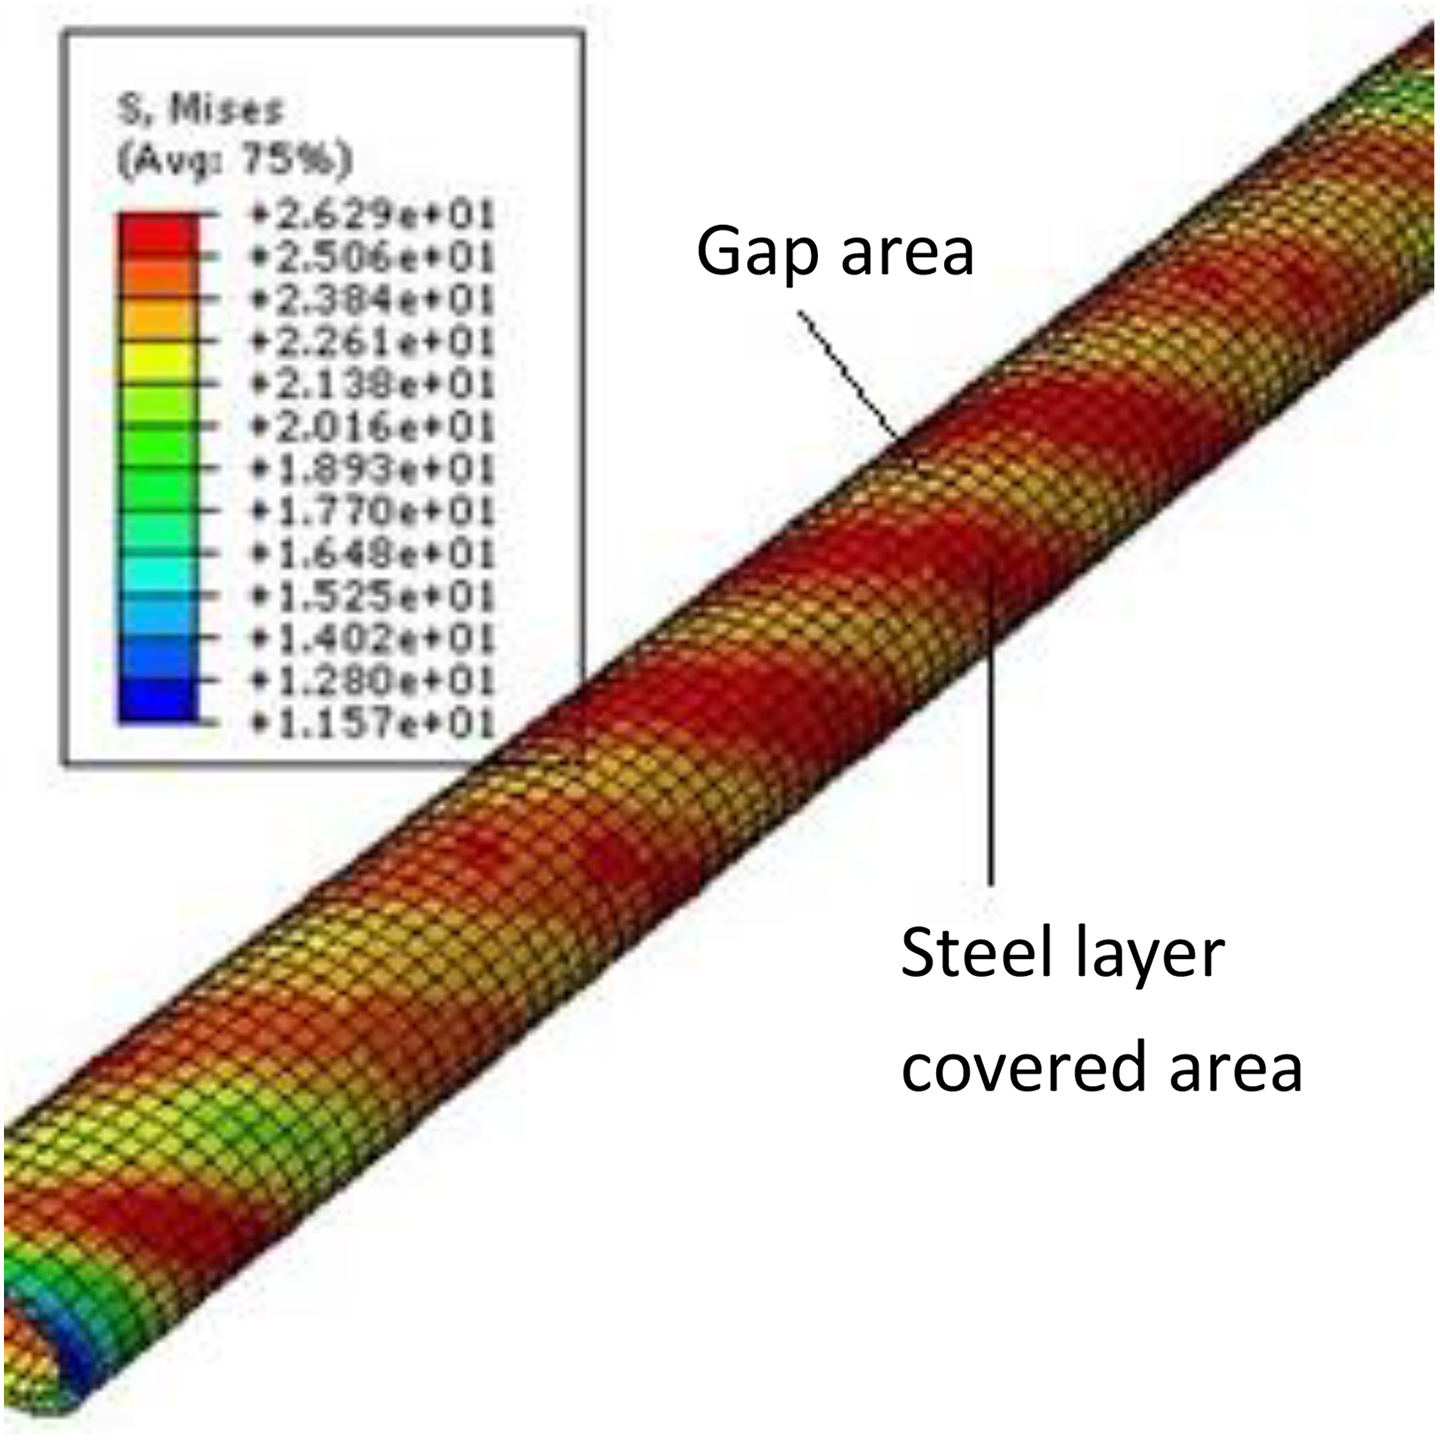
Mises stress nephogram of inner HDPE layer.
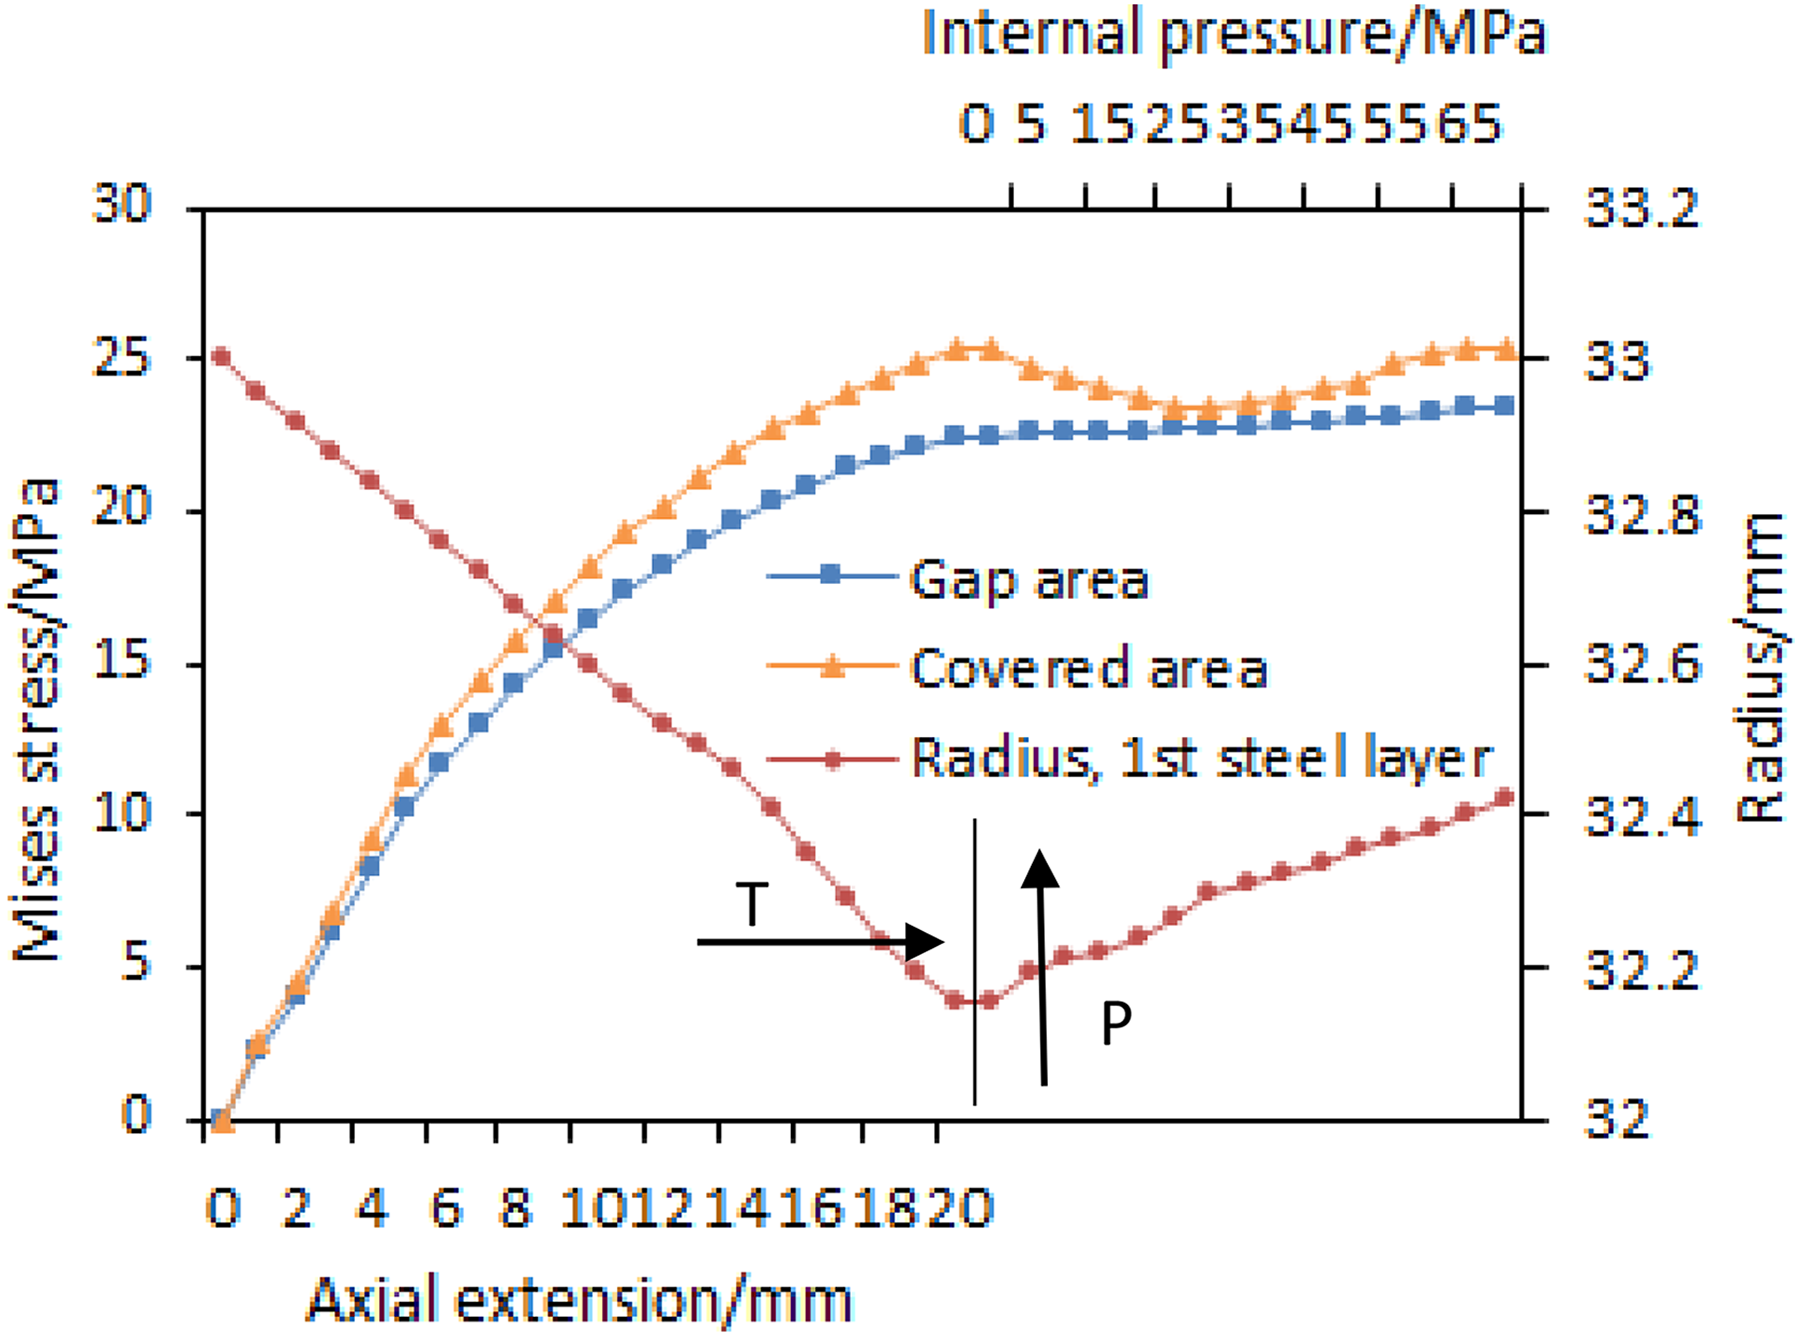
Variations of the first steel layer radius and inner HDPE layer Mises stress.
It is observed from Figure 23 that the Mises stress of the HDPE material in gap areas experiences relatively smooth variation trend during axial extension → internal pressure load, while Mises stress of the HDPE material in steel strip covered area shows a sudden decrease in the beginning stage of the internal pressure load. This is due to the expansion of the pipe diameter caused by internal pressure. As shown in Figure 23, the radius of the first steel layer increases as the internal pressure develops; at first, it has relieved some stress of the HDPE material caused by the covered steel strip, and the Mises stress decreases for a certain extent, and as the pressure grows larger, the combined radius expanding action and the steel strip constraint effect make the Mises stress experience another ascent stage.
However for outer HDPE layer, the situation is rather different. As shown in Figure 24, neglecting the end part, the distribution of Mises stress is quite even in the middle span of the pipe. Comparison of maximum Mises stress of inner and outer HDPE layer in Figure 25 shows that during the tension step, the maximum Mises stress of inner and outer HDPE layer is almost the same, but in the beginning of the internal pressure step, the maximum value of that in the outer HDPE layer experiences a slight descent.
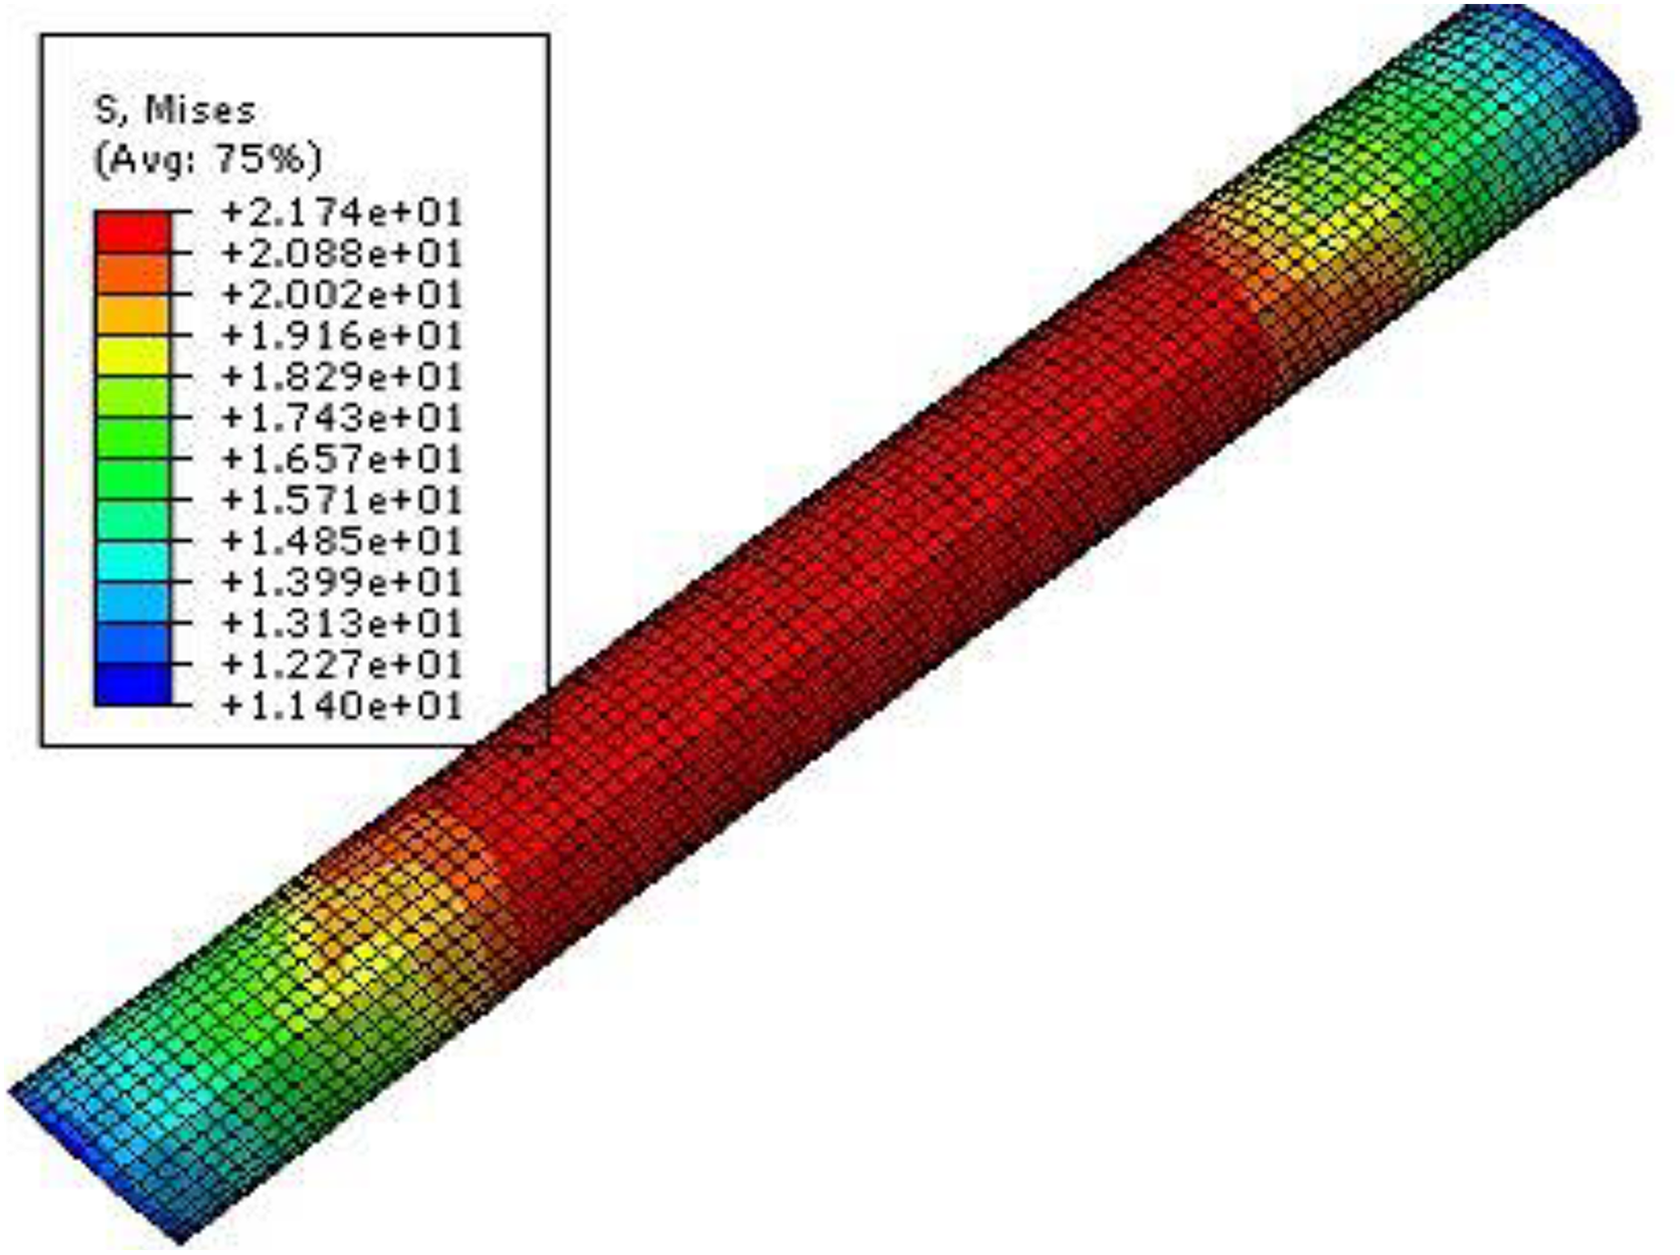
Mises stress distribution of outer HDPE layer.
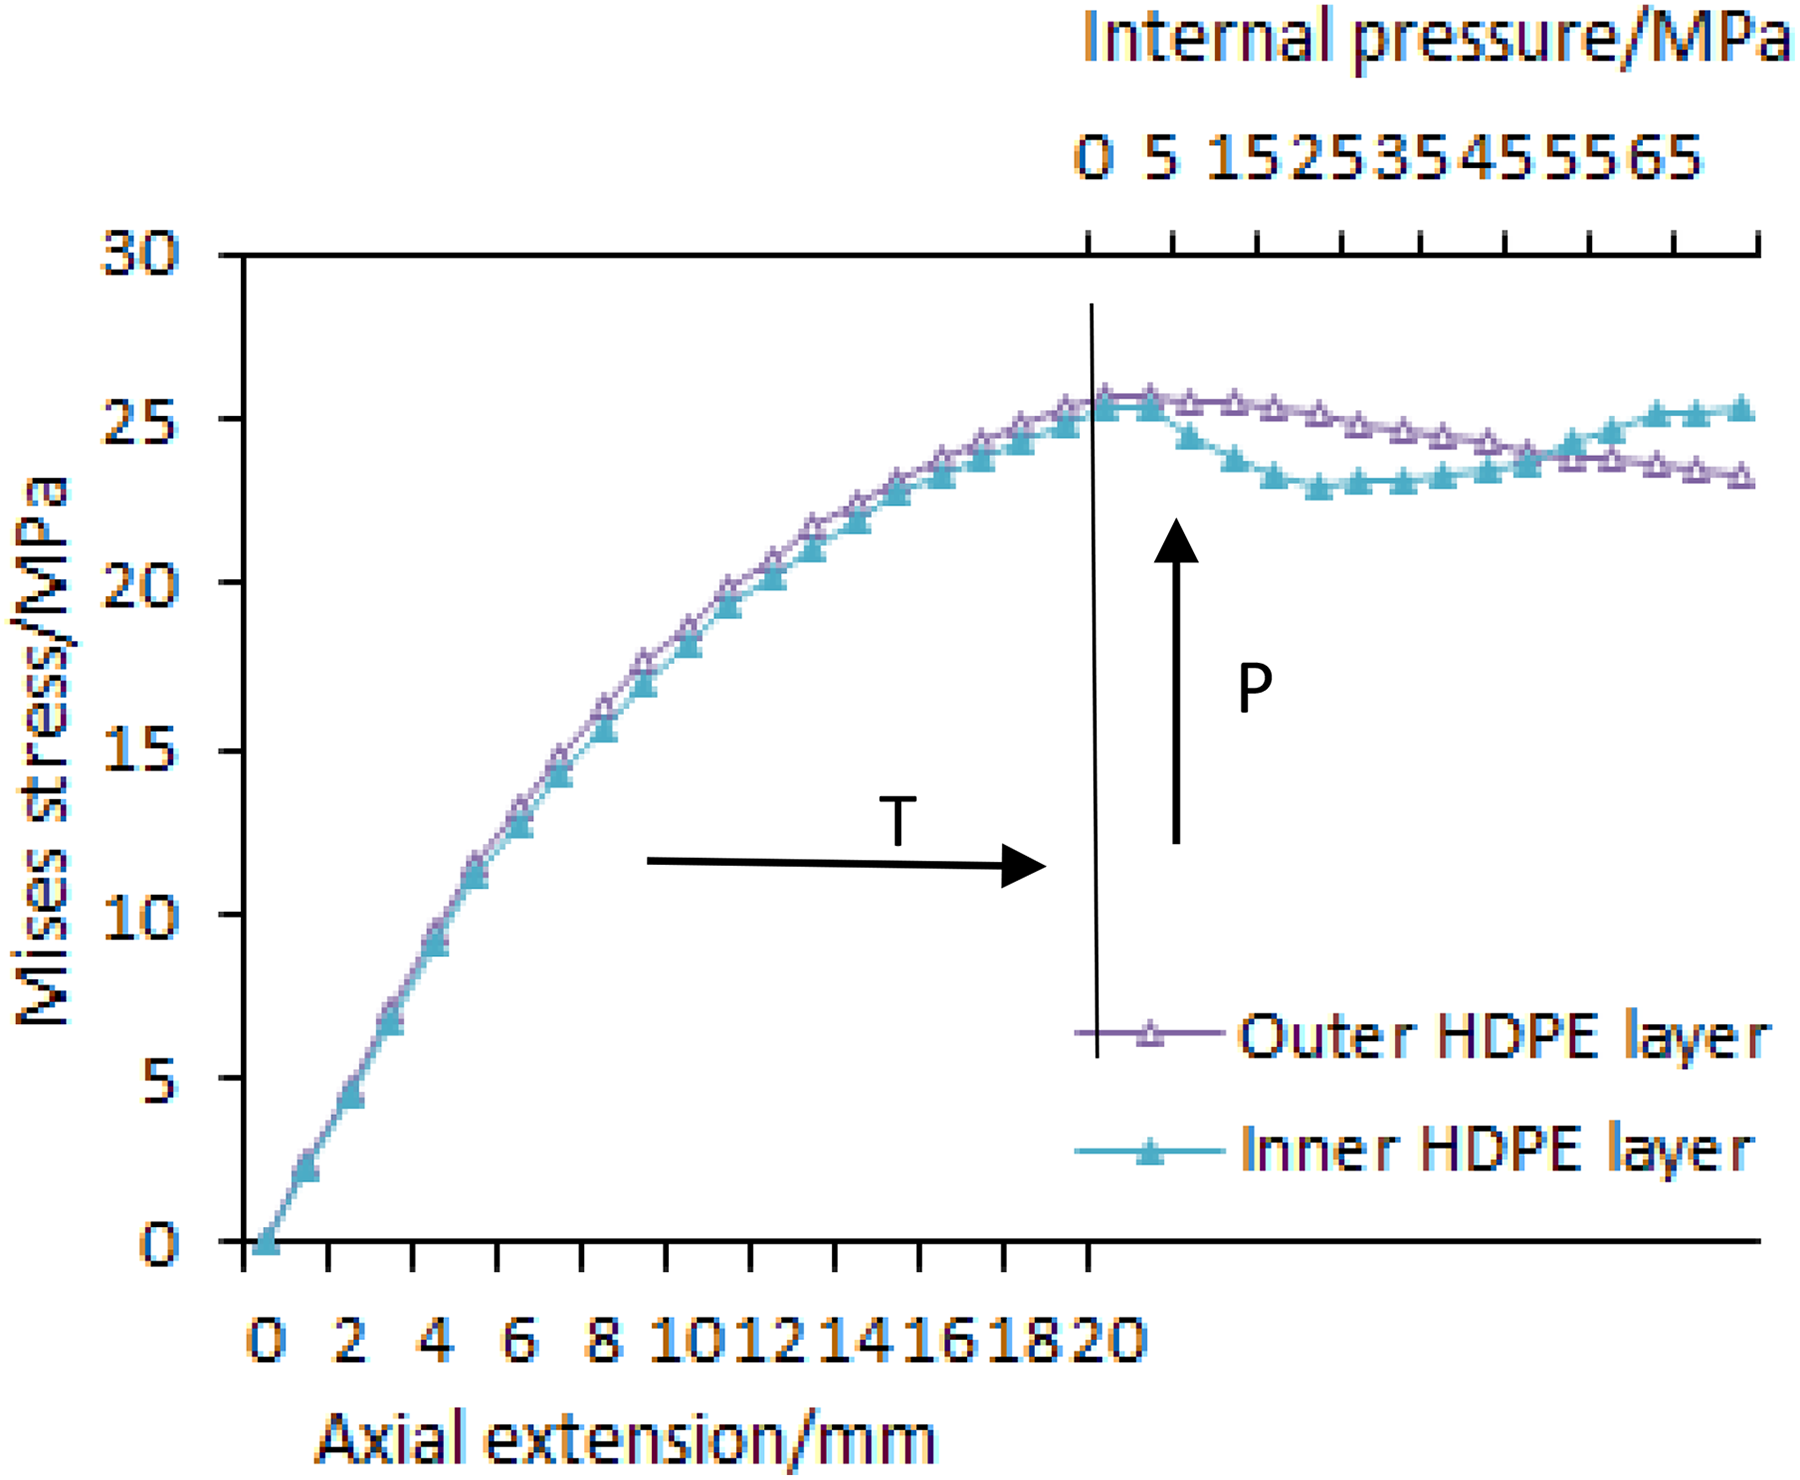
Comparison of maximum Mises stress of inner and outer HDPE layers.
Effect of different preloaded axial extensions
Based on the data in Figures 10 and 12, the current FE model is calibrated and regenerated to study the burst strength of pipe under different preloaded axial extensions.
Figure 26 shows Mises stress–internal pressure relation of the first steel layer after preloaded axial extensions, and the changes in the radius are also presented in the figure. The preloaded axial extensions range from 0 mm to 30 mm, and the original radius of the first steel layer before deformation is 33 mm. From the stress variation curves, it can be easily noticed that the Mises stress increases fastest in the case of pure internal pressure load. Conversely, the axial extension has decreased the steel strip winding angle and diminished the hoop rigidity of the pipe, which would make the pipe more prone to deform radially under internal pressure. This is manifested in the figure that pipes subjected to larger axial extensions have experienced greater radius changes under internal pressure load. This, combining the Mises stress variation trend, has demonstrated that the preloaded axial extension could weaken the pipe’s antiburst capacity to some degree.
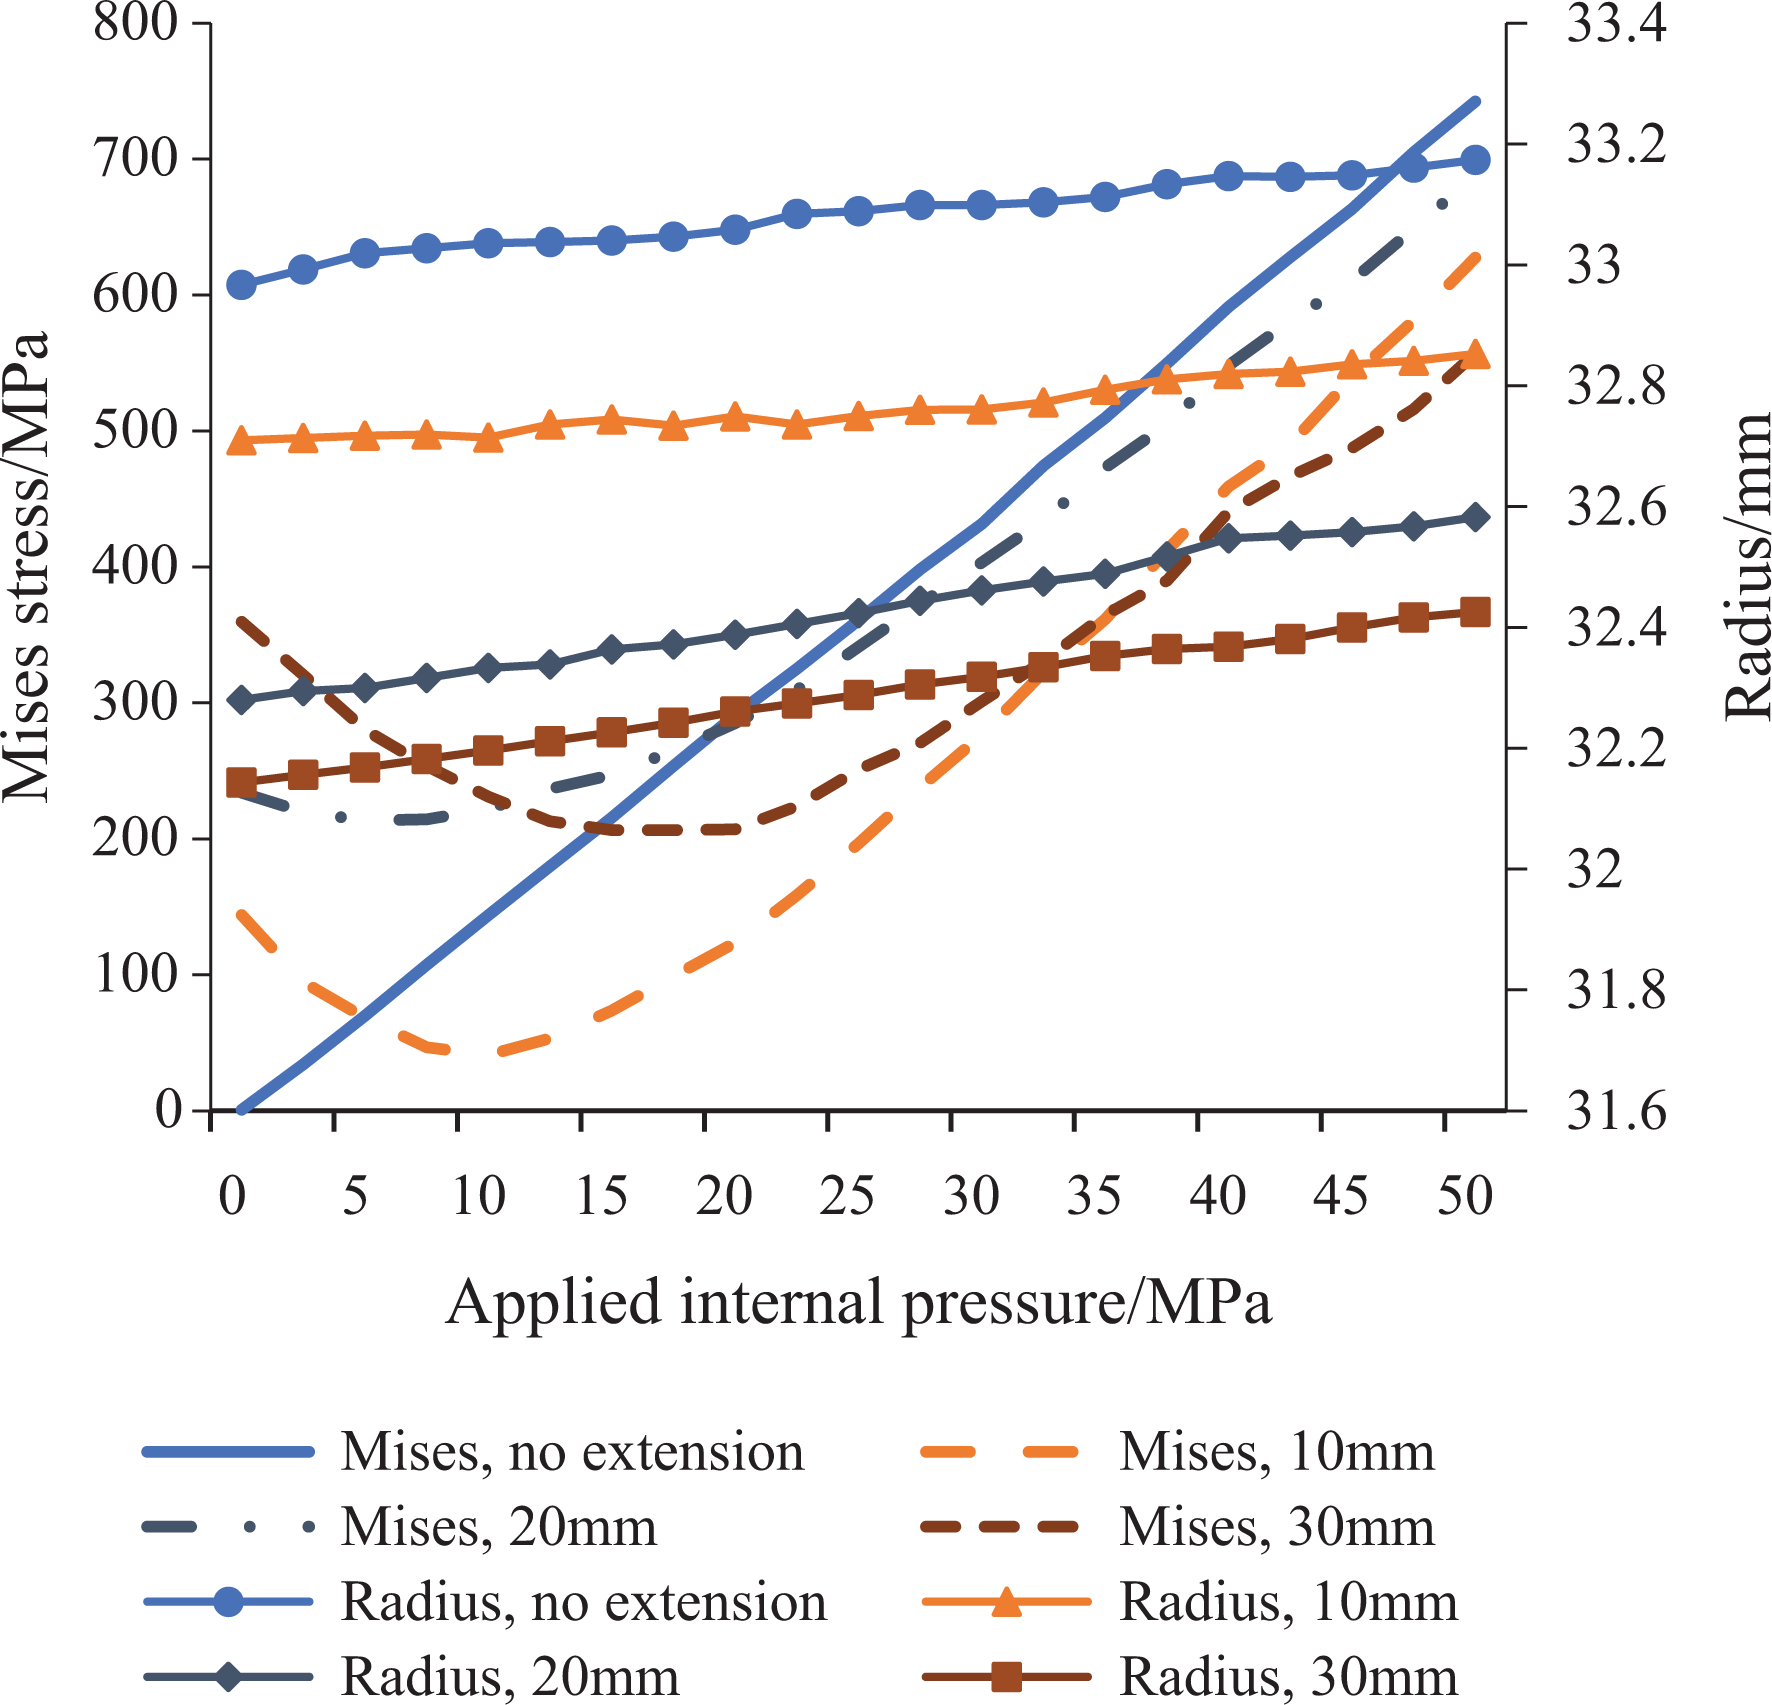
Mises stress and radius variations of the first steel layer after different preloaded axial extensions.
Sensitivity study
To represent more general situations, the effects of some key parameters on the pipe performance under axial extension → internal pressure load are studied with FE method.
Effect of diameter-to-thickness ratio (D/t ratio)
Diameter-to-thickness ratio (D/t ratio) is one of the key parameters that affect the pipe antiburst capacity, the thickness has to satisfy the hydrostatic pressure resistance, corrosion resistance, while the inner diameter determines its transportation capacity. 19 In this section, the mechanical behavior of the pipe with different D/t ratios is studied, the different D/t ratios are achieved by changing the pipe diameters while keeping the pipe’s cross-sectional structure and the total pipe wall thickness as constant.
Figure 27 shows the Mises stress variation of the innermost steel layer; the preloaded axial extension is 20 mm, and the proposed D/t ratios of the pipe are 3.3, 6.6, and 10, which are corresponding to pipe with inner diameters of 2, 4, and 6 in., respectively. From this figure, it can be found that Mises stress in pipes with smaller diameters experience faster increase in axial extension step but slower increase in the internal pressure step; opposite situation can be observed in pipes with larger diameters. In general, after preloaded axial extension of 20 mm, the burst pressures of pipe decrease as the diameters increase.
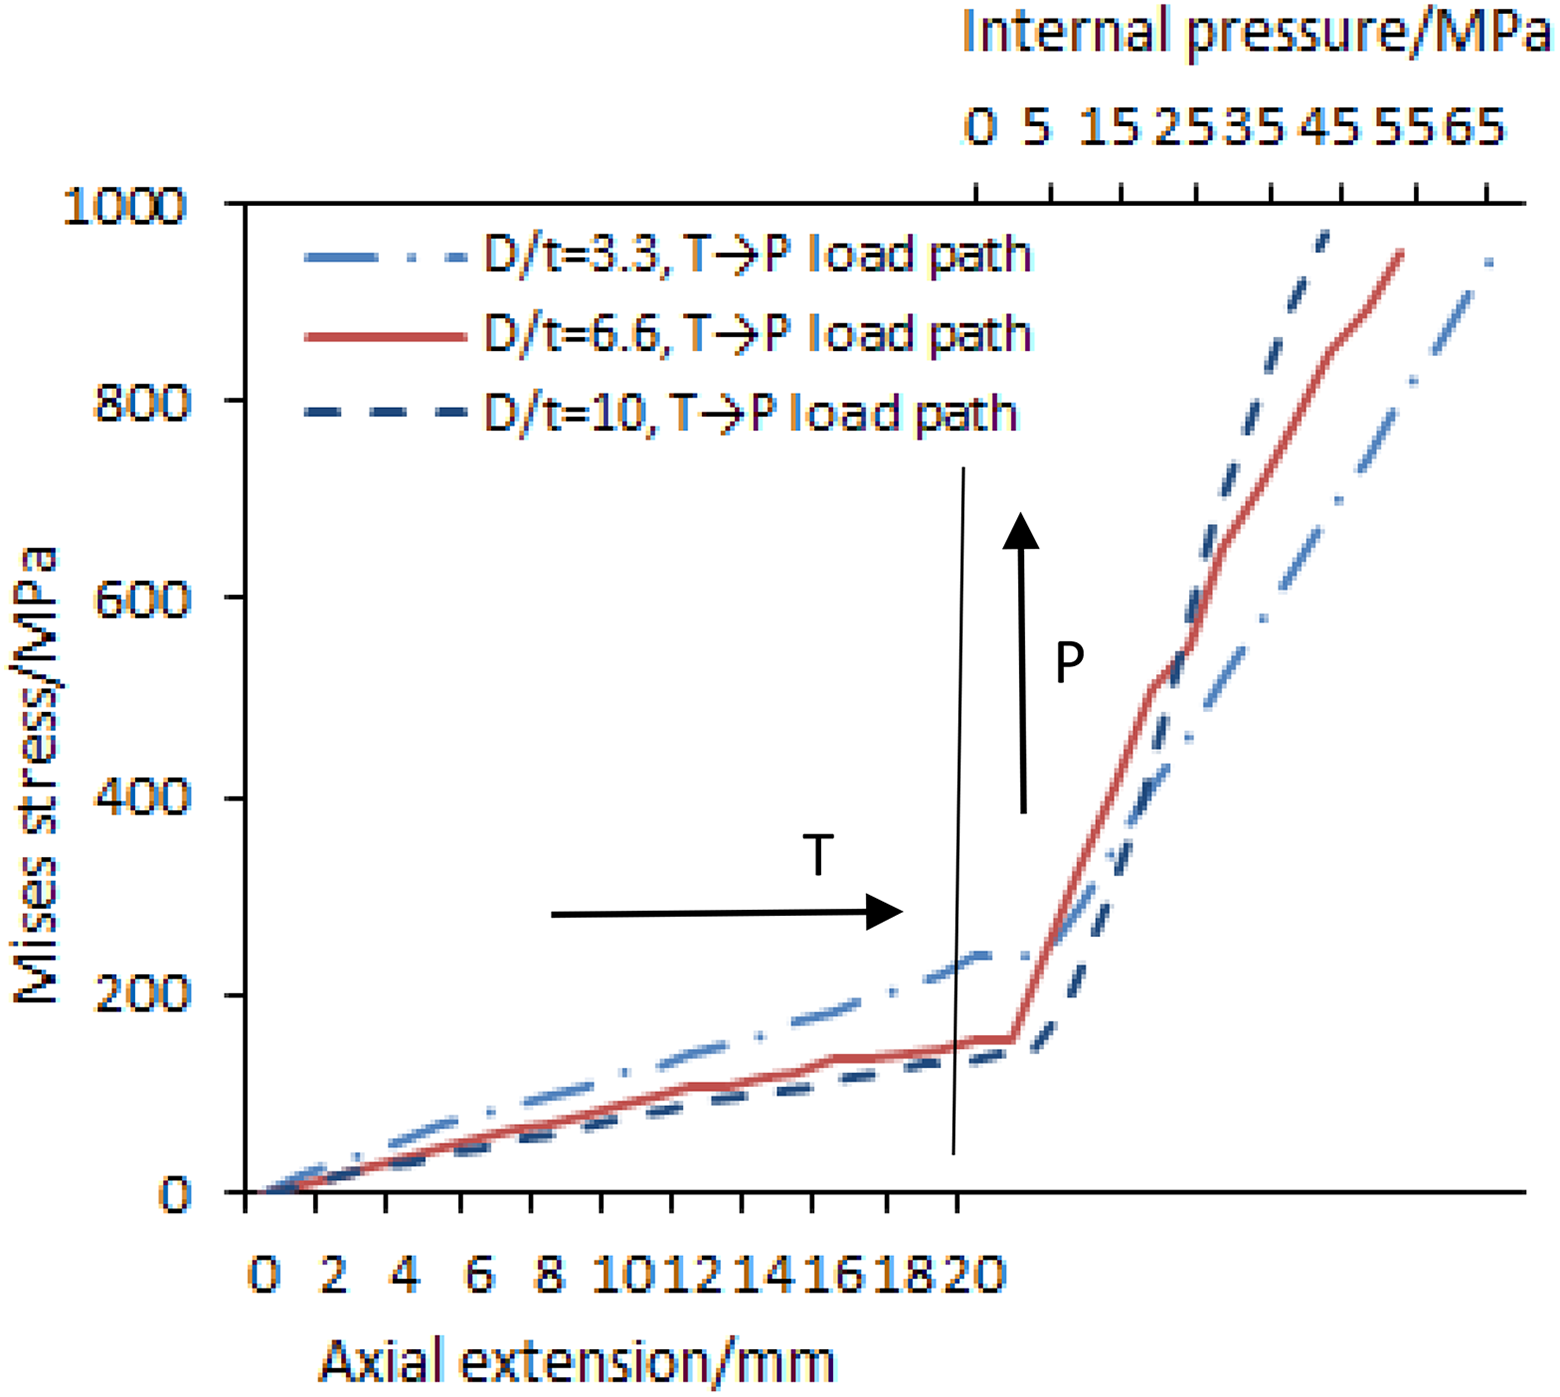
Mises stress variation of the first steel layer of pipe with different D/t ratios.
The failure pressure-preloaded axial extension envelopes for pipe with different D/t ratios are also presented in Figure 28, it is apparently that negative correlations can be observed between them, as the preloaded axial extension increases, the failure pressure of the pipe decreases.
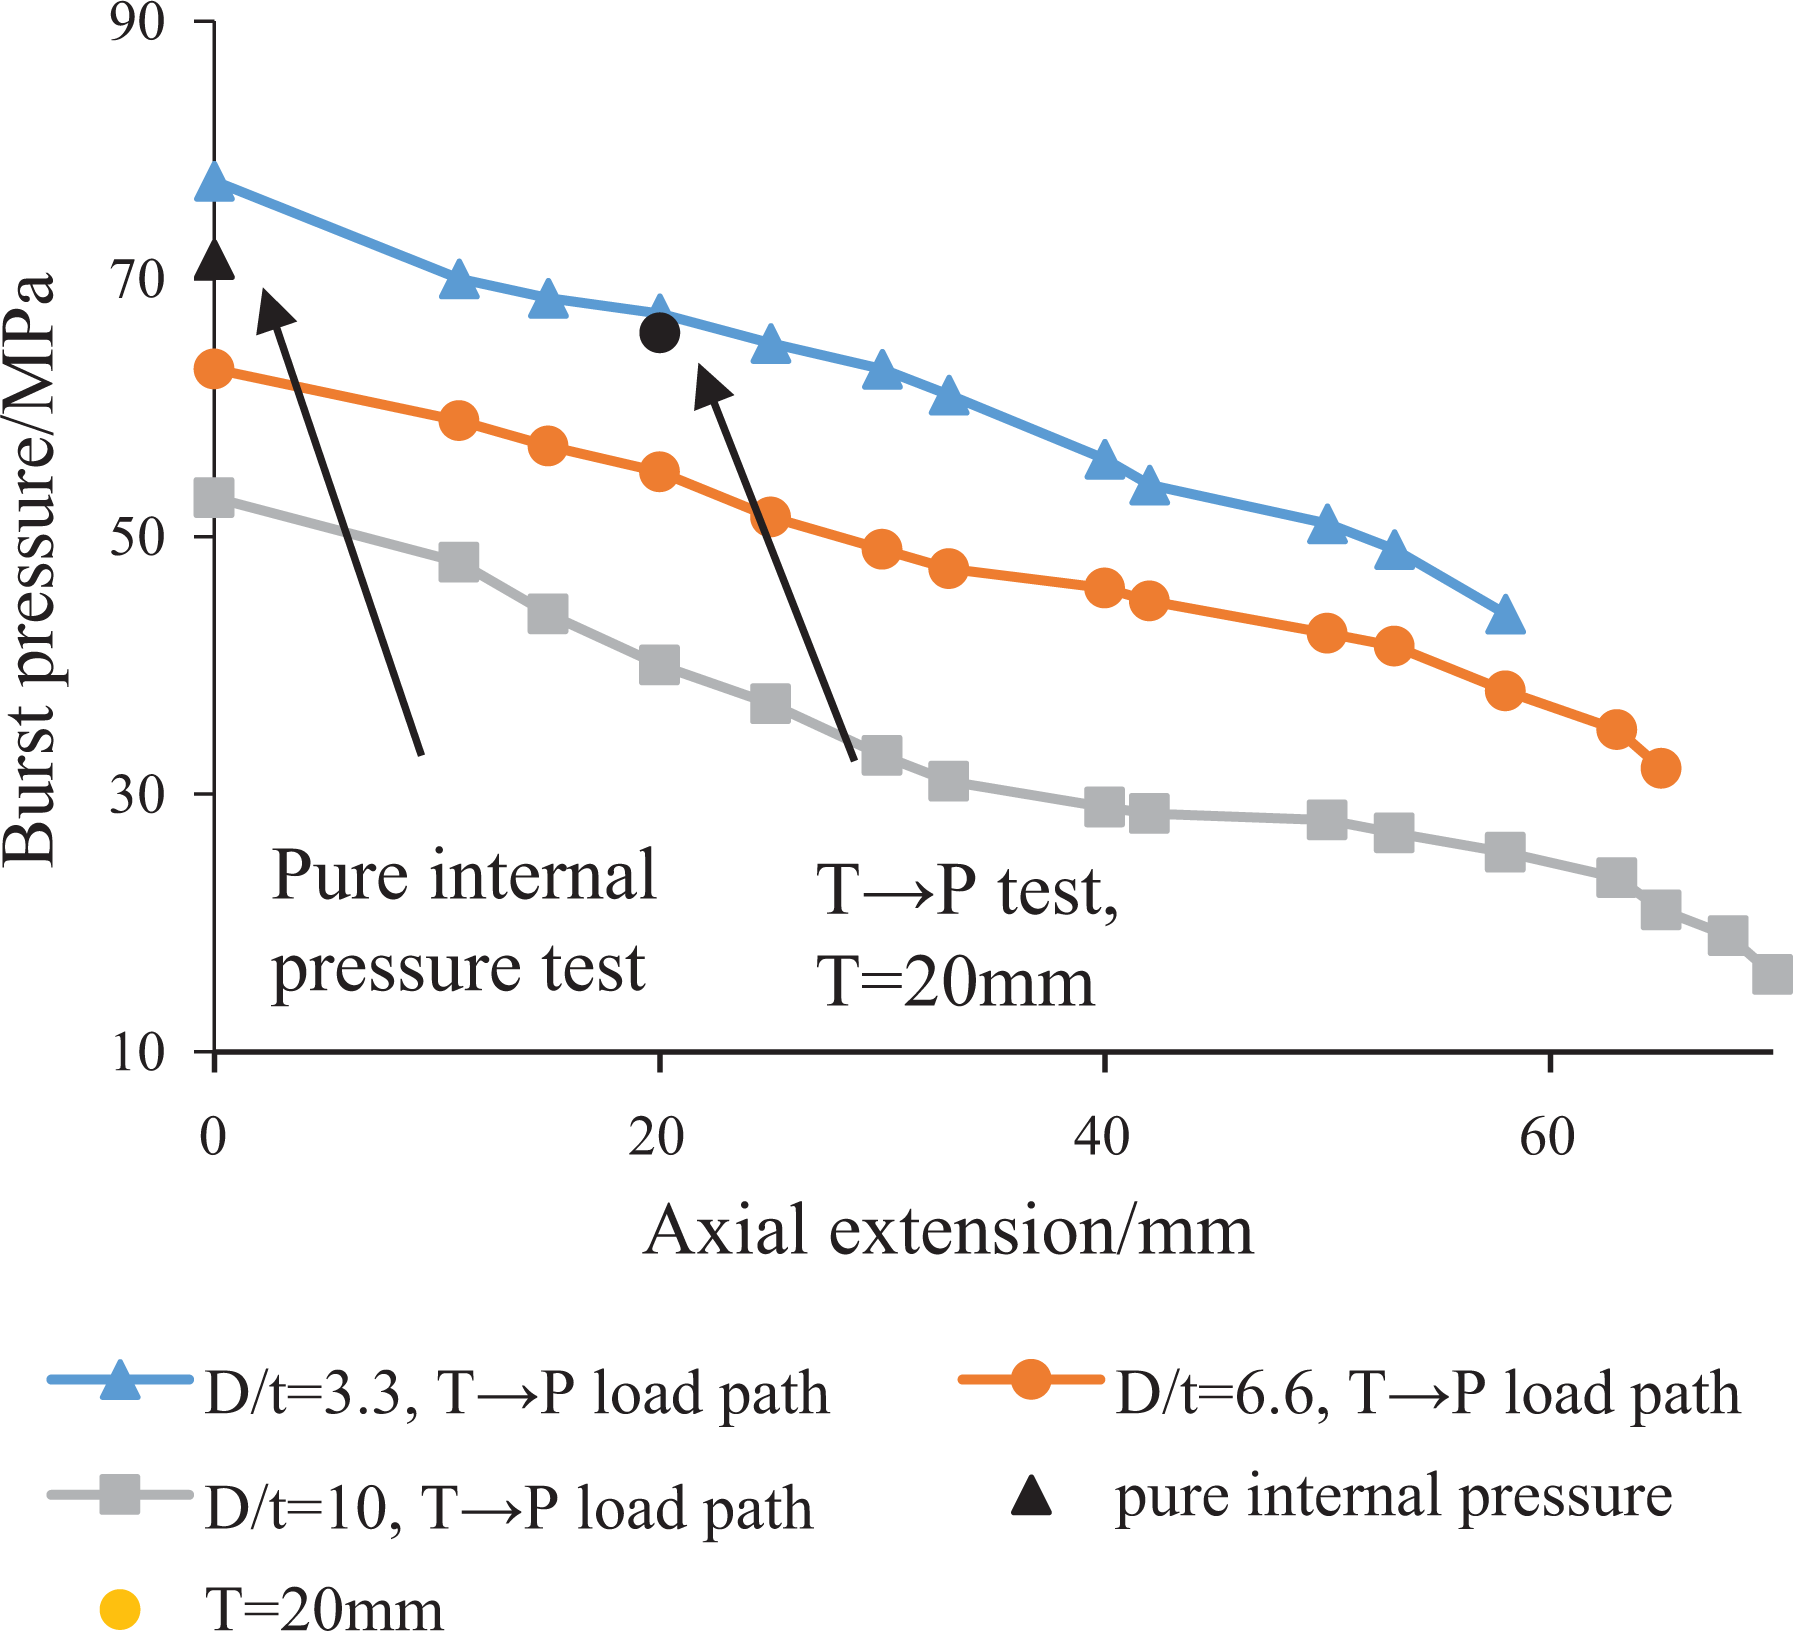
Failure pressure–axial extension envelopes for pipe with different D/t ratios in T→P load path.
Effect of frictional coefficient
The frictional coefficient between layers is another key parameter that may affect the pipe’s mechanical behavior under axial extension and internal pressure load. In this section, the HDPE-steel frictional coefficient is kept constant, while the steel–steel frictional coefficients are considered as frictionless, 0.15 and 0.35, 20 and the corresponding axial extension–axial load curve are shown in Figure 29. From this figure, it can be easily noted that the increase in steel–steel frictional coefficient could boost the pipe tensile capacity, whereas the failure pressure–axial extension envelops in Figure 30 show that pipe with smaller steel–steel frictional coefficients possess greater burst pressure. This situation might be attributed to the slide phenomenon of steel layers, that when under internal pressure, the pipe geometry may deform, and steel layers with smaller steel–steel frictional coefficients are easier to “adjust” themselves to a more suitable winding angle that could undertake greater burden from the pressure.
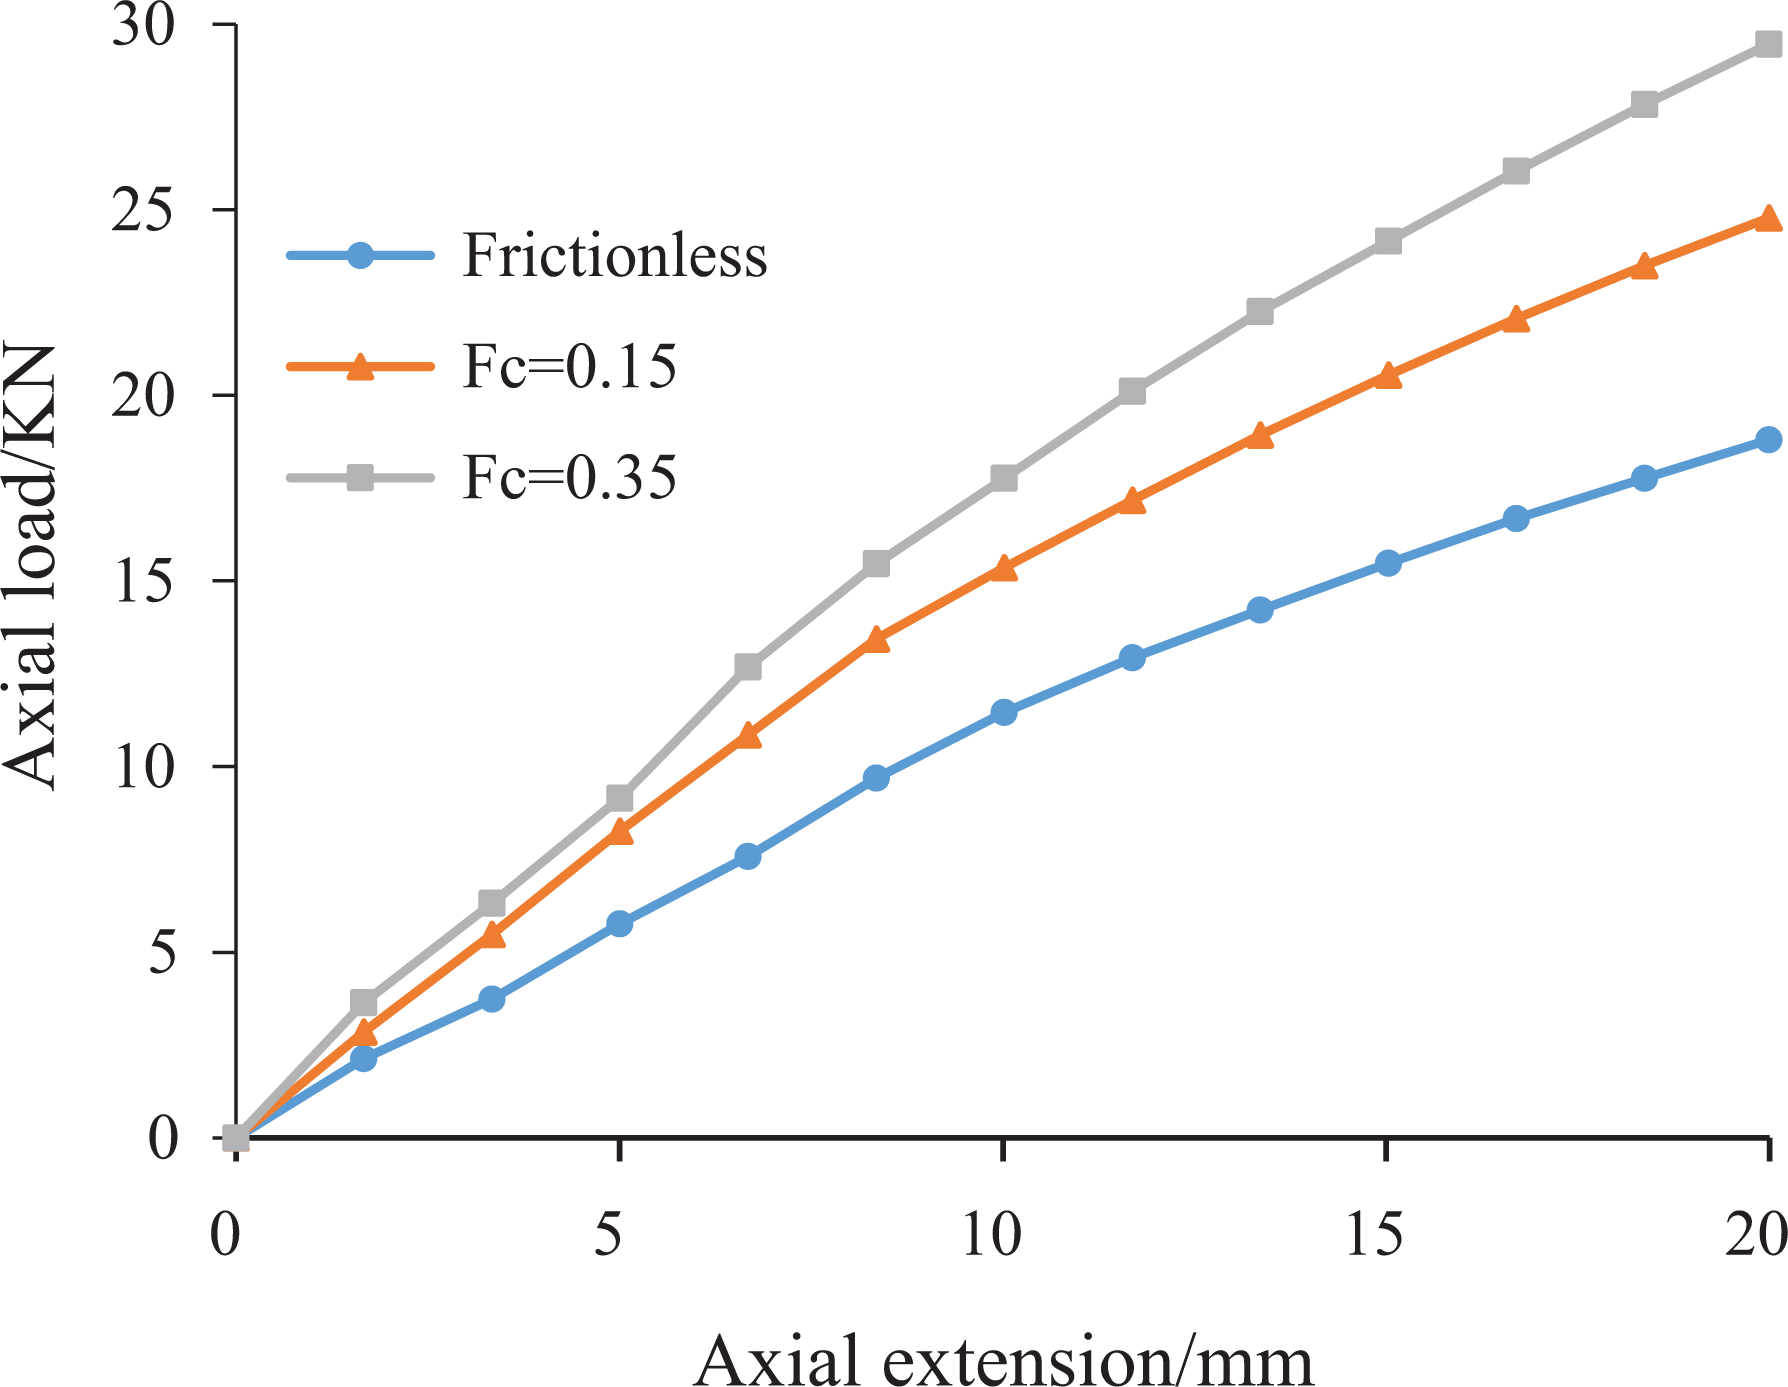
Relation of axial extension–axial load for pipe with different frictional coefficients.
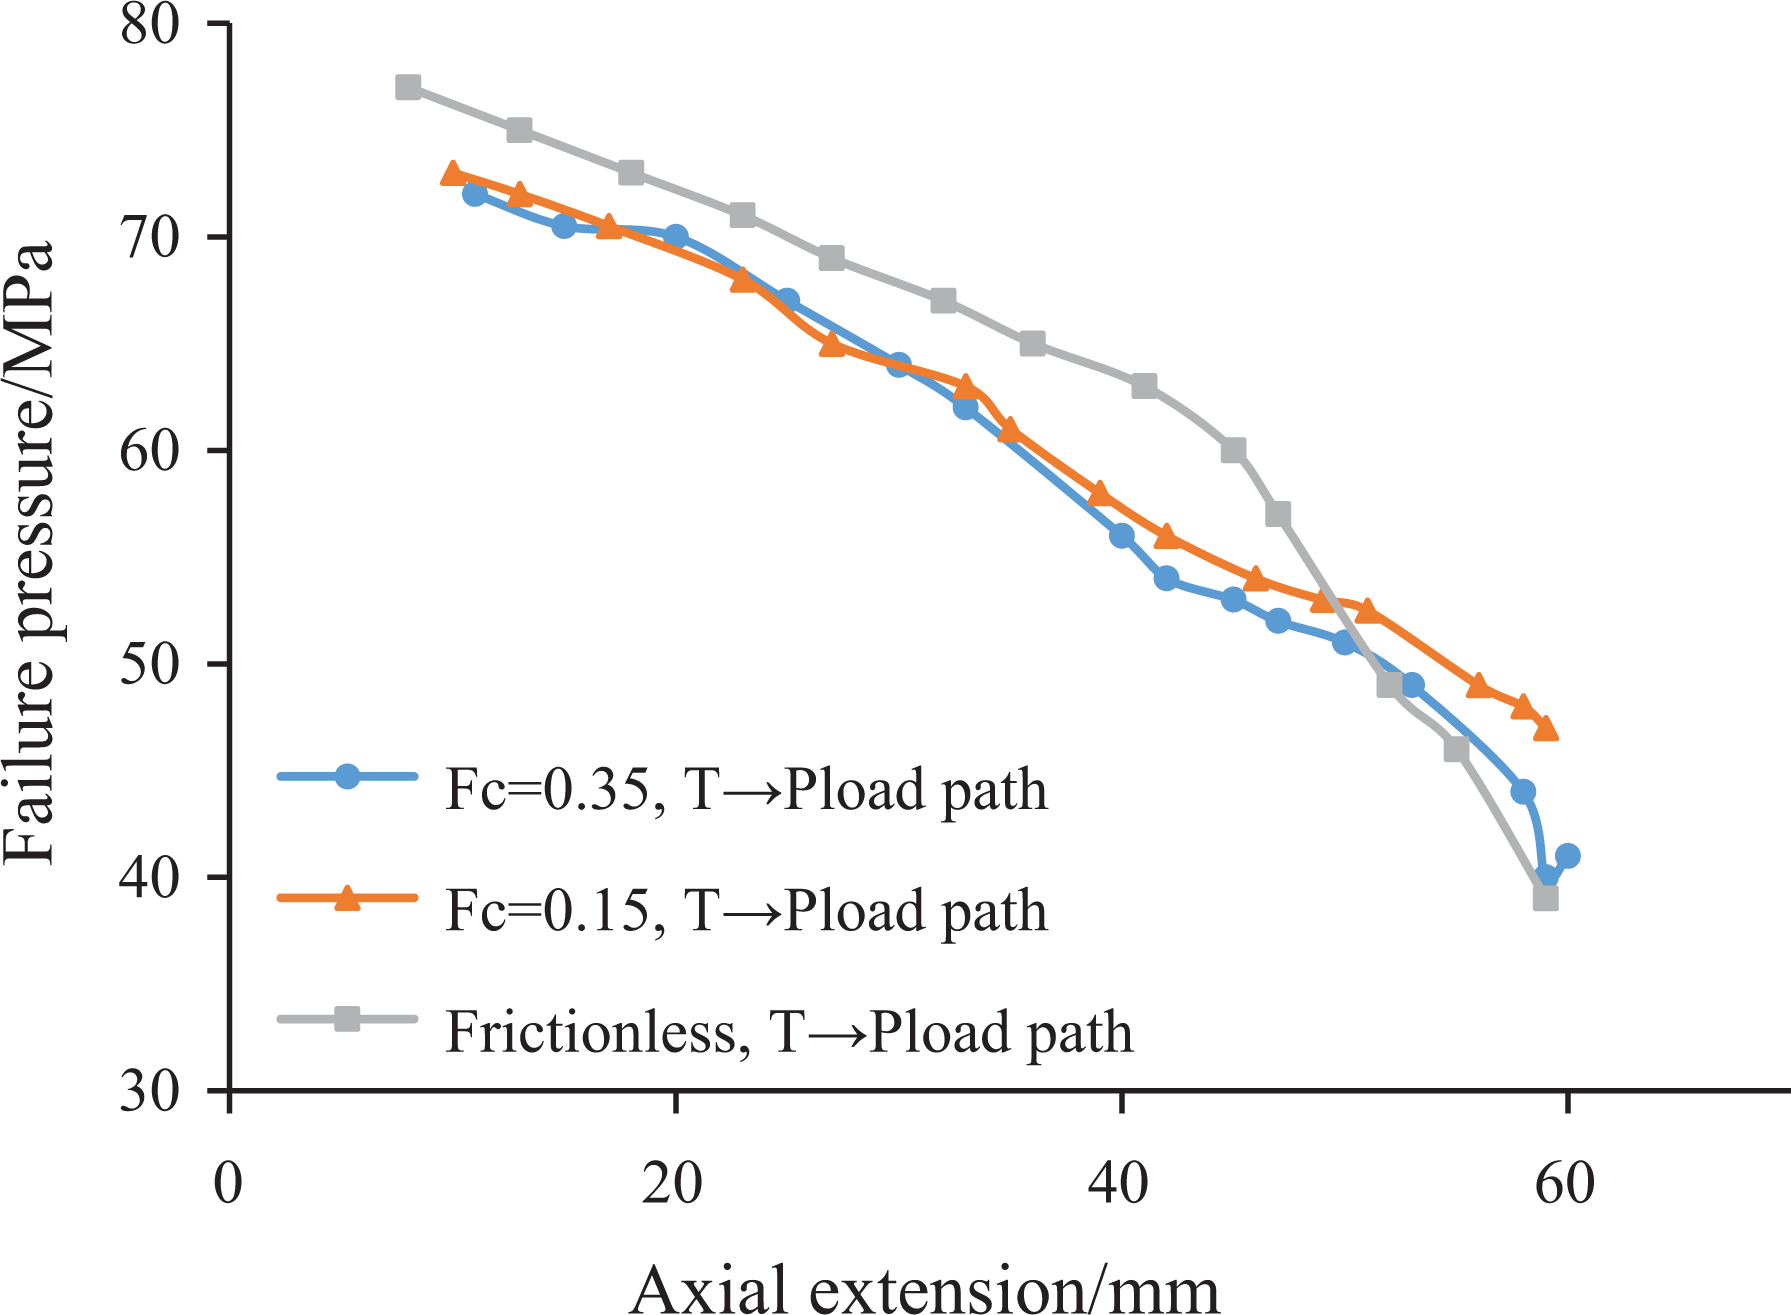
Failure pressure–axial extension envelopes for pipe with different steel–steel frictional coefficients in T→P load path.
Effect of load path
The failure behaviors of pipe under internal pressure → axial extension load path (P→T) are also investigated. In this section, the pipe model is first pressurized to 20 MPa and then tensioned to fail. Figure 31 shows the Mises stress variation of the first steel layer via internal pressure → axial extension. One can easily notice that the rising speed of Mises stress at axial extension step varies, the Mises stress increases linearly to 547.6 MPa after internal pressure and climbed to 629.5 MPa at a relatively slow speed in the beginning of axial extension step, and the corresponding tension displacement is 6.5 mm. After that it ascents fast to the peak point value and then drops down. This phenomenon might be the result of strip slack that a certain strain is needed to pull taut the steel strip in the beginning of axial extension step, and after the slack of strip is consumed, the steel layers start to take up load.
Mises stress variation in P→T load path.
Effect of preloaded internal pressure on the pipe tensile capacity is also studied by FE method. Figure 32 shows the relation between axial load and axial extension of pipe samples after pressure load. The samples are first loaded with different internal pressures (10, 13, 15, and 20 MPa) and then tensioned to fail. As shown in the figure, it seems that the preloaded internal pressure has little effect on the pipe tensile capacity that they almost fail as axial load reaches around 55 kN. However, pipe loaded with larger pressure will reach its ultimate tensile strength faster, for pipe pressurized with 20 MPa, the axial extension is 32.5 mm as the axial load reaches 56.5KN, and this value is 40.8, 45.9, 59.5 mm for pressure value of 15, 13, and 10 MPa, respectively. This phenomenon might be attributed to the fact that the applied internal pressure has restricted pipe radial shrinkage due to Poisson effect under axial tension load and limited the change of winding angle and winding pitch of steel layers. From this aspect, a certain value of preloaded internal pressure could enhance pipe axial rigidity.
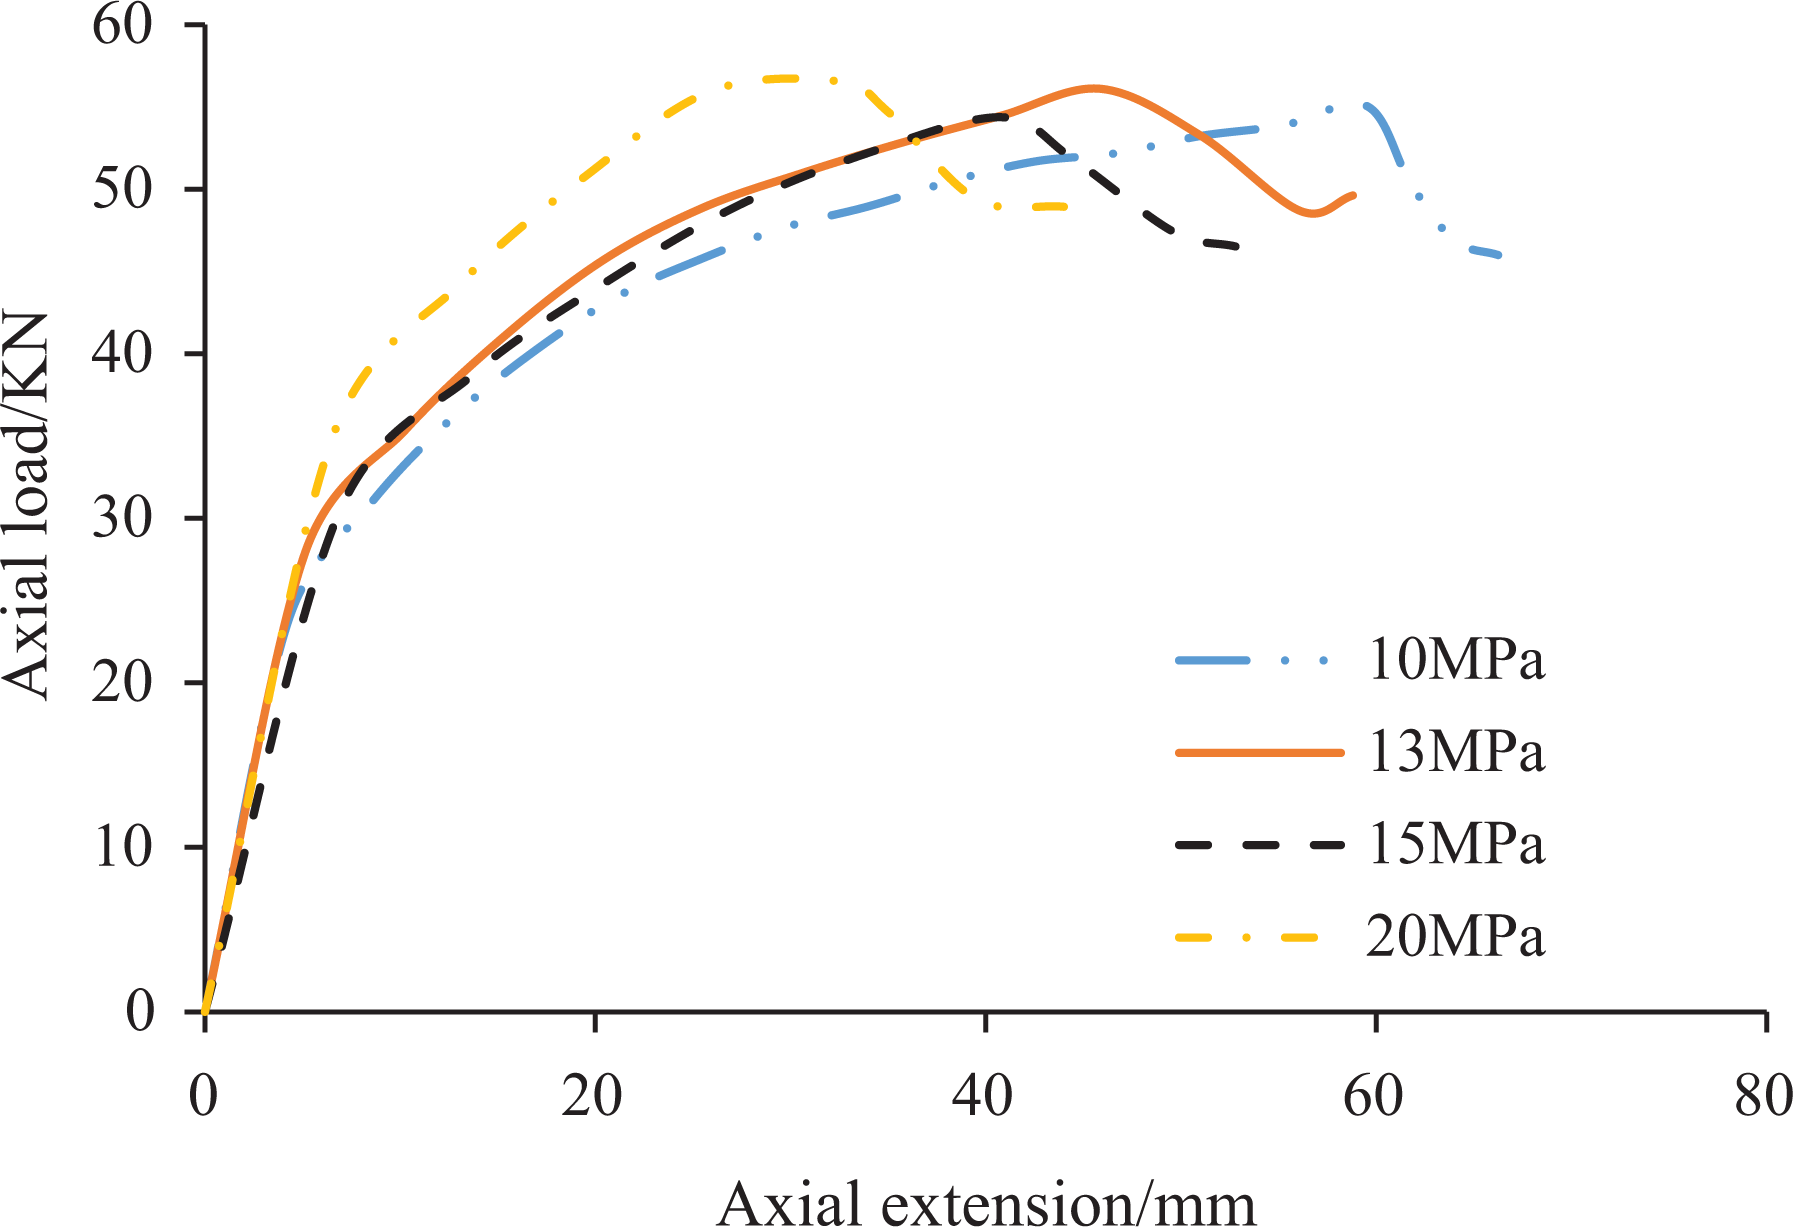
Axial load–axial extension relation after different preloaded internal pressure.
Conclusions and future works
This article discussed the mechanical behavior of steel strip–reinforced flexible pipe under combined internal pressure and axial extension. A full-scale axial extension → internal pressure experiment was conducted, and its failure characteristics were obtained. A theoretical model to capture the relation between axial extension of pipe body and stress state of steel strip was proposed. Data from FE model were compared with the experimental and the theoretical results, and good agreement between them were observed. Useful conclusions can be drawn as follows: Mises stress of the innermost steel layer is set as criteria to predict the burst strength of the pipe: as the Mises stress of this layer reaches its ultimate strength, the pipe is deemed to fail, and the corresponding applied internal pressure is regarded as its burst pressure. The preloaded axial extension has negative effect on the pipe antiburst capacity. The axial extension would decrease the steel strip winding angle and diminish its hoop rigidity, which would make the pipe more prone to deform under internal pressure. When under axial extension → internal pressure load path (T→P), the Mises stress increase faster in the internal pressure step than that in the axial extension step. This phenomenon is attributed to “strip-slack effect” that there exists a certain margin lengths of steel strip relative to the pipe geometry. As the margin lengths are consumed gradually under tension load, the steel strips begin to undertake burden from internal pressure. The Mises stress variation trend in gap area and steel layer covered area in inner HDPE layer are different, and this is caused by the interaction between the steel layer and the inner HDPE layer. Sensitivity study shows that D/t ratios can affect the pipe burst strength, pipes with smaller D/t ratios correspond to greater antiburst capacity. Steel–steel frictional coefficient can also affect the pipe failure behavior, and pipes with larger steel–steel frictional coefficients have stronger tensile capacity but are relatively more sensitive to internal pressure. When under internal pressure → axial extension load path (P→T), the preloaded pressures have little effect on the pipe tensile capacity, as the four studied cases all fracture as the tension load reaches about 55 kN. However, a certain value of internal pressure could enhance the pipe’s axial rigidity.
Future work may contain analysis under simultaneous application of tension load and internal pressure, but this requires ingenious set of axial–extension speed and pressure loading rate. A possible proposal is to set different axial extension speed T′ (in unit of mm/s) and internal pressure load rate P′ (in unit of MPa/s), and failure behavior of the steel strip PSP under different T′/P′ values can be obtained for further investigation.
Footnotes
Acknowledgements
The authors wish to express their gratitude to Ningbo OPR Inc. for providing pipe samples to make this research possible and also thank the engineers at Zhejiang University for helping in conducting the test.
Funding
The author(s) received no financial support for the research, authorship, and/or publication of this article.