
Abstract
The effect of surface treatment of polyoxymethylene (POM) using low-pressure plasma (LPP) on its adhesive bonding was investigated. Three different types of adhesives were used. Examinations of single lap shear, scanning electron microscopy, contact angle measurements, and energy dispersive X-ray analysis were carried out. The results showed that the adhesion strength was apparently enhanced when treating surfaces by LPP using argon or oxygen plasma which increased with the treatment time. This increase was also dependent on the adhesive type. Moreover, glass fiber–reinforced POM showed better adhesion strength compared to that of unreinforced POM. An increase in the surface free energy exceeding 50 mN/m was observed after 600-s treatment time compared to untreated samples (39 mN/m), where the increase in polar component was more predominant. Surface topography observations showed a significant increase in the surface roughness with increasing the treatment time, mainly when using oxygen plasma. Finally, an increase in polarity and wettability due to changes in the chemical composition of the surface was also reported.
Introduction
The use of modern plastics is common in automotive industry, shipbuilding, as well as in railway and aircraft construction. Their use in hybrid construction by joining plastics together or joining them with other classes of materials also attracts the attention of industry. Adhesive joining is a convenient method to join plastics with metals. Polyoxymethylene (POM) is a thermoplastic polymer with outstanding properties, which makes it a suitable candidate for such applications. POM is characterized by its high toughness, high hardness, high rigidity, high abrasion resistance, low coefficient of friction, very good heat deflection resistance, good electrical and dielectric properties, good chemical and environmental resistance, low water absorption, high dimensional stability, high resilience, good slip properties, and straightforward process ability. 1 Despite these advantages, it is found to be difficult to adhesively bond POM with other materials. To achieve a good adhesion, a suitable treatment of the surface of POM is necessary. Mechanical and chemical treatments had been usually carried out to activate the surfaces of different types of polymers to improve their adhesion strength with other materials. These methods are environmentally harmful, so recently, the attention of researchers as well as the industry sectors has dedicated to environment-friendly physical procedures such as low-pressure plasma (LPP) 2 –8 atmospheric pressure plasma (APP), 7 –13 gas-phase fluorination, 3,14 ultraviolet/ozone treatment, 15,16 flame impingement and Pyrosil® technology, 17 –19 and corona treatment. 20 –23 This work had focused on the LPP technique.
These aforementioned techniques have shown different adhesion mechanisms, which were also dependent on the type of plastics. 1 –42 Acheriner et al. 2,14 have reported that the oxyfluorination of some plastics such as polyethylene (PE), POM, polybutylene terephthalate (PBT), and polyamide 6 (PA6) resulted in an increase in their surface free energy where the polar component increased while the dispersive component decreased. Similar findings were highlighted by Acheriner 14 when performing LPP treatment. In oxyfluorination, the increase in fluorine content shown by ESCA measurements leaded to the increase in polar component, while the decrease in dispersive component was due to the decrease in hydrocarbons. Anagreh and Dorn 24 have noted an increase in the bonding strength and peel resistance of PBT treated with O2- and A-LPP and attributed to the increased wettability and polarity, but there was no significant increase in the surface roughness. Sanchis et al. 6 have investigated the wettability of low-density polyethylene (LDPE) films treated by O2-LPP and reported an enhancement in the wetability due to the formation of some polar species. They also observed that no further significant increase in wettability occurred after longtime treatments even there was a little increase in the surface roughness. Exposure of PE treated with Ar-LPP 25 to longer treatment time leaded to maximum mass loss ratio and a formation of a new surface structure. Other researchers 12,26 who have treated LDPE with APP technique have not observed a material degradation, but the modification in the chemistry of the surface and its nanoroughness increased its wettability and adhesive properties. Encinas et al. 27 showed that APP treatment of polyolefins such as high-density polyethylene (HDPE), LDPE, and polypropylene (PP) introduced new polar moieties (carbonyl, amine, or hydroxyl) into the surface which enhanced polarity. Scanning electron microscopy (SEM) photograph investigations revealed that a smoother, lamellar, and semispheric micrometric structures were created on the surface of these polyolefins. Polyethylene terephthalate (PET) was also treated with LPP 28 and new polar groups such as aldehyde, ester, and carboxyl were created through hydrophilization of the surface. Bernaredelli et al. 29 showed that the scission of the polymer chain and the formation of free radicals, which reacted with reactive O2-containing species present in plasma, were due to creation of oxidized species at the chain ends such as carbonyl or carboxyl groups. Also, other researchers 3,30 –32 reported that the increase in surface roughness, the formation of new polar –COOH groups, and other O2-functional group leaded to the oxidation of PET surface and hence increase its hydrophilicity. The X-ray photoelectron spectroscopy (XPS) measurements of oxy-fluorinated samples confirmed the occurrence of additional integration of fluorine and oxygen groups in the polymer chain, whereas using plasma, the integration of oxygen groups only occurred. In both cases, that had resulted in an increase of the polarity.
Polymer blends such as LDPE/ethylene vinyl acetate (LDPE/EVA) blends were also treated with LPP, 8 and a pronounced decrease in the contact angle was reported and attributed to the generation of different carbon-O2-moieties and to the formation of cracks/heterogeneities on the foams surfaces. O2-plasma treatment caused a removal of nonpolar material from EVA surfaces, which leaded to expose the acetate groups and hence an increase in the adhesion of the foams. The adhesion properties of fiber-reinforced polymers such as glass fiber– and carbon fiber–reinforced polyphenylene sulfide (GFR-PPS and CFR-PPS) surfaces treated with APP and LPP were also investigated by Anagreh et al., 33 Iqbal et al., 11 and Bhatnagar et al. 7 An increase in the surface roughness and the total surface free energy improved the adhesion strength. Encinas et al. 4 showed that the driving force for adhesion between the adhesive and the glass fiber–reinforced epoxy resin (GFREP) and GFRPL surfaces treated with APP was attributed to the chemical interaction between them more than due to mechanical interlocking, which led to the formation of hydrogen or covalent bonding with PU adhesive. Awaja et al. 34 reported that the roughening effect permitted the formation of radical sites as well as the increase in the number of bonding sites. 13 An intensive APP treatment of the samples, however, yielded a reduction in the roughness and that was attributed initially to etching and roughening of the surface, followed by melting of the surfaces in microscale level. 35 According to other researchers, 9 the improvement of adhesion strength was correlated only to changes in specific surface chemistry and increasing the chemical bonding and not to the wetting angle or the morphological properties of the surfaces. The samples were completely fractured cohesively within the adhesive layer. The improved adhesion of rubbers treated with O2-LPP was due to the generation of polar moieties on the surface, the removal of the low-molecular-weight compounds, and crosslinking. 5
The objective of this study was to activate the surface of POM with and without reinforcement using LPP treatment in an attempt to improve its adhesion properties with different types of adhesives. The effect of LPP treatment time and process gas was also investigated. The untreated and treated samples were tested and characterized by SEM, EDX, contact angle measurements, and tensile shear testing.
Materials and experimental
Materials
For single overlap tensile shear test specimens, aluminum substrates (1 mm thick) were used and the plates were of type EA AW AlMg4.5Mn0.4 based on Europe Standard EN-485-2. The plastic joining part was POM with a trade name of Hostaform C9021 (unreinforced) and C9021 GV1/3 (reinforced) supplied by Celanese Corporation. The Hostaform C9021GV1/3 was reinforced with 26 wt% glass fiber. The material was delivered as granulates with a bulk density of approximately 1.41 and 1.6 g/cm3 for the unreinforced and reinforced POM, respectively. POM is a copolymer that has a linear structure with a high crystallinity (70–80%) and a melting point of 162–173°C. These granulates were injection molded into strips of dimensions of 84 × 25 × 4 mm3 at a processing temperature of 165°C, and no any anti-adhesive agents were used. Table 1 shows the mechanical and thermal characteristics of the POM plastic. 1 The adhesives were chosen by considering the requirements of the automobile industry including thermophysical characteristics (e.g. resistance to aging and temperature) and mechanical properties (e.g. ductility and strength). Therefore, two cold-hardening two-component EP adhesives Araldite 2011 (EP 1) and Permabond E 32 (EP 2) as well as cold-hardening two-component PU adhesive Tivopur 1667 (PU) were selected. The characteristics of different adhesive types are shown in Table 2. An adhesive EP 1 contains bisphenol A-epoxy resin with a molecular weight smaller than 700, N-(3 dimethylaminopropyl) 1,3-propylenediamin. No information about the chemical composition of adhesive EP 2 was reported by the supplier. PU adhesive contains component A, which consists of polyoles, fillers, and 10–25% polyether-modified bisphenol, and component B that contains an isocyanate hardener, diphenylmethane, -4,4′-diisocyanate (<75%), and a hexamethylene-1,6-diisocyanate (0.1–1%). According to the manufacturer’s datasheet, the adhesives are suited for adhesion of different materials such as plastics, metals, and ceramics.
Characteristics of POM according to the manufacturer. 1
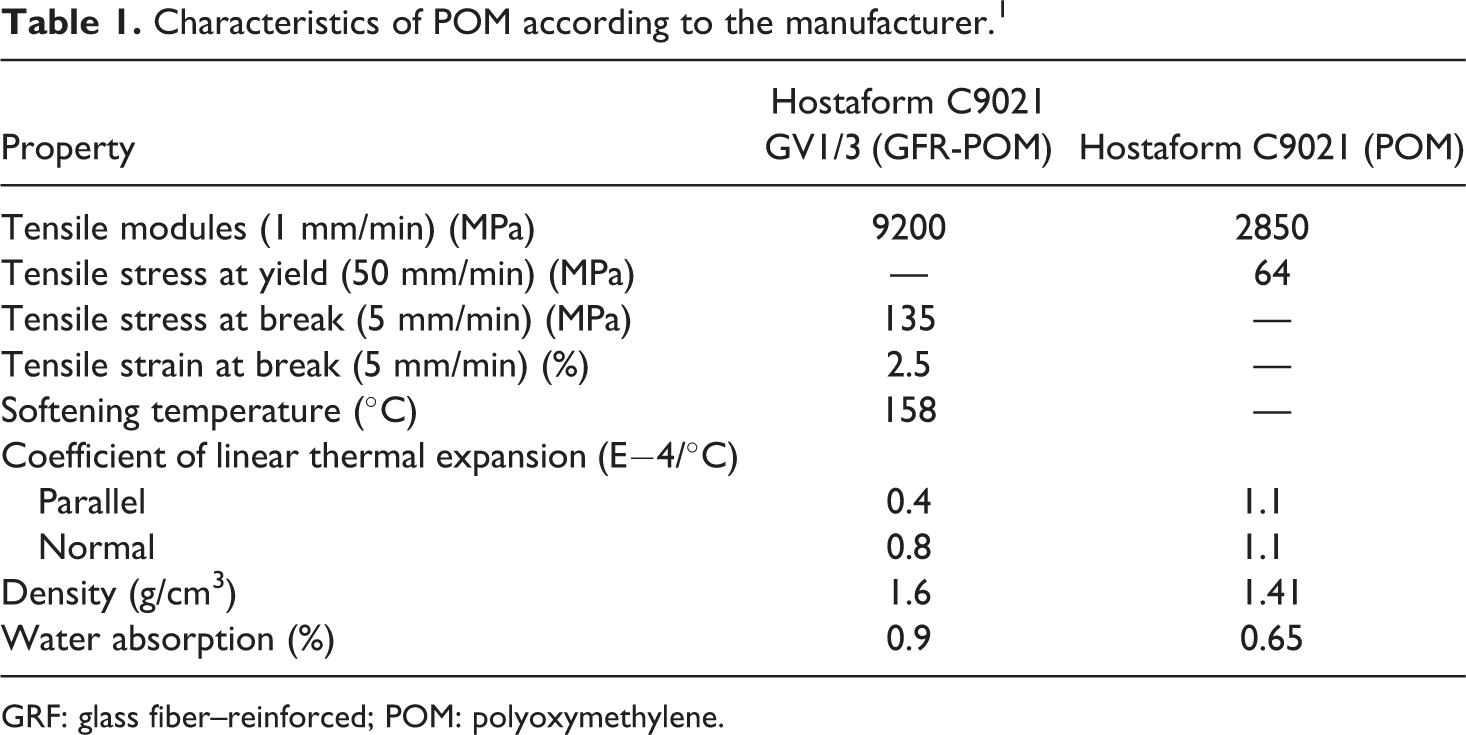
GRF: glass fiber–reinforced; POM: polyoxymethylene.
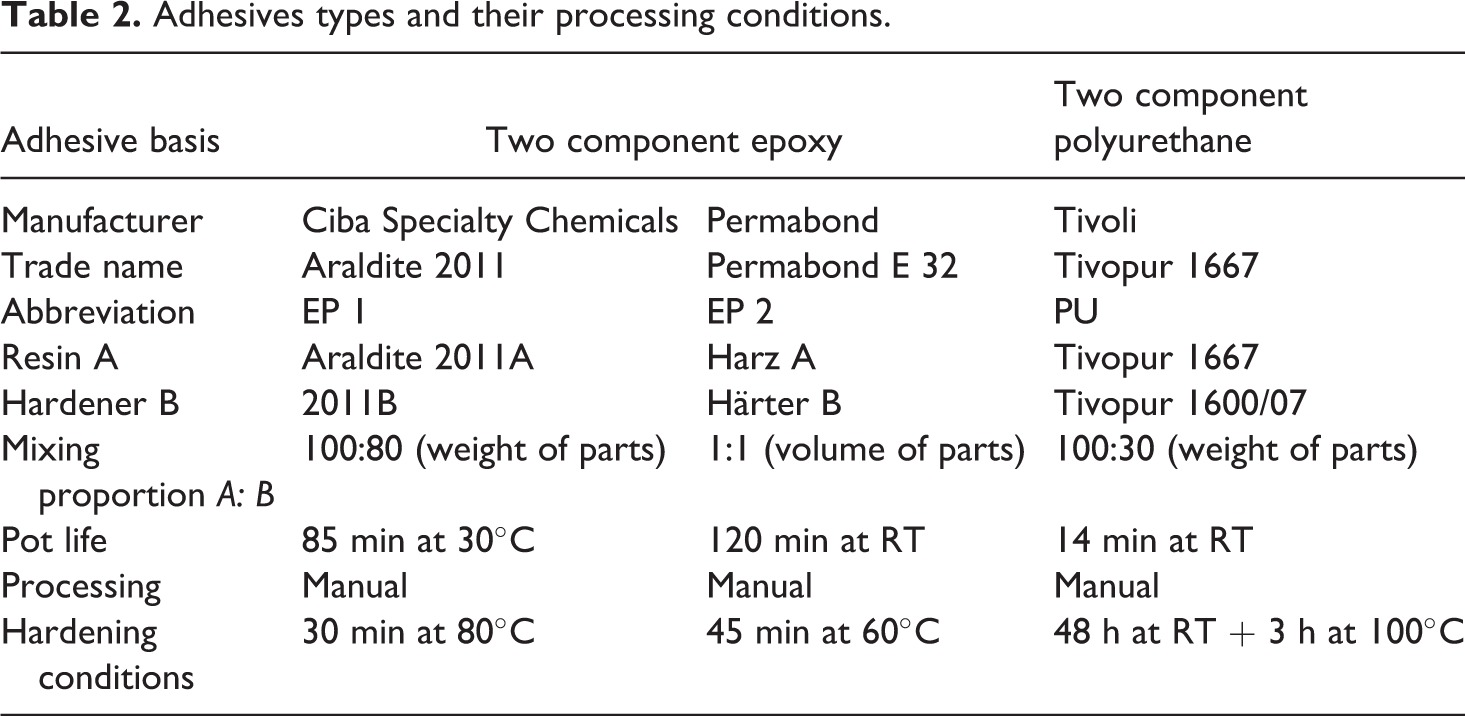
Adhesives types and their processing conditions.
Surface pretreatment of samples
The “as received” rolled aluminum sheets were covered with a layer of oil and contaminations, which deteriorates adhesion. Therefore, the surfaces of the aluminum plates were cleaned with ethanol at ambient temperature under ultrasonic activation for 5 min and then dried with oil-free compressed air. The surfaces were then blasted with corundum (grain size of 0.2–0.5 mm) at an operating pressure of 0.6 MPa. The blast residues were again removed by ethanol. The POM surfaces were degreased with isopropanol to eliminate possible anti-adhesive layers. For the activation of POM surfaces to increase its surface free energy, a surface pretreatment using LPP of type E 200 (13.6 MHz) was supplied by Technics Plasma Company, Germany. O2 and Ar were used as process gases with LPP. The operating pressure was set to 1 hPa and different treatment times (6, 60, 150, 300, 600, and 1800 s) were selected with a plasma power of 200 W for O2 and 100 W for Ar. The components of each type of adhesives were manually mixed, and the EP adhesive mixture was degassed in a vacuum for few minutes to avoid bubbles. Copper wires with a diameter of 0.08 mm were inserted into the adhesion gap to maintain a uniform thickness of 0.08 mm for adhesives of EP 1, EP 2, and PU. To achieve nonporous layers of adhesive, the strips of aluminum and POM which were joined had been loaded in a device with weights up to 0.3 kg. Finally, the adhesive was warm-hardened in an air furnace to improve the bonding strength (Table 2).
Characterization of samples
The strength of the adhesive joints was investigated by a tensile shear test according to DIN EN 1465. The samples were tested with a speed of 5 mm/min at ambient temperature and the average, maximum, and minimum adhesive strength values of five specimens were reported To evaluate the results of the test, a material utilization factor was determined, which is defined for POM parts as the ratio of ultimate tension of the plastic part in the bonding joint to the yield stress of the unjoined plastic part. For GFR-POM, the material utilization factor is defined as the ratio of ultimate tension of the plastic part in the bonding joint to the tensile stress at break of the unjoined plastic part. The topographic structures of different pretreated POM surfaces and their fracture surfaces were examined by a Hitachi HD-2700 SEM microscope (TOKYO: 8036, Hitachi High-Tech)with electron beam energy of 15 kV. The measurements of the chemical composition of POM surfaces before and after the pretreatment and the fracture surfaces were performed using energy dispersive X-ray (EDX), analysis. The dispersive and polar components of the surface free energy were determined by means of video-supported contact angular measurements of the drop contour using DSA10DO4 system (KRUESS GmbH, Hamburg, Germany) and three liquids of different polarity (water, 1.5-pentandiol, and diiodomethane) at ambient temperature as shown in Table 3. The surface free energy and their allocation into polar and dispersive parts were computed according to Ström et al. 36 . The surface roughness in this study was being judged only from the microstructural observations.
Test liquids and the measuring parameters.
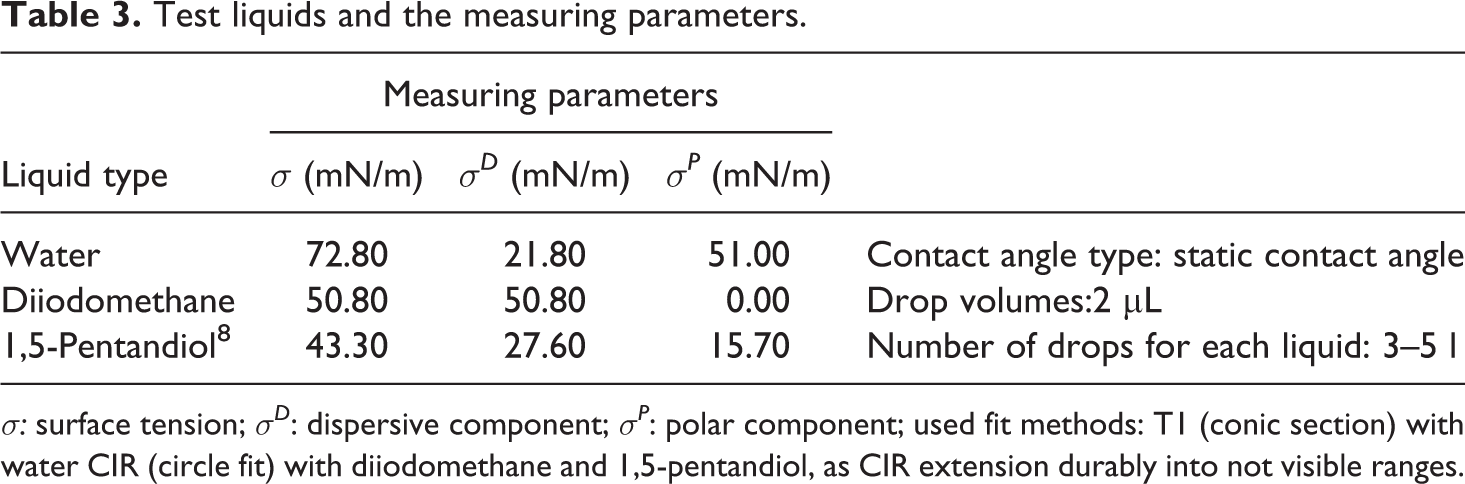
σ: surface tension; σD : dispersive component; σP : polar component; used fit methods: T1 (conic section) with water CIR (circle fit) with diiodomethane and 1,5-pentandiol, as CIR extension durably into not visible ranges.
Results and discussion
SEM observations of treated surfaces
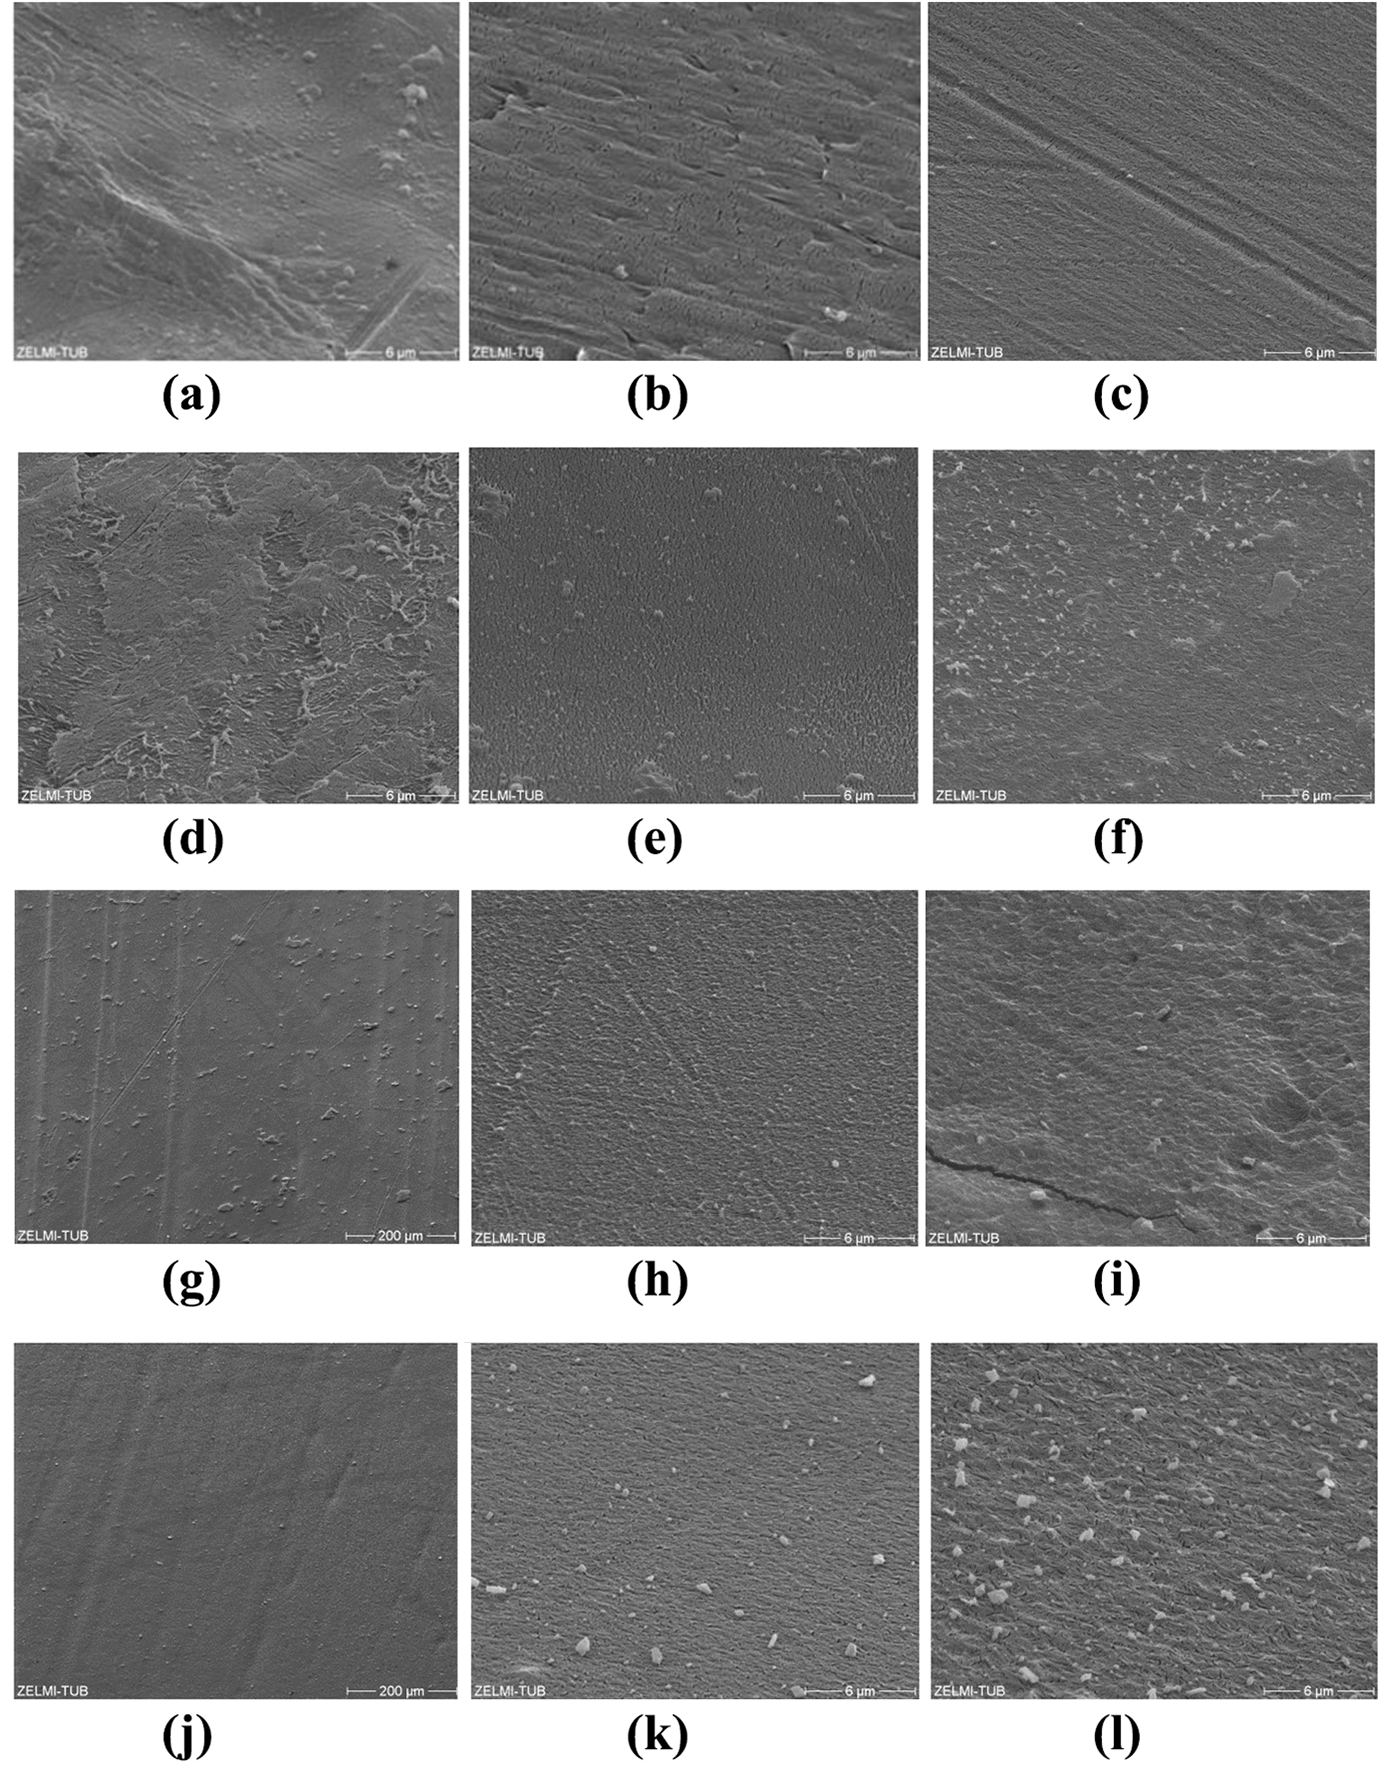
Figure 1 shows the influence of O2- and Ar-plasma treatment at different treatment times and plasma power on the surface topography of GFR-POM. The SEM images of the topographic structures of GFR-POM surfaces in their as received and degreased states show a substantially smooth surface (Figure 1(a) to (c)). A rough surface appears for untreated sample at lower magnification (Figure 1(b)), which is attributed to the illustration of the die structure on the sample upon injection molding. A residual of contamination is observed on the surface of the degreased sample as shown in Figure 1(c). The treatment of degreased samples with O2- and Ar-plasma shows different effects on the surface roughness of the samples based on the treatment time. The initial increase in the surface roughness of Ar-treated samples is observed only after 150 s (Figure 1(d)), whereas treating samples with O2-plasma shows a rough surface at a shorter time of 60 s (Figure 1(h)). In both cases, the surface roughness continuously increases with increasing the treatment time (Figure 1(e) and (f) for Ar-plasma and Figure (i) to (k) for O2-plasma), which is more pronounced for O2-plasma treated samples. In previous studies, 2,14,24 the researchers reported no significant increase in the surface roughness for PE, POM, PBT, and PA6 after LPP surface treatment. Moreover, an ablation of the outermost surface layers of the POM occurs in O2-treated samples after 1800 s, and this is evidenced by the appearance of the glass fibers that are embedded in the POM matrix, Figure 1(l), and this is due to the stronger oxidation effect of O2-plasma in comparison to that of Ar-plasma.
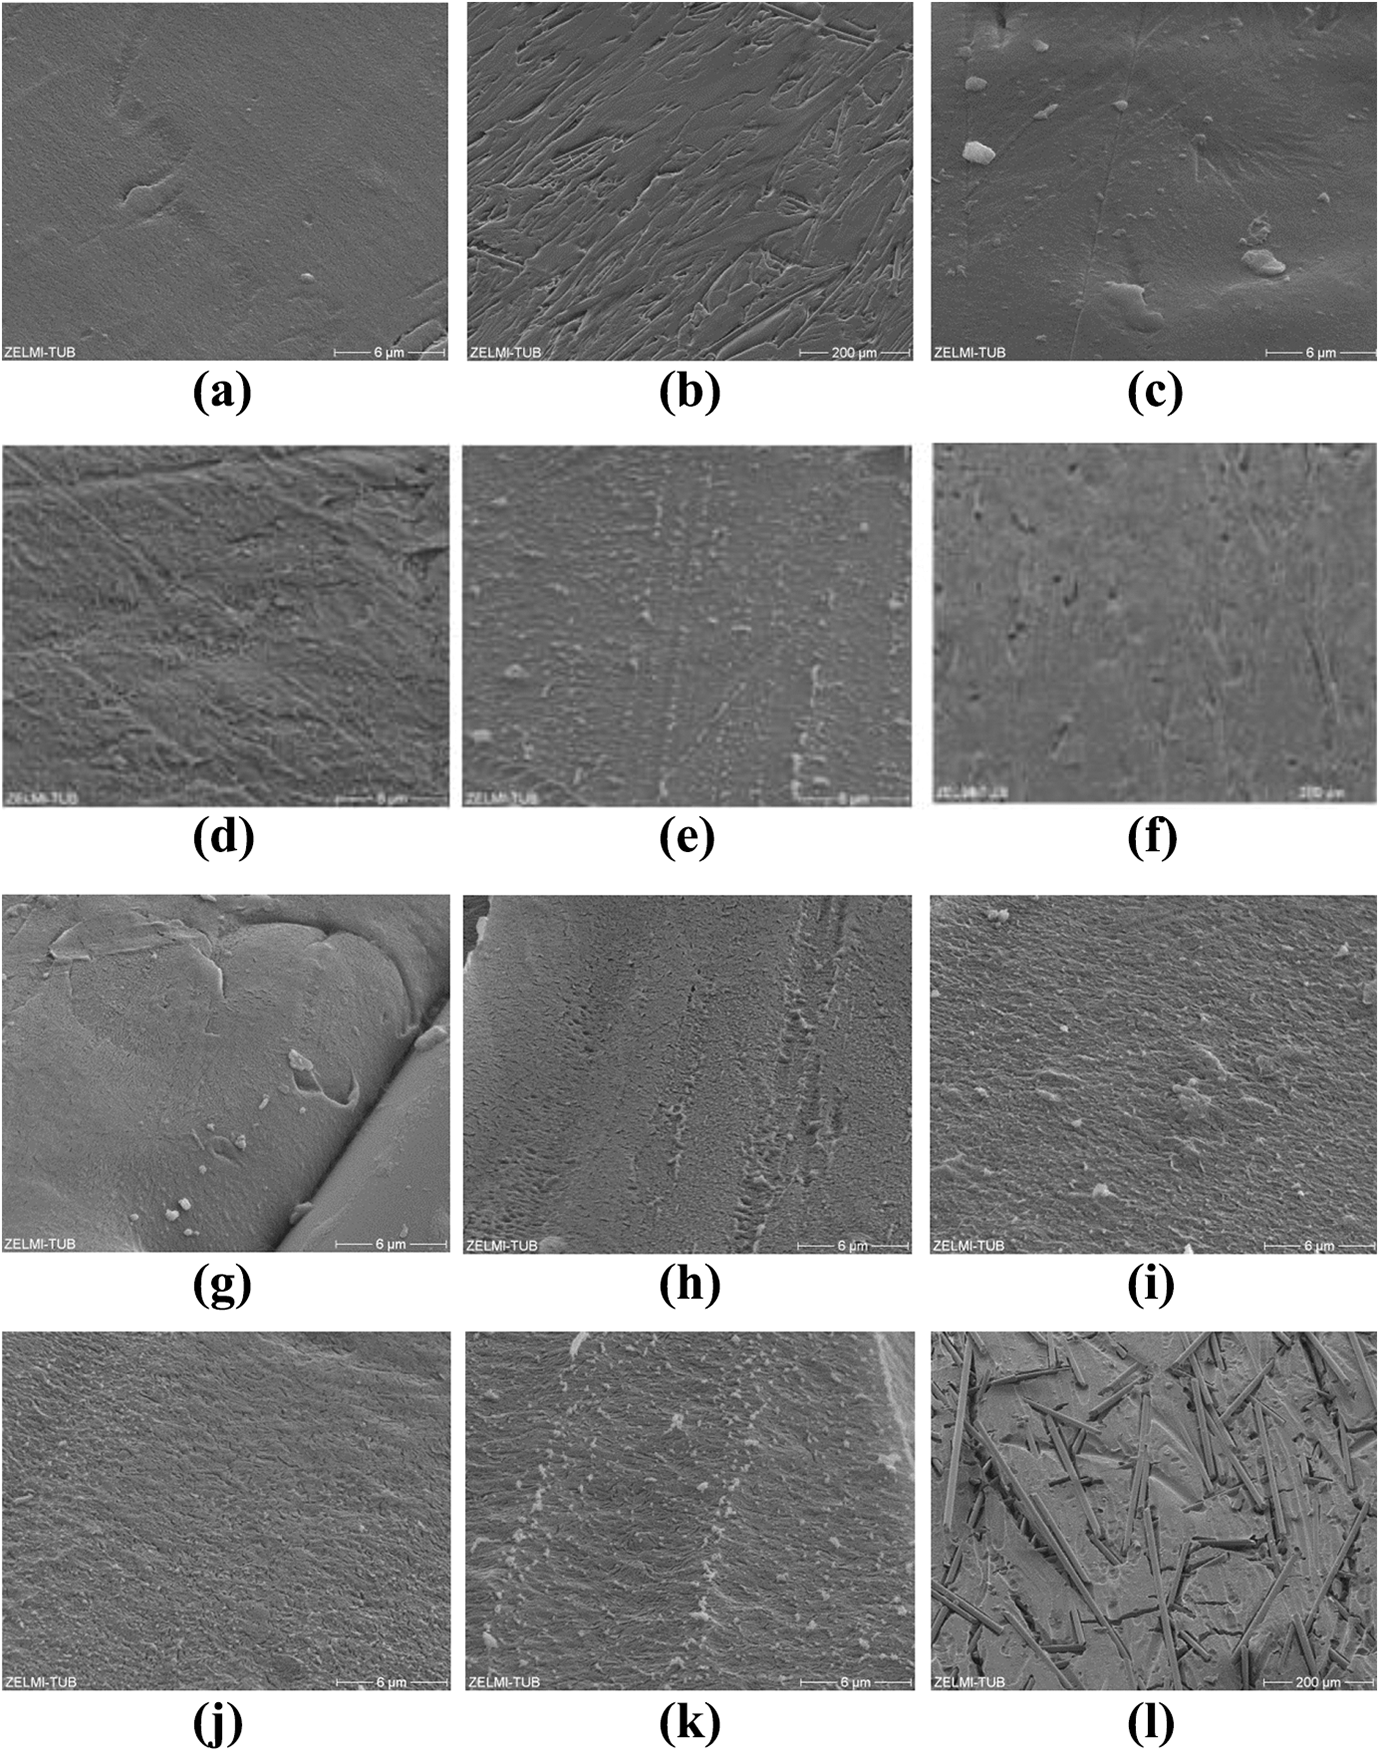
SEM topographic structure of GFR-POM treated with Ar (plasma power 100 W) or O2-low-pressure (plasma power 200 W) at different treatment times: (a) untreated GFR-POM; (b) untreated GFR-POM; (c) isopropanol degreased GFR-POM; (d) GFR-POM (150s Ar-plasma); (e) GFR-POM (600s Ar-plasma); (f) GFR-POM (1800s Ar-plasma); (g) GFR-POM (6s O2-plasma); (h) GFR-POM (60s O2-plasma); (i ) GFR-POM (300s O2-plasma); ( j) GFR-POM (600s O2-plasma); (k) GFR-POM (1800s O2-plasma); (l) GFR-POM (1800s O2-plasma).
Figure 2 shows the topography of the surface structures of the unreinforced POM material that was treated with O2- or Ar-plasma. The structures of untreated and isopropanol samples are also seen rough due to the illustration of the die structure on the injection-molded samples (Figure 2(a) and (b)). The surfaces appear smoother after degreasing with isopropanol due to the removal of low-molecular-weight layers. Some residual of contamination and very small cracks are seen on the surface of degreased samples at higher magnification. Cracks were not observed in case of degreased GFR-POM samples. The surface roughness of POM increases after short treatment time with O2- and Ar-plasma, and it is more effective for O2- compared to that of Ar-treated samples. Exposure to longer treatment times results in further increase in the surface roughness regardless of treatment process gas (Figure 2(c) to (g) for Ar-plasma and Figure 1(h) to (l) for O2-plasma). Reaction products as well as irregular ablation of the outermost surface layers could also be seen on the POM surfaces treated with O2-plasma at 1800-s treatment time.
SEM topographic structure of unreinforced POM treated with Ar (plasma power 100 W) or O2-low-pressure (plasma power 200 W) at different treatment times: (a) untreated POM; (b) isopropanol degreased POM; (c) POM (60s Ar-plasma); (d) POM (300s Ar-plasma); (e) POM (600s Ar-plasma); (f) POM (1800s Ar-plasma); (g) POM (1800s Ar-plasma); (h) POM (6s O2-plasma); (i) POM (300s O2-plasma); (j) POM (600s O2-plasma); (k) POM (1800s O2-plasma); (l) POM (1800s O2-plasma).
EDX analysis and contact angle measurements
The results of the contact angle measurements represented by the polar and dispersive components of surface free energy are shown in Table 4. The results show that the reinforced and unreinforced POM in their as received states has the same surface free energy of about 39 mN/m. However, the untreated GFR-POM samples show a higher polar component in comparison to the unreinforced POM. This significant high polarity of the GFR-POM might be attributed to the existence of reinforcing agents on their surfaces as reported by EDX analysis, which shows the presence of aluminum (Al), silicon (Si), and calcium (Ca) in addition to carbon (C) and oxygen (O) elements (Table 5). On the other hand, the unreinforced POM contains only carbon and oxygen elements. Isopropanol-degreased GFR-POM surfaces show a clear reduction in total surface free energy as well as dispersive and polar components. The contents of C and O are slightly increased, whereas the contents of reinforcing agents are decreased. The reduction in their C and O contents is less pronounced in case of isopropanol-degreased POM. Plasma treatment of GFR-POM causes an increase in total surface free energy as well as dispersive and polar components, and the values generally increases with increasing treatment time comparing them to their counterparts of degreased and as received samples. The effect of plasma treatment on the values of surface free energy is similar to some extent when comparing the values of Ar-plasma samples to their counterparts of O2-plasma ones and no clear trend can be highlighted. Conversely, the total surface free energy of the unreinforced POM treated with Ar- or O2-plasma increases with the treatment time and shows similar values compared to their counterparts of GFR-POM. Furthermore, the dispersive component values of unreinforced POM are lowered, and the polar component values are enhanced compared to that of GFR-POM even that the EDX results (Table 5) show an increase in the contents of reinforcing agents (Al, Si, Ca) mainly at longer treatment time (e.g. at 1800 s for GFR-POM sample). C and O concentrations decrease for GFR-POM and no significant change in their contents is observed for unreinforced POM. Achereiner et al. 2,14 had noticed a similar behavior when measuring the contact angle of the unreinforced POM and showed that the total surface free energy increased due to increasing of the polar component without any noticeable increase in the dispersive component. In contrast, other researchers 33 found that the dispersive component of the total surface free energy of GFR-PPS decreased.
Surface tension and its polar and dispersive fractions of GFR-POM and POM surfaces as a function of plasma process gas and pretreatment time.
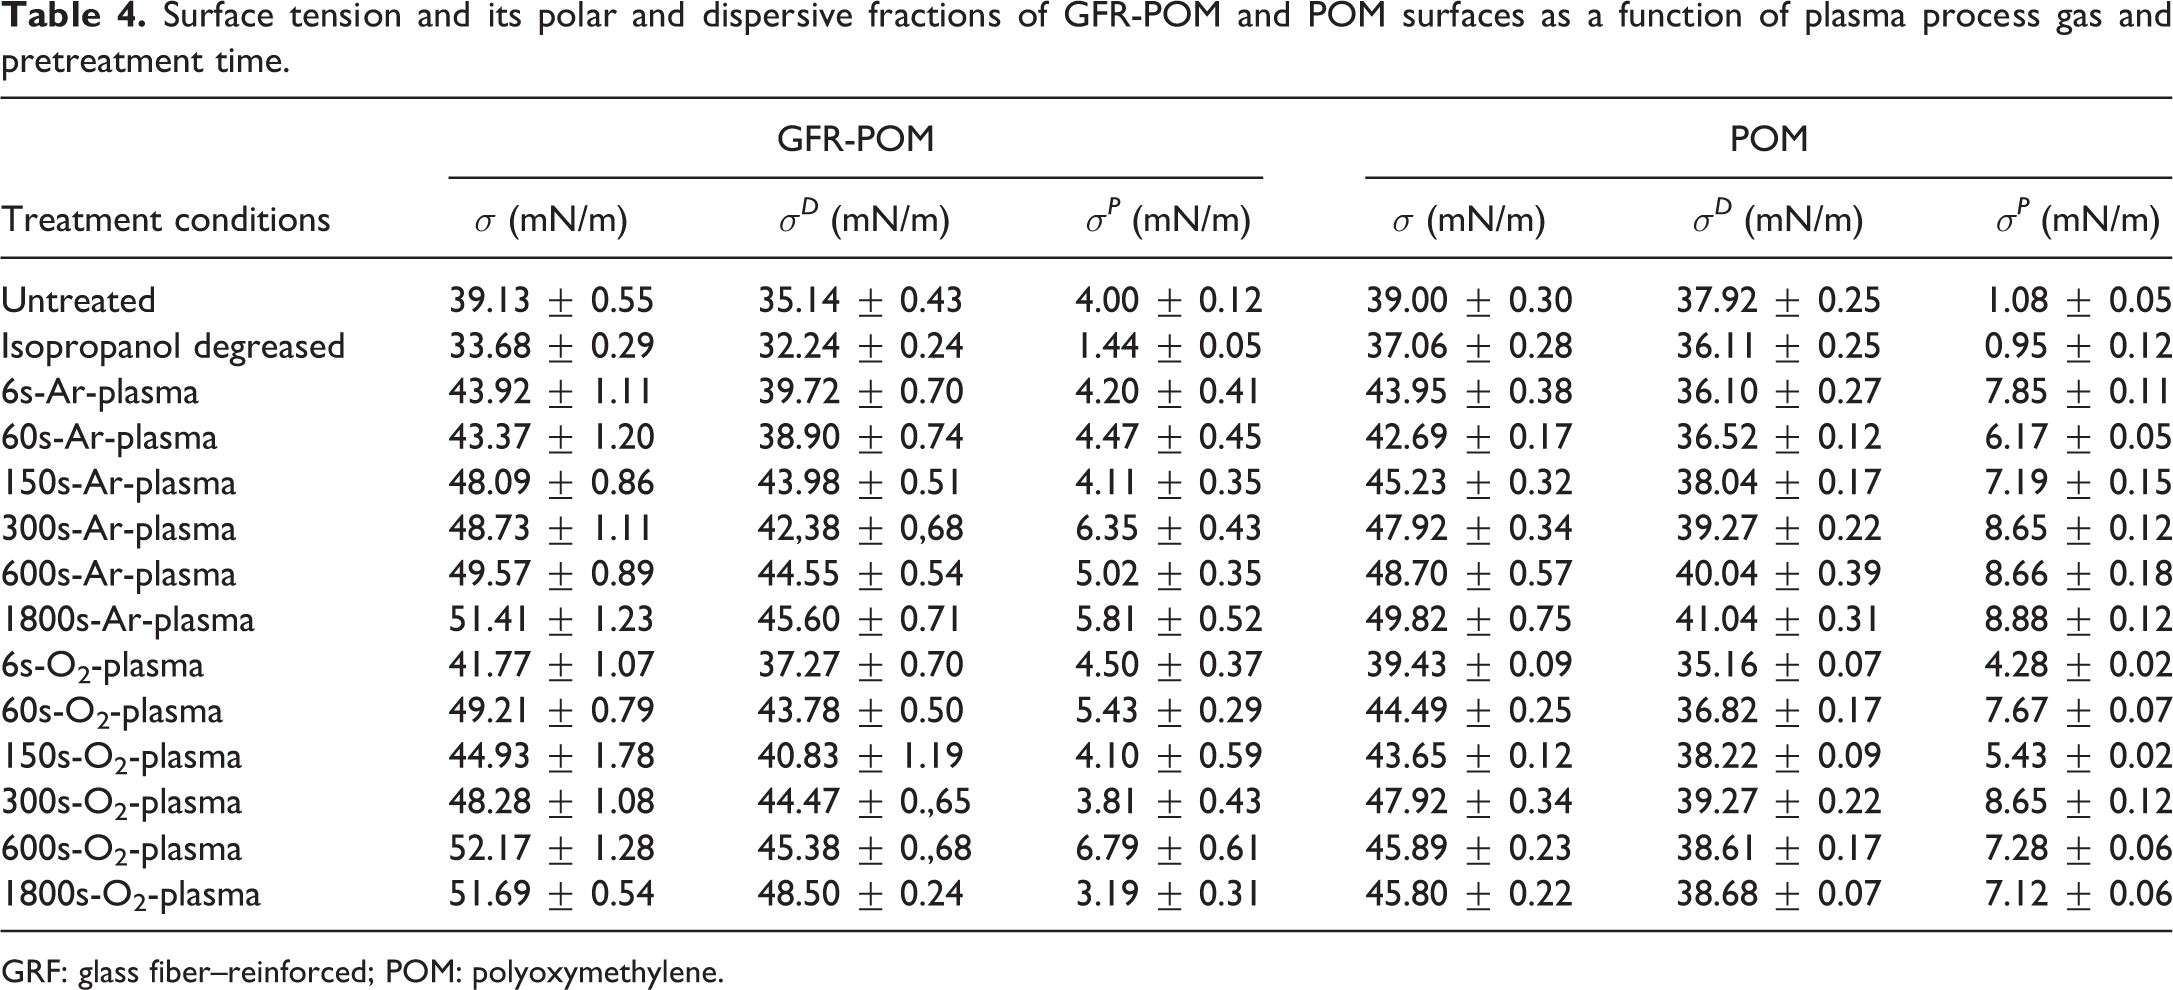
GRF: glass fiber–reinforced; POM: polyoxymethylene.
Chemical compositions of POM and GFR-POM surfaces treated with LPP using EDX analysis.
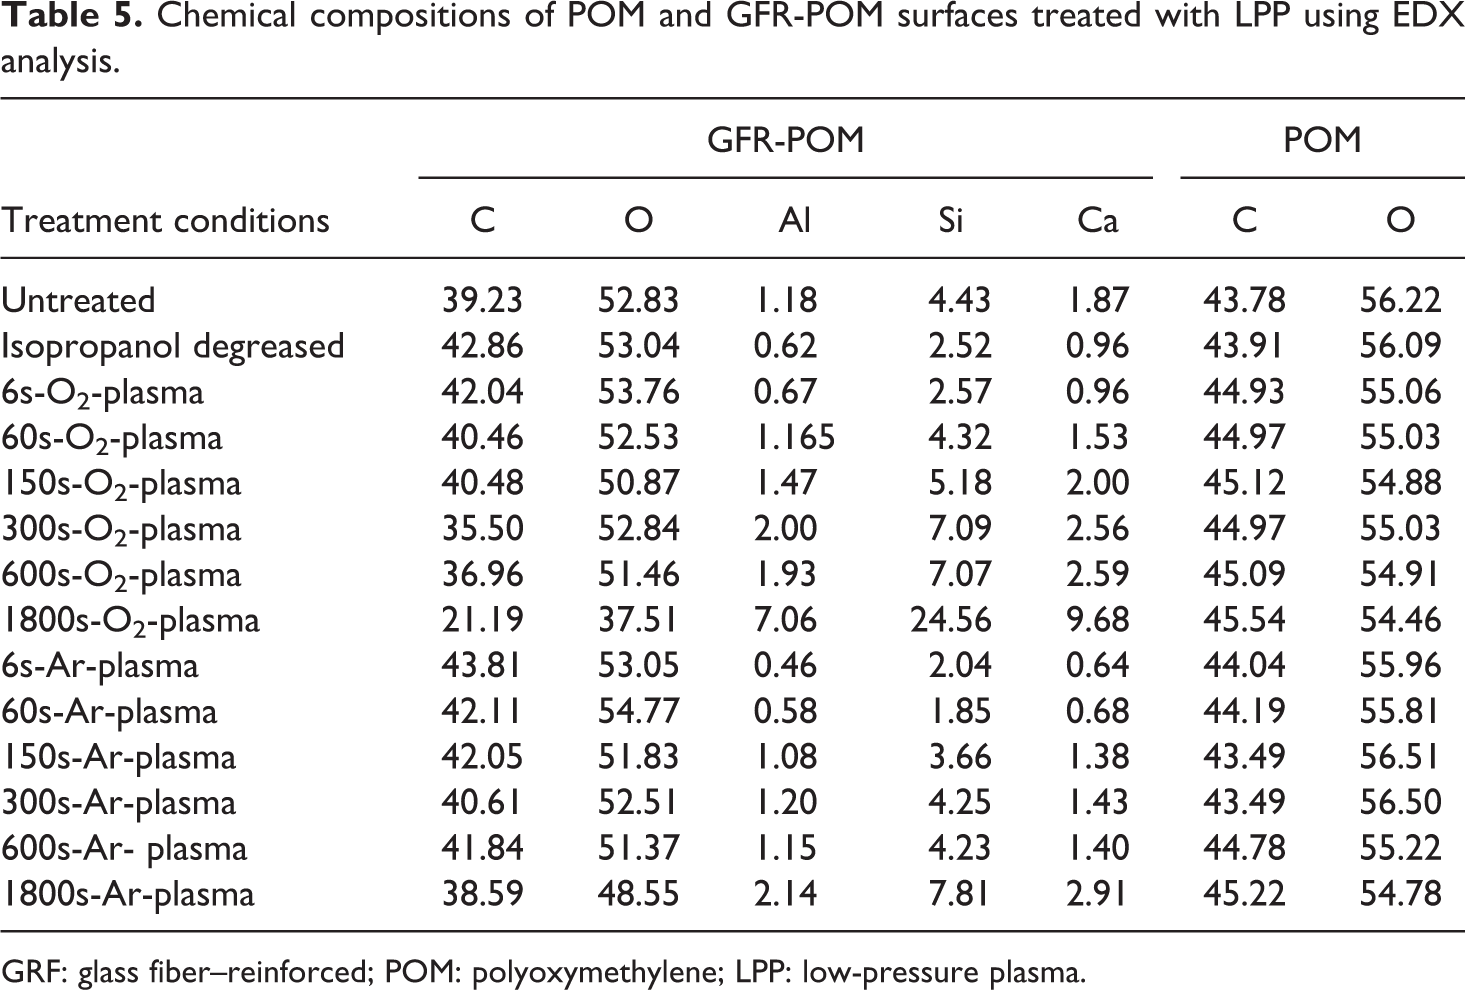
GRF: glass fiber–reinforced; POM: polyoxymethylene; LPP: low-pressure plasma.
Adhesion strength results
Figures 3 and 4 show the adhesion strength values for GFR-POM and POM surfaces, respectively, treated with LPP as a function of plasma gas, treatment time, and adhesive type. The results show that the GFR-POM specimens have higher adhesion strength values compared to that of the unreinforced POM specimens. The values are also dependent on the adhesive types and treatment parameters. Untreated GFR-POM samples reveal low adhesion strength values of approximately 2–3 MPa regardless of the adhesive type, while for untreated unreinforced POM, the values do not exceed 0.5 MPa. GFR-POM surfaces glued with EP 1 or EP 2 adhesive show higher adhesion strength values after being treated with Ar-plasma compared to that treated with O2-plasma, and this is an inverse behavior of GFR-POM surfaces glued with PU adhesive. The unreinforced POM specimens glued with PU show low adhesion strength values regardless of the used process gas and the treatment time. The untreated samples of unreinforced POM possess very low adhesion strength values and low value of the polar component of the surface energy which might be attributed to the main chain structure, despite the higher oxygen concentration at the POM surfaces which observed from EDX analysis. According to Encinas et al., 27 the ether groups contained in the main chain generate at the microscopic scale high dipole moments along the polymer chain. The regular and small distance between oxygen atoms leads these moments to compensate for the most part each other, and thus only a weak polarity differences on the macroscopic scale could be observed. In general, a correlation between the polar component of the surface free energy and the adhesion strength could not be established. The adhesion strength values of the GFR-POM are significantly higher than the values of the unreinforced POM, despite the lower polar energy component for the later. The clear improvement in the adhesion strength of the GFR-POM surfaces is mainly due to the high increment of the Si concentration after plasma treatment since Si acts as a coupling agent between the adhesive and the POM part. Furthermore, the roughness of the GFR-POM surfaces is higher than that of the unreinforced and this leads to rise the mechanical interlocking between the adhesive and the POM part. Regarding the adhesion strength trend of O2-plasma treated samples for EP 1 and EP 2, which shows a drop before increasing back, this might be attributed to the fluctuation in their polarity values as shown in Table 4.
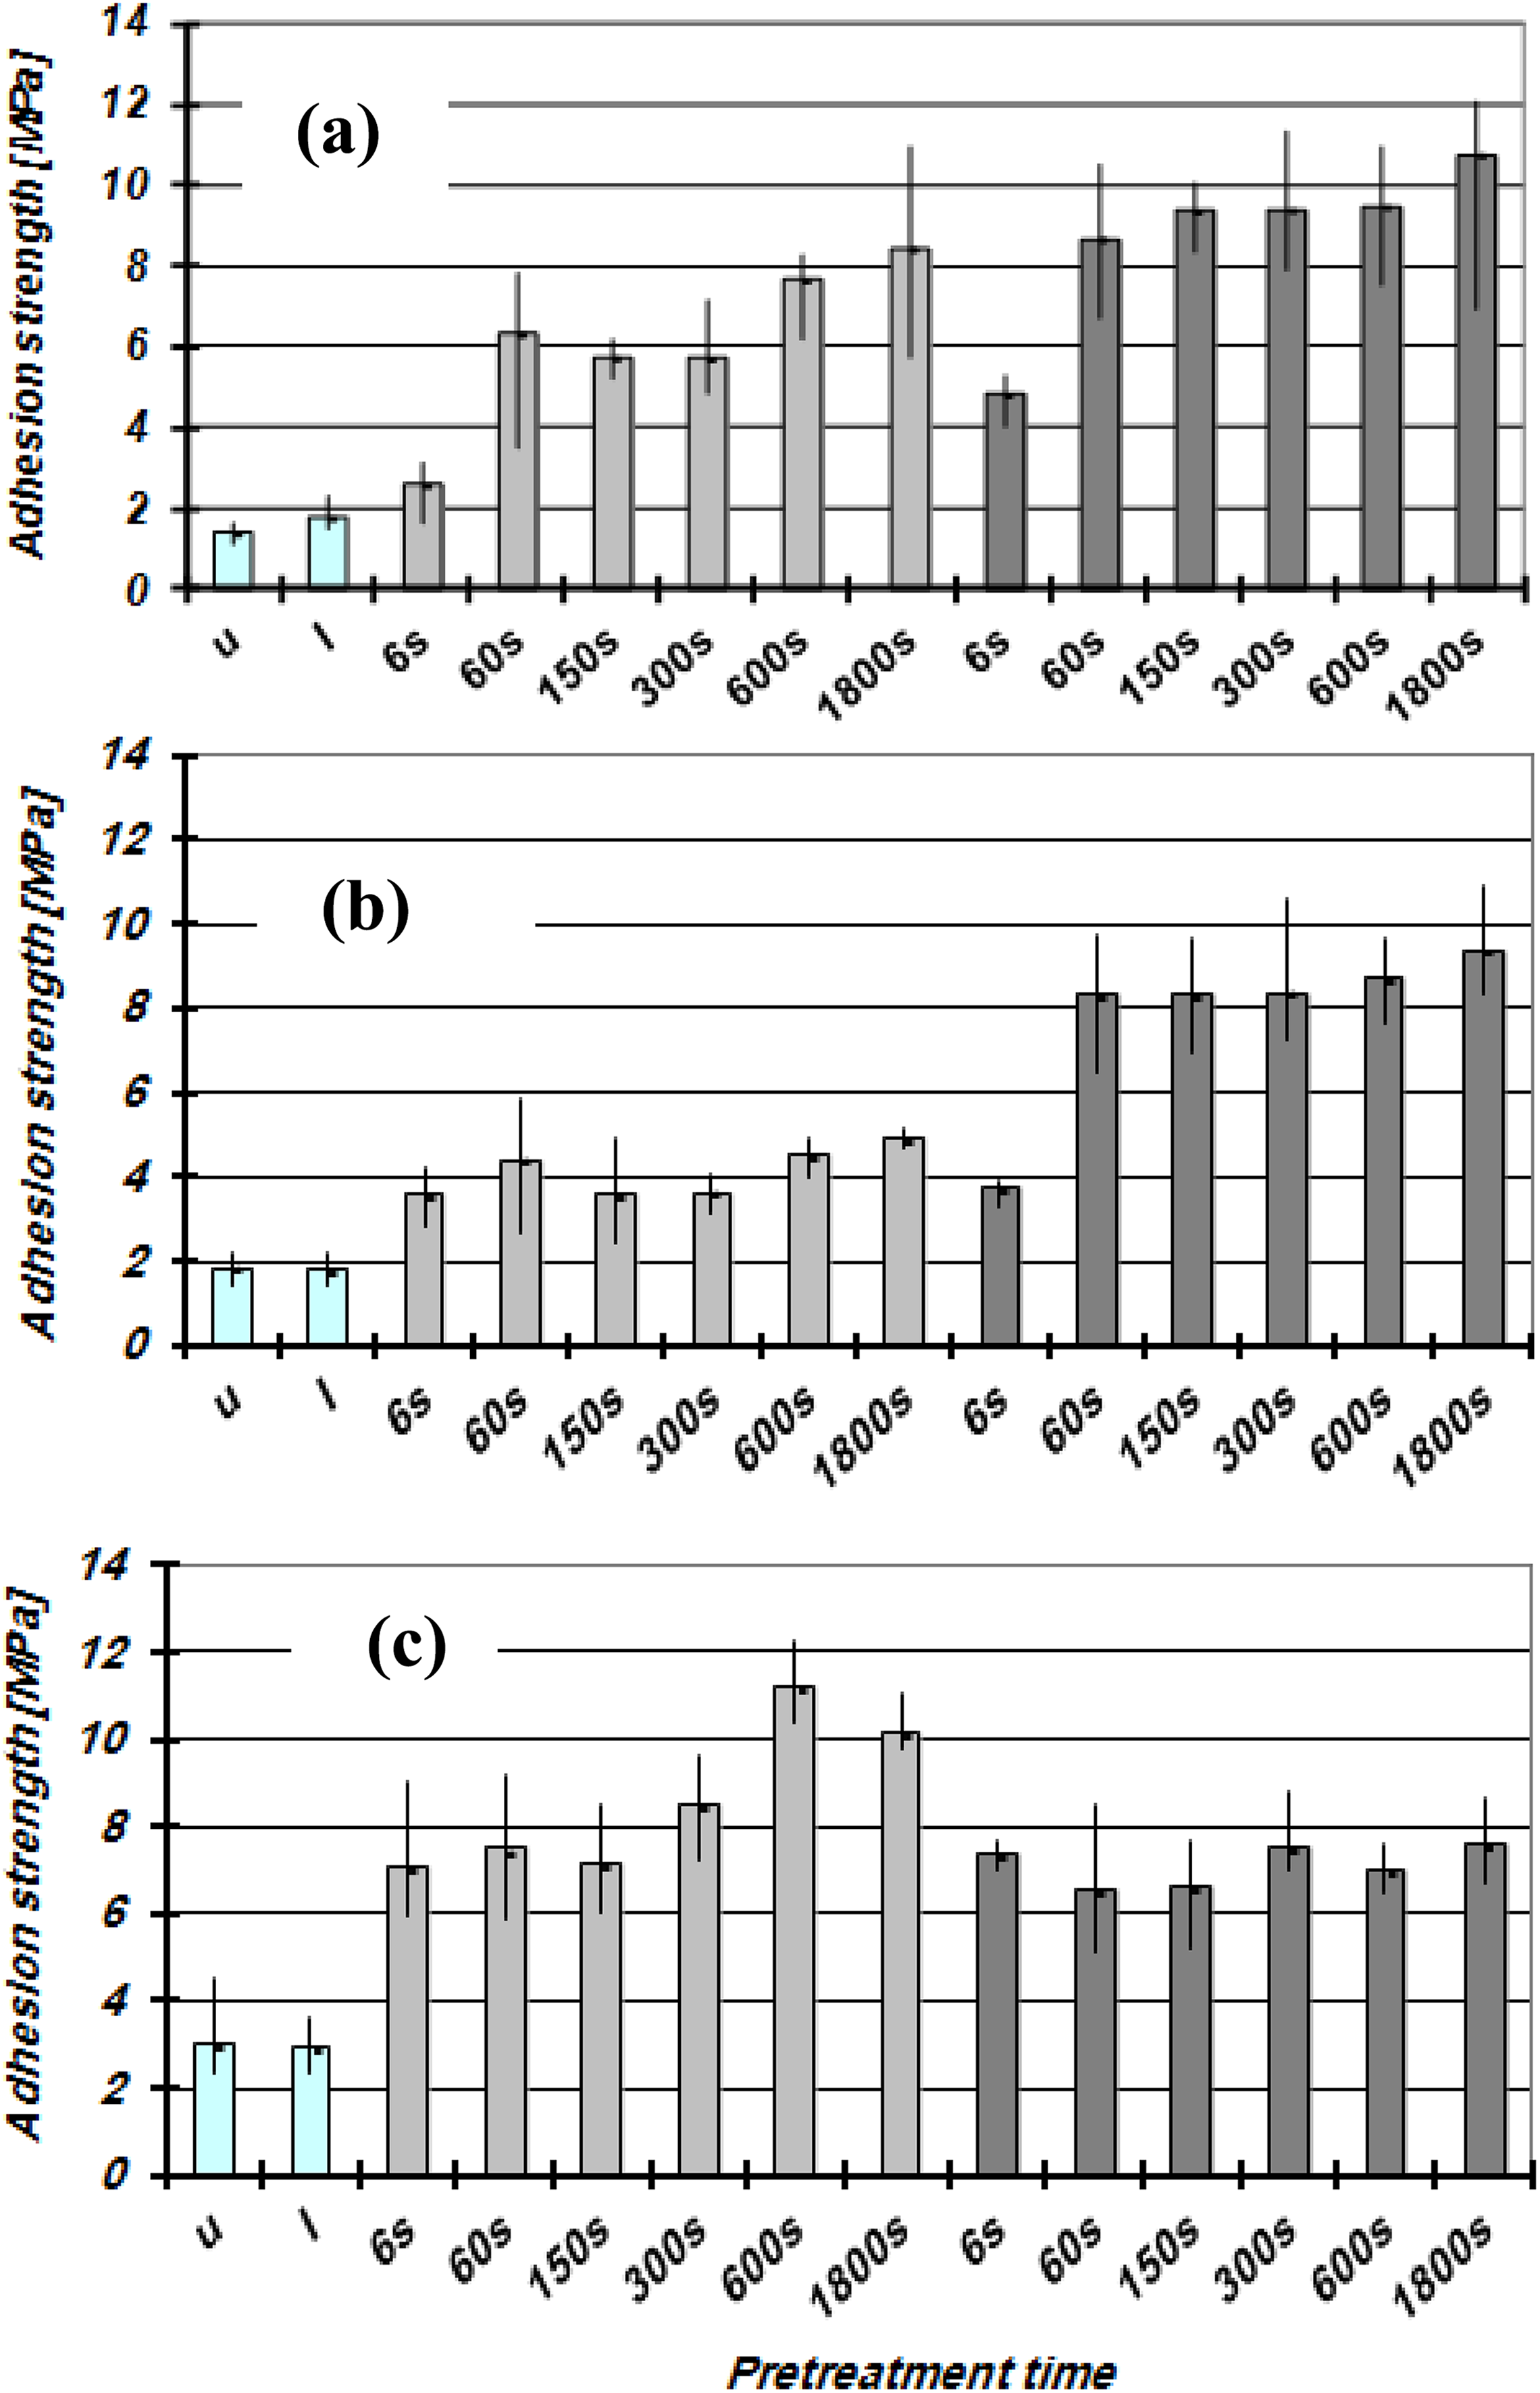
Adhesion strength of the LPP-treated GFR-POM surfaces as a function of treatment time: (a) EP 1; (b) EP 2; (c) PU.
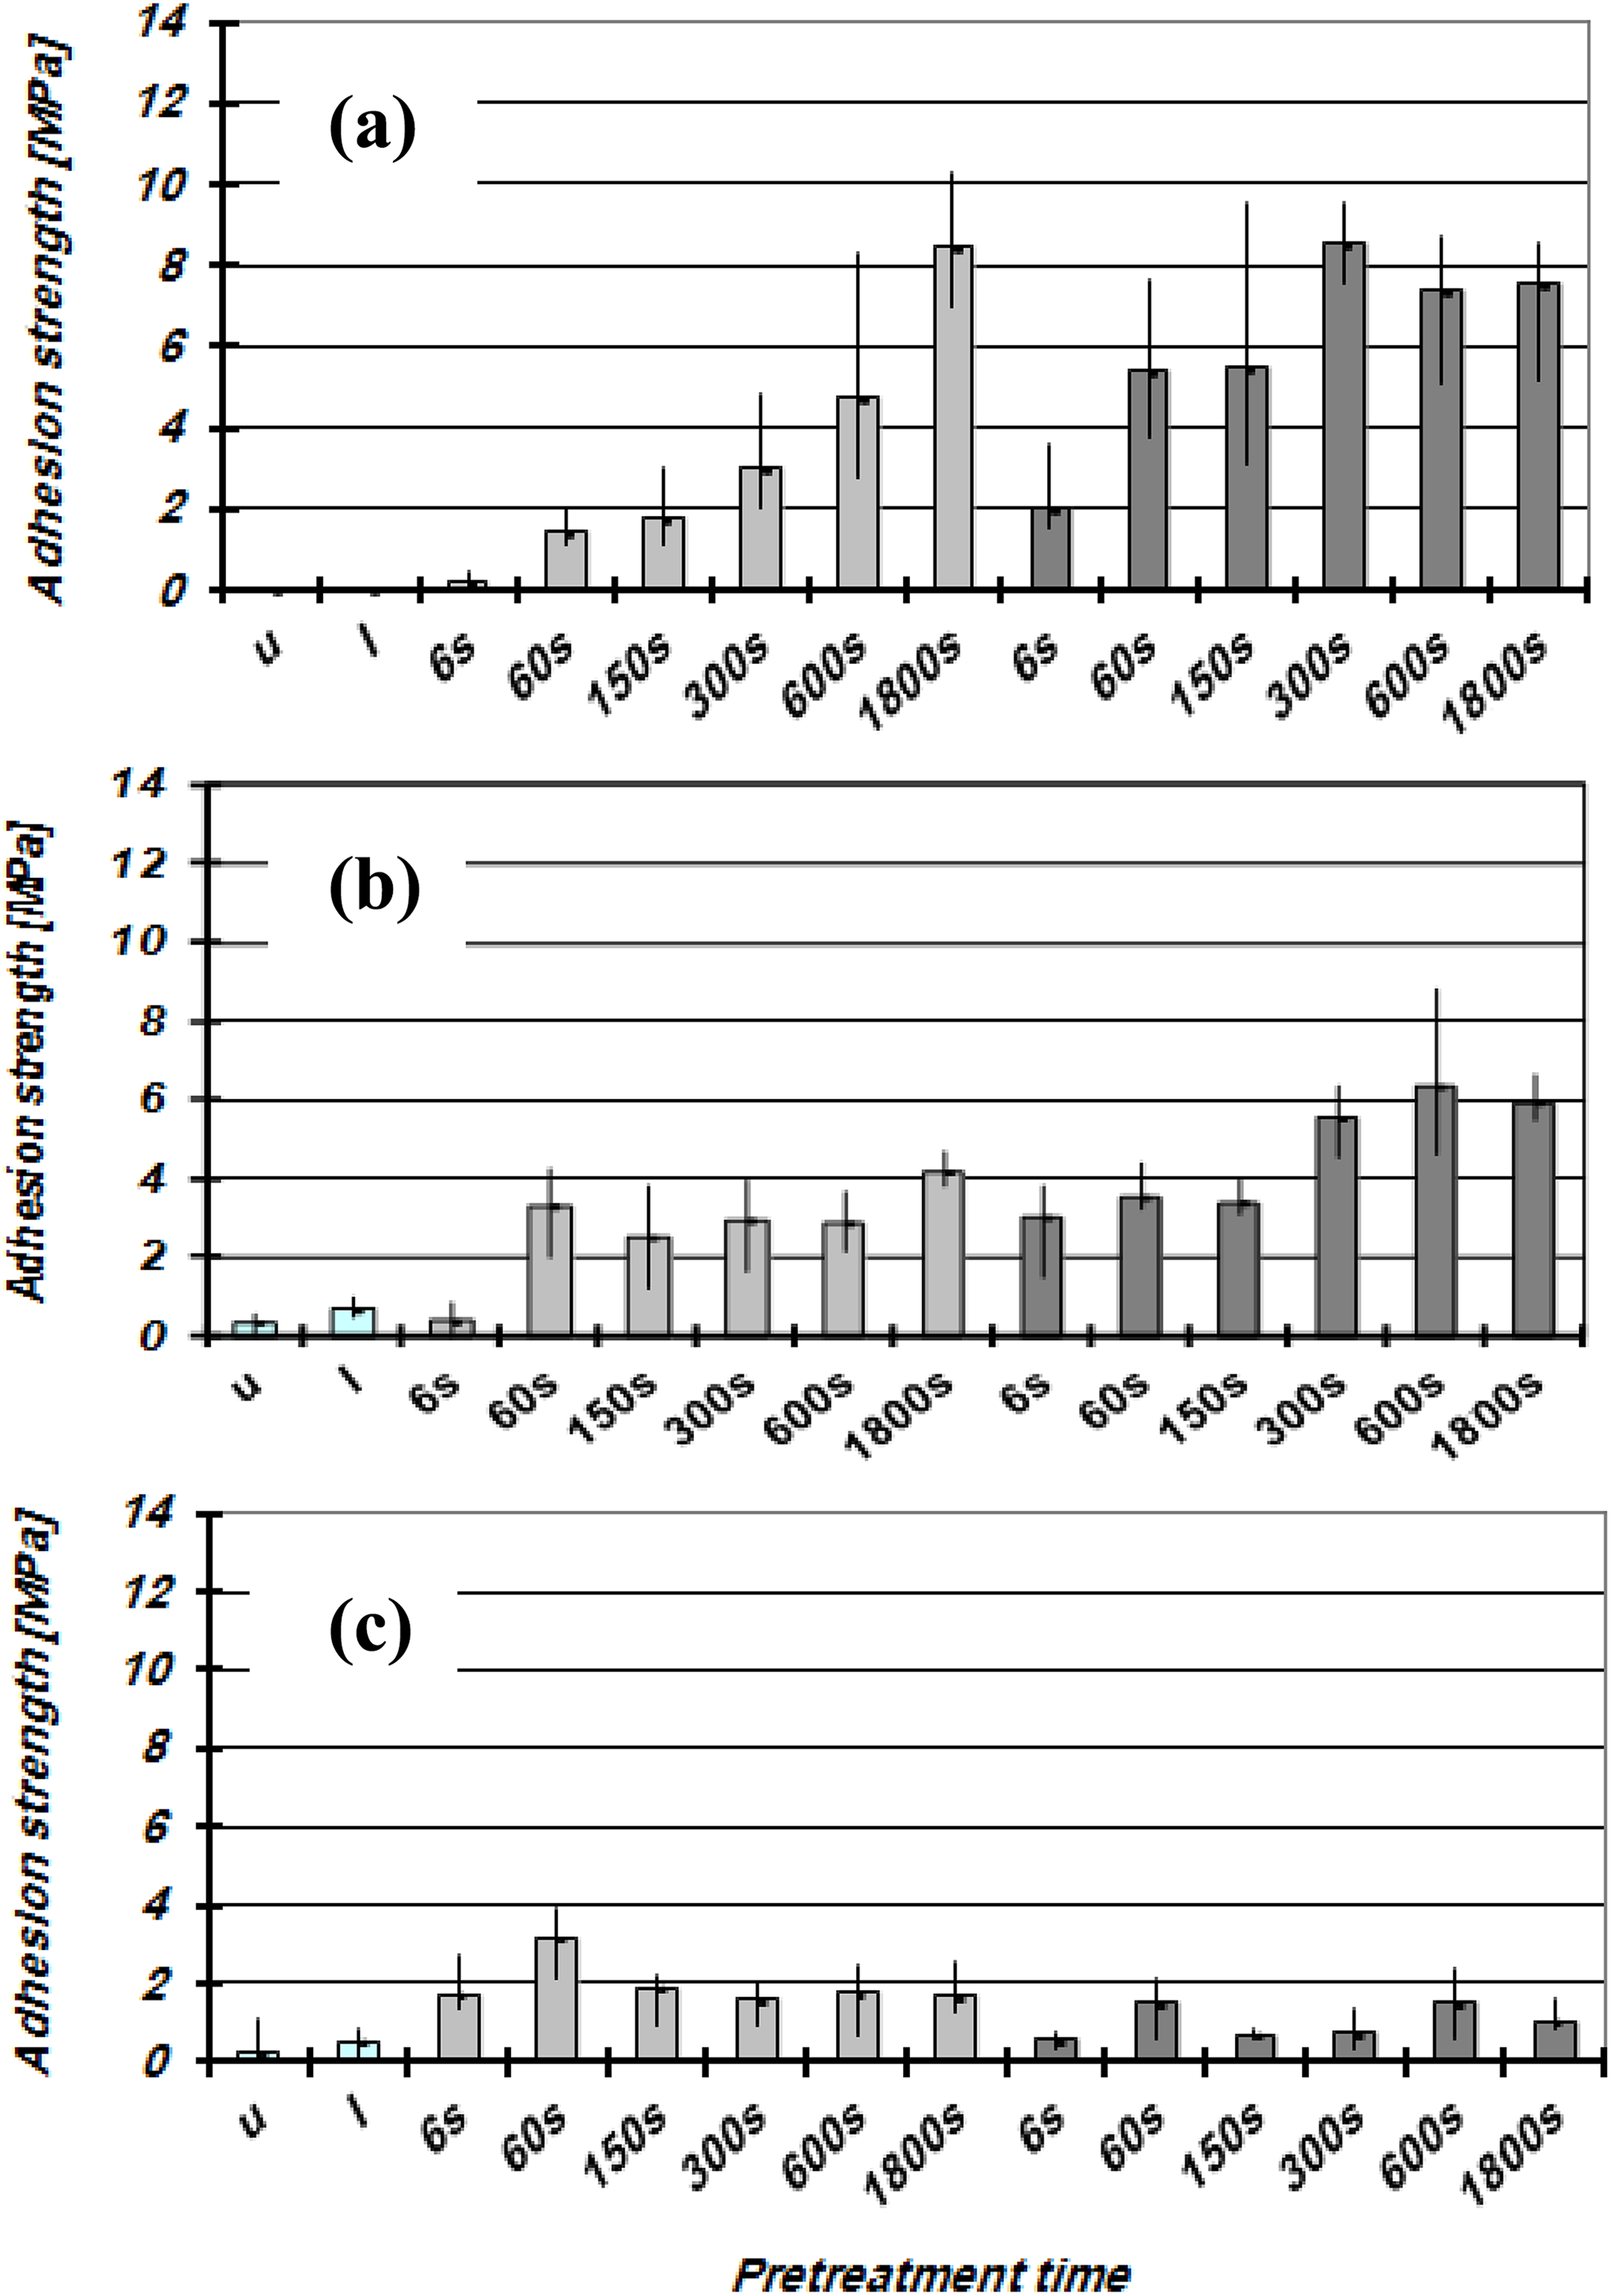
Adhesion strength of the LPP-treated unreinforced POM-surfaces as a function of pretreatment time: (a) EP 1; (b) EP 2; (c) PU.
Fracture modes of bonded joints
At macroscopic level, an adhesive fracture at the boundary layer between the POM surfaces and adhesive layer is observed for Al-POM adhesive bonded joints in their as received and degreased states. These observations are similar for both reinforced and unreinforced samples regardless of the adhesive type. The fracture mode of GFR-POM specimens glued with EP adhesives shows no changes in fracture mode after Ar- or O2-plasma treatment and it was independent of the treatment time. Other fracture behaviors can also be macroscopically observed as follows: The specimens glued with EP 1 adhesive exhibit a fracture mode, in addition to adhesive fracture at the POM surface, a mainly cohesive fracture in the POM part and more specifically through the overlap length. This only occurs when the adhesion strength exceeds 10 MPa, and a low material utilization factor of only 26% is reported. The fracture mode for the specimens glued with EP 2 adhesive changes sometimes at longer treatment time from adhesive fracture at the boundary layer between the POM part and adhesive layer to the boundary layer between Al part and adhesive layer. Finally, the specimens glued with PU adhesive show a mixed fracture mode after Ar-plasma treatment; adhesively at the boundary layer between POM parts and adhesive layer as well as a cohesive in the adhesive layer. Although treated samples with O2-plasma exhibit a similar fracture mode as samples treated Ar-plasma after a longer treatment time of 600 s. At lower treatment time <600 s, the fracture mode is only adhesive at the boundary layer between POM surface and adhesive layer.
Figure 5 shows the SEM topographic fracture structures of adhesively bonded Al and GFR-POM joint as a function of adhesive type, plasma gas, and treatment time. Regardless of the adhesive type, SEM topographic structures of untreated specimens display an adhesive fracture mode as shown in Figure 5(a) for samples glued with EP 1. This is identical to a great extent to SEM topographic structure of the surfaces in their as received state (Figure 1(b)). The fracture surfaces exhibit a change in the fracture mode when the adhesion strength is strongly improved. For specimens treated with O2-plasma for 1800 s and glued with EP 1, the fracture occurs probably in the GFR-POM part and indeed in a layer parallel to the adhesive layer as indicated by the protruding of GFs from the POM matrix (Figure 5(b)). This is evidenced by EDX analysis, which showed that, at both Al and GFR-POM fracture surfaces, the same chemical composition was detected. This behavior is observed independent on the adhesive type, plasma gas, and treatment time. On the other hand, samples treated with Ar-plasma for 1800s and glued with EP 1 adhesive show a different fracture mode which is a cohesive fracture in the adhesive layer (Figure 5(c)) as no GFs are seen in both Al and GFR-POM fracture surfaces. This type of samples showed the highest adhesion strength values of about 11 MPa. A combination of adhesive and cohesive fracture modes (Figure 5(f)) are noticed in case of samples treated with O2-plasma for 1800 s and glued with PU adhesive which might explain its higher value of adhesion strength compared to its counterpart sample glued with EP 1 adhesive.
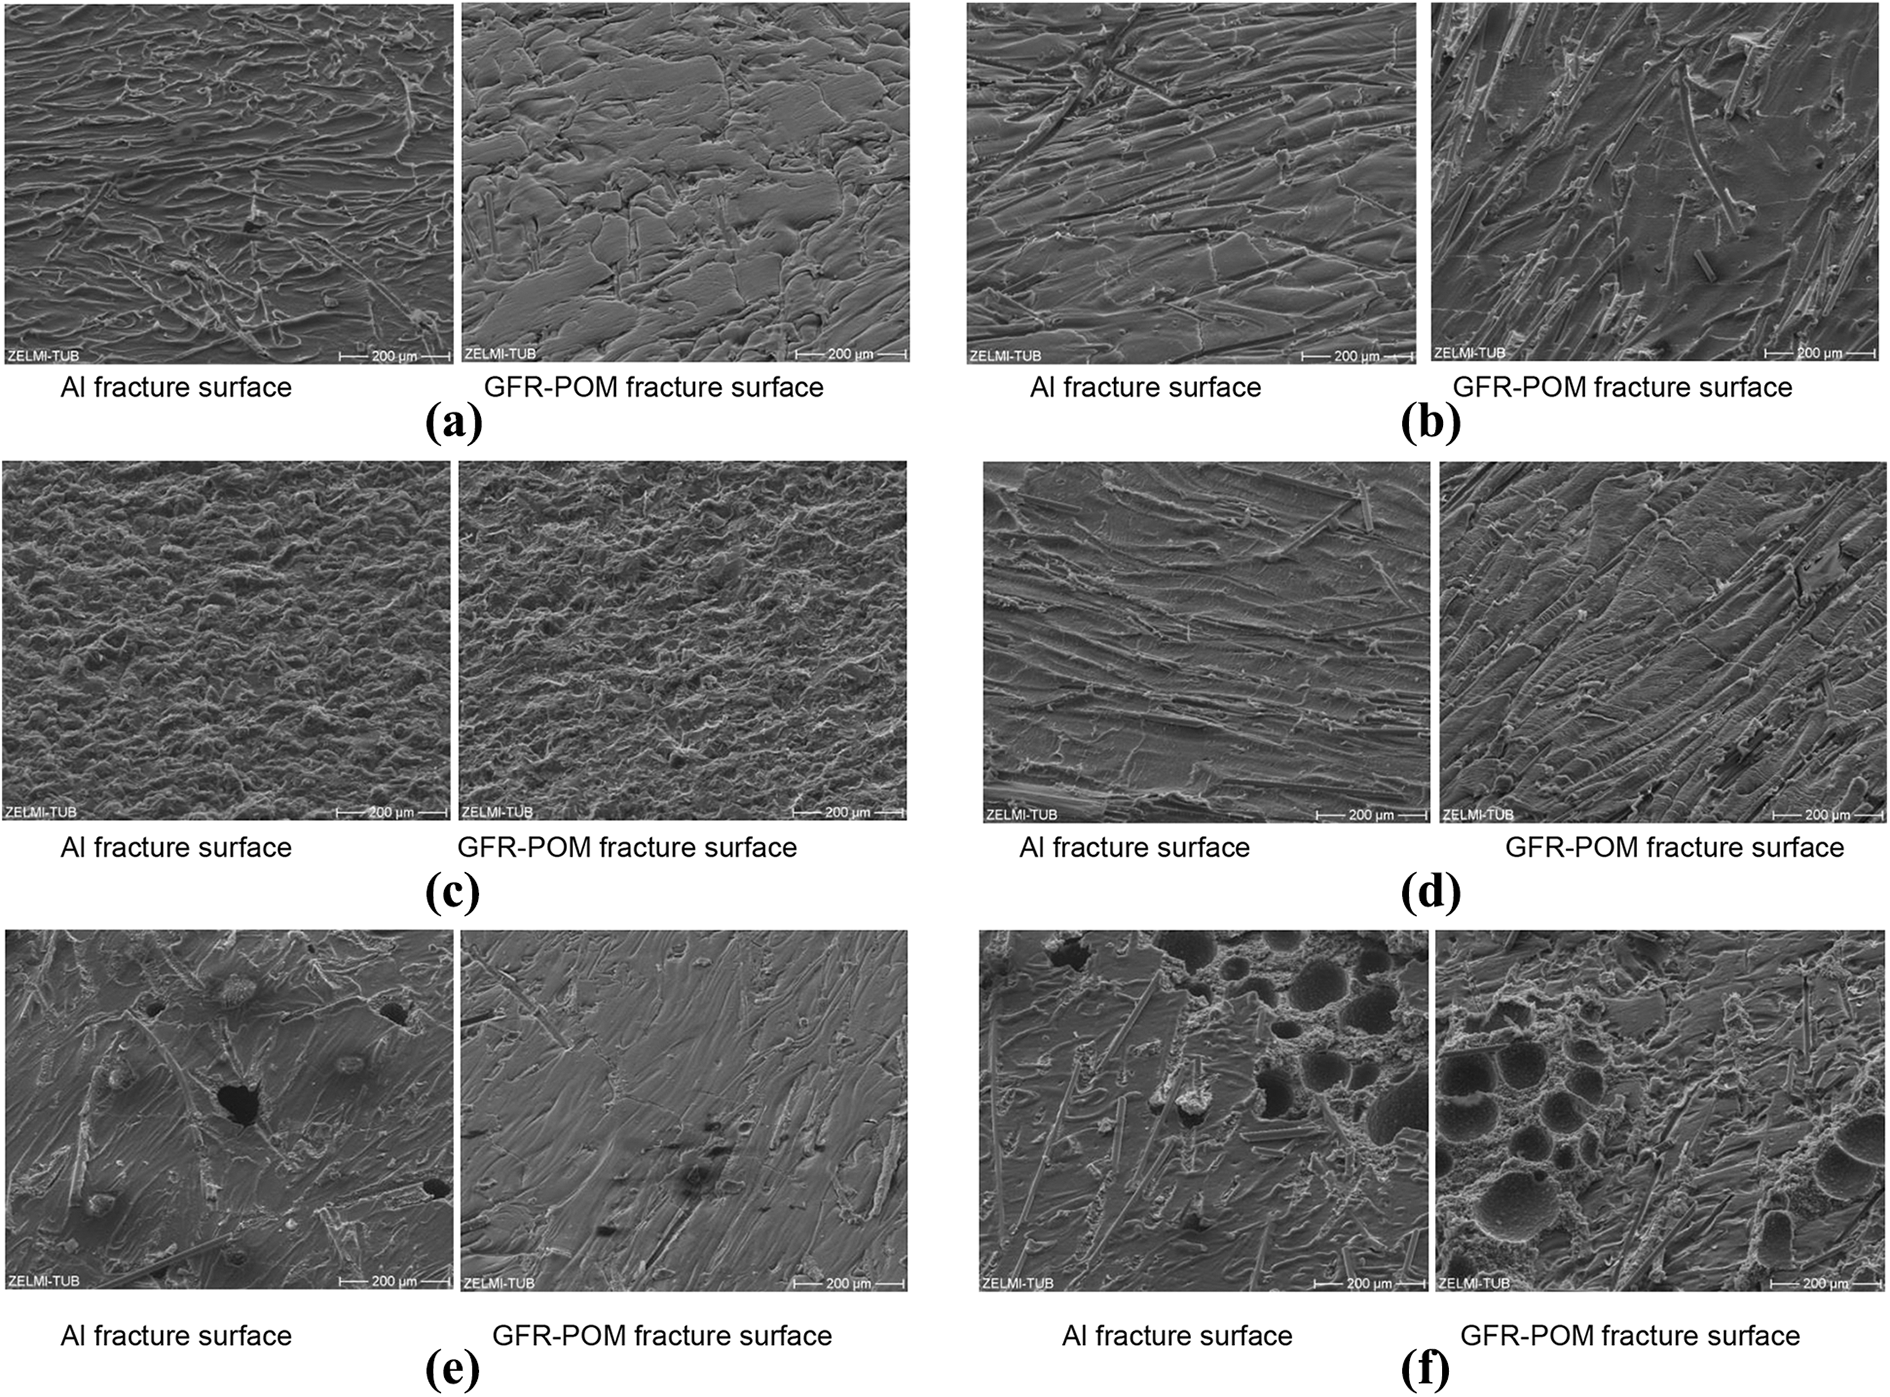
SEM fracture surfaces of Al joint and adhesively bonded GFR-POM of (a) EP 1 adhesive, untreated; (b) EP 1 adhesive, 1800s O2-plasma; (c) EP 1 adhesive, 1800s Ar-plasma; (d) EP 2 adhesive, 1800s Ar-plasma; (e) PU adhesive, 600s O2-plasma; (f) PU adhesive, 1800s O2-plasma.
Unreinforced POM specimens treated with Ar-and O2-plasma and then glued with EP or PU adhesives (Figure 6(a), (b), (d) to (f)) show almost a similar fracture mode as in case of its as received state (Figure 6(c)). In general, these samples display an adhesive fracture at the boundary layer between POM surface and adhesive layer. When their adhesion strength value exceeds 8 MPa or 6 MPa for POM specimens treated by O2-plasma and glued with EP 1 or EP 2, respectively, it is found that the fracture mode changes from only adhesive at the boundary layer between POM parts and adhesive layer to cohesive fracture in the POM part and in the overlap length (Figure 6(a) and (d)). The material utilization factors in these cases are found between 27% and 47%. Similar observations can be reported when these samples treated with Ar-plasma (Figure 6(b) and (e)). For untreated specimens glued with EP 1, the adherent parts (POM and Al) are separated from each other without any application of forces during griping the specimens between the jaws of the tensile testing machine. For untreated POM specimens glued with EP 2 or PU, a similar fracture mode was observed with the appearance of smooth fracture surfaces (Figure 6(c)), and this indicates the occurrence of adhesive fracture mode at the boundary layer between the POM surface and the adhesive layer with low adhesion strength values. Similar fracture mode for the surfaces of the POM treated with Ar- or O2-plasma and glued with PU was highlighted with low adhesion strength values as shown in Figure 6(f). Whereas the SEM topographic structures of the specimens treated with Ar- or O2-plasma and glued with EP 2 adhesive show a higher roughness with significantly higher adhesion strength than the specimens glued with PU indicates that the fracture mode is not adhesive at the boundary layer between the adhesive layer and the POM surface, but the fracture occurs at a layer either in the POM part parallel to the adhesive layer or in the adhesive layer itself (Figure 6(d) and (e)). SEM fracture mode of POM surfaces treated with Ar-plasma for 300 s and glued with EP 1 (Figure 6(b)) reveal different topographic structures than those treated with O2-plasma for 1800 s (Figure 6(a)), even though the adhesion strength values are similar.
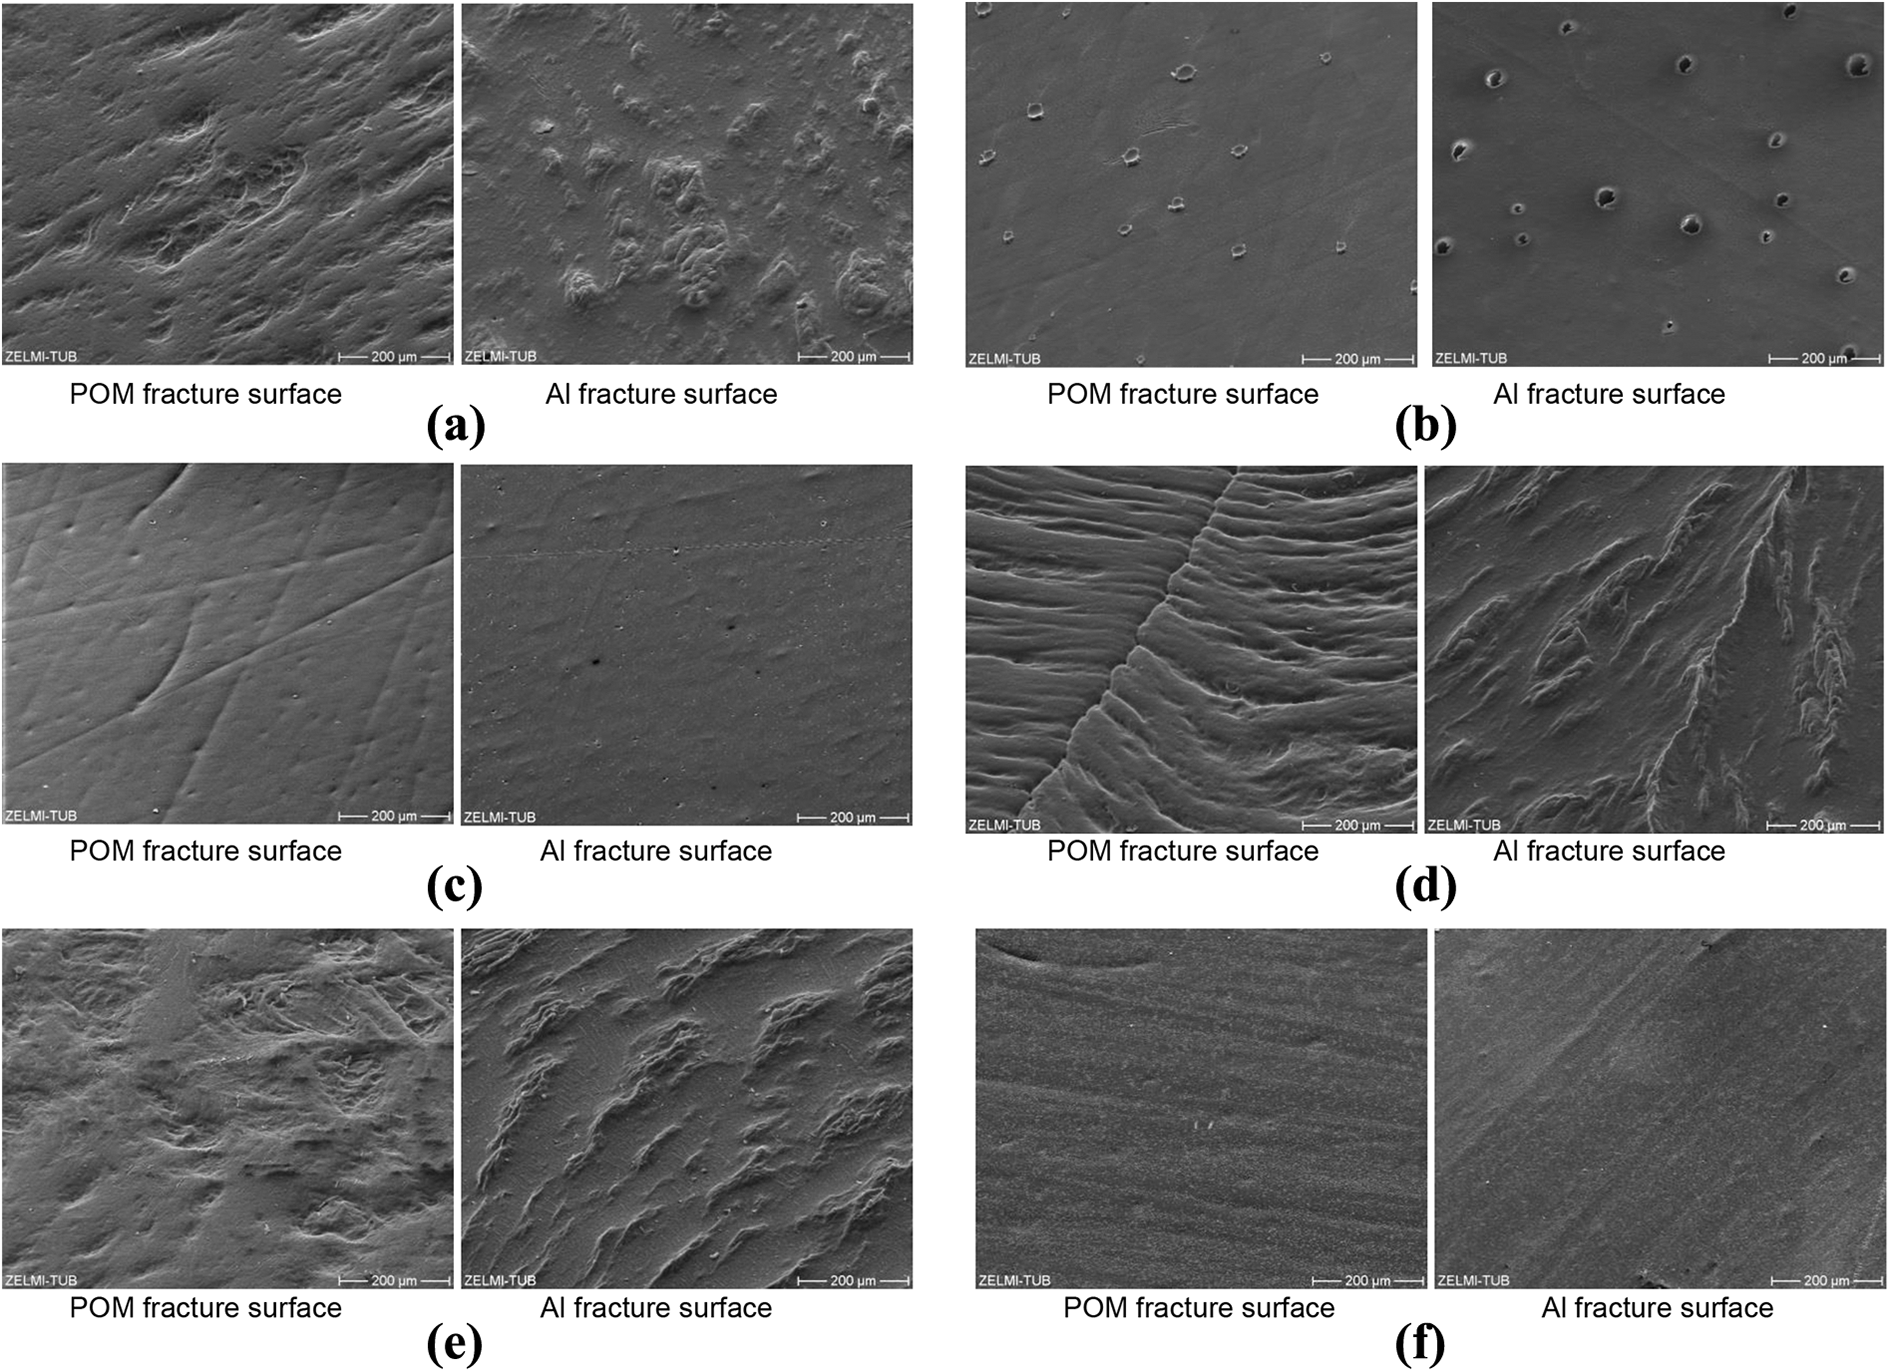
SEM fracture surfaces of adhesively bonded unreinforced POM and Al joint of (a) EP 1 adhesive, 1800s O2-plasma; (b) EP 1 adhesive, 300s Ar-plasma; (c) EP 2 adhesive, untreated; (d) EP 2 adhesive, 1800s O2-plasma; (e) EP 2 adhesive, 600s Ar-plasma; (f) PU adhesive, 600s Ar-plasma.
Conclusions
Ar- and O2-plasma LPP treatments had been carried out into the surfaces of reinforced and unreinforced POM. It was found that the treatment of POM surfaces with O2- and Ar-plasma showed different effects on the surface roughness of the samples based on the treatment time. The increase in surface roughness was more pronounced for O2-plasma-treated samples compared to Ar-plasma samples. An ablation of the outermost surface layers could be seen on both POM and GFR-POM surfaces treated with O2-plasma at a long treatment time of 1800 s. On the other hand, the polar component of surface free energy of untreated GFR-POM was found to be higher than that of untreated POM, while after O2- or Ar-plasma PPL treatment, the increase in polar component was more pronounced for POM. The effect of plasma treatment on the values of surface free energy was similar to some extent when comparing the values of Ar-plasma samples to their counterparts of O2-plasma ones, and no clear trend could be highlighted. The GFR-POM specimens had higher adhesion strength values compared to that of the unreinforced specimens, and the values were also dependent on the adhesive types and treatment parameters. GFR-POM surfaces glued with EP 1 or EP 2 adhesive showed higher adhesion strength values after being treated with Ar-plasma compared to that treated with O2-plasma, and this behavior was opposite for GFR-POM surfaces glued with PU adhesive. The unreinforced POM specimens glued with PU showed low adhesion strength values regardless of the used plasma gas and the treatment time. Finally, different fracture modes of surfaces were observed and samples treated with Ar-plasma for 1800s and glued with EP 1 adhesive showed a cohesive fracture mode in the adhesive layer and had the highest adhesion strength values of about 11 MPa. There are other factors (physical and chemical) that affect the adhesive strength values besides surface roughness and surface tension such as shear compressive and tensile strength of adhesive, porosity, thickness of adhesive film, techniques of application (temperature, pressure, and time), and polarity of adhesives. So, further study is recommended in the future for a comprehensive investigation on the effect of all these factors in adhesion strength using such adhesives.
Footnotes
Acknowledgements
The authors would like to thank Al-Balqa Applied University for their support and help. Dr. Dweiri and Dr. Al-Ajlony express their sorrow and acknowledgements to their colleague, the late Professor Dr. Nabil Anagreh who was being led this research group and passed away on November 7, 2017. Mercy and peace upon his pure spirit.
Funding
The author(s) received no financial support for the research, authorship, and/or publication of this article.