
Abstract
This study reports on novel poly(vinylidene fluoride)/poly(3,4-ethylenedioxythiophene) (PVDF/PEDT) blend and nanocomposite. Polyaniline functional nanodiamond (PANI-ND) was prepared through in situ route and reinforced in blend to form PVDF/PEDT/PANI-ND. Field-emission scanning electron microscopic analysis revealed consistently dispersed and interlinked bead-like morphology owing to physical interaction in matrix–nanodiamond. Transmission electron microscopy also revealed spherical nanoparticles dispersed in the matrix. Tensile strength and modulus for neat PVDF/PEDT blend were found to be 44.2 MPa and 20.2 GPa, respectively. PVDF/PEDT/PANI-ND 5 with 5 wt% PANI-ND showed high tensile strength and modulus of 61.5 MPa and 152.7 GPa. In this way, strength and modulus of PVDF/PEDT/PANI-ND 5 was 22% and 87% (respectively) higher than the pristine blend. Nanofiller reinforcement (5 wt%) also enhanced the 10% degradation temperature from 421°C (neat blend) to 555°C and maximum decomposition temperature from 466°C to 588°C. Moreover, PANI-ND addition from 0.1–5 wt% enhanced the electrical properties from 10−3–2.1 S cm−1 (at room temperature). At 100°C, electrical conductivity of all nanocomposite was increased and maximum value was attained for PVDF/PEDT/PANI-ND 5 (3.0 S cm−1). PVDF/PEDT/PANI-ND 5 electrode exposed rapid Li+-ion diffusion, electron transfer, and electrical conductivity profile. Electrochemical impedance spectroscopy exhibited specific capacity and Coulombic efficiency of 900 mA h g−1 and 90% after 300 cycles.
Introduction
Poly(vinylidene fluoride) (PVDF) is a semicrystalline thermoplastic polymer having fine thermal stability, chemical resistance, mechanical strength, elasticity, and piezoelectric and pyroelectric characteristics. 1,2 Because of outstanding properties, PVDF own wide range of applications in biomedical, electronics, supercapacitors, actuators, batteries, and so on. PVDF exits in five different crystalline forms as α, β, δ, γ, and ε-phase. One phase of PVDF can be converted to another under different crystallization conditions, electrical field, and other external stimuli. Incorporation of nanoparticles such as carbon nanotube, graphene, nanoclay, and metal oxide promotes the formation of β-phase, that is, important for high conductivity, dielectric constant, and piezoelectricity of the resulting nanocomposite. 3 Amalgamation of nanoparticle in PVDF may also enhance thermal, mechanical, and pyroelectric properties of PVDF. 4 Stretching as well as the incorporation of nanofiller in PVDF changes the crystalline form of the sample to β-phase. Nanofillers act as nuclei centers for the crystallization of PVDF. In β-phase, PVDF crystals are oriented/aligned in one particular direction. This orderly orientation not only increases the crystallinity of the nanocomposites but also develops a percolation network. The formation of percolation framework enhances the electrical conductivity of the material. Because of biocompatibility, flexibility, strength, conductivity, piezoelectric, and pyroelectric properties, PVDF-based nanocomposites have been found suitable for biomedical devices, lithium (Li) batteries, microelectronic devices, actuators, and energy harvesters. 5 –8 Among a wide range of conducting polymers, polyaniline (PANI), polypyrrole, polythiophene, and polyphenylene are important. Mostly, conducting polymers are insoluble in common solvents. Polythiophene derivative such as poly(3,4-ethylenedioxythiophene) (PEDT) has been developed to attain fine solubility. 9 PEDT has been prepared using oxidative electrochemical polymerization and exhibited very high conductivity (approximately 300 S cm−1). It may form a water-soluble polyelectrolyte system having high conductivity, film-forming properties, high transmittance, and stability. Blends of PVDF with conducting polymers have been developed using several techniques such as solution mixing, in situ polymerization, fusion technique, and emulsion method. 10 For example, PVDF/PANI blends have been widely investigated through various methods and techniques. 11,12 Consequently, blends of PVDF and conducting polymers have been reinforced with carbon nanotube, nanodiamond (ND), and so on to gain enhanced nanocomposite features. 13,14 PVDF-based nanocomposite has been employed as polymer electrolyte and electrode systems in Li-ion batteries. 15 PEDT and carbon-based composite electrodes have also been explored in Li-ion batteries. 16 ND is an important nanocarbon nanofiller for polymers. ND powder own average grain size of 5 nm and several exciting structural properties. 17,18 This core–shell structure of ND depicts core of perfect diamond lattice surrounded by shell of compressed diamond lattice. ND have been extensively used in a range of technical applications such as sensors, Li-ion batteries, supercapacitors, electrodes, and biomedical devices. 19,20 There is a need for blending PVDF with conducting polymers and reinforce with new nanocarbon structures such as ND to attain improved electrode efficiency. Because of improved conducting performance of polythiophene derivative such as PEDT, there is a need for using conducting polymer derivatives instead of conducting polymers. In this regard, new design combinations of PVDF, conducting polymers, and ND are required to obtain superior mechanical strength, thermal stability, and electrical conductivity. To the best of knowledge, PVDF/PEDT blends have not been prepared and reinforced with functional ND. In this attempt, PVDF/PEDT blend was prepared using solution mixing method. In situ polymerization of aniline on ND was carried out to attain PANI-functional ND (PANI-ND) nanofiller. Series of PVDF/PEDT/PANI-ND has been developed and characterized for microstructure, mechanical strength, thermal stability, and electrical conductivity. Moreover, the main aim of this study was to develop novel PVDF/PEDT/PANI-ND electrode and test in Li-ion battery. Consequently, the electrode was subjected to electrochemical impedance spectroscopy (EIS) and charge/discharge tests to access the electrochemical performance.
Experimental
Chemicals
PVDF (average Mw ∼534,000 g/mol), PEDT, aniline (≥99.5%), ammonium persulfate ((NH4)2S2O8, 98%), hydrochloric acid (HCl, 37%), nitric acid (HNO3, 70%), sulfuric acid (H2SO4, 99.9%), N,N-dimethylformamide (DMF, 99%), and diamond nanopowder (<10 nm particle size, ≥97%) were supplied by Aldrich (St. Louis, USA).
Instrumentation
Fourier transform infrared (FTIR) spectra were recorded using Excalibur Series FTIR Spectrometer, Model No. FTSW 300 MX manufactured by BIO-RAD (California, USA). Morphology was investigated by FEI Nova 230 (Kensington UNSW Sydney) field-emission scanning electron microscope (FESEM). The samples were cryogenically fractured in liquid nitrogen before analysis. Transmission electron microscopy (TEM) was performed with LEO 912 Omega instrument at 120 kV. The ultrathin sections were prepared using an Ultracut E ultramicrotome diamond knife. Thermal stability of materials was determined by NETZSCH (Germany) thermogravimetric analyzer (TGA), model no. TG 209 F3, using 1–5 mg of the sample in Al2O3 crucible. The heating rate of 10°C min−1 was maintained up to 800°C under nitrogen flow rate of 30 mL min−1. The electrical conductivity of thin films was measured using four-point method (Keithley 2401, Keithley, Ohio, USA). Electrode was prepared by pasting the slurry containing 80% active material and 20% poly(acrylic acid) on copper foil using doctor-blade method. The electrode was then dried in a vacuum oven at 60°C for 12 h. Li foil was used as the counter electrode. LiPF6 (1 M) was used as an electrolyte. A polypropylene membrane was used as separator. The galvanostatic charge/discharge tests were performed on battery. EIS was performed using the Solartron system (West Sussex, UK).
Acid treatment of ND
ND carboxylation was performed by treating the ND with strong acids, that is, H2SO4 and HNO3 (3:1) with continuous stirring for 24 h (room temperature). The above mixture was poured into 500 mL water and again stirred for 4 h. The mixture was filtered, and the residue was washed several times with deionized water and dried at 80°C for 4 h. 21 FTIR: 3479 (hydroxyl group), 3003 (aromatic C–H stretch), 1720 (C=O).
In situ polymerization of aniline on ND (PANI-ND)
For this purpose, 0.5 g acid functional ND, 1 mL aniline monomer, and 1 mL HCl were dispersed in deionized water. Then, 0.1 M solution of (NH4)2S2O8 was gradually added into the above dispersion. The mixture was stirred for 24 h, and the product was filtered, washed, and vacuum dried. 22 FTIR: 3011 cm−1 (C–H stretch), 3220 cm−1 (N–H stretch), 1300 and 1501 cm−1 (C–N benzenoid ring), 1570 cm−1 (C=N quinoid ring).
PVDF/PEDT blend
For blend formation, 0.8 g PVDF was dissolved in 30 mL DMF with continuous stirring of 24 h at 50°C. Then, 0.2 g PEDT was also dissolved in 10 mL DMF separately. Then, PVDF and PEDT solutions were mixed and refluxed at 130°C for 6 h. The mixture was cast in glass petri dishes at 80°C for 24 h. 23 FTIR: 3015 and 2980 cm−1 (CH2 asymmetric and symmetric vibrations), 1403 cm−1 (CH2 wagging), 1330 and 1520 cm−1 (C–C/C=C thiophene ring stretch), 1197 cm−1 (C–O–C stretch), 790 cm−1 (CF3 stretch), 610 cm−1 (–C–F– wagging), 850 cm−1 (C–S stretch).
PVDF/PEDT/PANI-ND blend
The PVDF/PEDT blend was prepared according to the procedure mentioned in the “PVDF/PEDT blend” section . After refluxing the blend mixture at 130°C for 6 h, functional ND nanofiller (0.1–5 wt%) was added to the mixture. The reaction mixture was further refluxed for 6 h at 110°C. The nanocomposite films were cast in petri dishes at 80°C for 24 h under vacuum (Figure 1). Table 1 shows sample code and composition of the prepared materials. FTIR: 3211 and 1582 cm−1 (N–H stretch and bend), 2980 cm−1 (C–H stretch), 1406 cm−1 (CH2 wagging), 1188 cm−1 (C–O–C stretch), 842 cm−1 (C–S stretch), 600 cm−1 (–C–F– wagging).
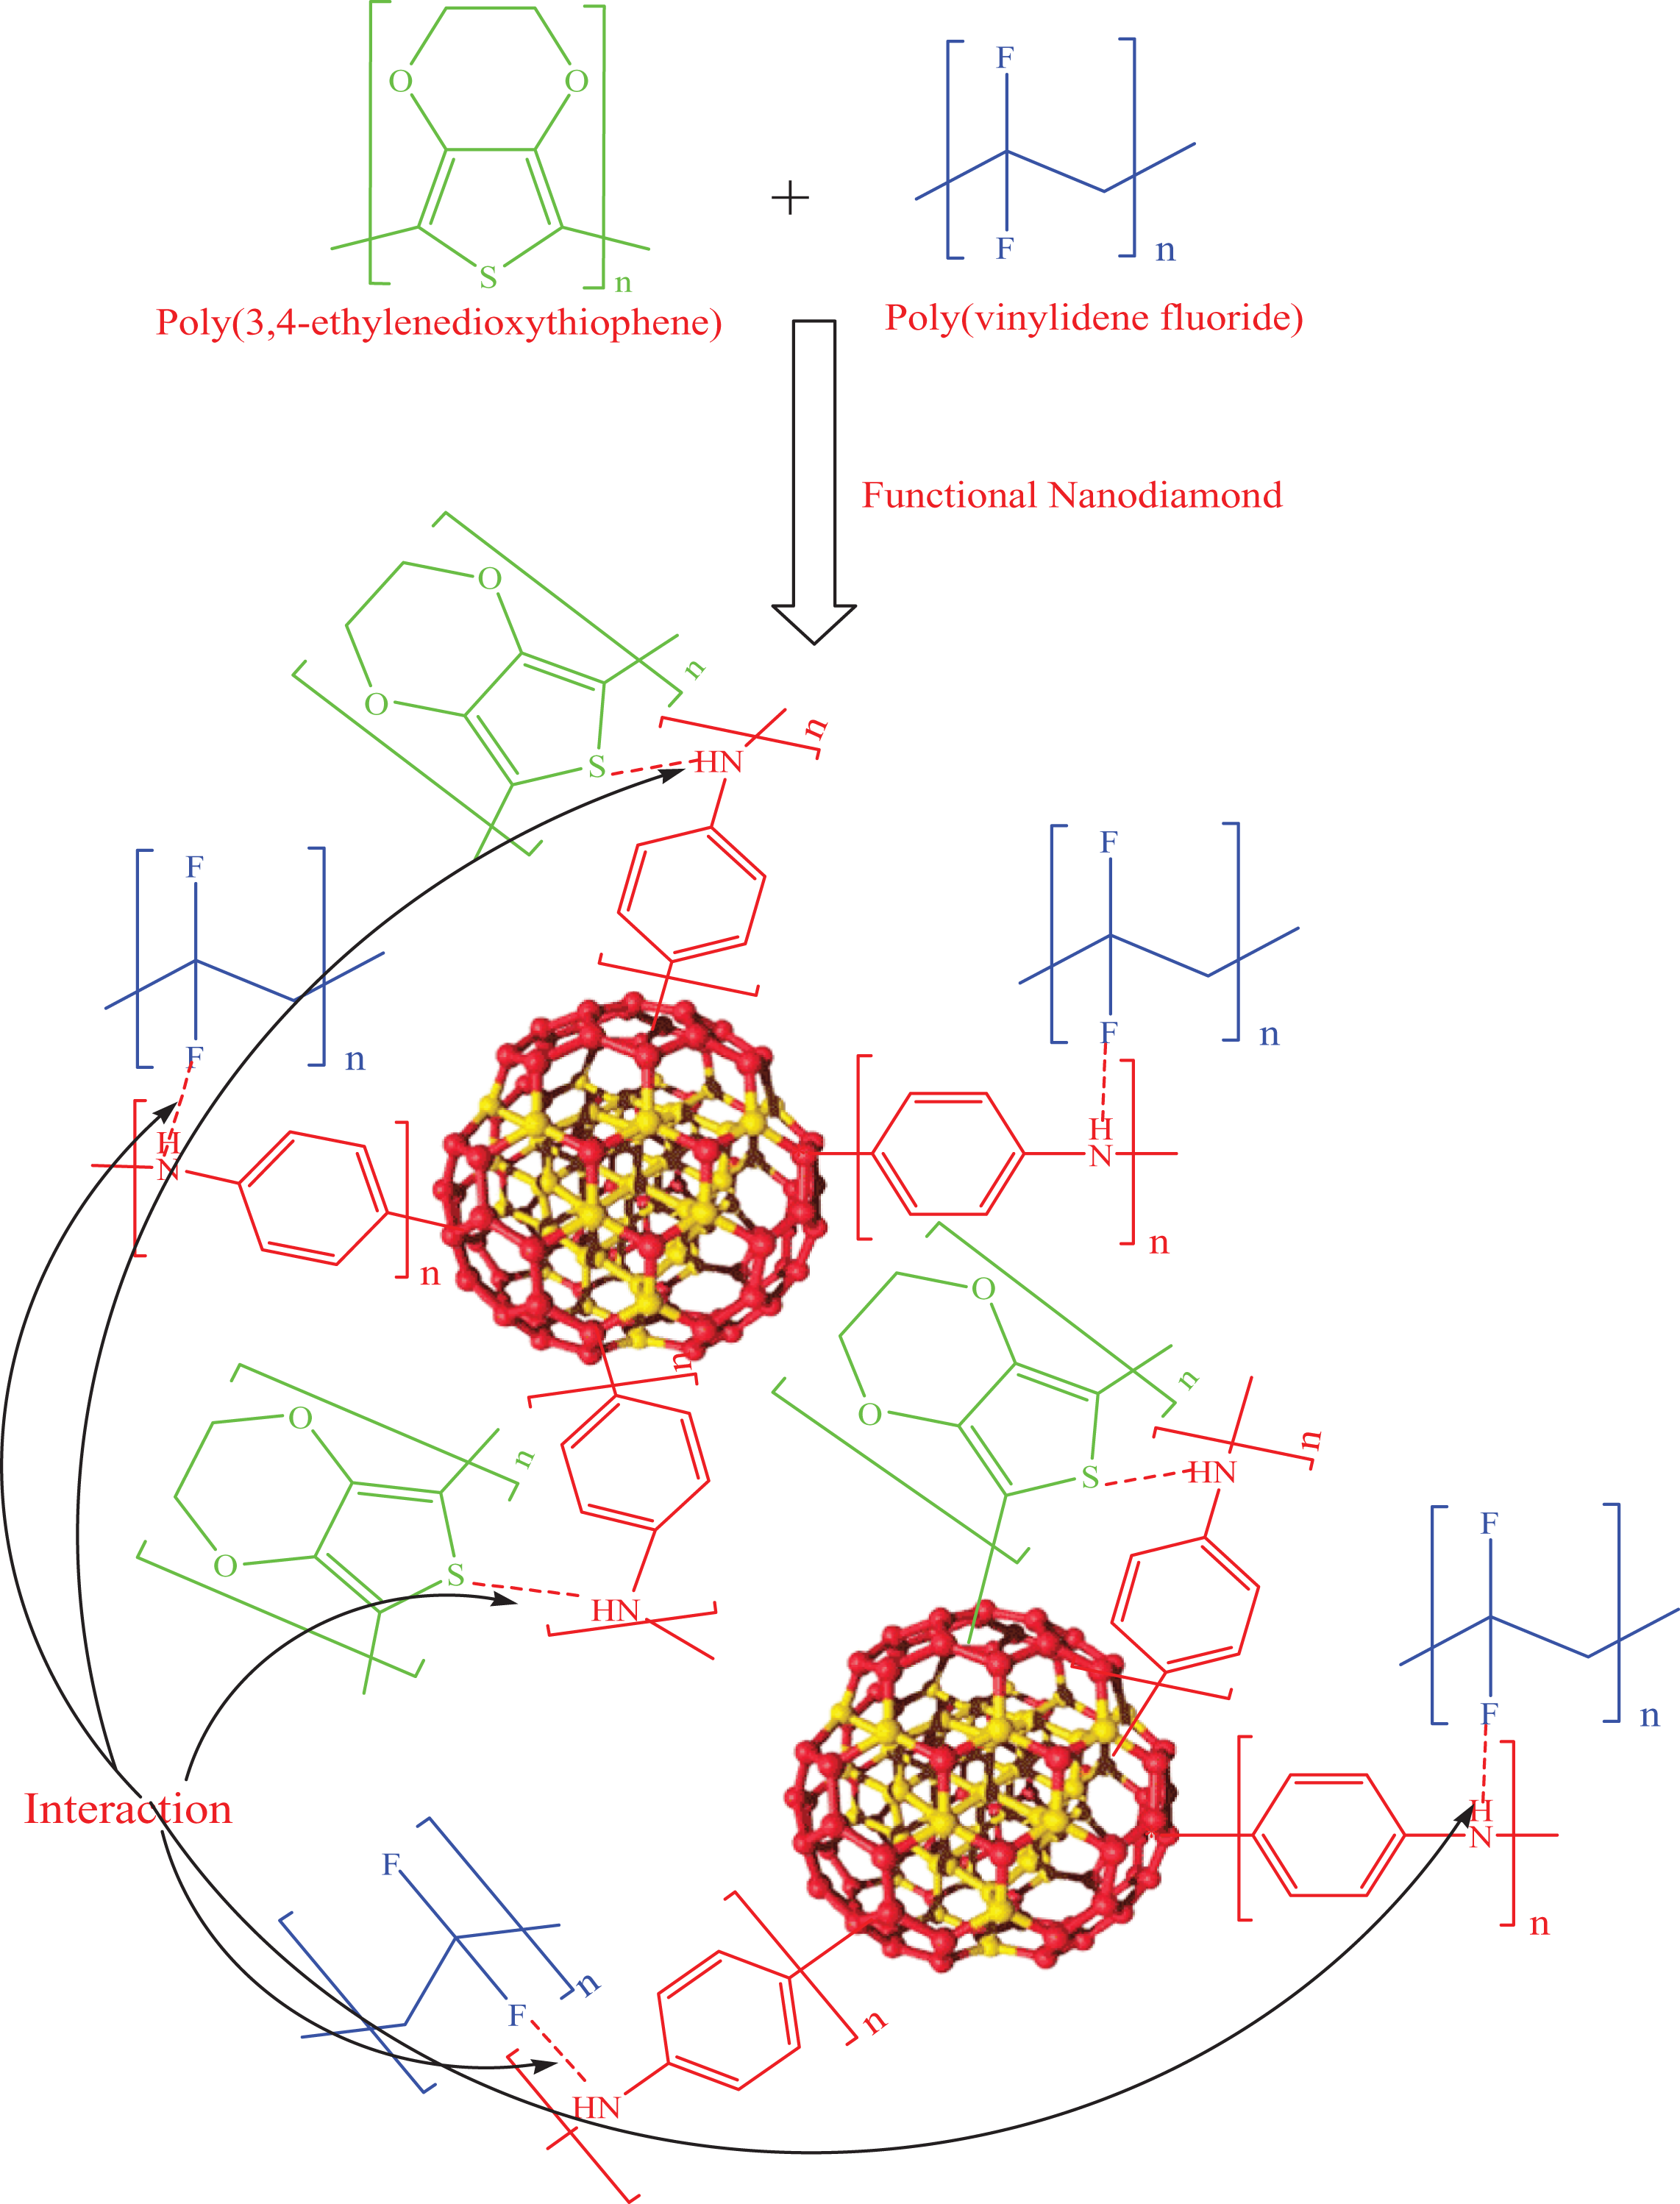
Schematic for PVDF/PEDT/PANI-ND.
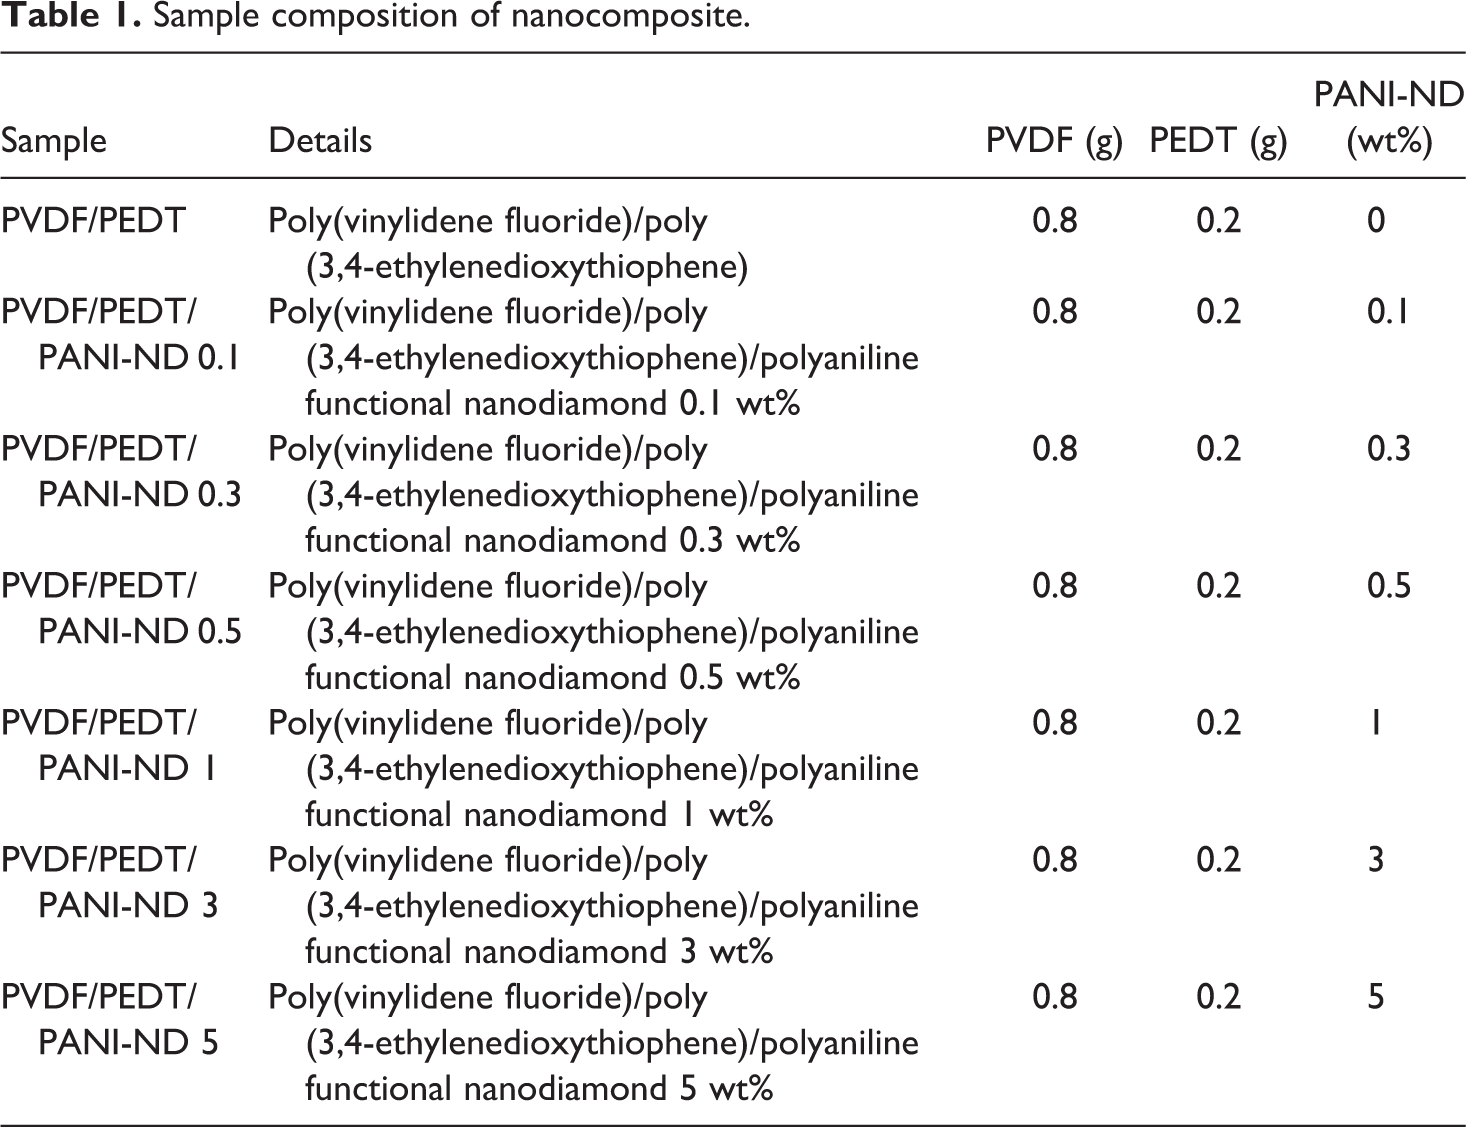
Sample composition of nanocomposite.
Results and discussion
FTIR analysis
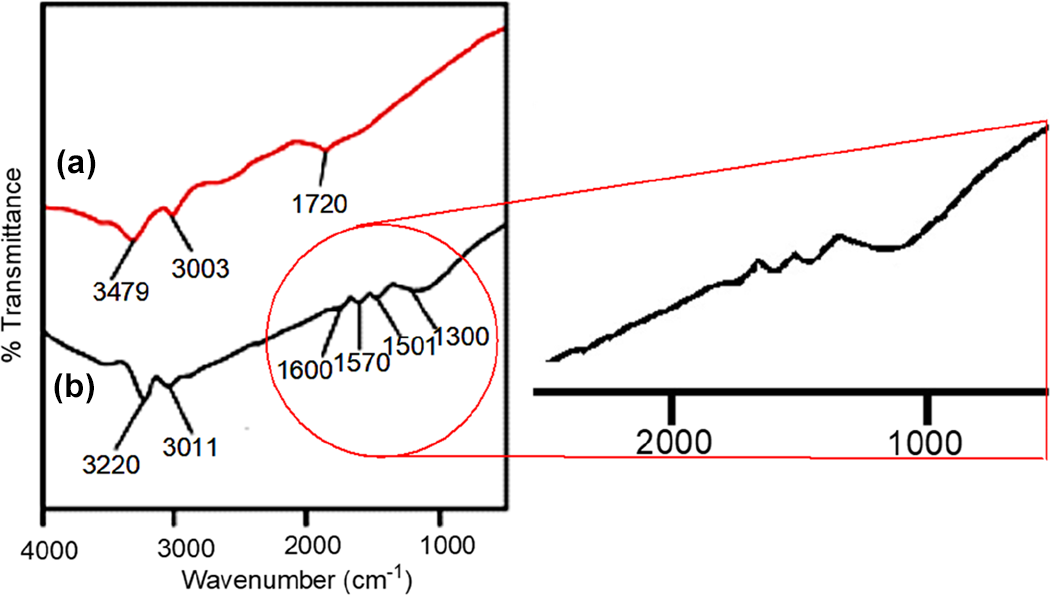
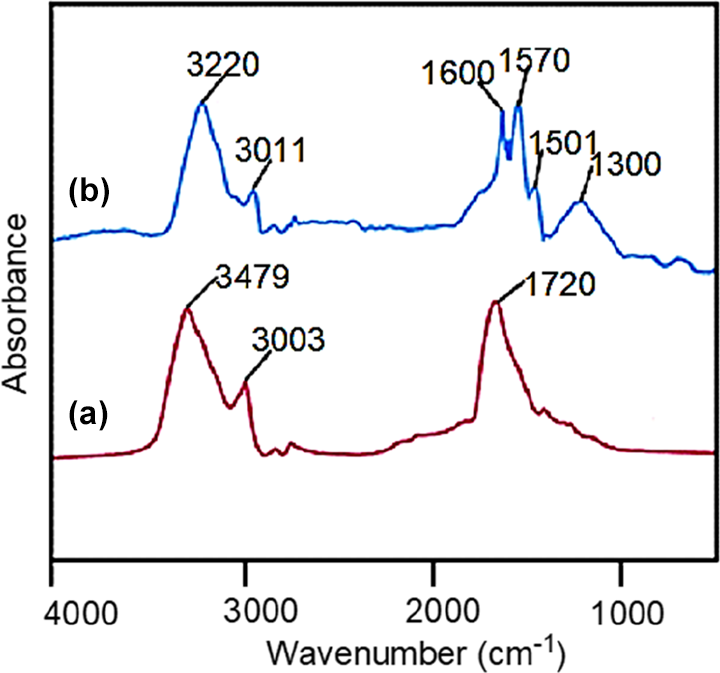
Figure 2 depicts the FTIR spectra of acid-functional and polyaniline functional ND (PANI-ND). The aromatic protons appeared around 3003 cm−1 for acid-functional ND (Figure 2(a)). The hydroxyl and carbonyl groups of carboxylic acid also appeared at 3479 and 1720 cm−1, respectively. 24 For PANI-ND, aromatic C–H stretching vibration appeared at 3011 cm−1, while secondary amine stretching vibration appeared at 3220 cm−1 (Figure 2(b)). Appearance of C–N stretching vibrations of benzenoid ring were found at 1300 and 1501 cm−1. Moreover, C=N stretching of quinoid ring was found at 1570 cm−1. The spectrum also displayed the characteristic peak of C=C stretching vibration around 1600 cm−1. 25 Similar peaks can be observed in ATR of functional ND (Figure 3). Figure 4 shows the FTIR spectrum of PVDF/PEDT blend and nanocomposite. Figure 4(a) reveals characteristics peaks of PVDF. The CH2 asymmetric and symmetric vibrations of PVDF were located at 3015 and 2980 cm−1 in the spectrum. The absorption peak at 1403 cm−1 was attributed to CH2 wagging vibration. The peak at 790 cm−1 was assigned to CF3 stretching vibration. Moreover, –C–F– wagging vibration was observed at 610 cm−1. The PEDT also showed thiophene ring stretching vibrations (C–C/C=C) at 1330 and 1520 cm−1. The C–O–C stretch was also found at 1197 cm−1. Moreover, C–S stretching vibration was observed at 850 cm−1. Figure 4(b) shows PVDF/PEDT/PANI-ND spectrum. Owing to hydrogen bonding interaction between functional ND and polymers, N–H stretching and bending vibrations appeared at lower wavenumbers 3211 and 1582 cm−1, respectively. 26 These interactions also lowered the –C–F– wagging vibration to 600 cm−1. The C–S stretching vibration was also lowered to 842 cm−1. In addition, the C–H vibrations appeared at 2980 cm−1 in the spectrum. Thus, the development of hydrogen bonding between the functional ND and polymers was inveterated using FTIR analysis. To further confirm the appearance of functional groups and structure, ATR spectra of PVDF/PEDT blend and PVDF/PEDT/PANI-ND nanocomposite have been scanned (Figure 5). Peaks having similar frequencies have been observed in attenuated total reflection (ATR) spectra.
FTIR spectra of (a) acid-functional nanodiamond and (b) PANI-ND. PANI-ND: polyaniline-functional nanodiamond; FTIR: Fourier transform infrared.
ATR spectra of (a) acid-functional ND and (b) PANI-ND.
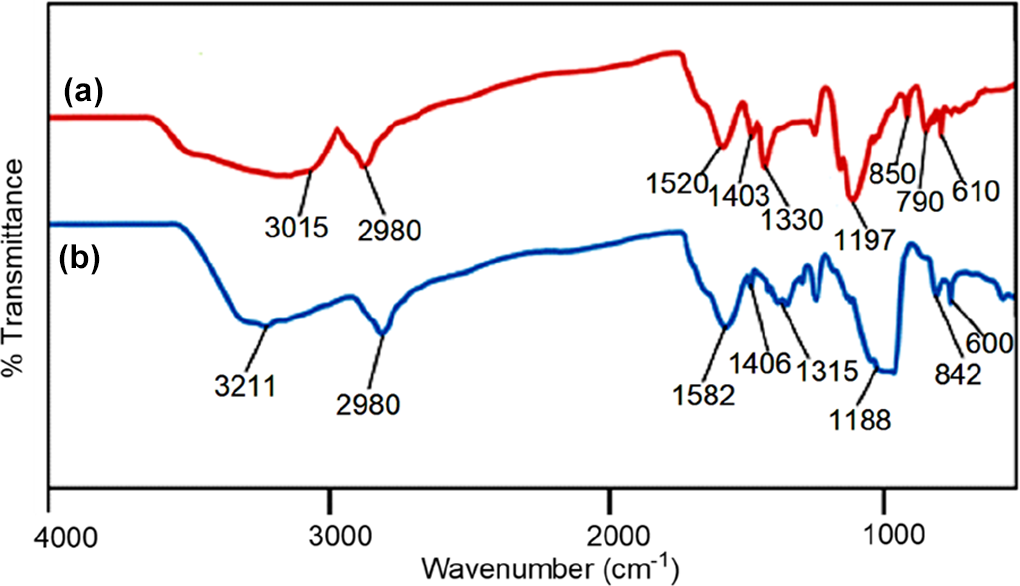
FTIR spectra of (a) PVDF/PEDT and (b) PVDF/PEDT/PANI-ND.
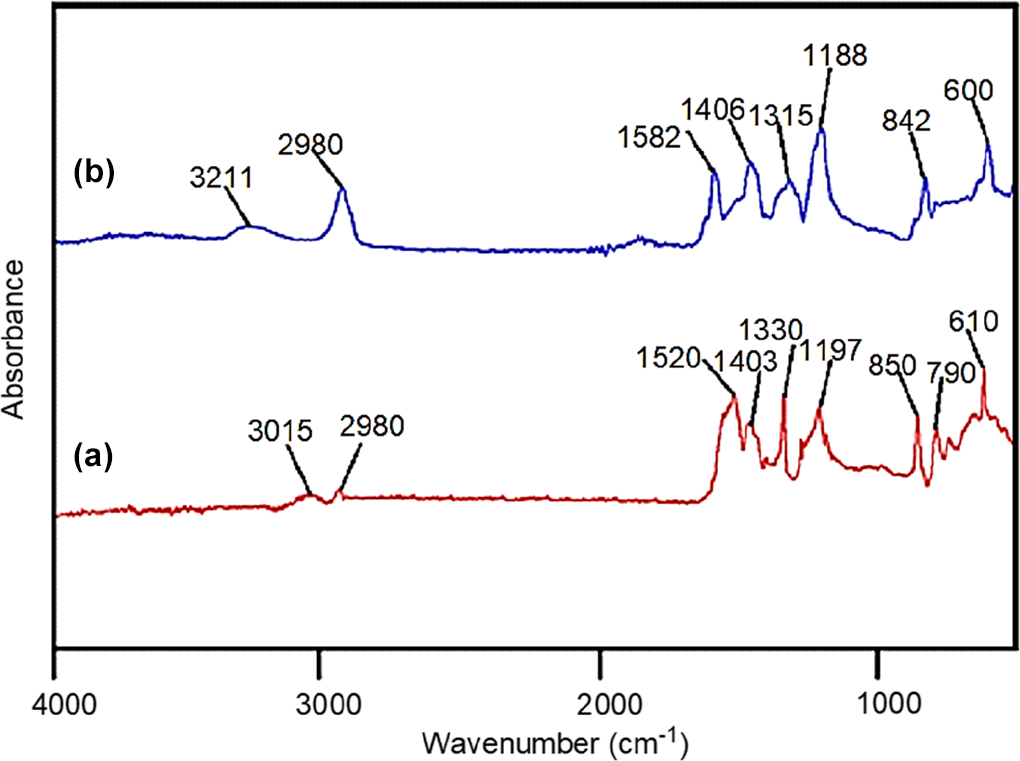
ATR spectra of (a) PVDF/PEDT and (b) PVDF/PEDT/PANI-ND.
Microstructure study
FESEM was used to study the microstructure of blend and nanocomposite. The morphology of the as-prepared neat PVDF/PEDT revealed typical blend morphology with irregular polymer globules (Figure 6(a)). Inclusion of 0.5 wt% nanofiller did not alter the morphology of PVDF/PEDT/PANI-ND 0.5 (Figure 6(b)). However, the inclusion of 1 wt% and higher functional ND content caused significant change in morphology (Figure 6(c) to (e)). A unique morphology of consistently dispersed spherical beads was observed. The spherical beads of polymer-coated ND were interlinked through polymeric arches in the matrix (Figure 6(e)). By comparing the micrographs of PVDF/PEDT/PANI-ND 1–3 nanocomposite, increasing nanofiller content seemed to cause densely dispersed beaded network. The unique morphology can be attributed to (i) PANI functional nanocarbon, (ii) optimum nanofiller content, and (iii) physical interaction in matrix–nanofiller. 27 Most importantly, interaction between the functional nanoparticle and matrix may lead to exceptional morphology. In this case, hydrogen bonding between PVDF/PEDT matrix and PANI-ND has resulted in the interlinked bead-like pattern (Figure 1). 28 Moreover, interaction between functional ND and matrix develops at optimum nanofiller loading (in this case 1 wt%). Below the optimum nanofiller concentration, the amount of nanoparticles may not be sufficient to form bonding with the matrix. To further investigate ND dispersion in the matrix and morphology of nanocomposite, TEM analysis was performed (Figure 7(a) to (d)). Figure 7(a) reveals the morphology of pristine ND. Small aggregated ND nanoparticles can be seen in the micrograph. Micrographs of nanocomposite with 1 and 5 wt% PANI-ND revealed spherical nanoparticles clearly dispersed in the matrix. The difference between the dispersion of pristine and modified ND is evident. Moreover, FESEM shows relatively larger polymer-coated particles; however, individual ND nanoparticles cannot be observed in FESEM micrographs. The individually dispersed nanoparticles can only be seen in TEM at 50 nm.
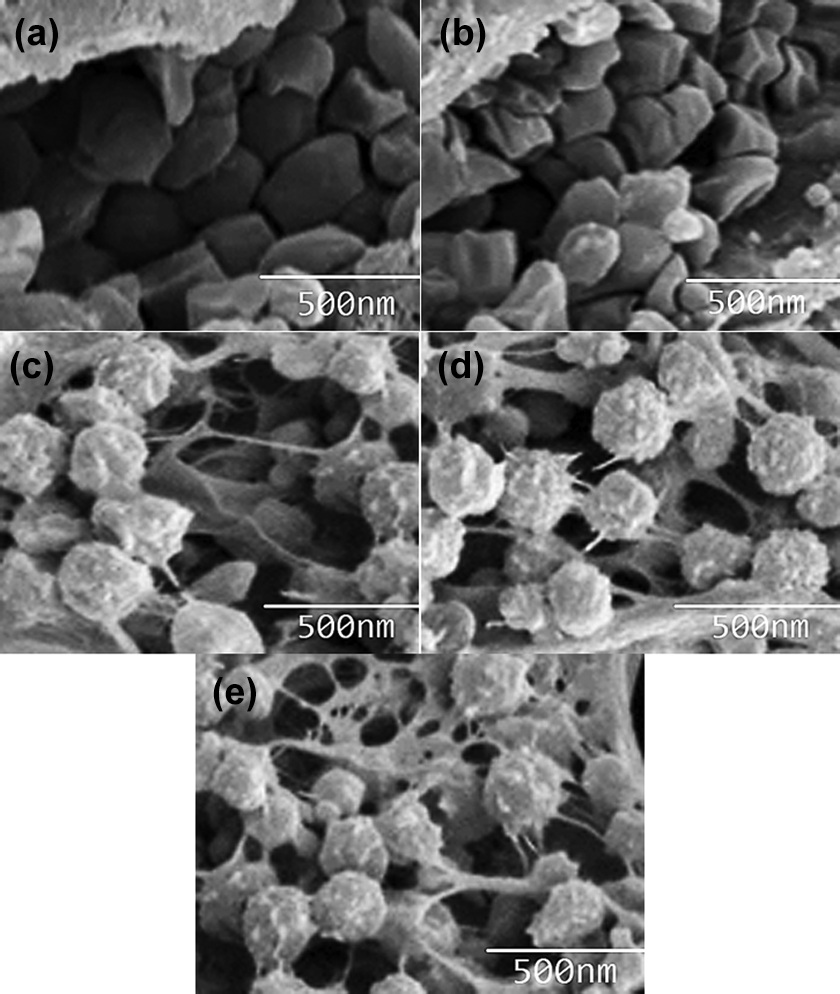
FESEM micrographs of (a) PVDF/PEDT (b) PVDF/PEDT/PANI-ND 0.5; (c) PVDF/PEDT/PANI-ND 1; (d) PVDF/PEDT/PANI-ND 3; and (e) PVDF/PEDT/PANI-ND 5 foam.
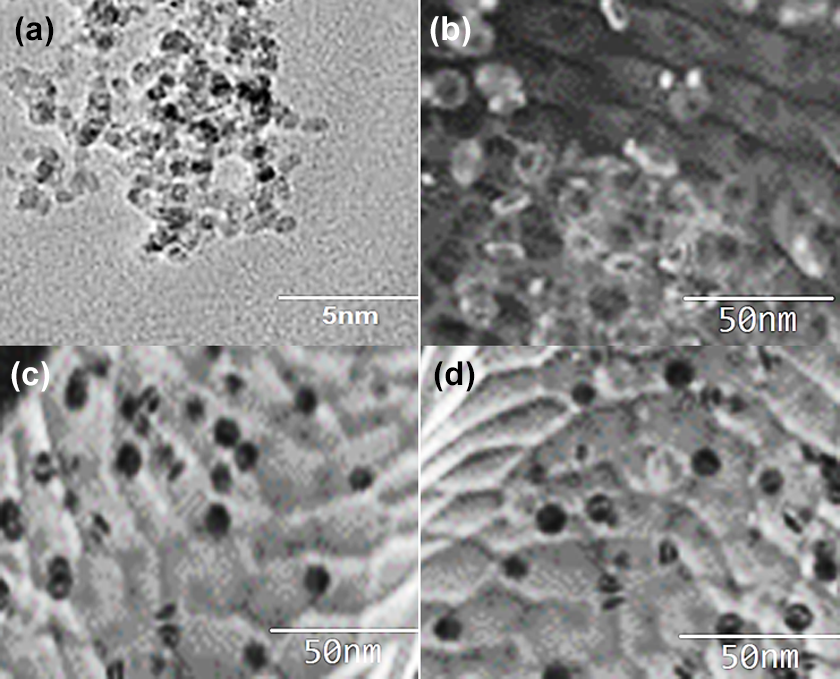
TEM micrographs (a) ND; (b) PVDF/PEDT/PANI-ND 0.5; (C) PVDF/PEDT/PANI-ND 1; (D) PVDF/PEDT/PANI-ND 5.
Mechanical property study
Table 2 shows tensile stress, Young’s modulus, and elongation at break of pristine blend and PVDF/PEDT/PANI-ND. In the nanocomposite series, tensile strength and Young’s modulus were found to increase with nanofiller loading, though elongation at break was found to decrease. Tensile stress for neat PVDF/PEDT blend was found to be 44.2 MPa. Tensile stress of PVDF/PEDT/PANI-ND 0.1 nanocomposite was slightly increased to 45.1 MPa. Tensile stress was increased from 49.3 MPa to 57.7 MPa with the addition of 0.3–3 wt% nanofiller. The highest value for tensile stress was attained with 5 wt% nanofiller content (61.5 MPa). In this way, the tensile stress of PVDF/PEDT/PANI-ND 5 was 22% higher than the pristine blend. The stress–strain curves of blend and nanocomposite are given in Figure 8. Similar increasing trend was observed for Young’s modulus of these nanocomposite. Inclusion of 5 wt% functional nanofiller enhanced the Young’s modulus to 152.7 GPa, that is, 87% higher than the pristine blend (20.2 GPa). Elongation at break of pristine blend was 23%. As expected, nanofiller inclusion from 0.3 wt% to 5 wt% decreased the property from 22.1% to 17.2%. The tensile results showed that the functional ND acted as strong reinforcing agent for PVDF/PEDT matrix. The mechanical property trend pointed to fine nanofiller dispersion and interaction with the blend matrix. Consequently, the mechanical profile depicted high-performance nanomaterials to be employed in technical applications such as battery electrodes.
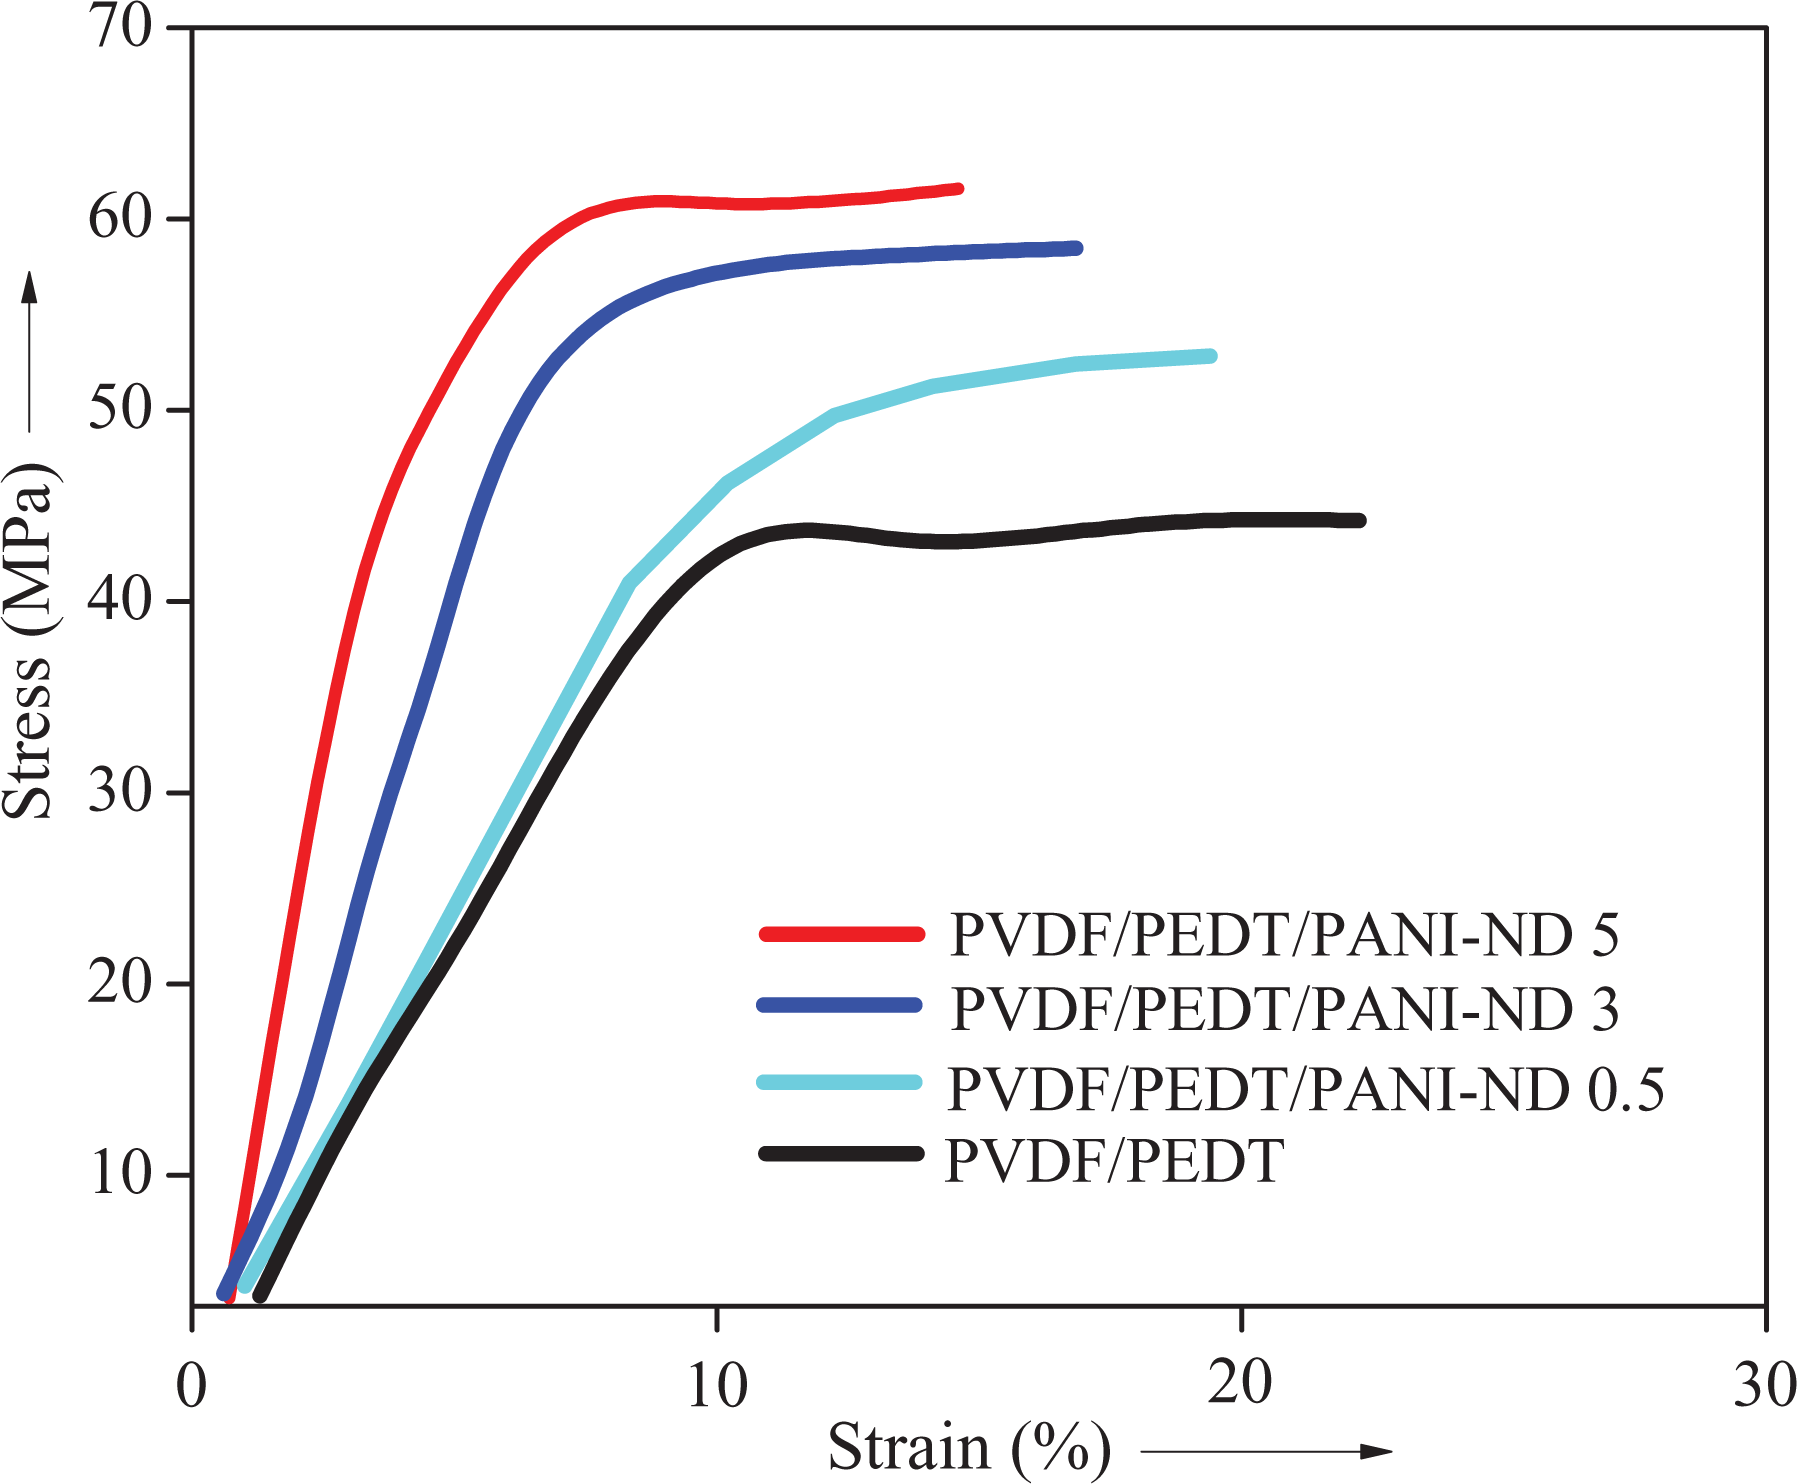
Tensile plots of PVDF/PEDT and PVDF/PEDT/PANI-ND nanocomposite.
Tensile strength, strain, and Young’s modulus of PVDF/PEDT and PVDF/PEDT/PANI-ND nanocomposite.
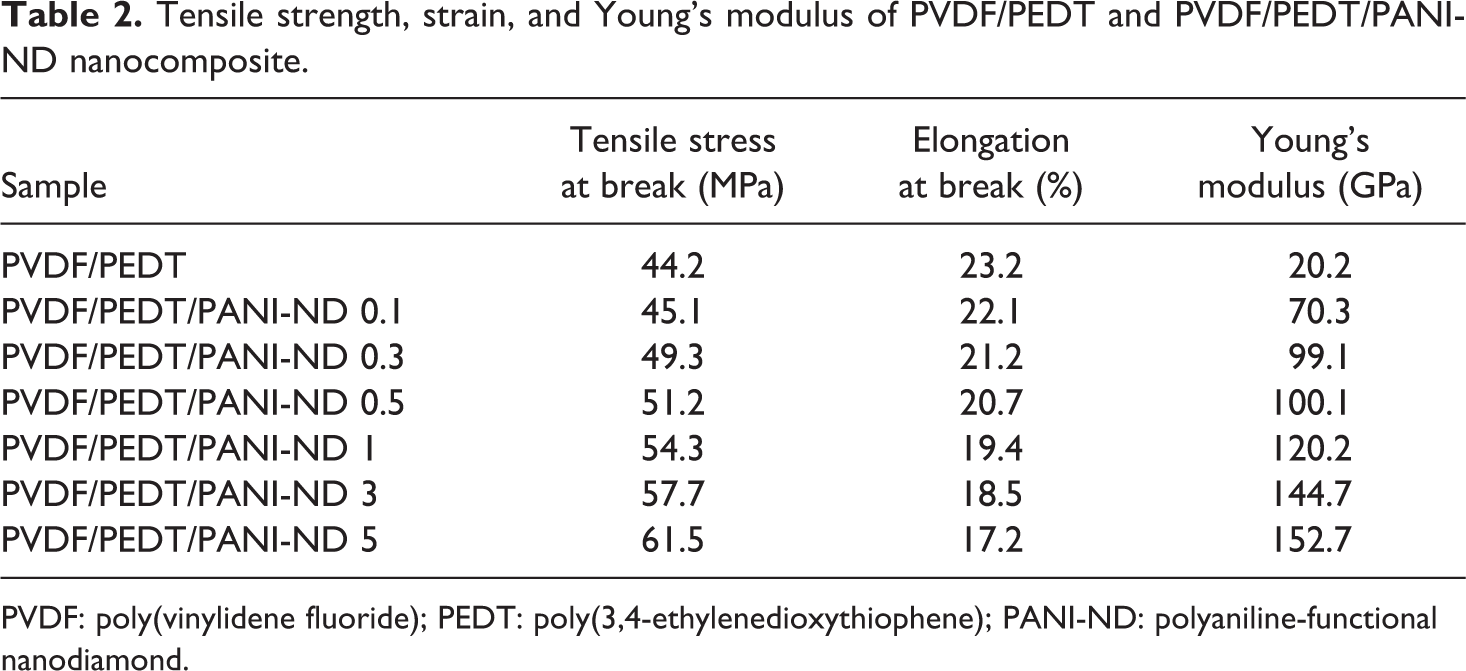
PVDF: poly(vinylidene fluoride); PEDT: poly(3,4-ethylenedioxythiophene); PANI-ND: polyaniline-functional nanodiamond.
Thermogravimetric measurements
Thermal data assimilated from thermogravimetric analysis of PVDF/PEDT blend and PVDF/PEDT/PANI-ND nanocomposite are presented in Table 3. For neat blend, initial weight loss (T 0), 10% degradation temperature (T 10), and maximum decomposition temperature (T max) were observed at 411°C, 421°C, and 466°C, respectively. For PVDF/PEDT/PANI-ND 0.1 nanocomposite with 0.1% nanofiller, slightly higher values of decomposition temperatures were observed (T 0 = 436°C, T 10 = 476°C and T max = 489°C) as shown in Figure 9. The thermal properties were further raised with 0.3 wt% nanofiller loading and reached T 0 of 444°C, T 10 of 478°C, and T max of 499°C for PVDF/PEDT/PANI-ND 0.3 nanocomposite. Increase in thermal stability becomes quite prominent for PVDF/PEDT/PANI-ND 1 (T 0 = 498°C, T 10 = 511°C, and T max = 556°C). Ultimately, the thermal stability of nanocomposite with 5 wt% nanofiller was considerably enhanced. Thus, PVDF/PEDT/PANI-ND 5 sample attained higher values of T 0 = 518°C, T 10 = 555°C and T max = 588°C, respectively. Increase in thermal stability was also depicted in high char yield of nanocomposite series PVDF/PEDT/PANI-ND 0.1–0.5 (48–58%). The increase in thermal stability may be attributed to the reinforcement of functional ND through physical interaction in the matrix forming a stable and robust polymer/nanocarbon framework. 29
Thermal analyses of PVDF/PEDT and PVDF/PEDT/PANI-ND nanocomposite.
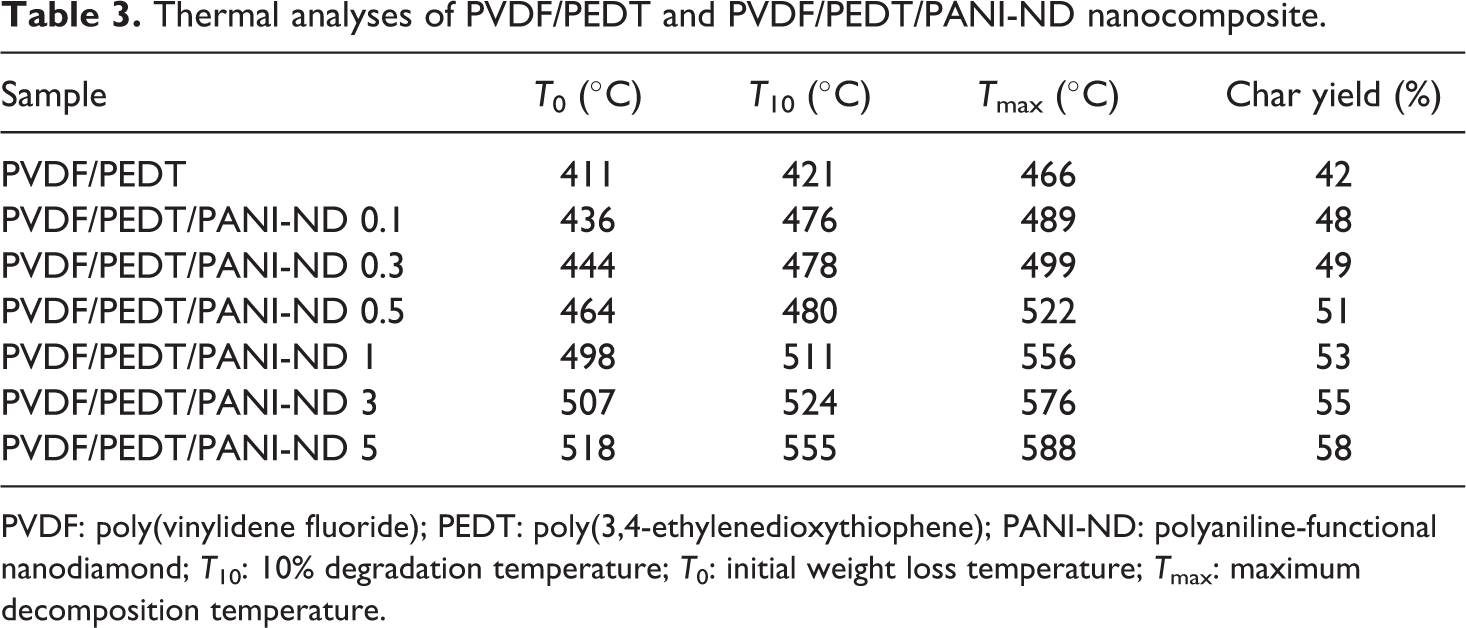
PVDF: poly(vinylidene fluoride); PEDT: poly(3,4-ethylenedioxythiophene); PANI-ND: polyaniline-functional nanodiamond; T 10: 10% degradation temperature; T 0: initial weight loss temperature; T max: maximum decomposition temperature.
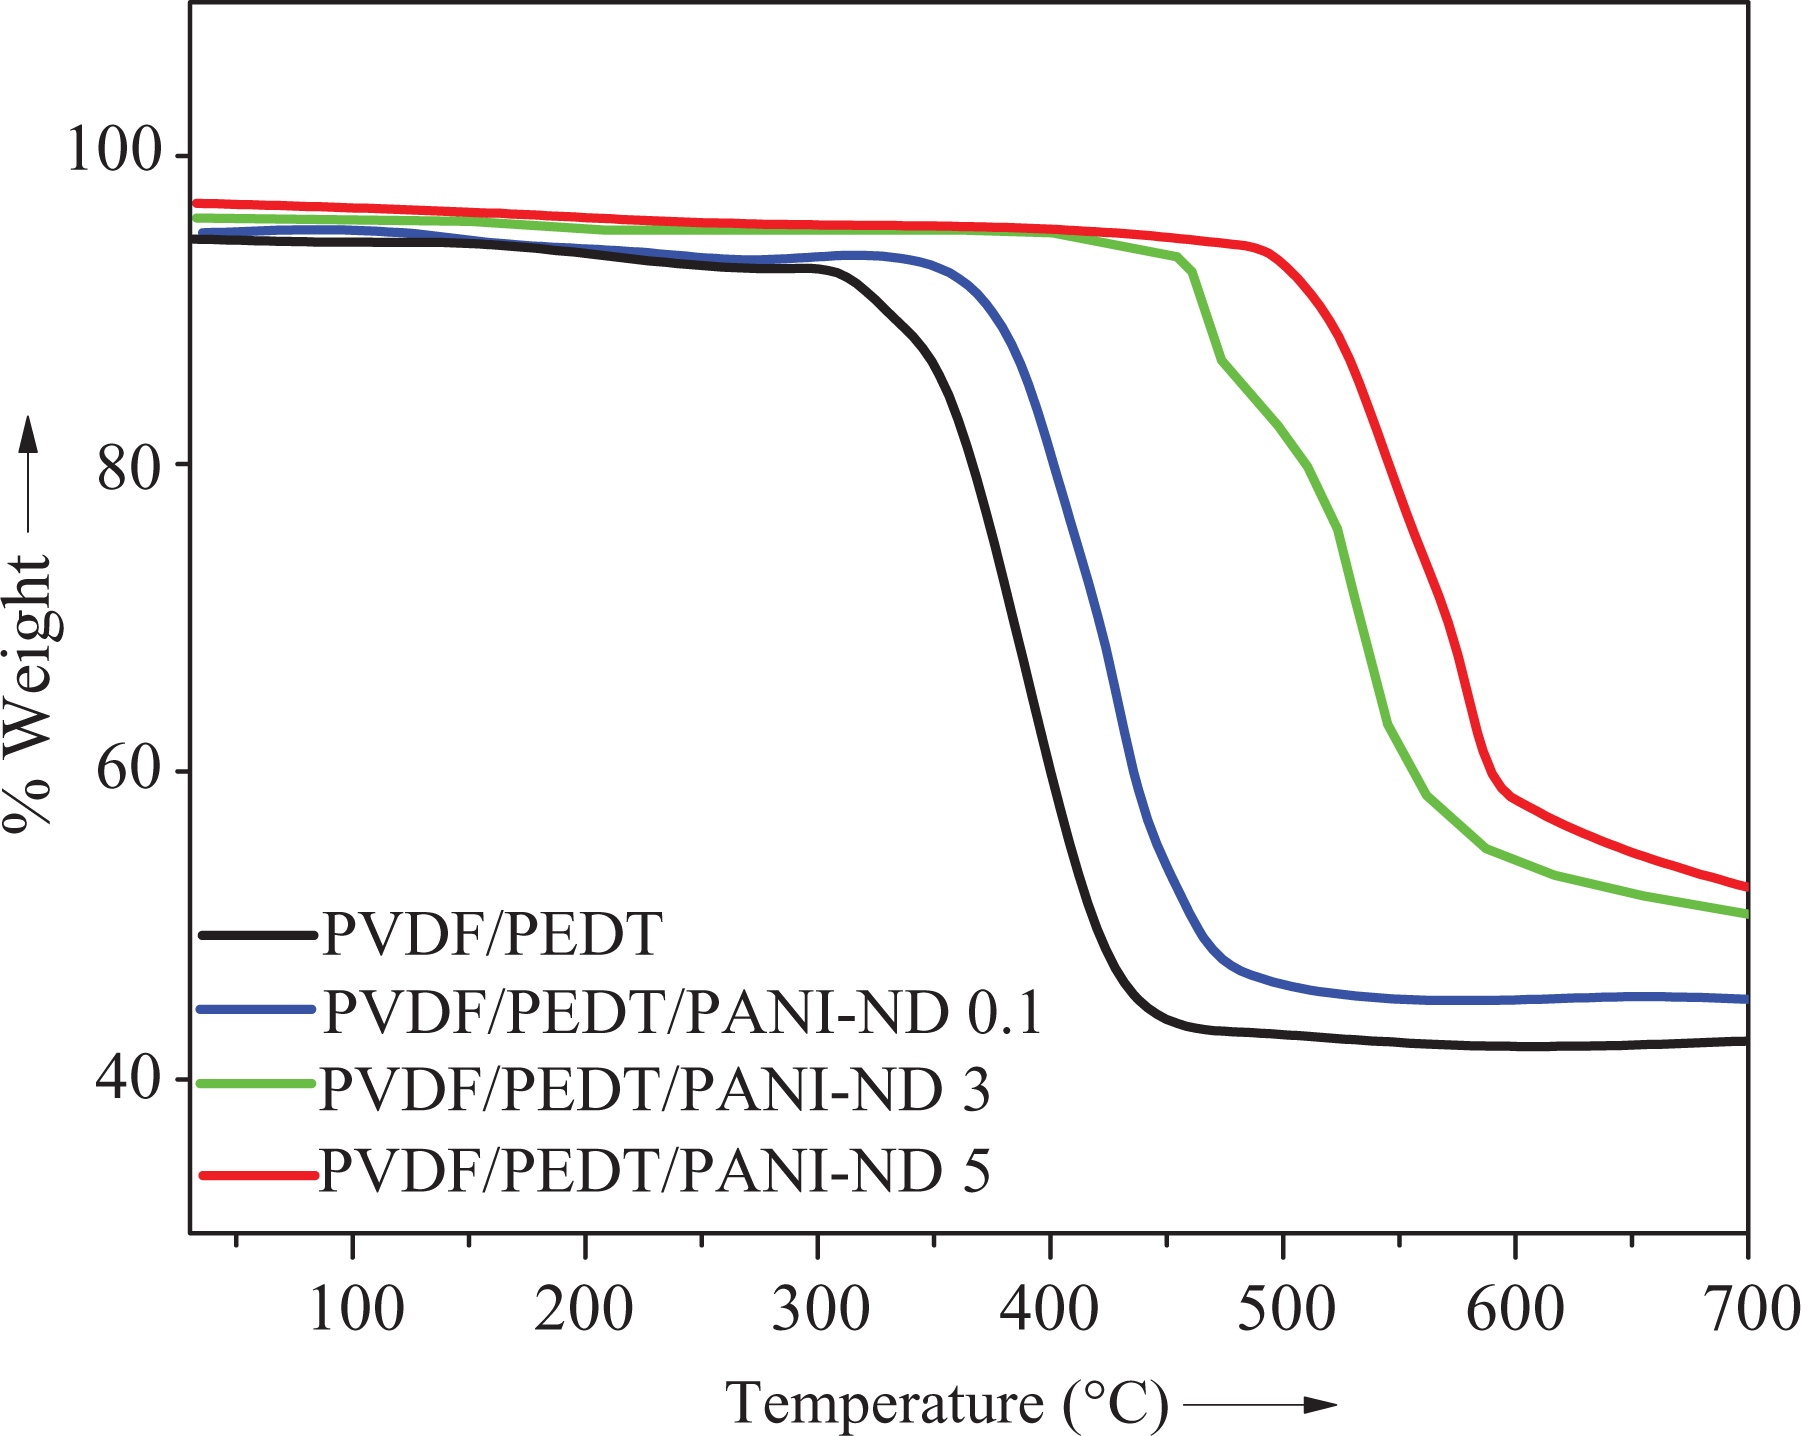
TGA curves of PVDF/PEDT and PVDF/PEDT/PANI-ND nanocomposite at 10°C min−1 (N2).
Electrical conductivity measurement
Table 4 shows variation in electrical conductivity of nanocomposite with varying functional ND at room temperature, 80°C and 100°C. Figure 10 depicts change in electrical conductivity as a function of nanofiller content in PVDF/PEDT/PANI-ND at room temperature. Neat blend had low electrical conductivity of 10−3 S cm−1 at room temperature. Inclusion of 0.1 wt% nanofiller improved the electrical conductivity to 10−1 S cm−1. Further PANI-ND addition from 0.3–3.0 wt% upgraded the electrical properties from 0.5 S cm−1 to 1.7 S cm−1 at room temperature. The highest electrical conductivity at room temperature was attained for PVDF/PEDT/PANI-ND 5 (2.1 S cm−1). At 80°C, the electrical conductivity of all nanocomposites was increased, and the maximum value was attained for PVDF/PEDT/PANI-ND 5 (2.5 S cm−1). Similarly, the electrical conductivity of blend and nanocomposites was further enhanced at 100°C. The electrical conductivity of PVDF/PEDT/PANI-ND 5 was 3.0 S cm−1 at 100°C. Thus, there was 99.9% increase in the property at room temperature and 77% enhancement at 100°C, relative to the neat blend. The results suggested that the inclusion of PANI-ND influenced the electrical conductivity of nanocomposite series at all temperatures. The increase in electrical conductivity may be attributed to the formation of conducting percolation network at critical threshold concentration. 25 Thus, homogeneously dispersed ND nanoparticles align to form conducting paths or percolation network in the matrix. The electrical conductivity of nanocomposite greatly changes with increasing the nanofiller content and temperature. At percolation, maximum electrical conductivity of the nanocomposite is achieved. However, after the percolation, incorporation of nanofiller slightly affects the conductivity of the nanocomposites compared with the neat matrix. According to tunneling mechanism, electrons may jump from nanoparticle to nanoparticle across the gaps of the polymeric material. In the PVDF/PEDT/PANI-ND nanocomposite, it seems that the increasing temperature reduced the tunneling gaps in material making the electron-jumping easier. The decrease of the gaps in turn increase the electronic activities due to temperature increase. 30,31
Electrical conductivity of PVDF/PEDT and PVDF/PEDT/PANI-ND nanocomposite.
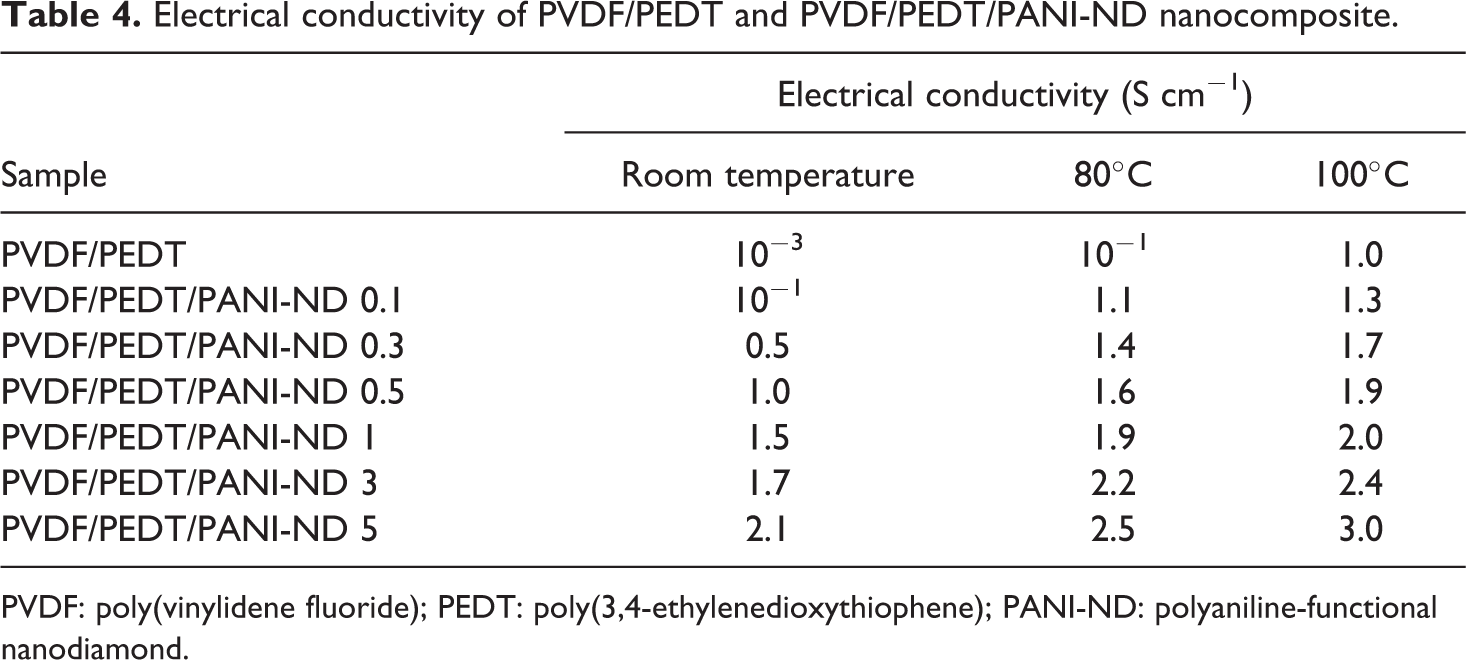
PVDF: poly(vinylidene fluoride); PEDT: poly(3,4-ethylenedioxythiophene); PANI-ND: polyaniline-functional nanodiamond.
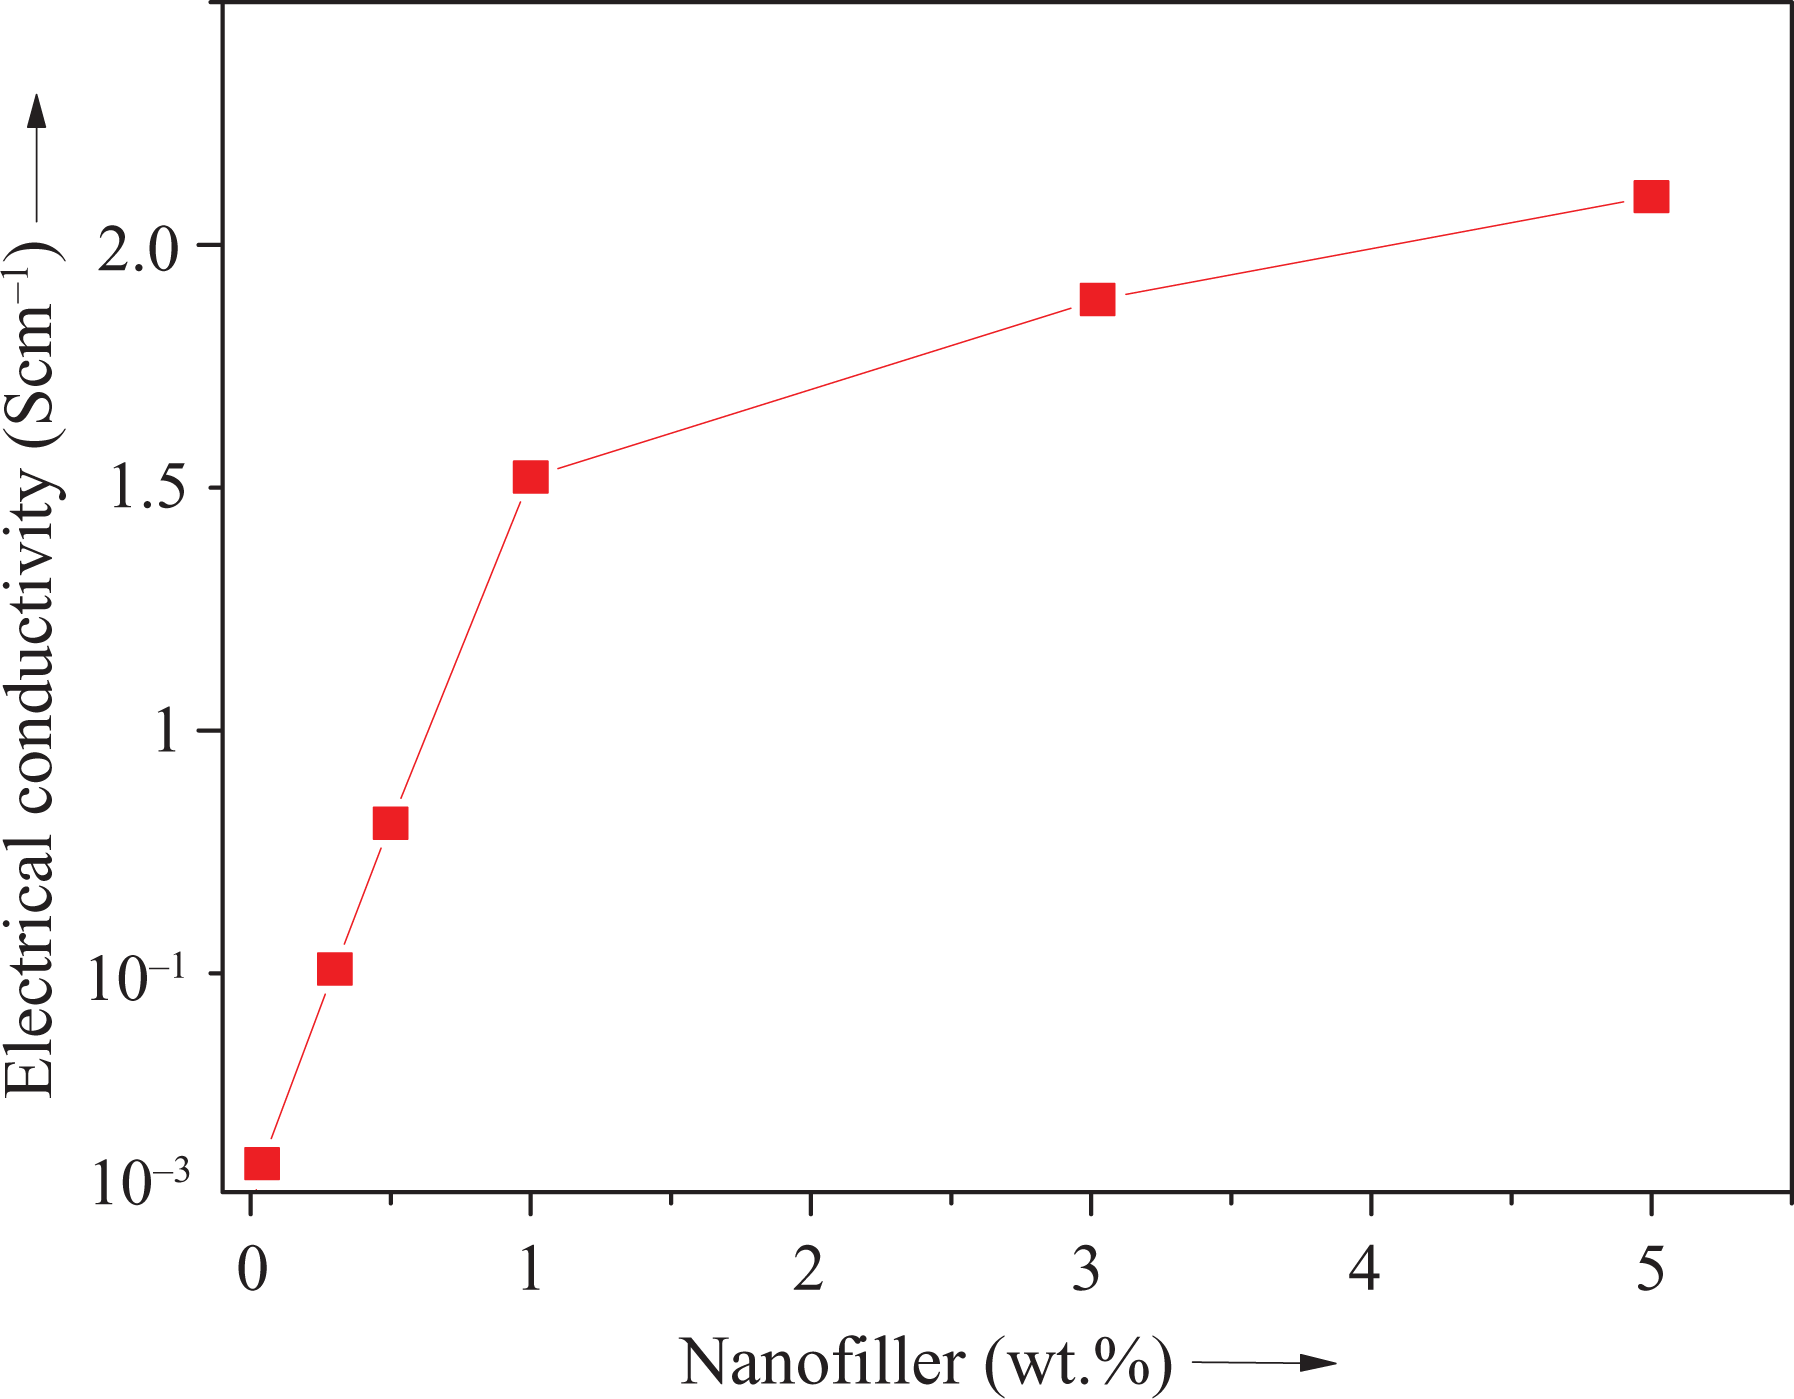
Electrical conductivity of PVDF/PEDT/PANI-ND nanocomposite as a function of nanofiller content (room temperature).
EIS measurements and charge/discharge test
EIS measurements were carried out to understand the electrochemical behavior of PVDF/PEDT/PANI-ND nanocomposite. The Nyquist plots are shown in Figure 11. In the high-frequency region, a semicircle was observed, while a straight line was seen in the low-frequency region. After 300 cycle, the semicircle became slightly wider showing a small change. The results suggested that the agglomeration of ND nanoparticle did not occur during cycling owing to physically bonded structure of matrix–nanofiller. Moreover, interaction between PANI and ND maintained the EIS performance after several cycles. Consequently, stable nanocomposite layer promoted fast and facile Li+ diffusion and electron transfer leading to excellent cycling performance. The charge/discharge test was performed at the current density of 2 A g−1 to monitor the cycling results (Figure 12). The specific capacity of 900 mAh g−1 with 90% of Coulombic efficiency was achieved after 300 cycles. The results showed that PVDF/PEDT/PANI-ND nanocomposite have promising perspectives in Li-ion batteries. 7,15,32
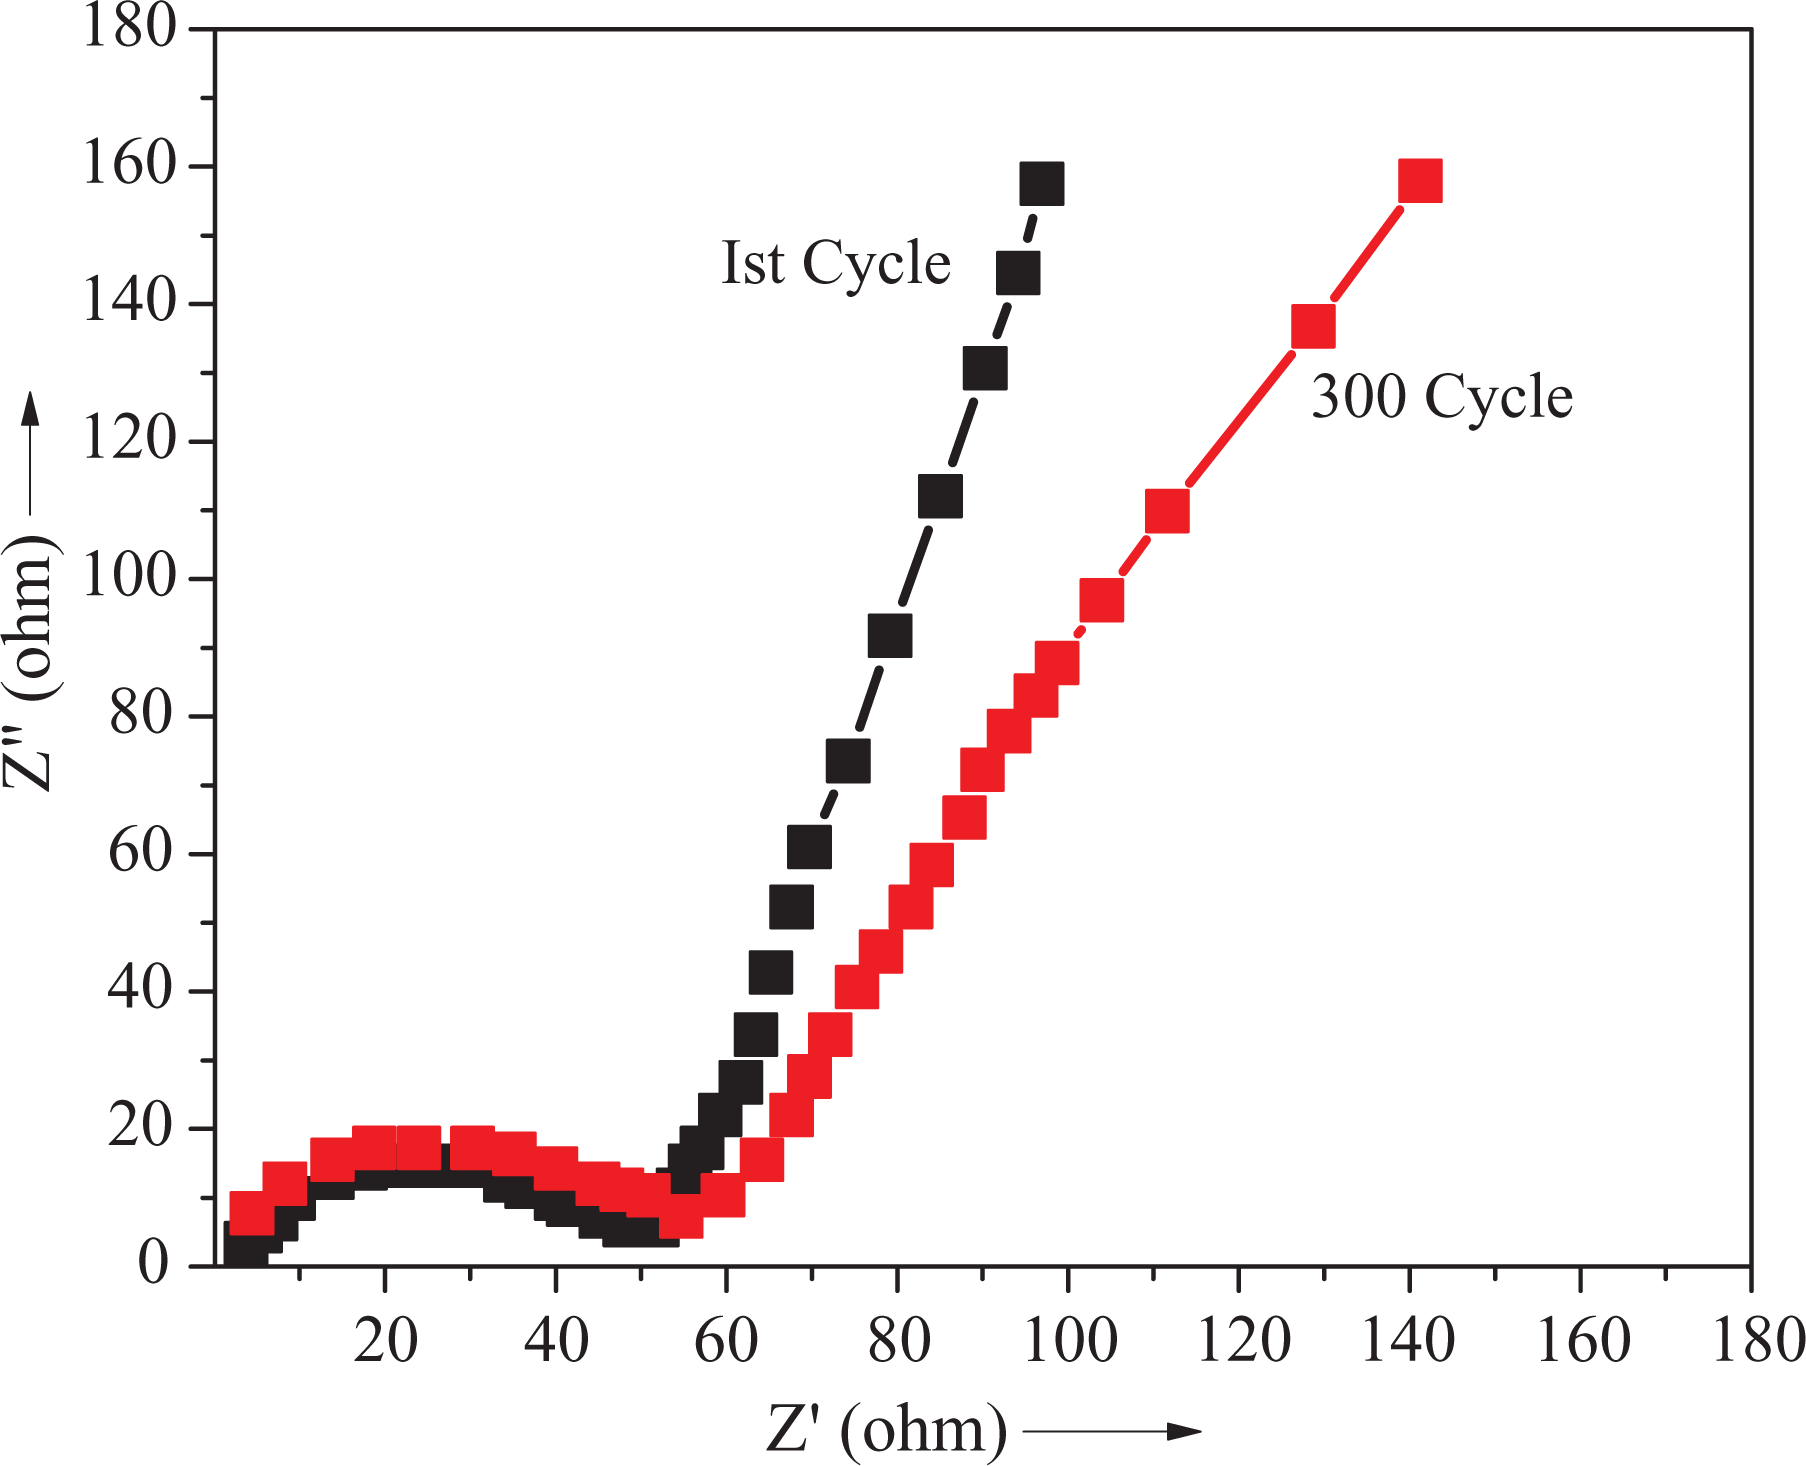
EIS spectroscopy of PVDF/PEDT/PANI-ND 5 nanocomposite before and after 300 cycles.
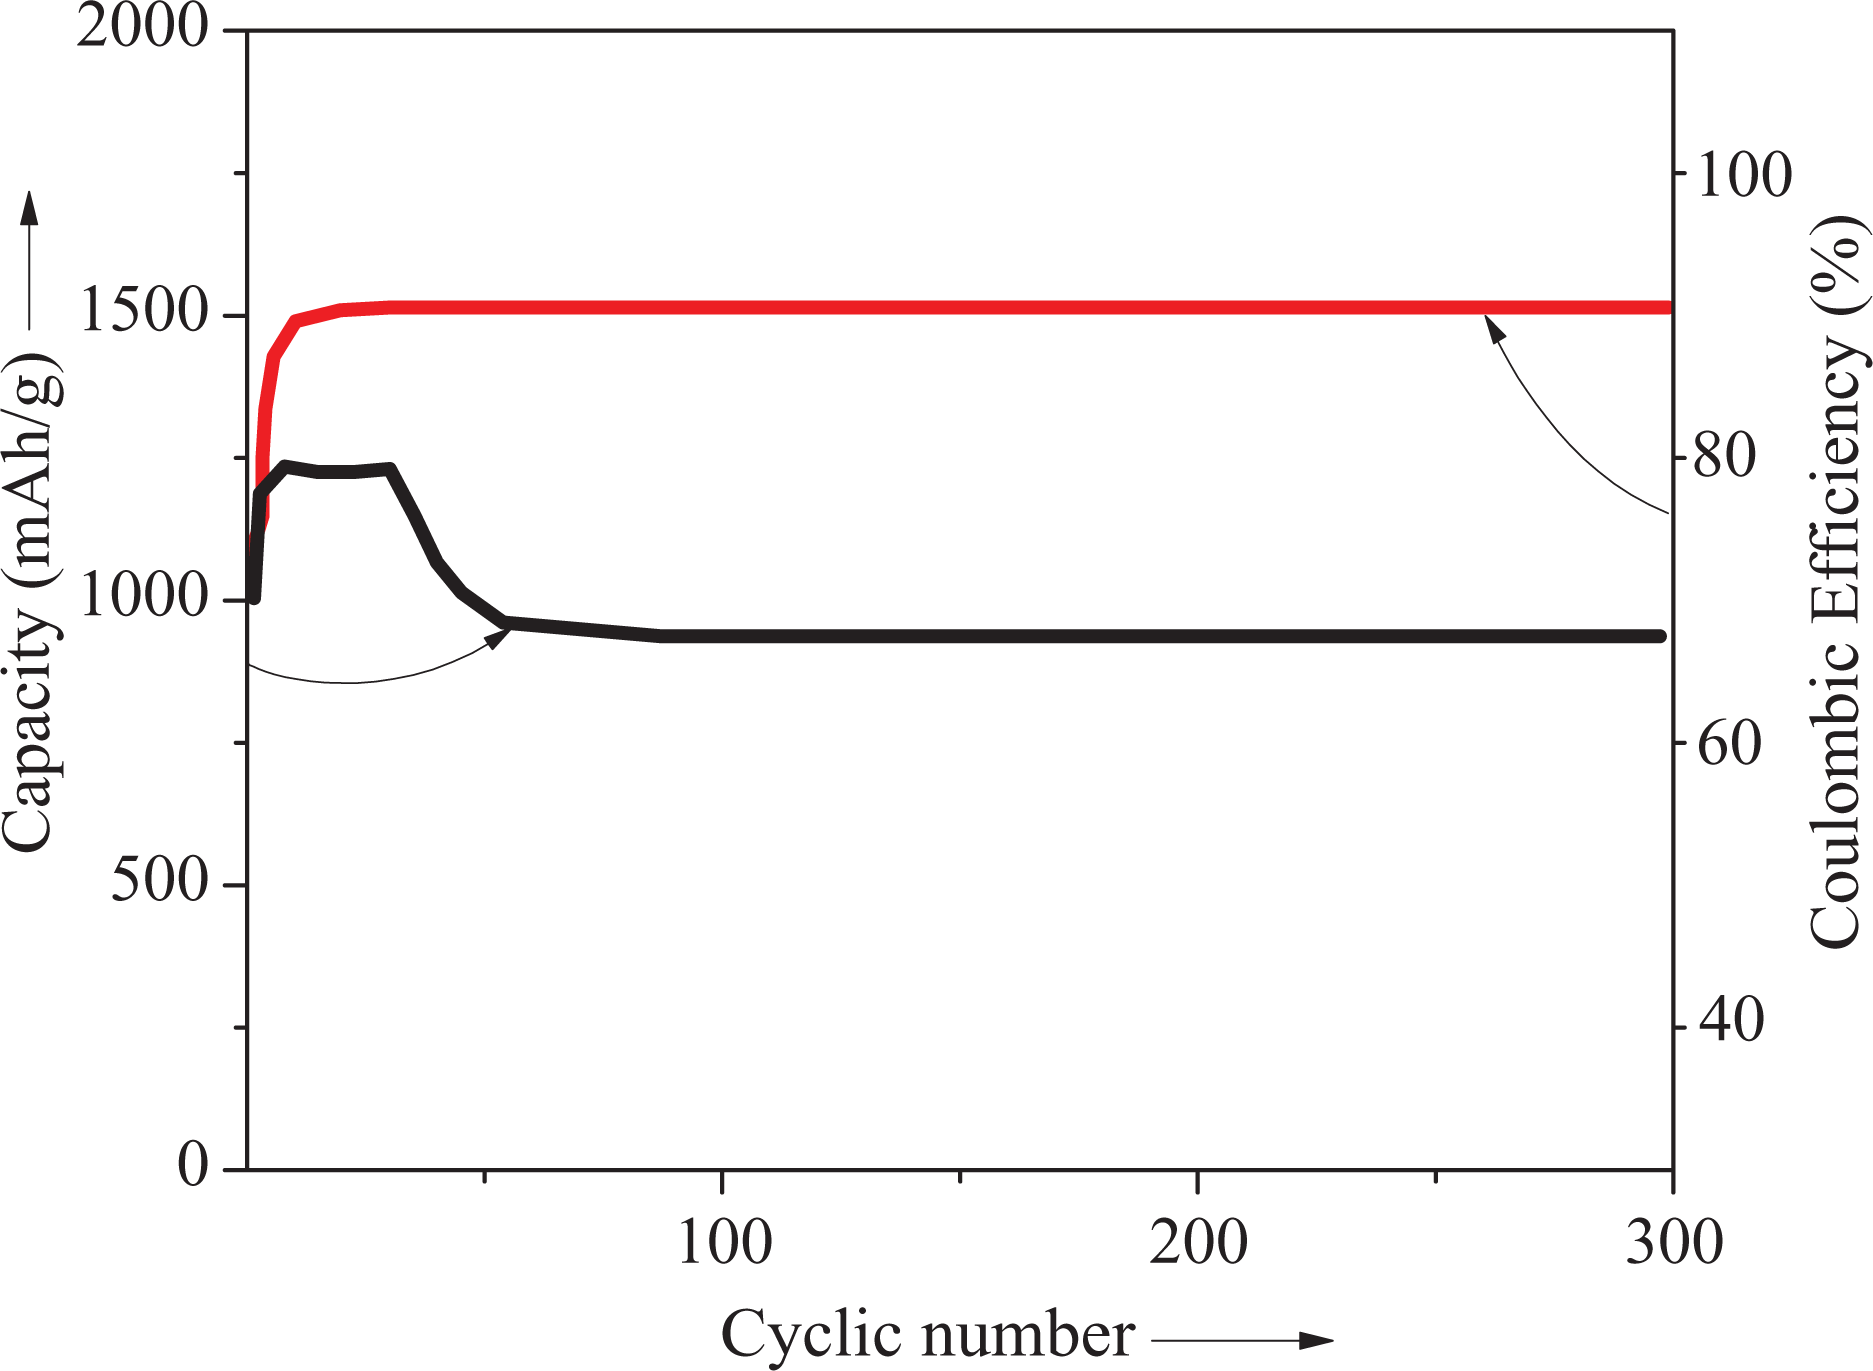
Capacity retention of PVDF/PEDT/PANI-ND 5 nanocomposite at 2 A g−1.
Conclusion
Novel PVDF/PEDT and PANI-ND nanocomposites were fabricated and scrutinized using FTIR, FESEM, TEM, TGA, and mechanical tests. The blend structure and functional nanofiller have been designed cautiously to attain high-performance thermally stable and strengthened nanocomposites. FTIR and microscopic investigations have shown that PANI-ND was successfully integrated in the matrix through physical interaction. Among these materials, 5 wt% nanofiller loading caused superior values for thermal properties, strength, and modulus. Most importantly, incorporation of PANI-ND nanoparticle offered high electrical conductivity, EIS properties, charge/discharge, and cycling performance of the designed nanocomposite electrode. Especially PVDF/PEDT/PANI-ND 5 nanocomposite electrode depict high Coulombic efficiency and specific capacity of 90% and 900 mA h g−1 at 2 A g−1, respectively. Electrochemical performance revealed that the nanocomposite electrode can be successfully employed as anode material in Li-ion batteries.