
Abstract
In this work, multifactor optimization of fused deposition modeling (FDM) process parameters has been reported for in-house prepared feedstock filament comprising of SiC/Al2O3 reinforced in recycled low-density polyethylene (LDPE) matrix with different particle sizes (i.e. single particle size (SPS), double particle size (DPS), and triple particle size (TPS) in different proportions). This study has been conducted on Al2O3-based DPS reinforcement in LDPE, which came out as a better solution during pilot experimentation in comparison to SPS, TPS, and SiC reinforcement, for printing of functional prototypes as rapid tooling (RT). The result of study suggests that infill angle in the FDM process is the most significant process parameter (contributing around 93%) for preparation of RT as regards dimensional accuracy and hardness is concerned. The RT so prepared is thermally stable as evident from differential scanning calorimetry analysis. Further, the photomicrographs observed in different planes suggest that, at the proposed settings, RT has a uniform distribution of reinforcement in LDPE matrix and can be gainfully used in light machining applications.
Introduction
Environmental pollution from synthetic plastics has been recognized as a serious problem in recent years. 1 As a result, processing of plastics from a reusability viewpoint has increased dramatically. 2 Some researchers have investigated the recycling of plastic solid waste (PSW) by deploying metallic powder reinforcements using rapid prototyping. 3 Recycling is the only way to tackle the problem arising from the accumulation of polymer waste, which in turn creates environmental impacts. 4 The literature reveals that plastic waste polymers can be effectively recycled up to a certain degree. Also, significant studies have been reported on the recycling of PSW to enhance reusability of waste polymers. But very little effort has been made to develop metallic-reinforced materials for the fused deposition modeling (FDM) process–based functional prototypes and their process parametric optimization. 5 –7 Some research groups have used FDM for designing bio-restorable scaffolds and highlighted that this technique does not require any solvent. 8,9 The present work is focused on the effect of reinforcement of various combinations of sizes (SPS, DPS, TPS) of Al2O3 and SiC in low-density polyethylene (LDPE) matrix. It should be noted that SPS represents single particle size (of either 300, 400, 500 American Foundry Society (AFS) grade), DPS represents two particle sizes in equal proportion by weight (of a combination of either of two from 300, 400, 500 AFS grade), and TPS represents three particle sizes in equal proportion by weight (of 300, 400, and 500 AFS grade). Table 1 shows different physical properties of LDPE, SiC, and Al2O3.
Physical properties of LDPE, SiC, and Al2O3.
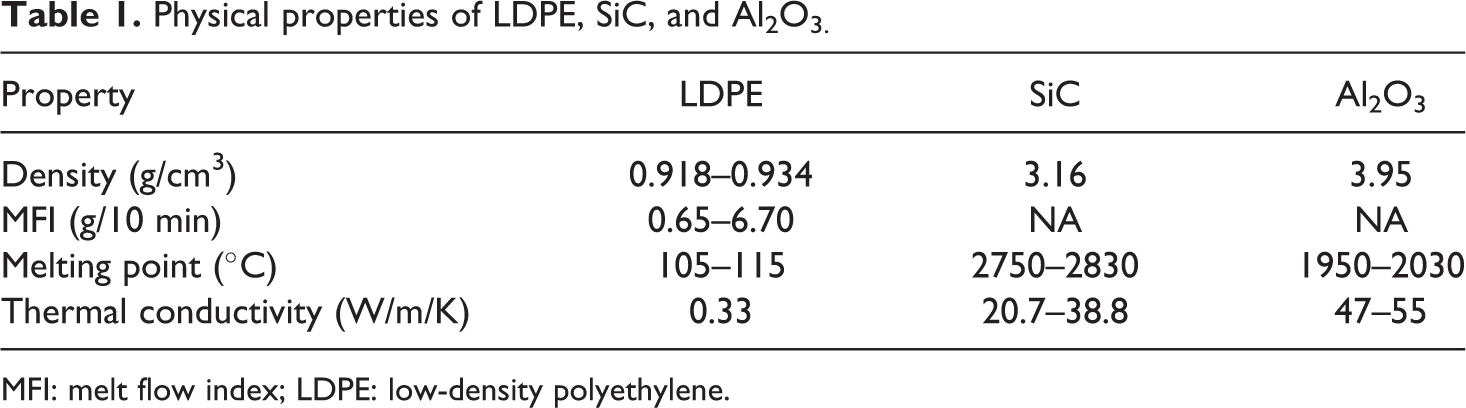
MFI: melt flow index; LDPE: low-density polyethylene.
It has been observed some researchers have studied the effect of SPS and very less has been reported on the effect of particle size on melt flow index (MFI) by considering DPS and TPS. 10 –16 The above-stated sizes of Al2O3 are taken, considering the commercial availability. This research work focuses on the development of LDPE-based FDM feedstock filament reinforced with SiC/Al2O3. LDPE granules and reinforcements were blended together using a twin-screw extruder (TSE), and the wires so produced were put to mechanical testing. Further, Taguchi L18 orthogonal array (OA) technique was applied for optimizing the process parameters of TSE. The differential scanning calorimetry (DSC) technique was used to predict its thermal behavior. The feedstock filament so produced was fed into open-source FDM for printing of rapid tooling (RT) followed by optimization of FDM process parameters.
Pilot experimentations
The different combinations of LDPE granules along with reinforcement of Al2O3 and SiC were mechanically mixed and placed in an electric oven to eliminate any type of moisture present. It is to be noted that recycled LDPE has been taken as matrix material. The mixture is then put into the preheated barrel of MFI tester. The weight as per the ASTM standard D 1238-95 was put on the piston to expel the molten material from barrel and thereby made to exit out of die opening as extrudate and weighed to find MFI in terms of grams per 10 min. Furthermore, different sizes of Al2O3 and SiC, that is, SPS, DPS, and TPS, were also considered for pilot experimentation. After analyzing a large set of combinations, final composition sets for SPS, DPS, and TPS particles of SiC/Al2O3 were considered with least MFI values for each subset created in the pilot study.
Table 2 shows combination sets for least values of selected MFI. Based upon Table 2, various combinations of LDPE and SiC/Al2O3 were selected and used for filament wire preparation on TSE. Four process parameters were taken for TSE, namely composition, load, revolutions per minute (RPM), and temperature of barrel. Six levels of one parameter (composition) and three levels of other three parameters (load, RPM, and temperature of barrel) were taken and explored using Taguchi L18 OA. The filament wires so produced were tested mechanically on a universal tensile tester (UTT). The results of the UTT and signal to noise (S/N) ratios are summarized in Table 3.
Selected MFI values for combinations of LDPE-Al2O3/SiC.a
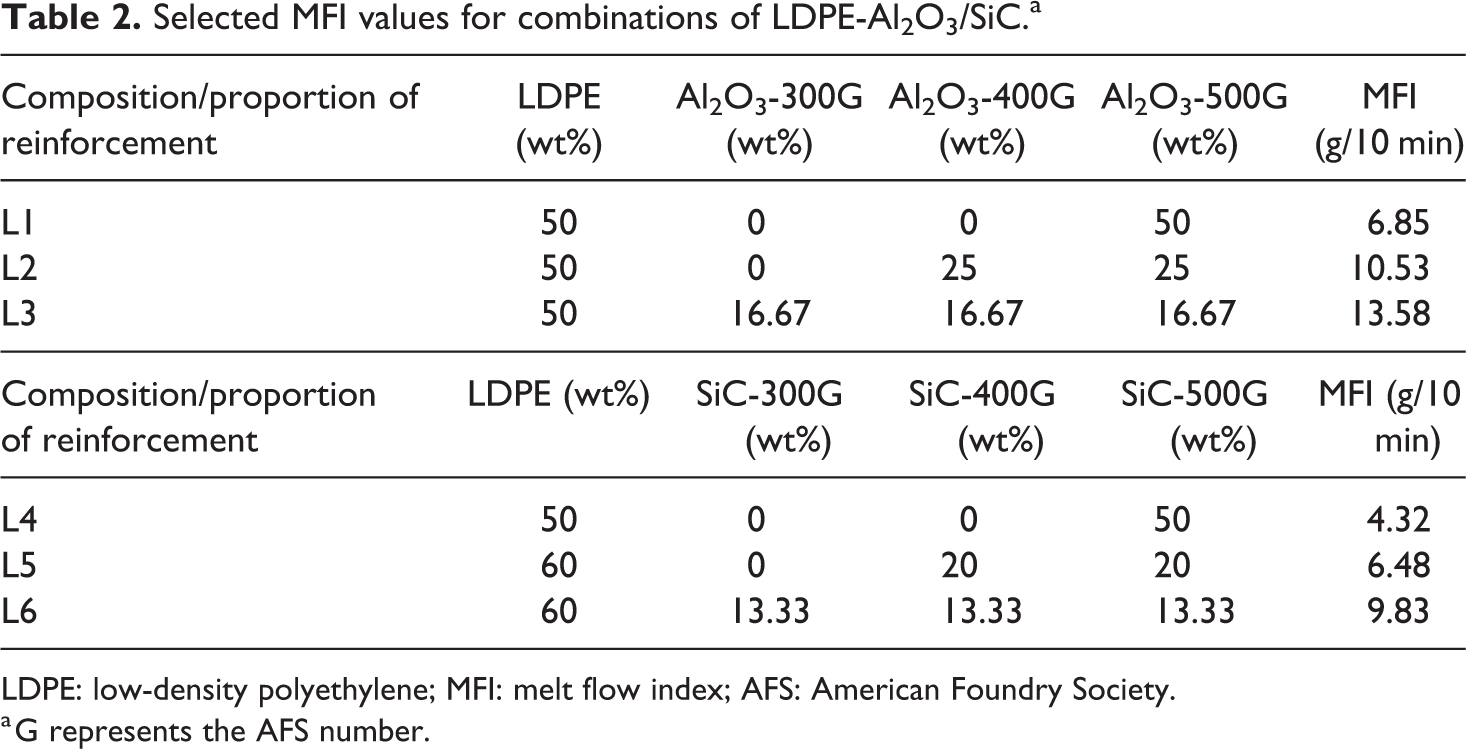
LDPE: low-density polyethylene; MFI: melt flow index; AFS: American Foundry Society.
a G represents the AFS number.
Mechanical properties and S/N ratios for selected combinations of LDPE-Al2O3/SiC.a
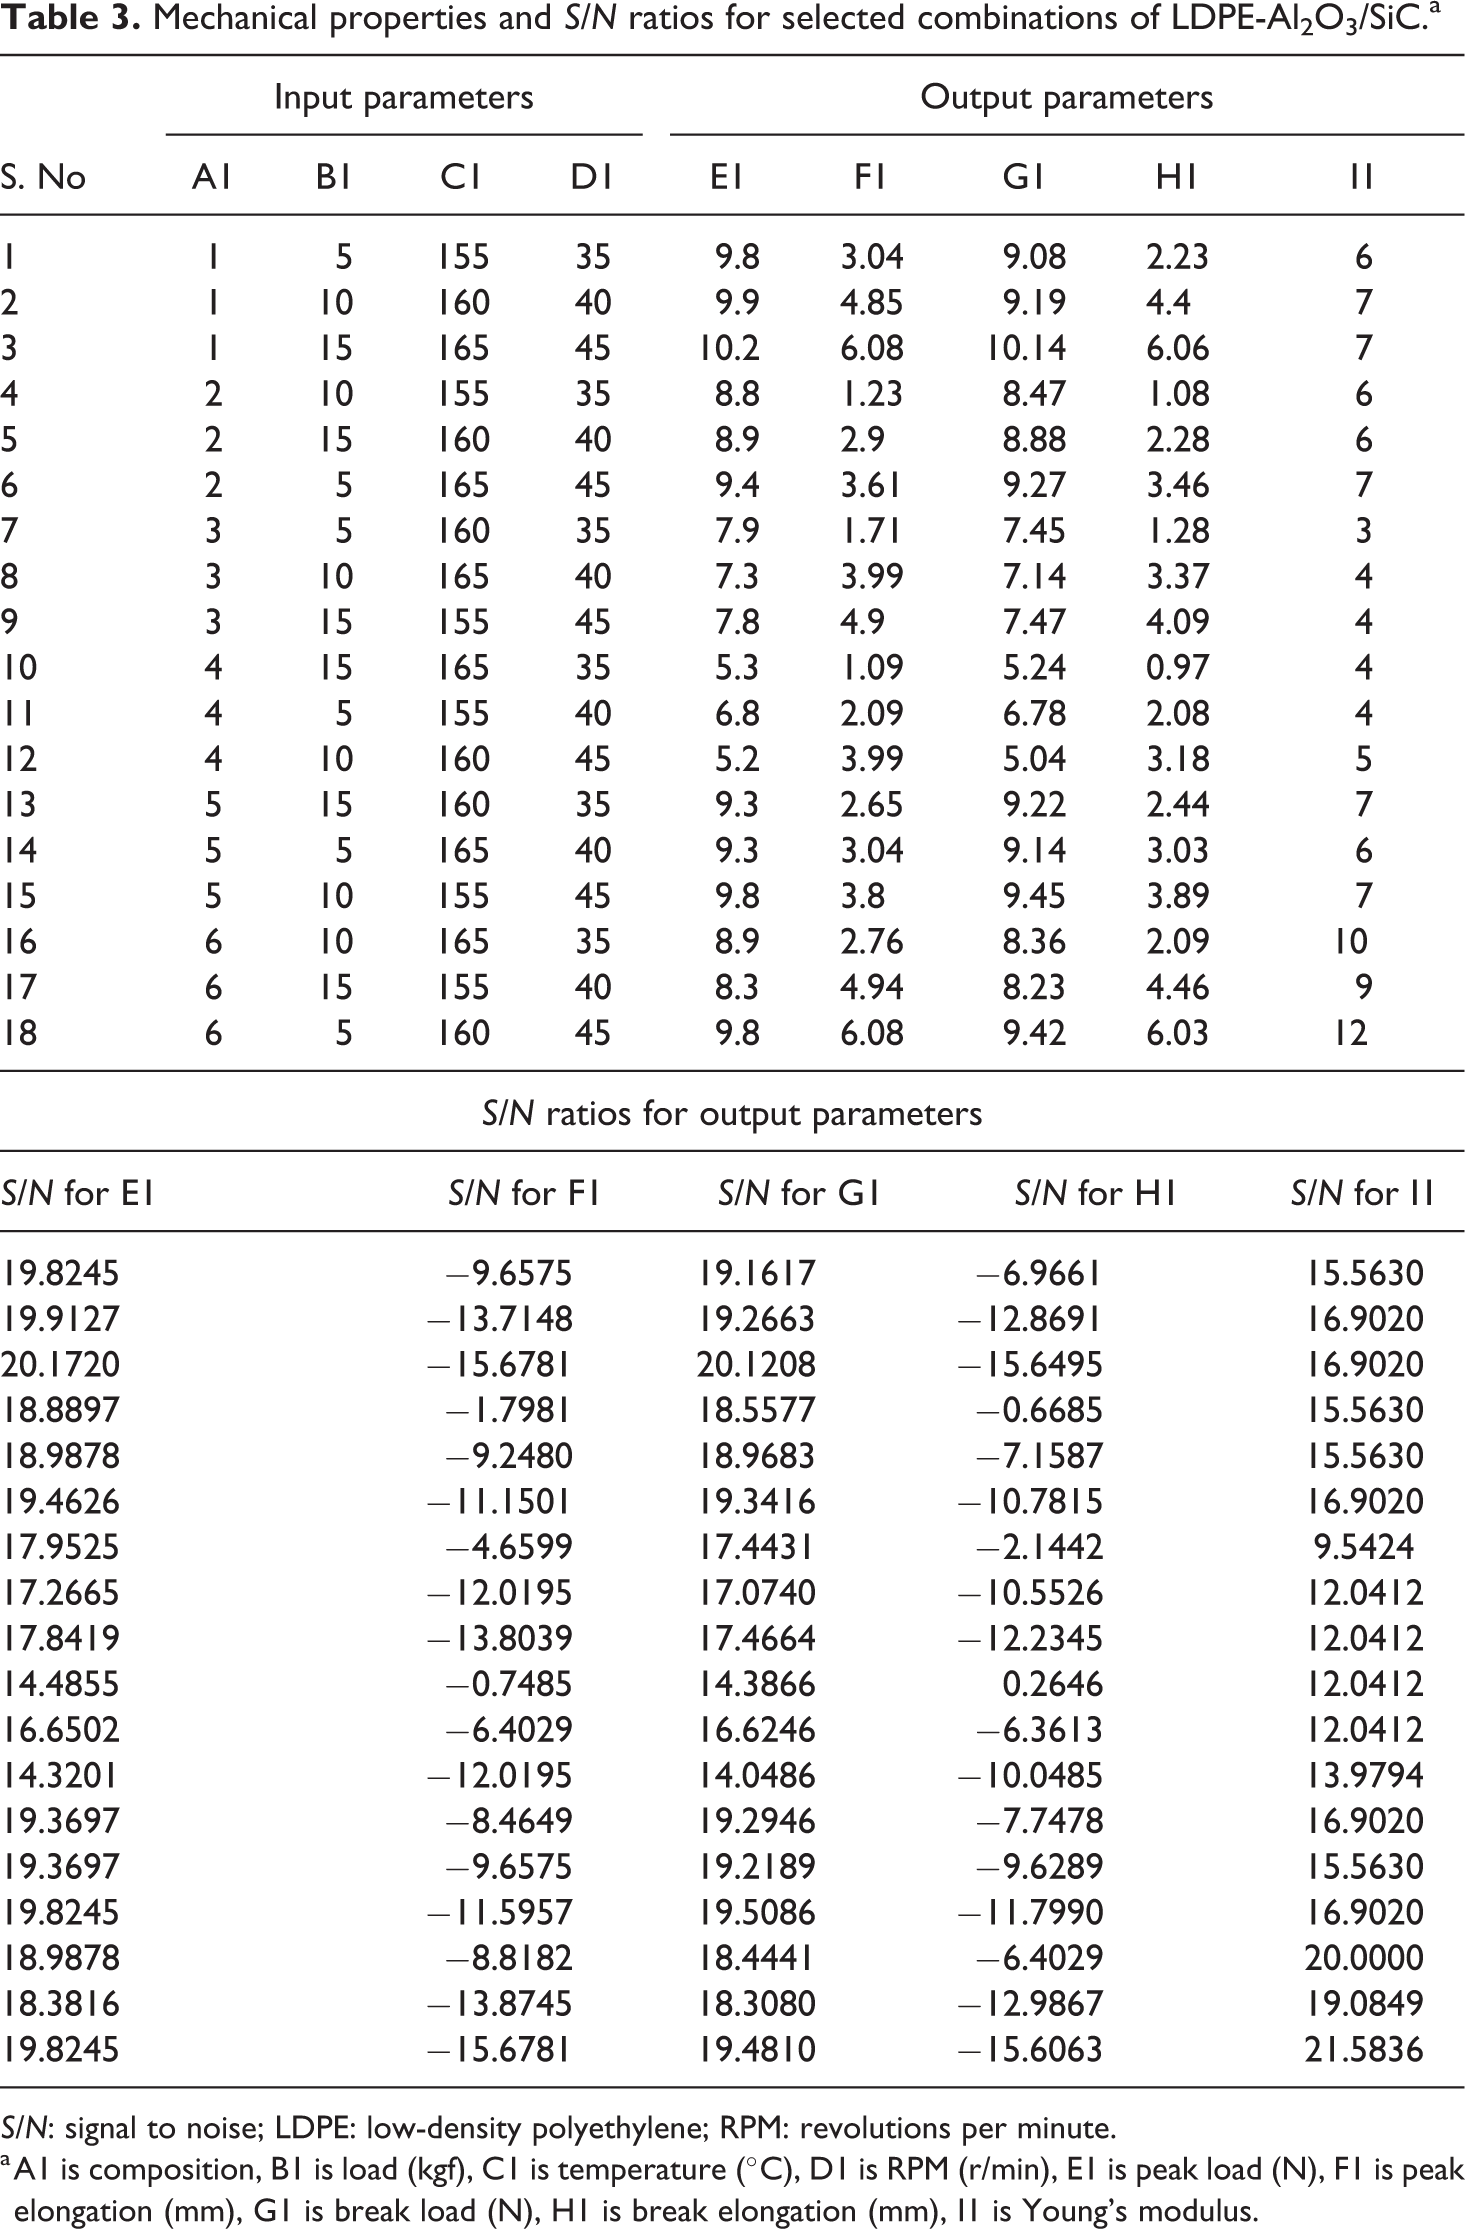
S/N: signal to noise; LDPE: low-density polyethylene; RPM: revolutions per minute.
a A1 is composition, B1 is load (kgf), C1 is temperature (°C), D1 is RPM (r/min), E1 is peak load (N), F1 is peak elongation (mm), G1 is break load (N), H1 is break elongation (mm), I1 is Young’s modulus.
It should be noted that the range of input parameters for B1, C1, and D1 has been selected on the basis of pilot experimentations (this was selected as nominal range, between which the filament wires were extruded properly without any rupture and unevenness in diameters). Further, it should be noted that the values for output properties are the average value of three observations (at same settings) taken to reduce the experimental error. Based upon Table 3, the percentage contributions of each process parameter on the mechanical properties are summarized in Table 4.
Percentage contribution of process parameters on mechanical properties.
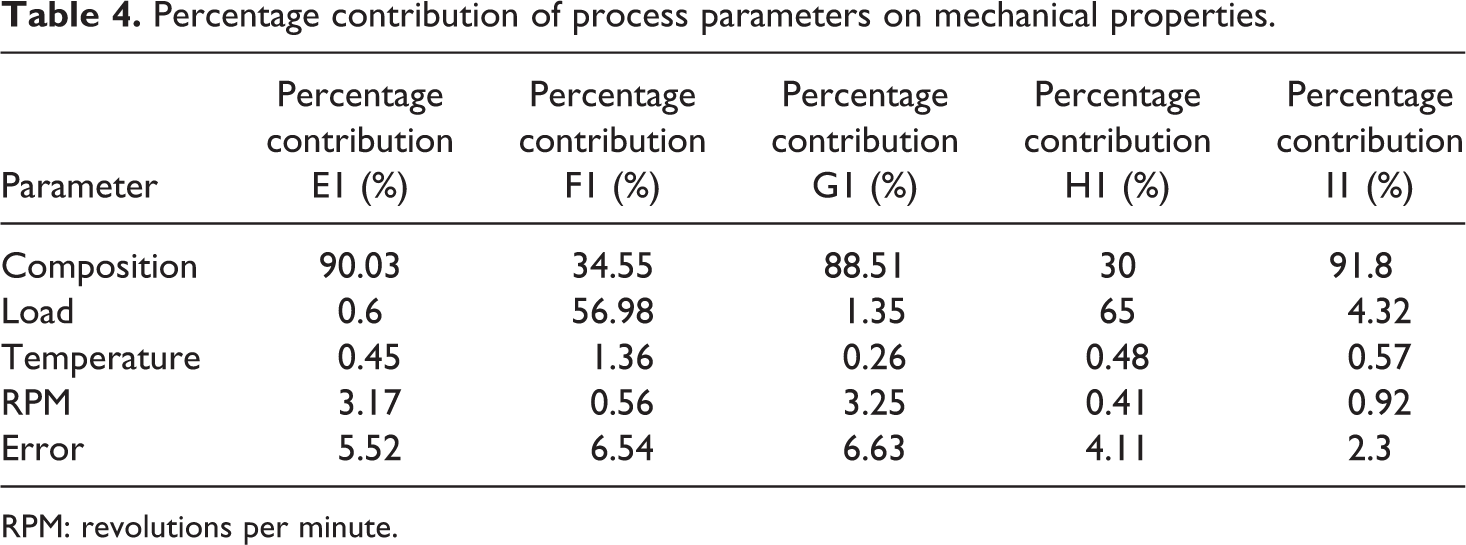
RPM: revolutions per minute.
It should be noted S/N ratio estimates the inverse of the coefficient of variation. It estimates the ratio μ/σ, with μ being the process mean (signal) and σ (noise) the process standard deviation. The S/N ratios can be classified into three categories
Larger the better,
Smaller the better,
Nominal the best,
where n is the number of measurements, Yi
is the observed characteristic value, μ (mean) =
The S/N ratios in Table 3 for output parameters E1, G1, and I1 have been calculated for larger the better type case and for output parameters F1 and H1 have been calculated for smaller the better type case.
Final experimentations
As observed from Table 4, composition is the major factor contributing to peak load, break load, and Young’s modulus, and load is the major factor contributing to peak elongation and break elongation. After analyzing all S/N ratios for multifactor optimization, the combined effect of all the process parameters on mechanical properties is shown in Figure 1 and summarized in Tables 5 and 6.
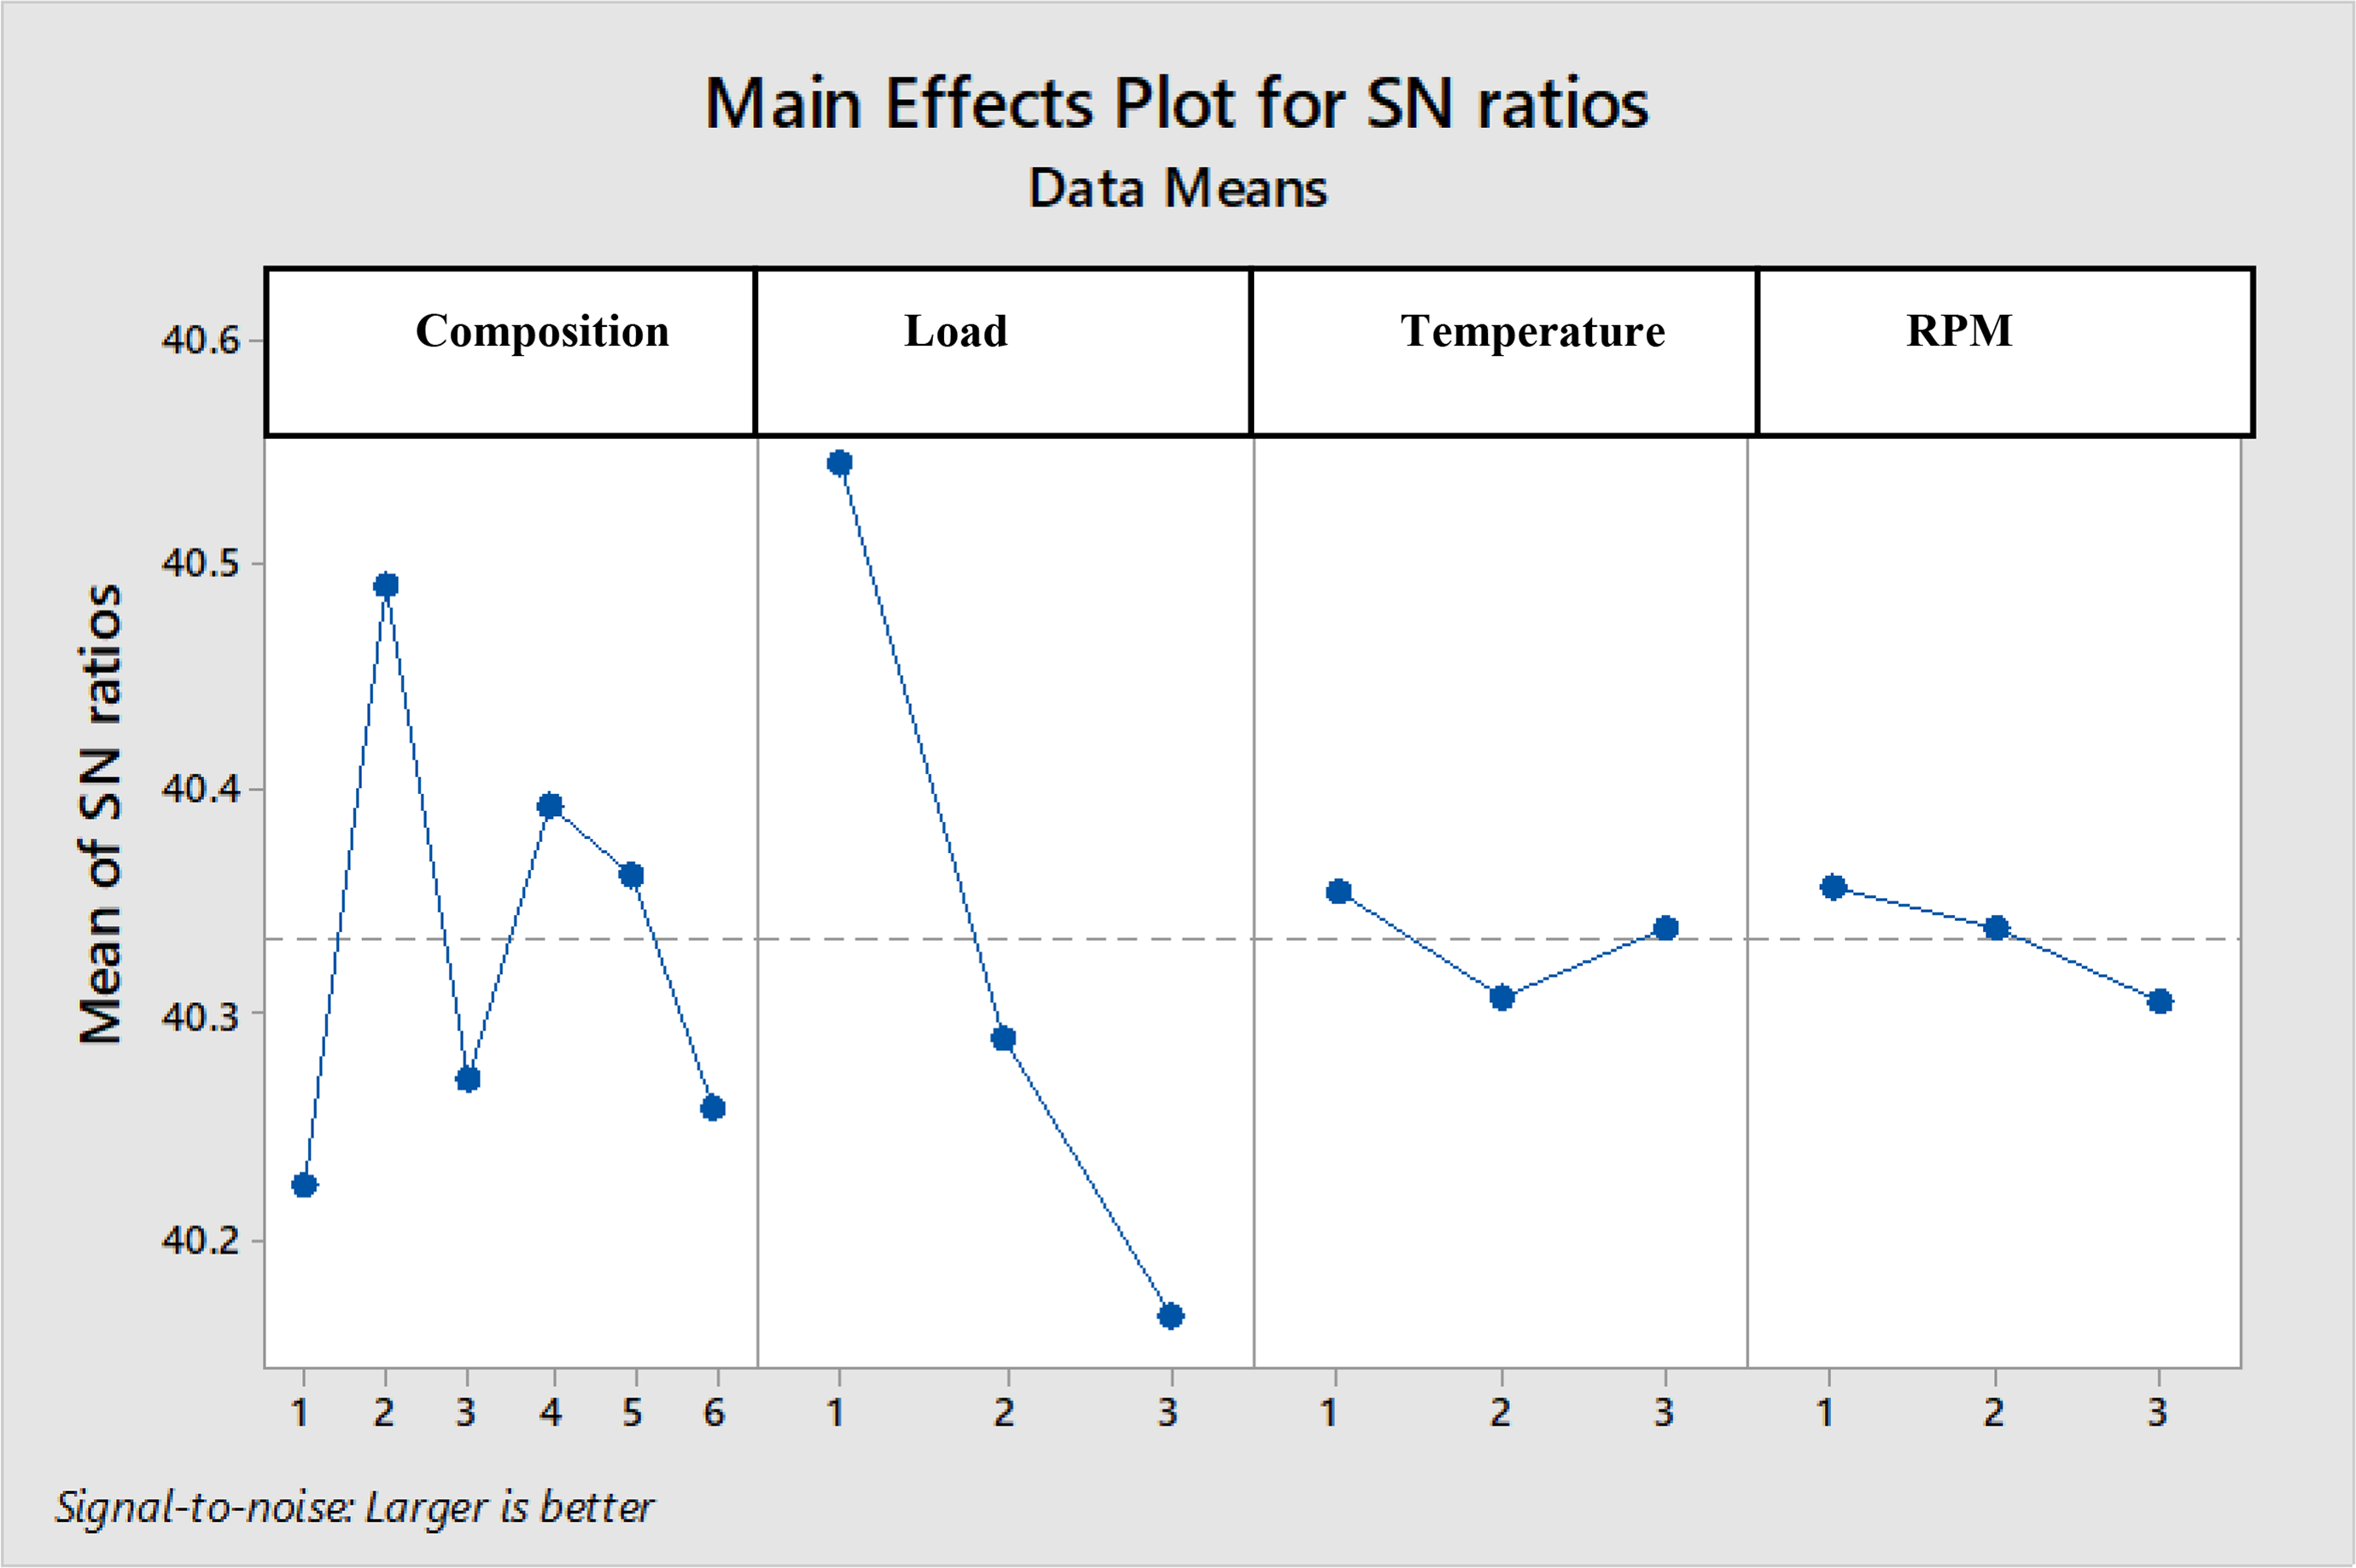
S/N ratio plot for multifactor optimization. S/N: signal to noise.
Figure 1 shows that level 2 of composition (i.e. LDPE as 50% by weight, Al2O3-400G as 25% by weight, Al2O3-500G as 25% by weight), level 1 of load (5 kgf), level 1 of RPM (35 r/min), and level 1 of temperature (155°C) are the best settings as per Taguchi L18OA.
Tables 5 and 6 show the percentage contribution and ranking of each input parameter (analyzed using multifactor optimization technique by taking larger the better type case of S/N ratios calculated in Table 3). It can be seen from Table 5 that load contributes the maximum with 70.11% contribution followed by composition with 23.34% contribution. It is to be noted that contribution of temperature and RPM can be neglected as p value of these parameters is less than 0.05. Hence from the above discussion, it can be ascertained that Al2O3-based DPS reinforcement exhibits better mechanical properties of the feedstock filament.
Percentage contribution and S/N ratios for multifactor optimization.
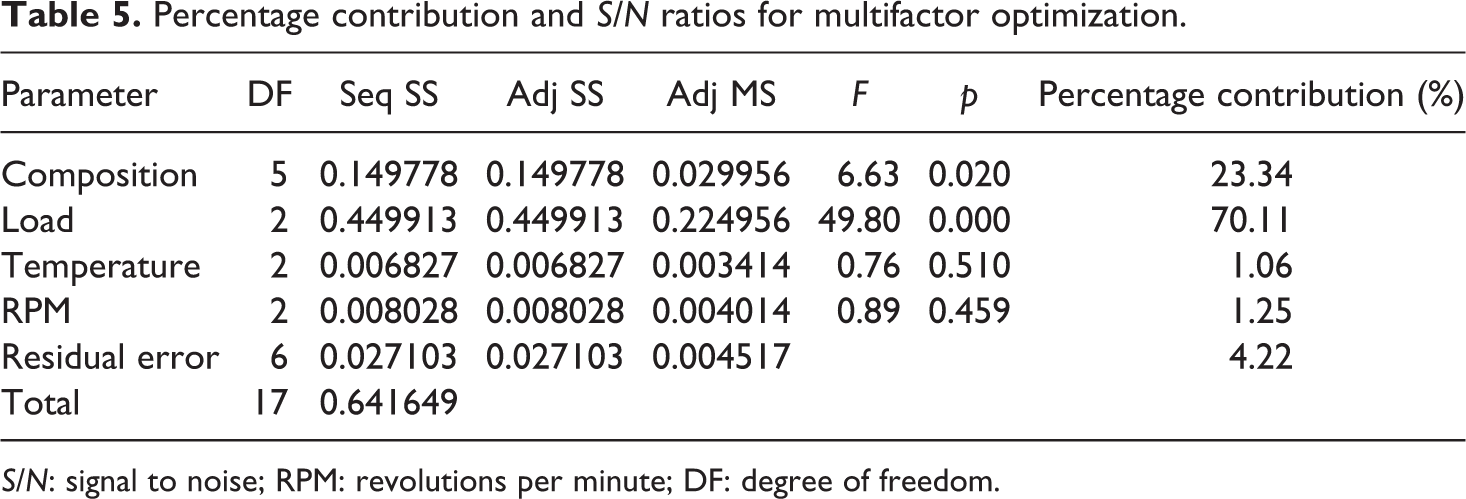
S/N: signal to noise; RPM: revolutions per minute; DF: degree of freedom.
For final confirmatory, the feedstock filament wire with LDPE 50% by weight, Al2O3-400G 25% by weight, and Al2O3-500G 25% by weight (i.e. DPS) was prepared for batch production using TSE. In the present study, an intermeshing corotating type TSE has been selected. The TSE was operated at 145°C, rotational speed range 70 r/min, and torque 0.10 Nm with a nozzle of 1.5-mm diameter.
After preparations of the feedstock filament, it was fed to the commercial FDM setup (see Figure 2) to fabricate the 3-D parts, of 10 × 10 × 35 mm3 (see Figure 3), to check its printing capabilities of reinforced filament wire for different engineering applications. Three process parameters were taken for FDM, namely infill density, infill angle, and infill speed. Furthermore, three levels of these three parameters were taken and explored using Taguchi L9 OA. Thus, nine different samples of DPS (Al2O3)–reinforced LDPE have been printed on open-source FDM without change in any hardware or software of the system. Figure 4 shows 3-D printed prototypes. Further, Table 7 shows a comparison of dimensional features of 3-D printed geometries as per computer-aided design (CAD) dimensions.
Ranking of input parameters.
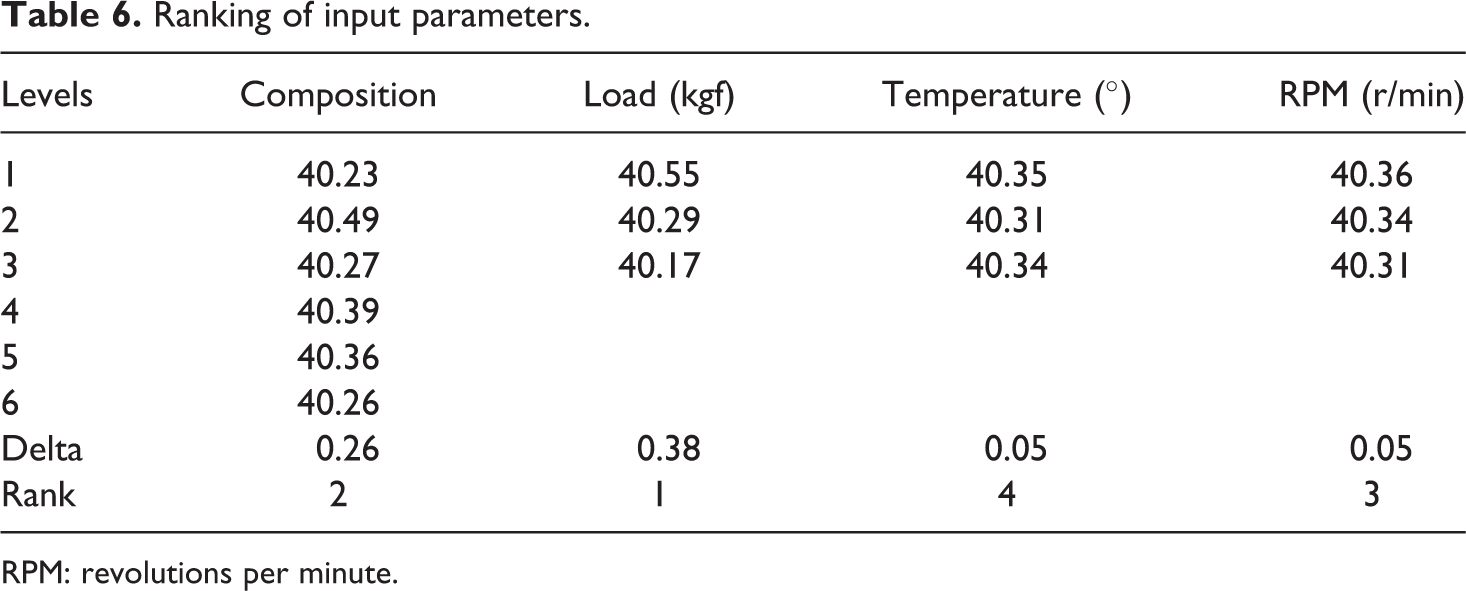
RPM: revolutions per minute.
Comparison of dimensional/surface features of parts printed.
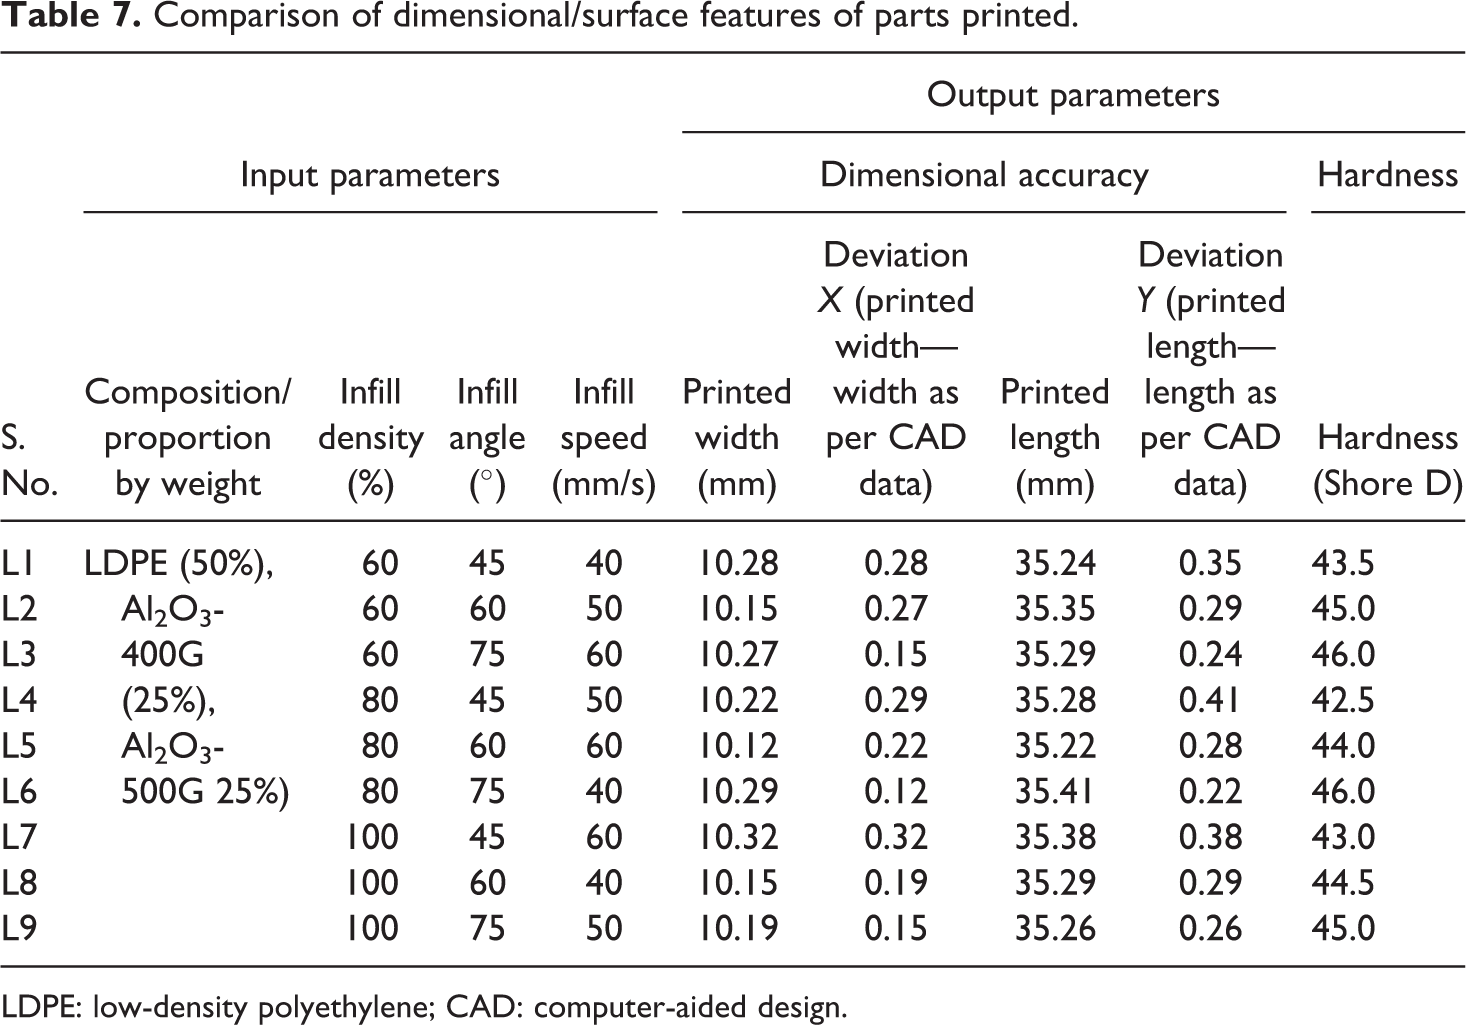
LDPE: low-density polyethylene; CAD: computer-aided design.
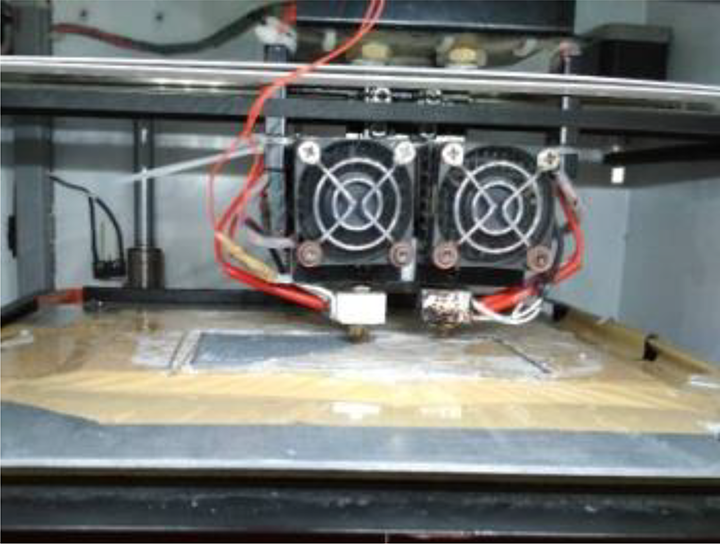
Part fabrication on FDM. FDM: fused deposition modeling.
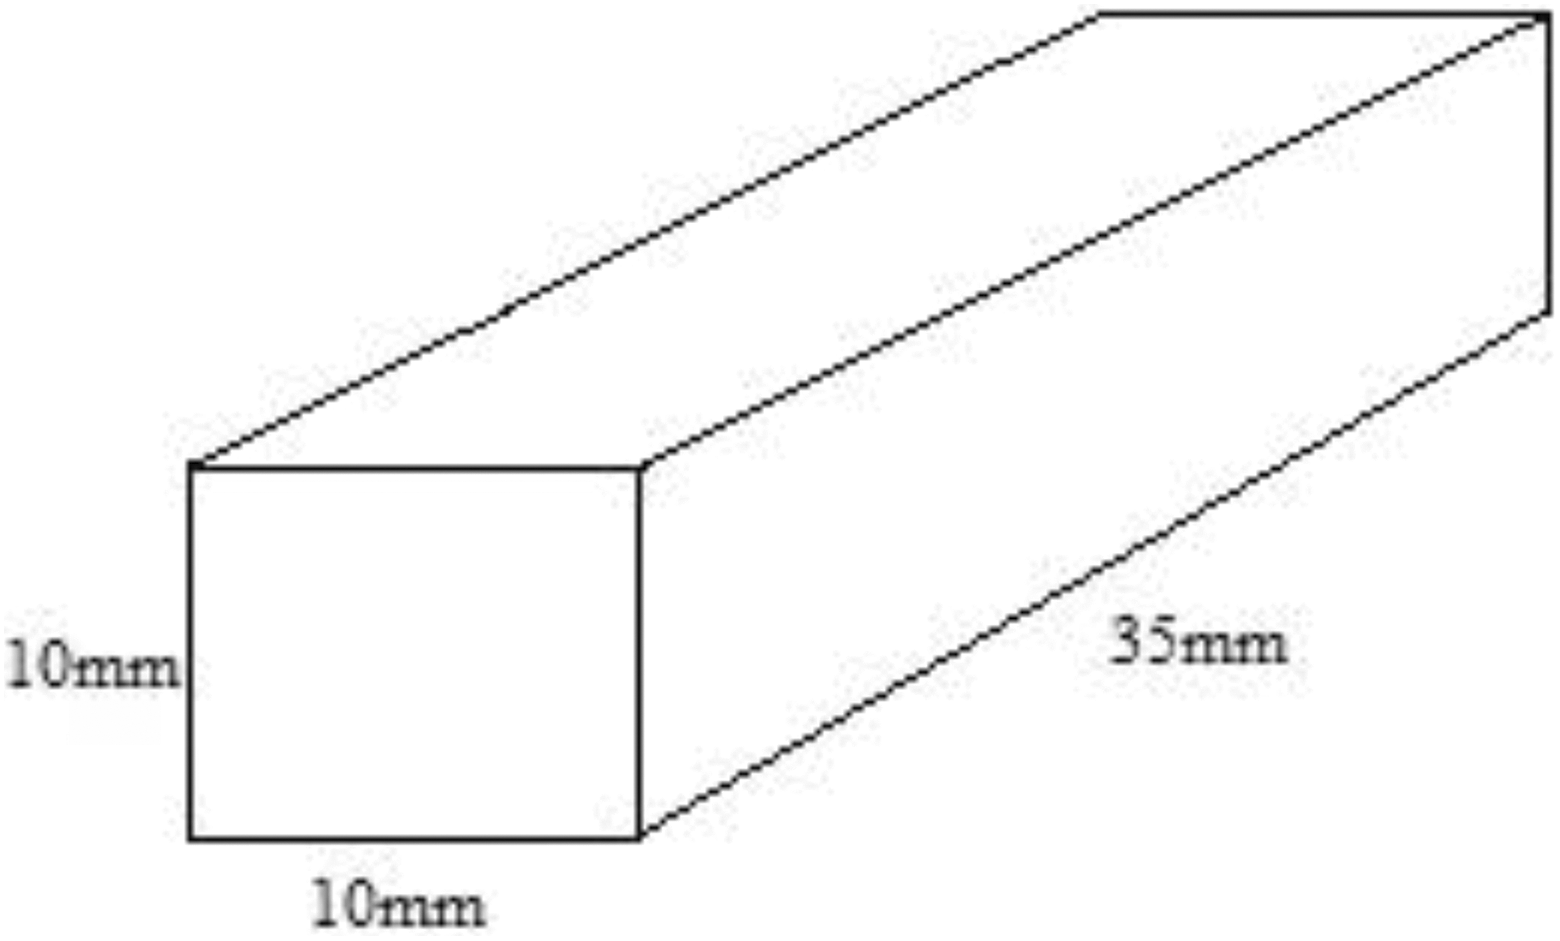
Benchmark dimensions.

Benchmarks printed on FDM. FDM: fused deposition modeling.
It should be noted that the range of input parameters has been selected on the basis of pilot experimentations (this was selected as nominal range, between which the parts were printed properly without any delamination observed visually). Further, it should be noted that the values for output properties are the average value of three readings taken repeatedly for each. Based upon Table 7, S/N ratios of output properties (i.e. dimensional accuracy (deviation X and deviation Y) and Shore D hardness; as obtained using L9 OA) are summarized in Table 8. The S/N ratios for dimensional accuracy have been calculated for smaller the better type case (for reducing dimensional deviation) and for hardness, S/N ratio has been calculated for larger the better type case.
Based upon Table 8, percentage contributions of each process parameter on output properties are summarized in Table 9.
S/N ratios for different output parameters.
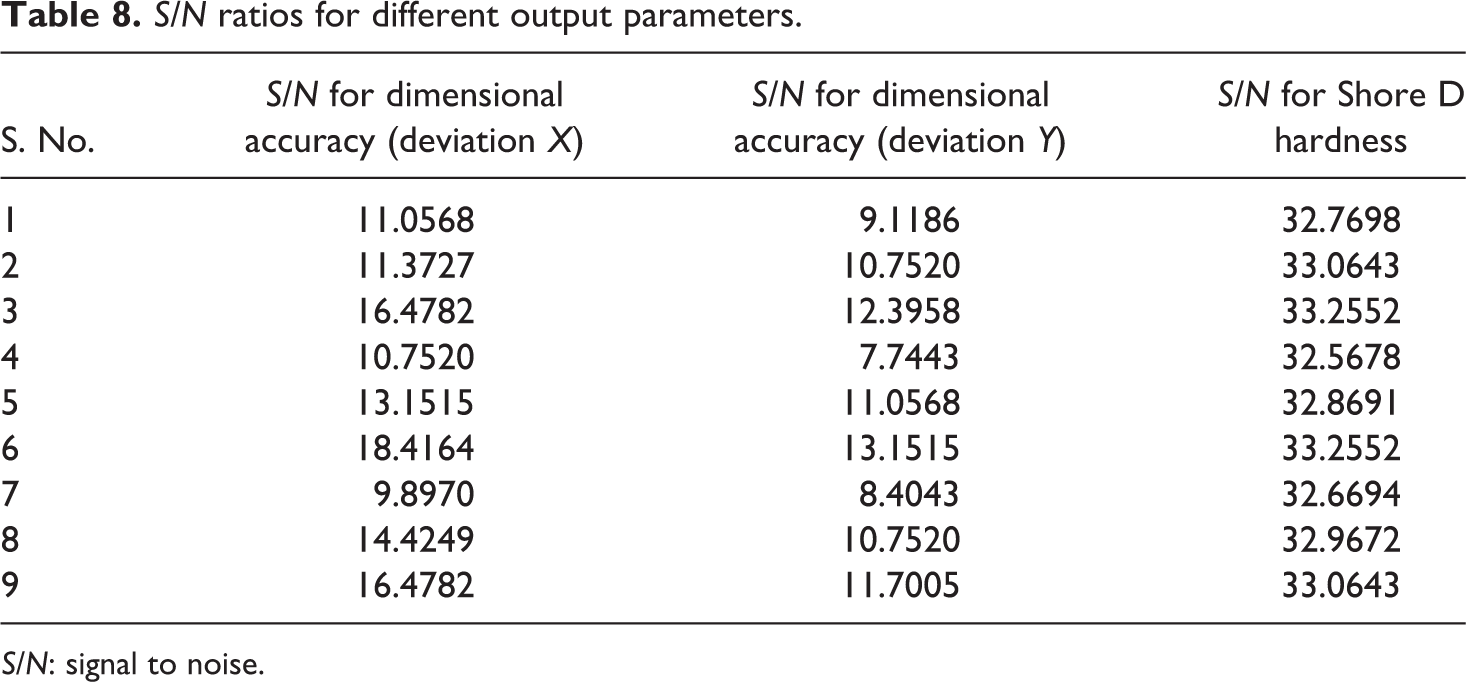
S/N: signal to noise.
Percentage contributions of each process parameter on output properties.
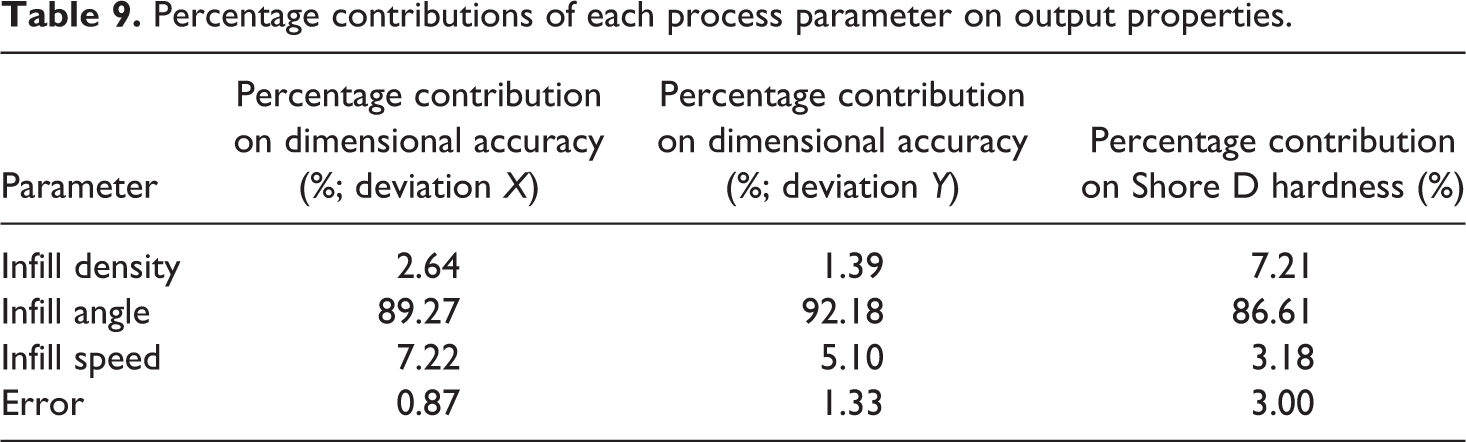
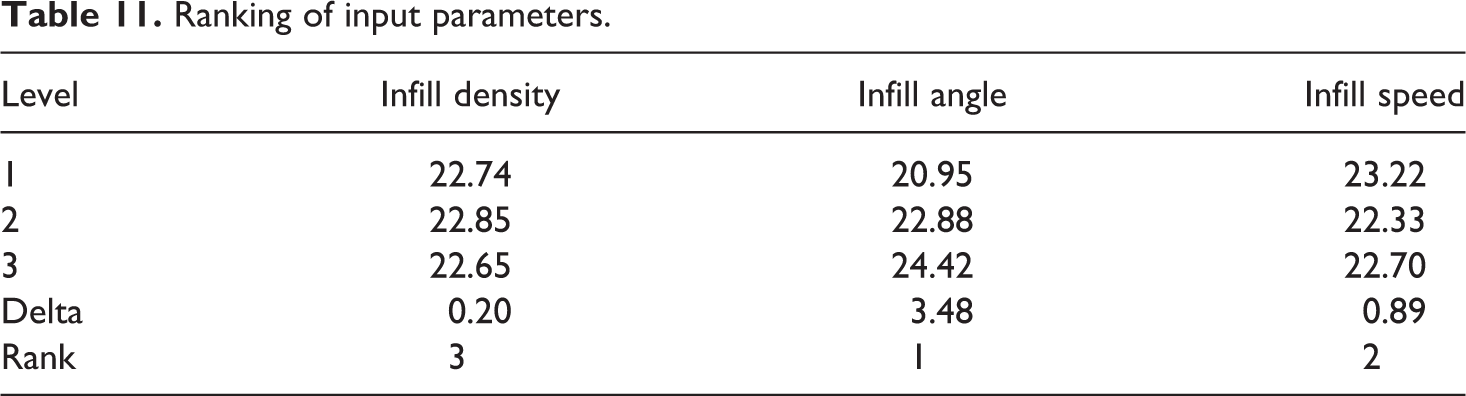
As observed from Table 9, infill angle came out to be the major contributing factor to dimensional accuracy (deviation X and deviation Y) and Shore D hardness. Further, from S/N plots, the best levels of each input parameter can be judged very easily as well (see Figure 5). The photomicrograph for each part printed on FDM was checked using toolmaker’s microscope (at 30× magnification) to ensure the fusion of different layers printed on FDM (see Figure 6). It should be noted that photomicrograph is a digital image taken through optical microscope at certain higher magnification. In the present study, photomicrographs were captured to ensure the proper fusion of reinforcements in base matrix and appropriate fusion of different layers printed on FDM. After analyzing all S/N ratios for multifactor optimization, the combined effect of all the input process parameters on output properties is shown in Figure 7 and summarized in Tables 10 and 11 (by considering larger the better type case for S/N ratios calculated in Table 8). Figure 7 shows that level 2 of infill density (i.e. 80%), level 3 of infill angle (75°), and level 1 of infill speed (40 mm/s) are the best settings as per Taguchi L9 OA. It can be seen from Table 10 that infill angle contributes maximum with 93.29% contribution, followed by infill speed with 6.12% contribution.
Percentage contribution and S/N ratios for multifactor optimization for FDM.
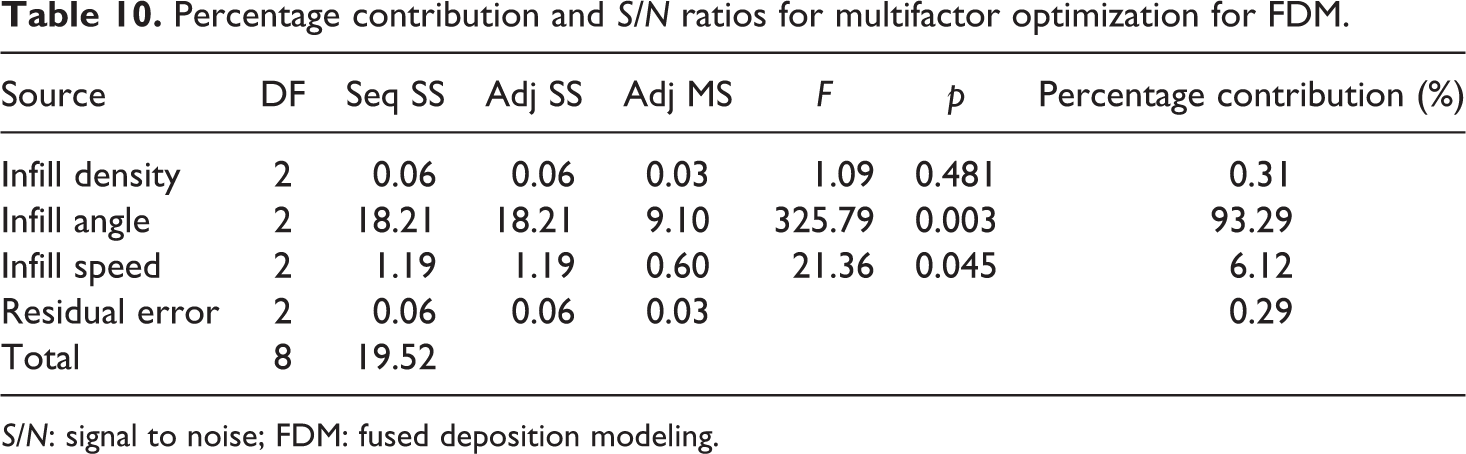
S/N: signal to noise; FDM: fused deposition modeling.
Ranking of input parameters.
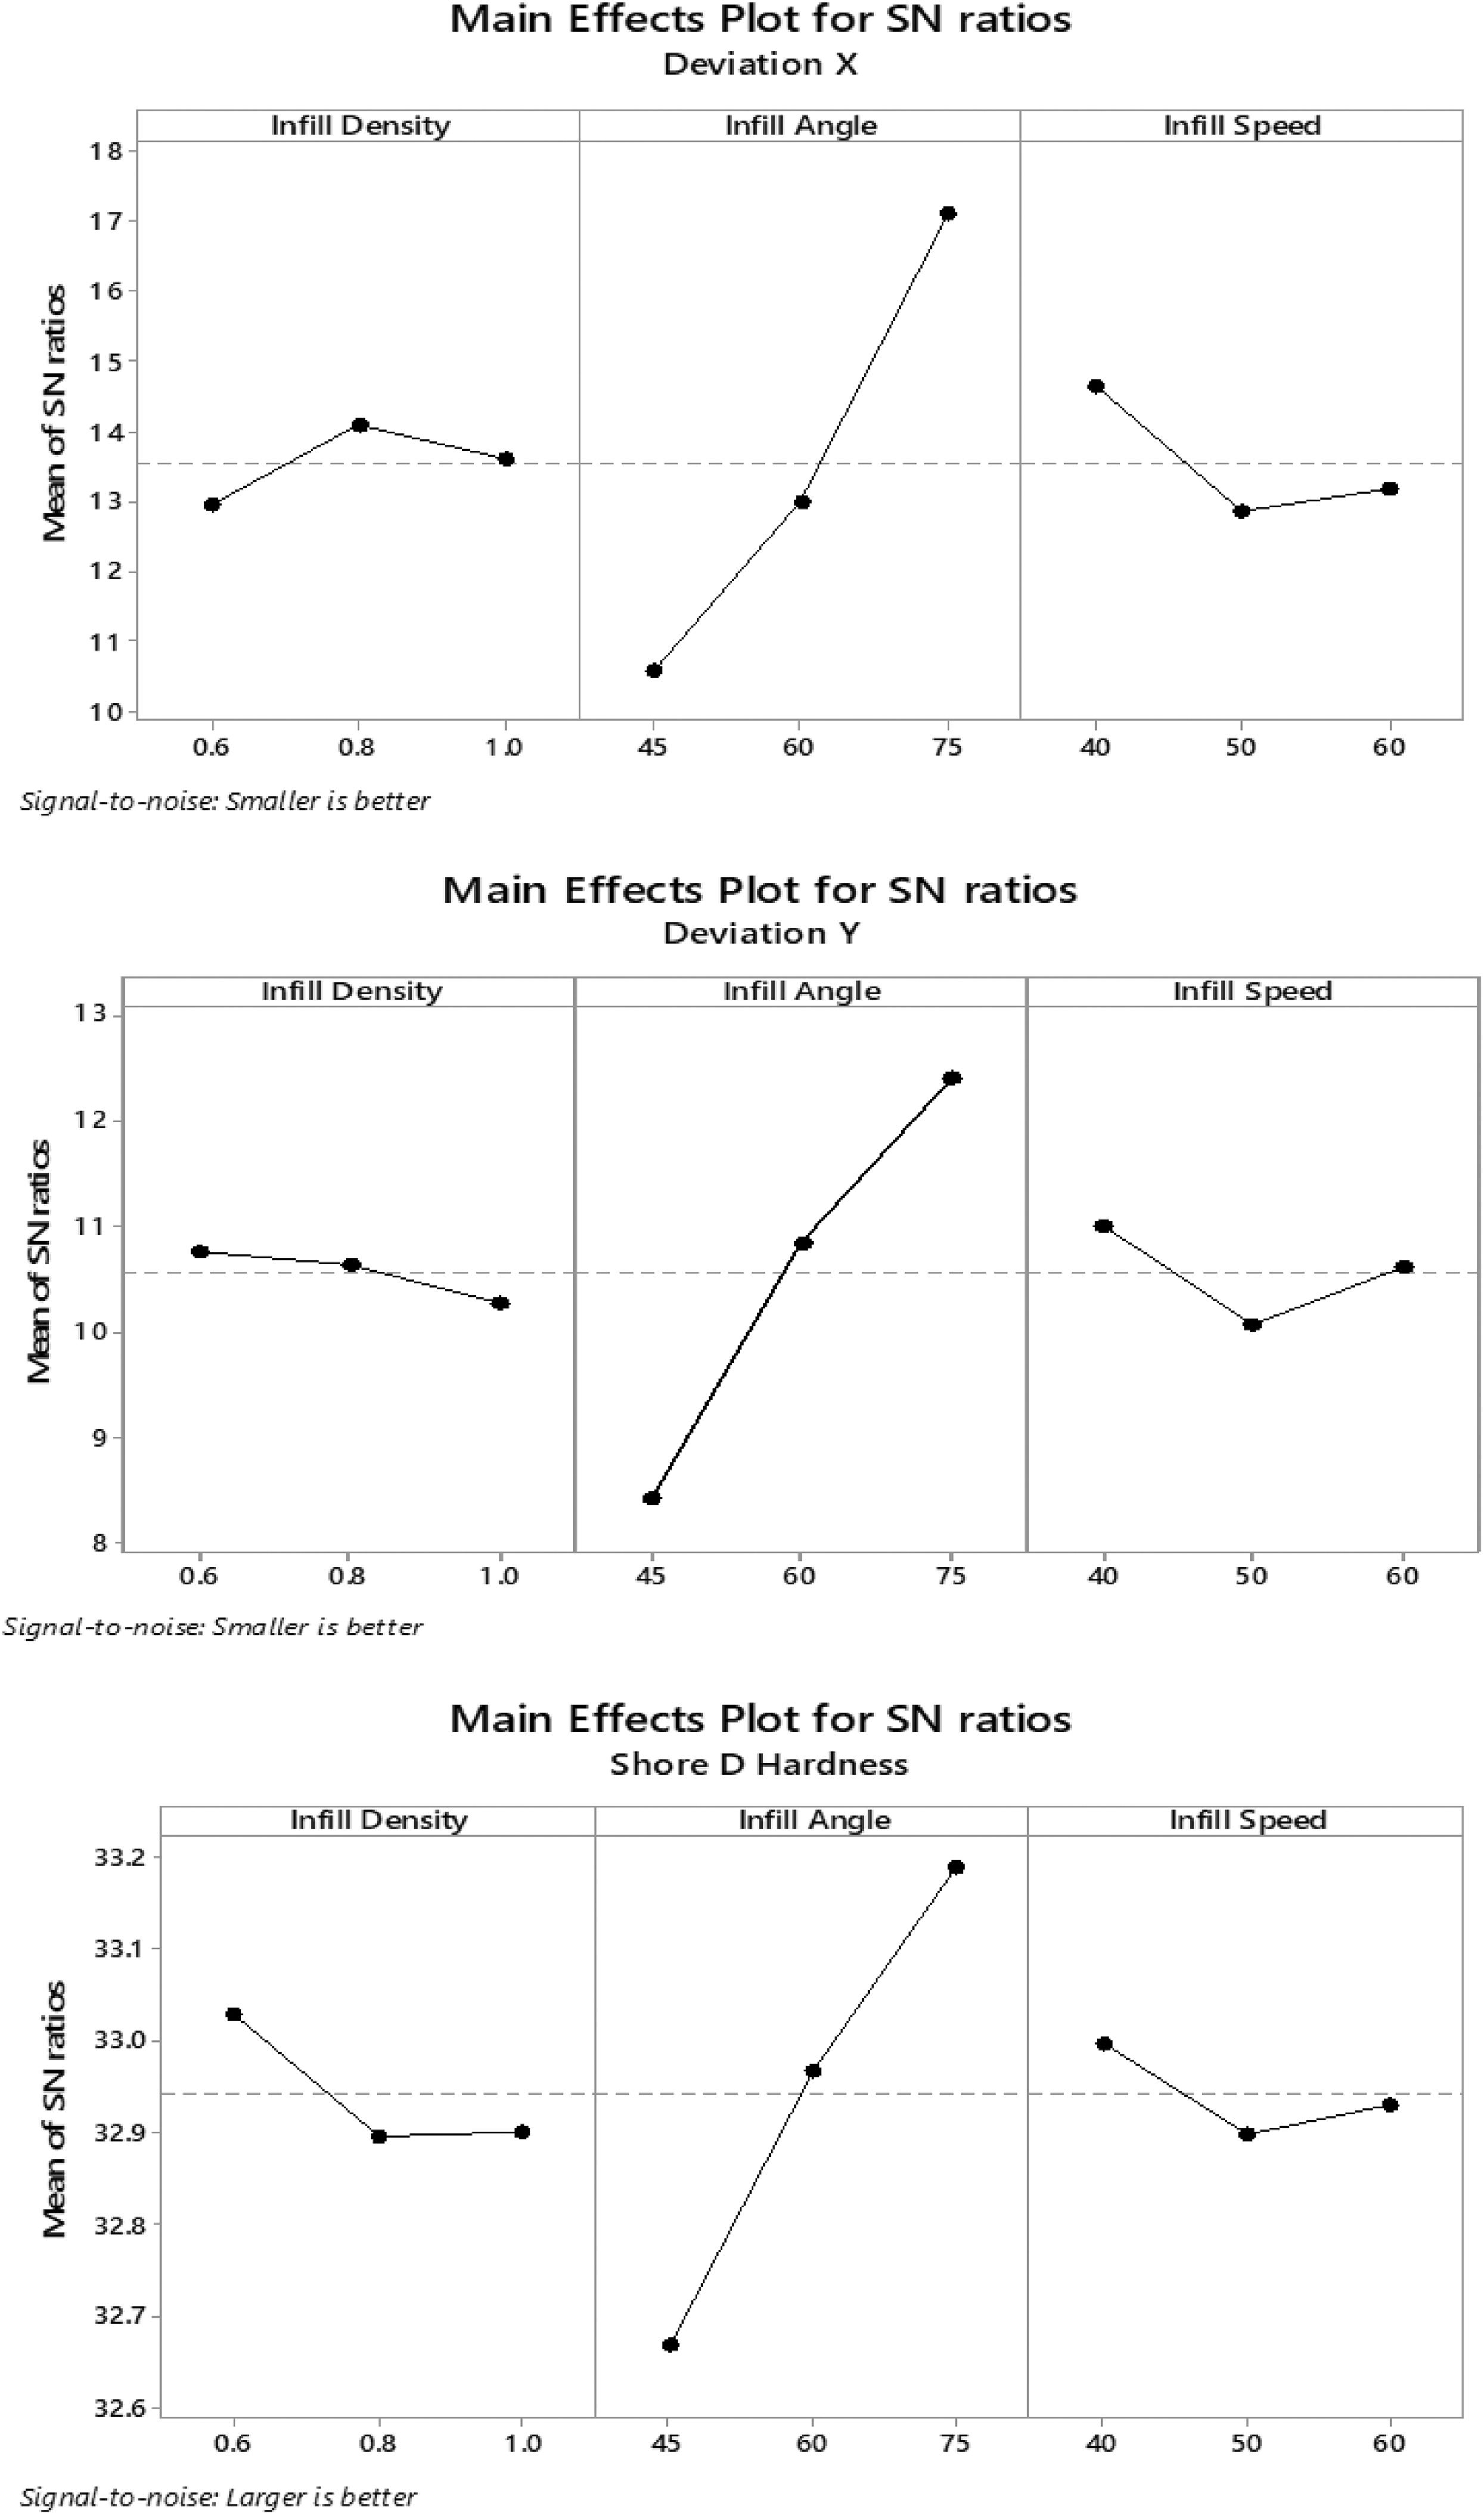
S/N plots for different process parameters of FDM. S/N: signal to noise; FDM: fused deposition modeling.
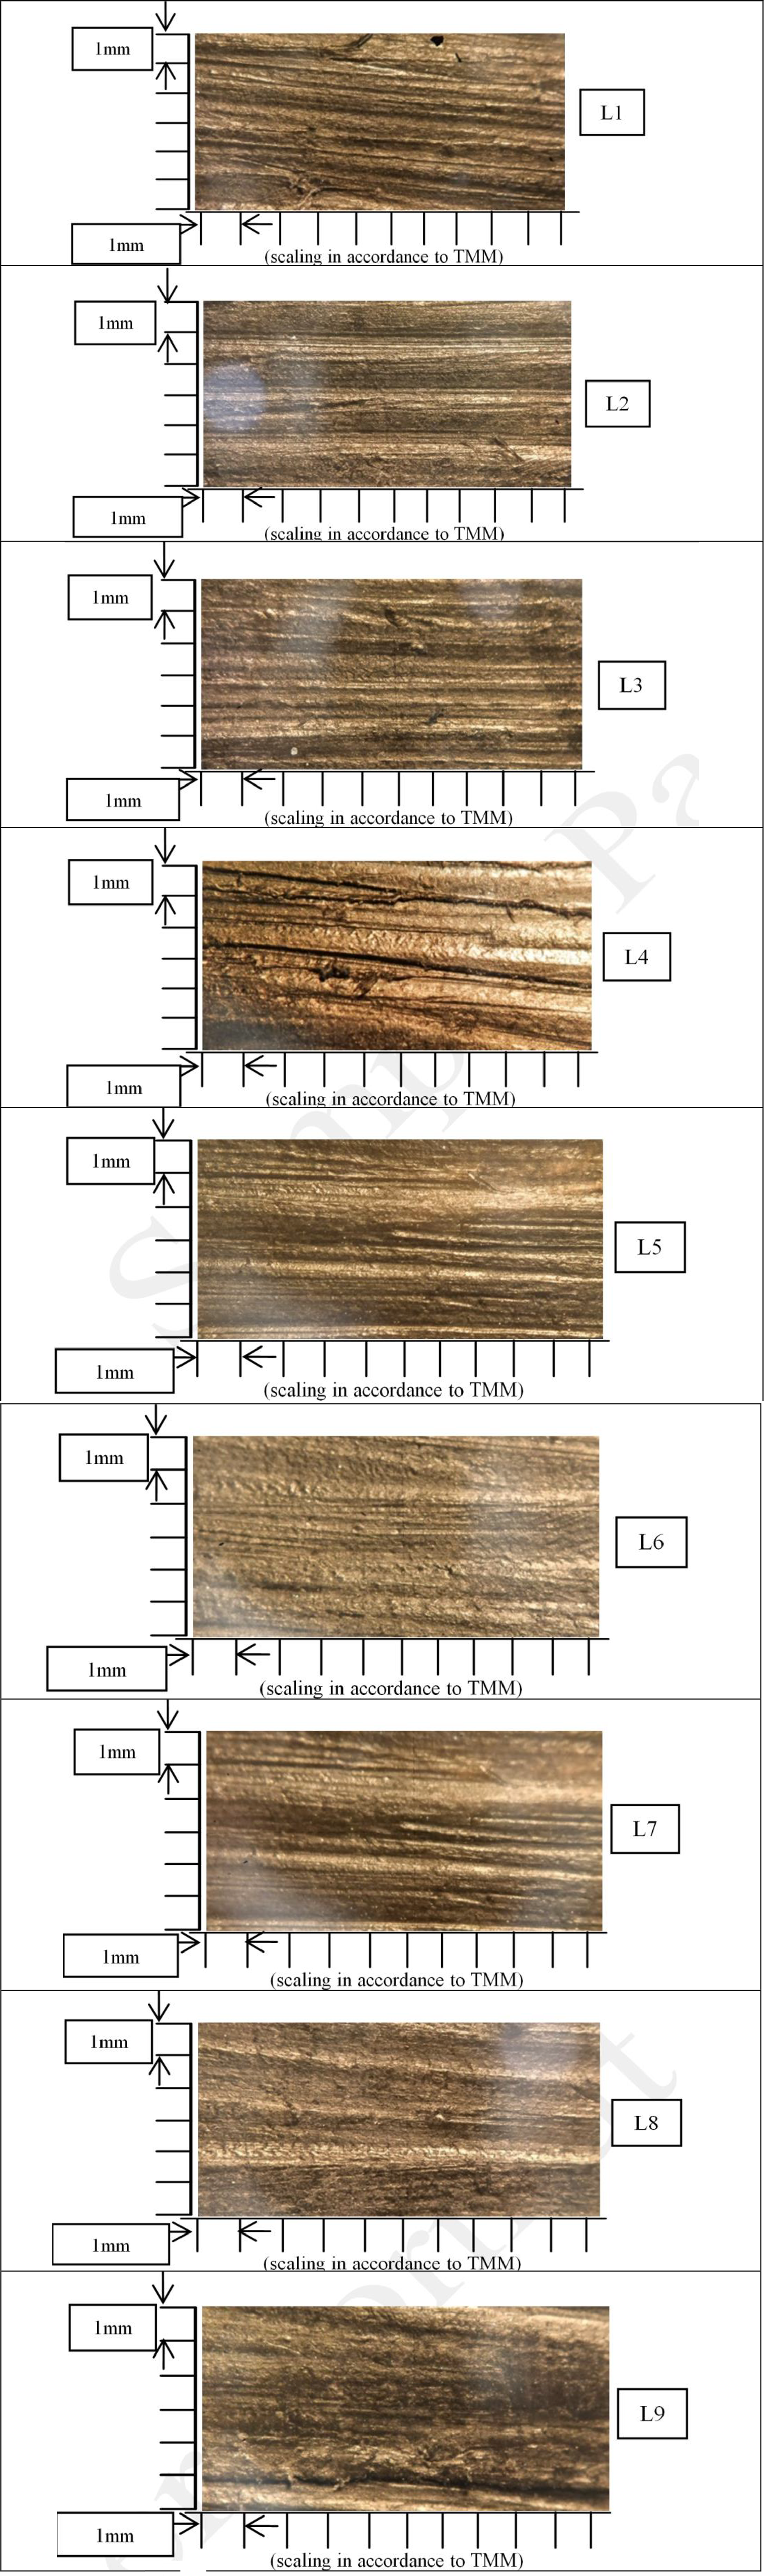
Photomicrographs of parts printed on FDM. FDM: fused deposition modeling; TMM: toolmaker’s microscope.
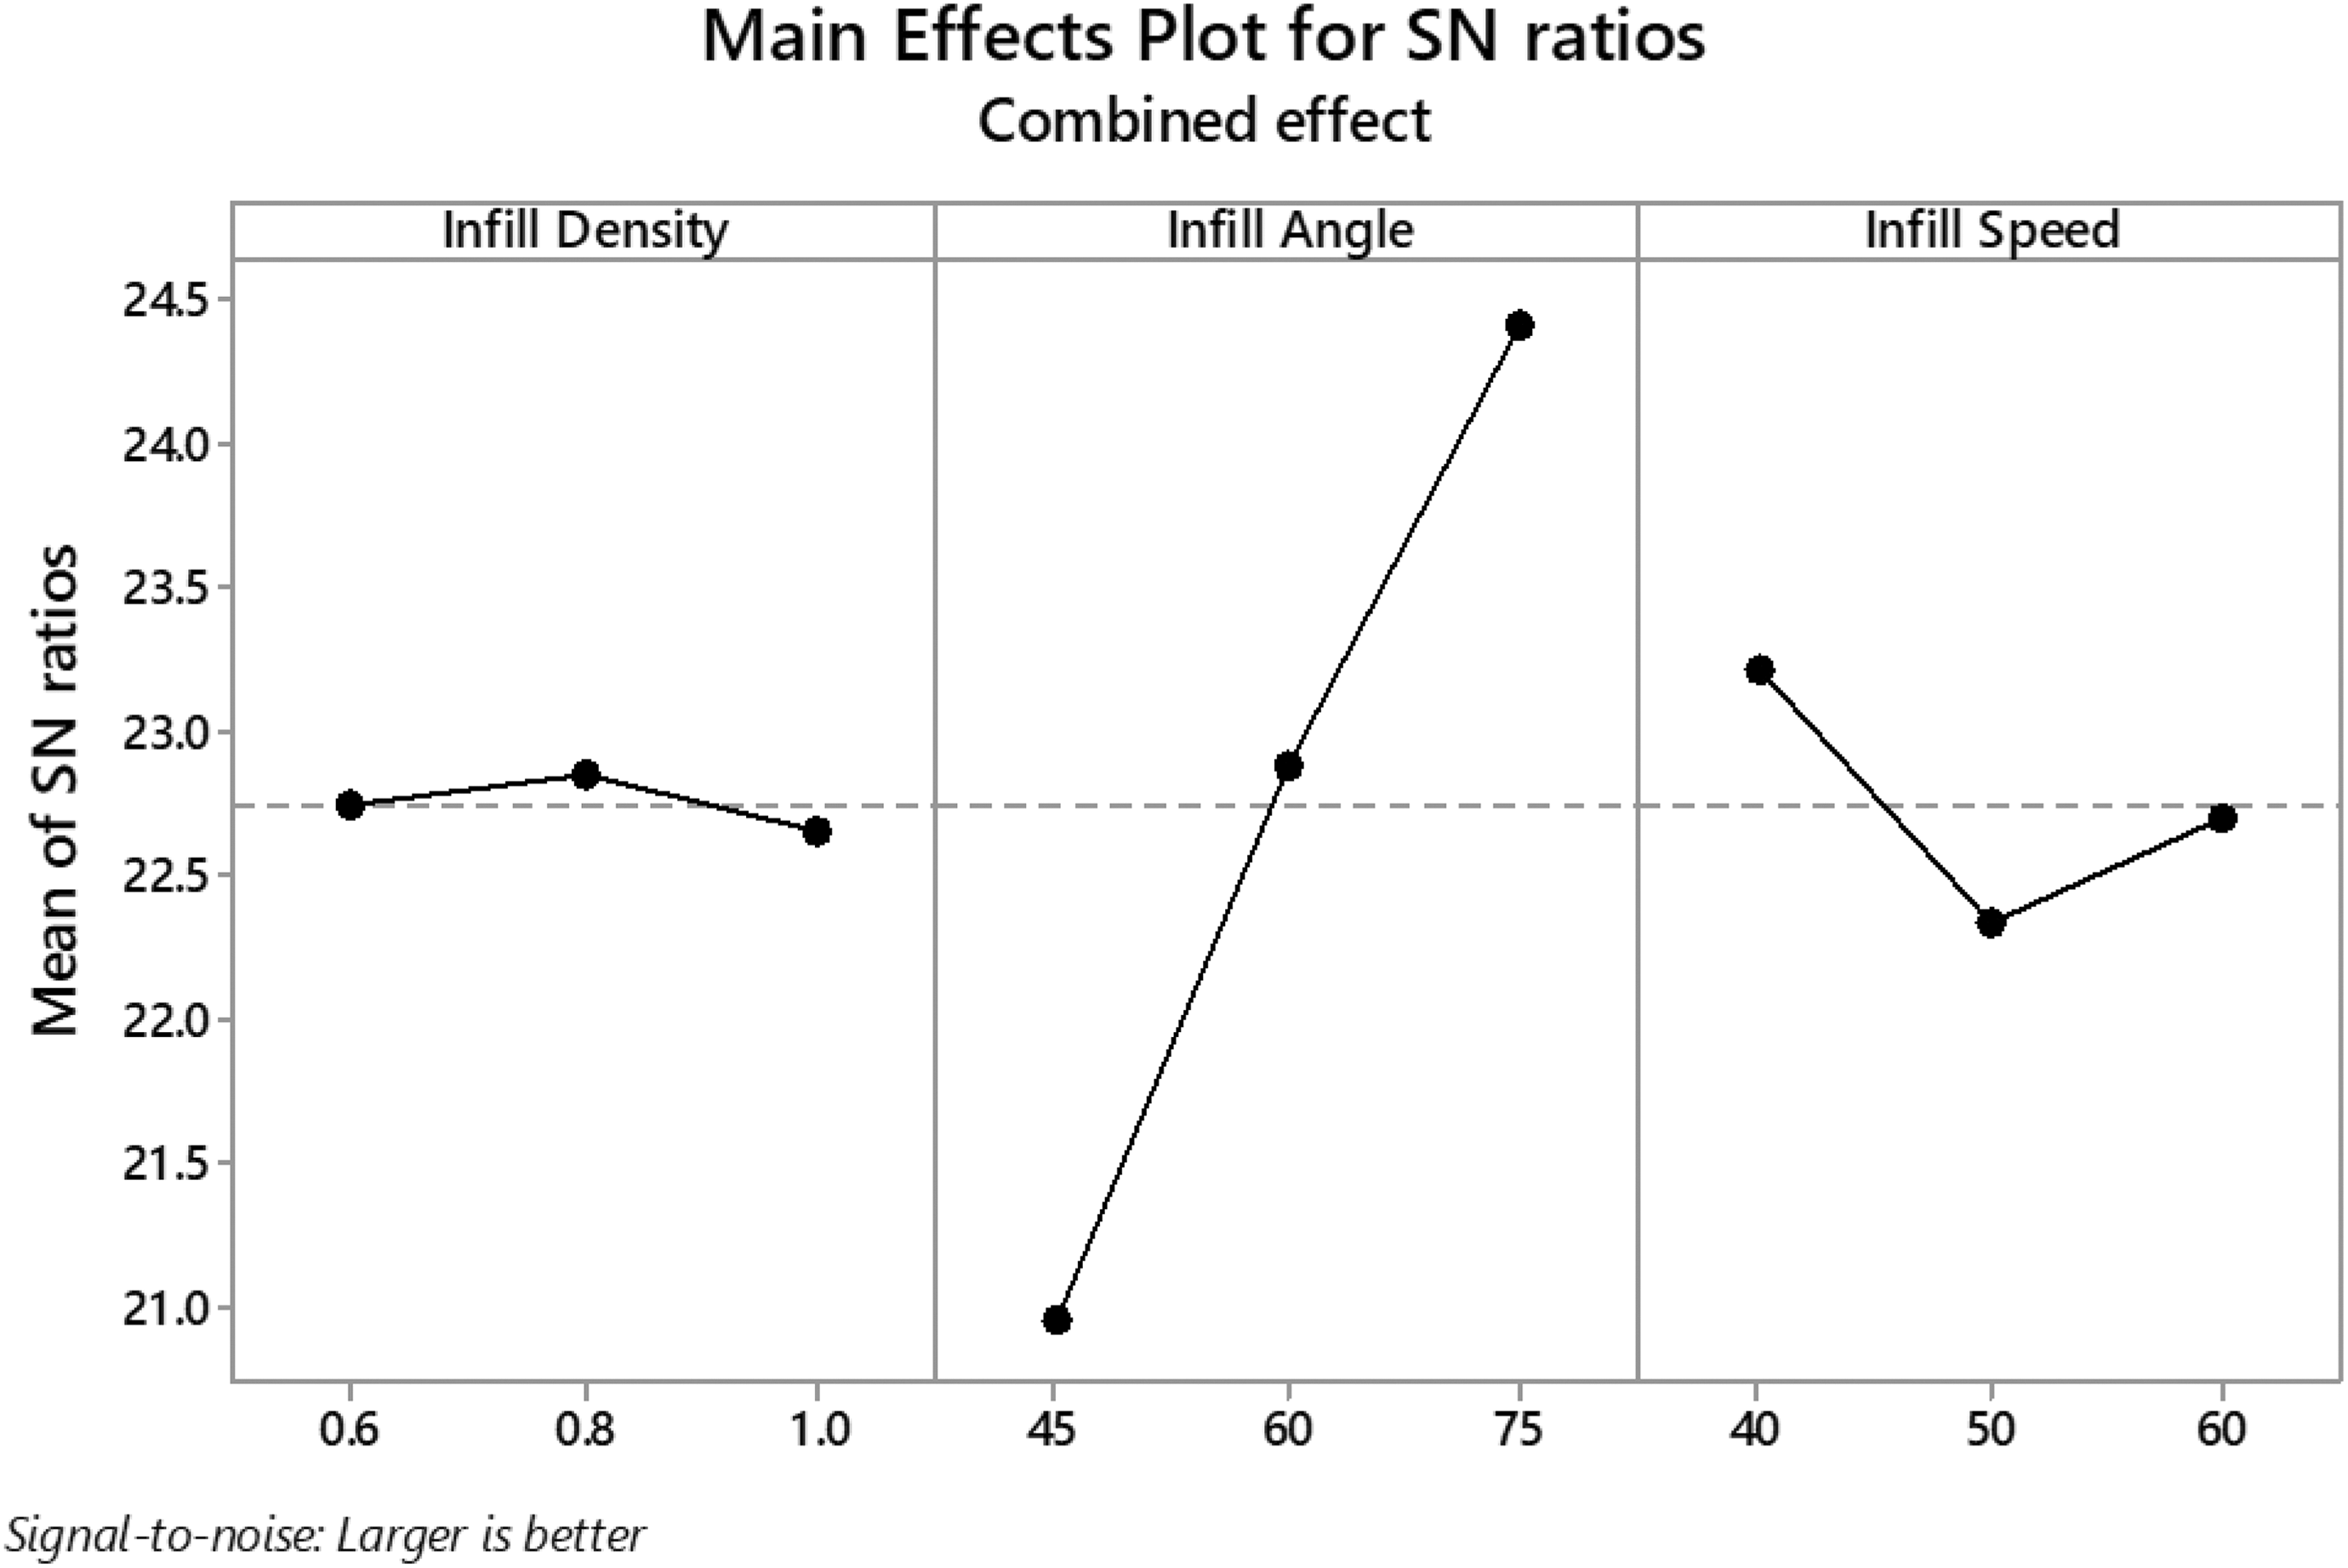
Combined S/N plot for FDM process optimization. S/N: signal to noise; FDM: fused deposition modeling.
It is to be noted that contribution of infill density can be neglected as p value of this parameter is more than 0.05. Hence from the above discussion, it can be ascertained that infill angle contributes maximum for dimensional accuracy and hardness of the part printed on FDM. Further, after analyzing, the optimum settings as suggested by multifactor optimization technique came out as level 2 of infill density (i.e. 80%), level 3 of infill angle (75°), and level 1 of infill speed (40 mm/s), indicating part prepared under L6 section as per Table 7. So, photomicrograph of all the faces of this part prepared was observed (Figure 8).
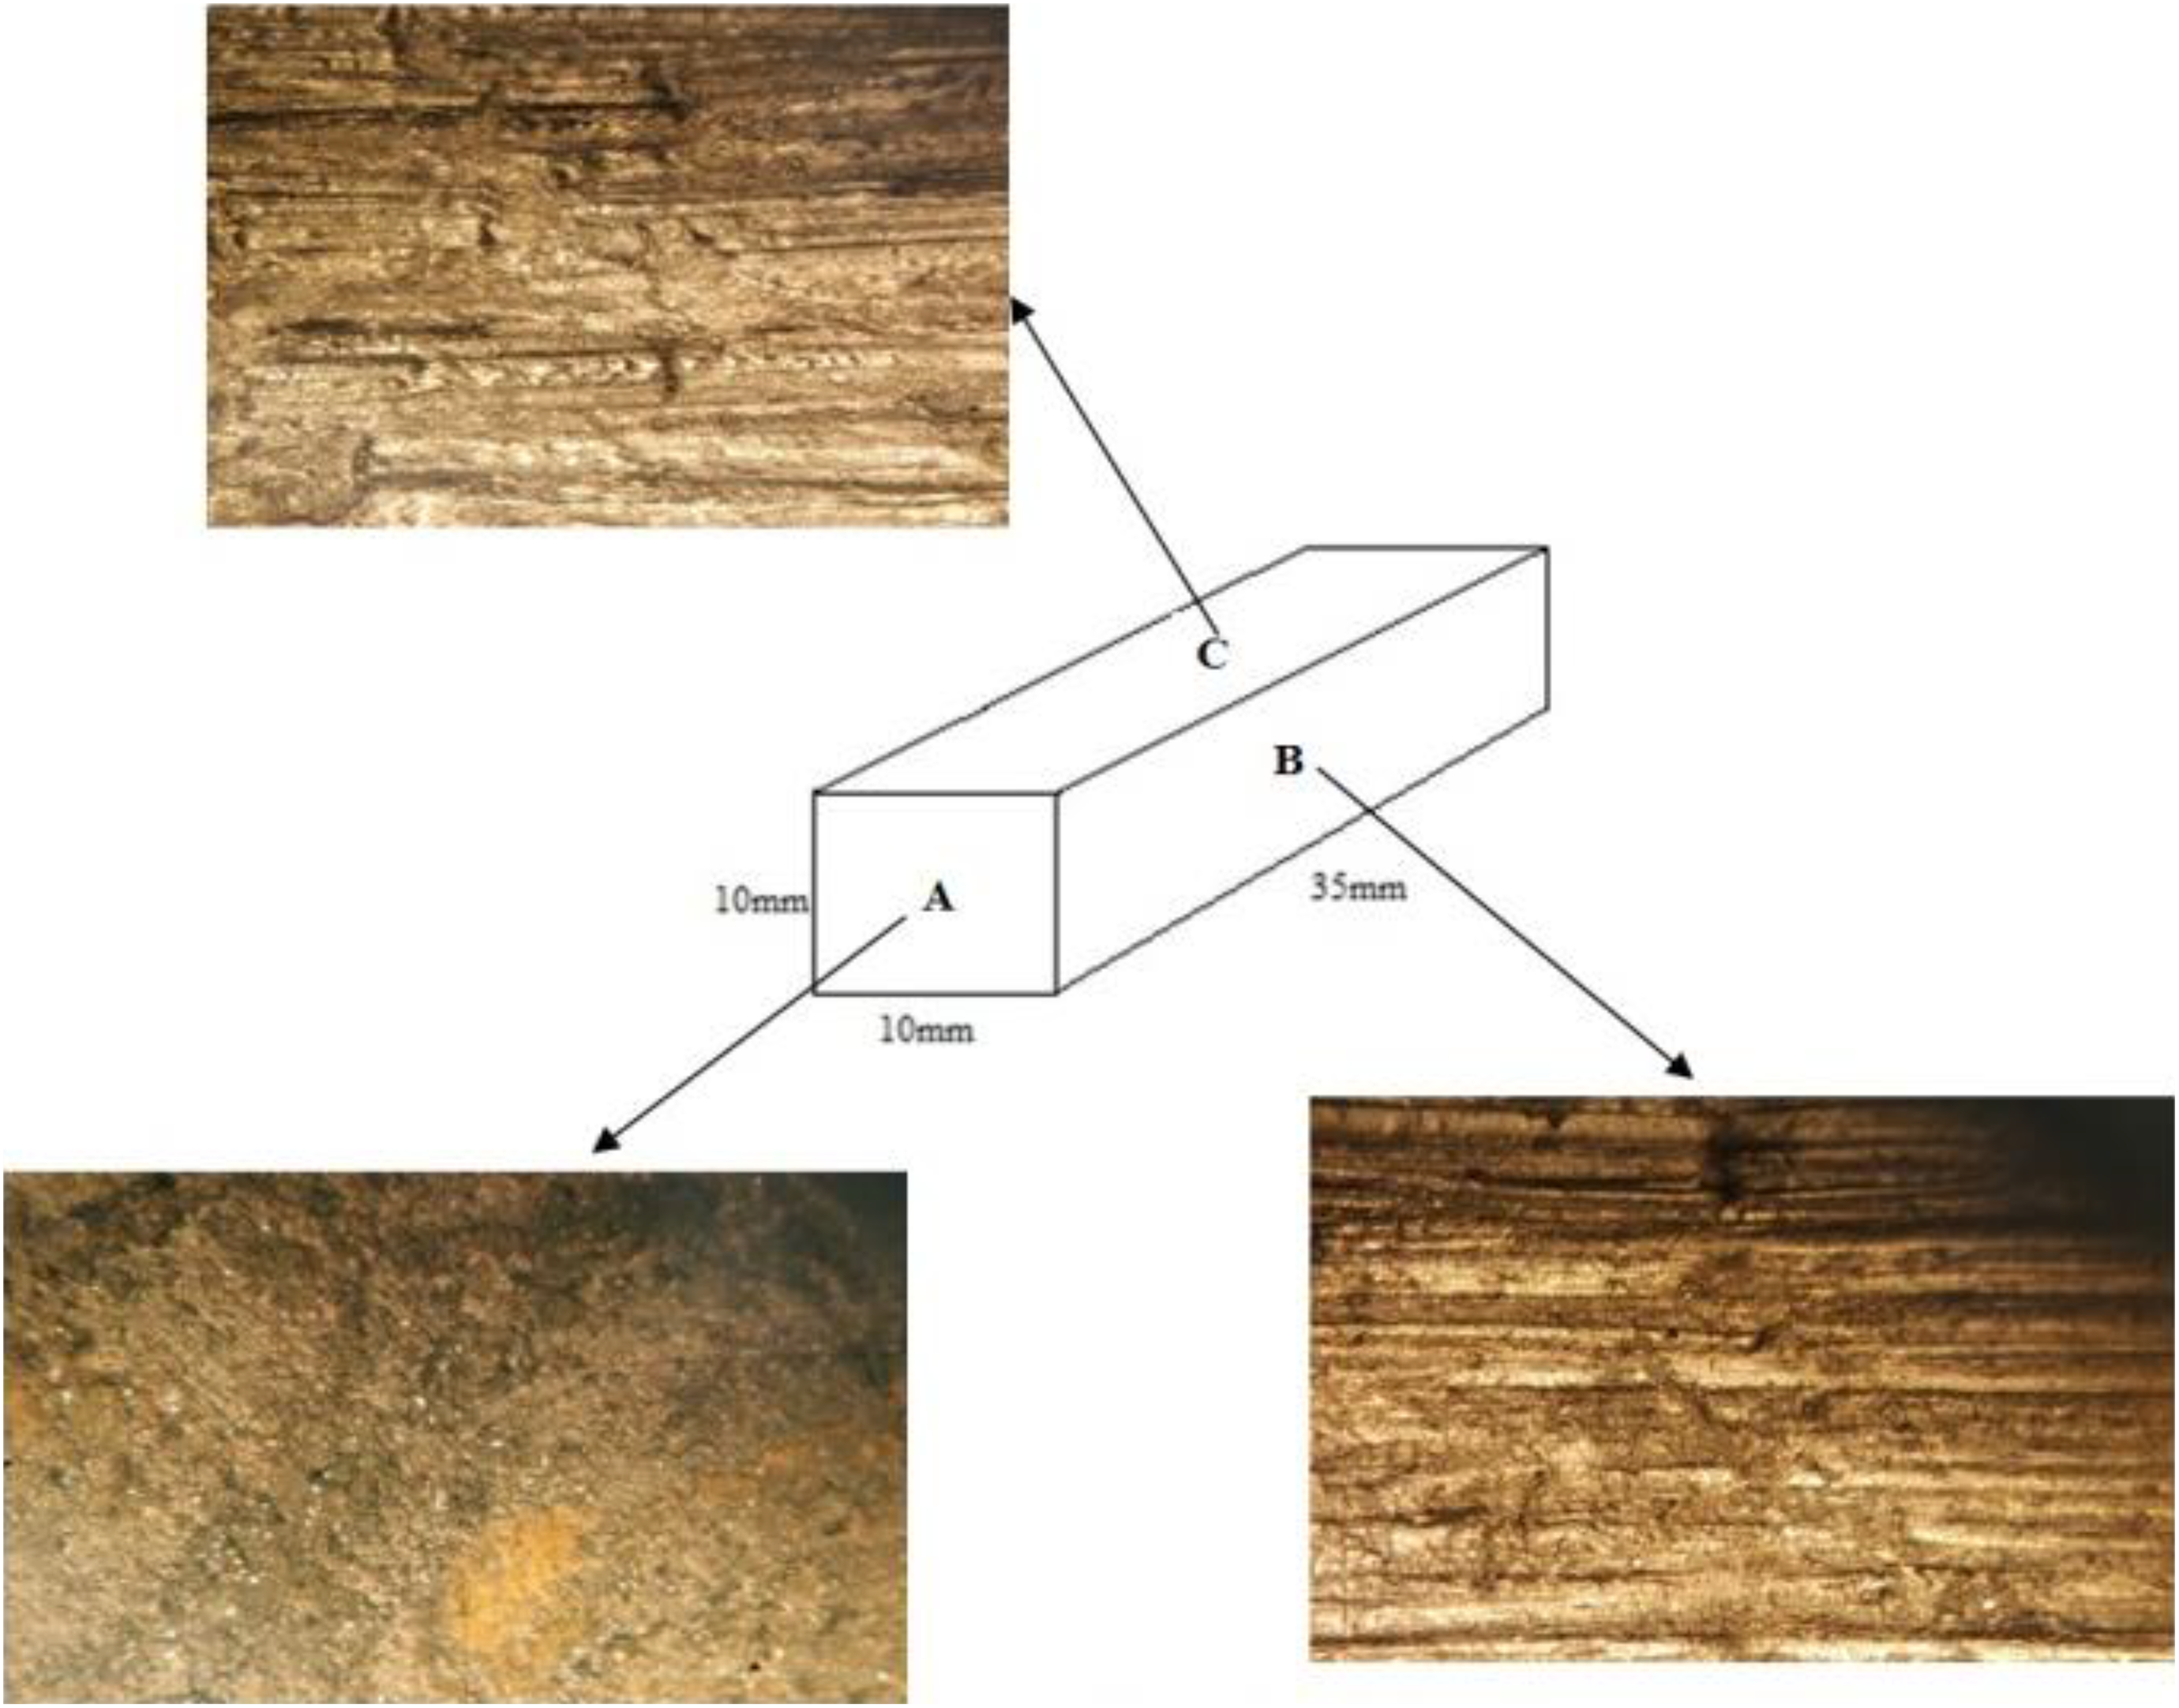
Photomicrograph of different faces of best benchmark prepared.
As observed from Figure 8, face A (uniform distribution of Al2O3 of DPS) is prominent, which may be useful for machining applications especially in milling, whereas faces B and C highlight staircase effect of different layers prepared with FDM. Finally, thermal analysis of benchmark prepared was done using DSC technique on Mettler Toledo DSC (Schweiz). The thermal plot for this sample is shown in Figure 9. During DSC analysis, the sample is heated using a controlled temperature gradient with a defined heating rate, thereby heat flow difference is measured by comparing sample to reference. This technique is very useful for small quantity of samples. 17 –19 Repetitions were necessary to eliminate any sort of effect arising from contamination and prestored history. First cycle has probably removed the above-said effect. Further melting range of the material can be clearly seen in graph in hatched area, that is, 126°C to 129°C. Melting of material starts at 126°C and goes to 129°C. Enthalpy in that melting range was counted to be −94.34 mJ with a trend. In the first cycle of the DSC testing, a heaped hatched curve was seen after the melting of LDPE. This shows the decomposition of some substance but surely this is not LDPE, as LDPE decomposes above 300°C. So, this might be the decomposition of some of the contamination present in the form of pigment (color).
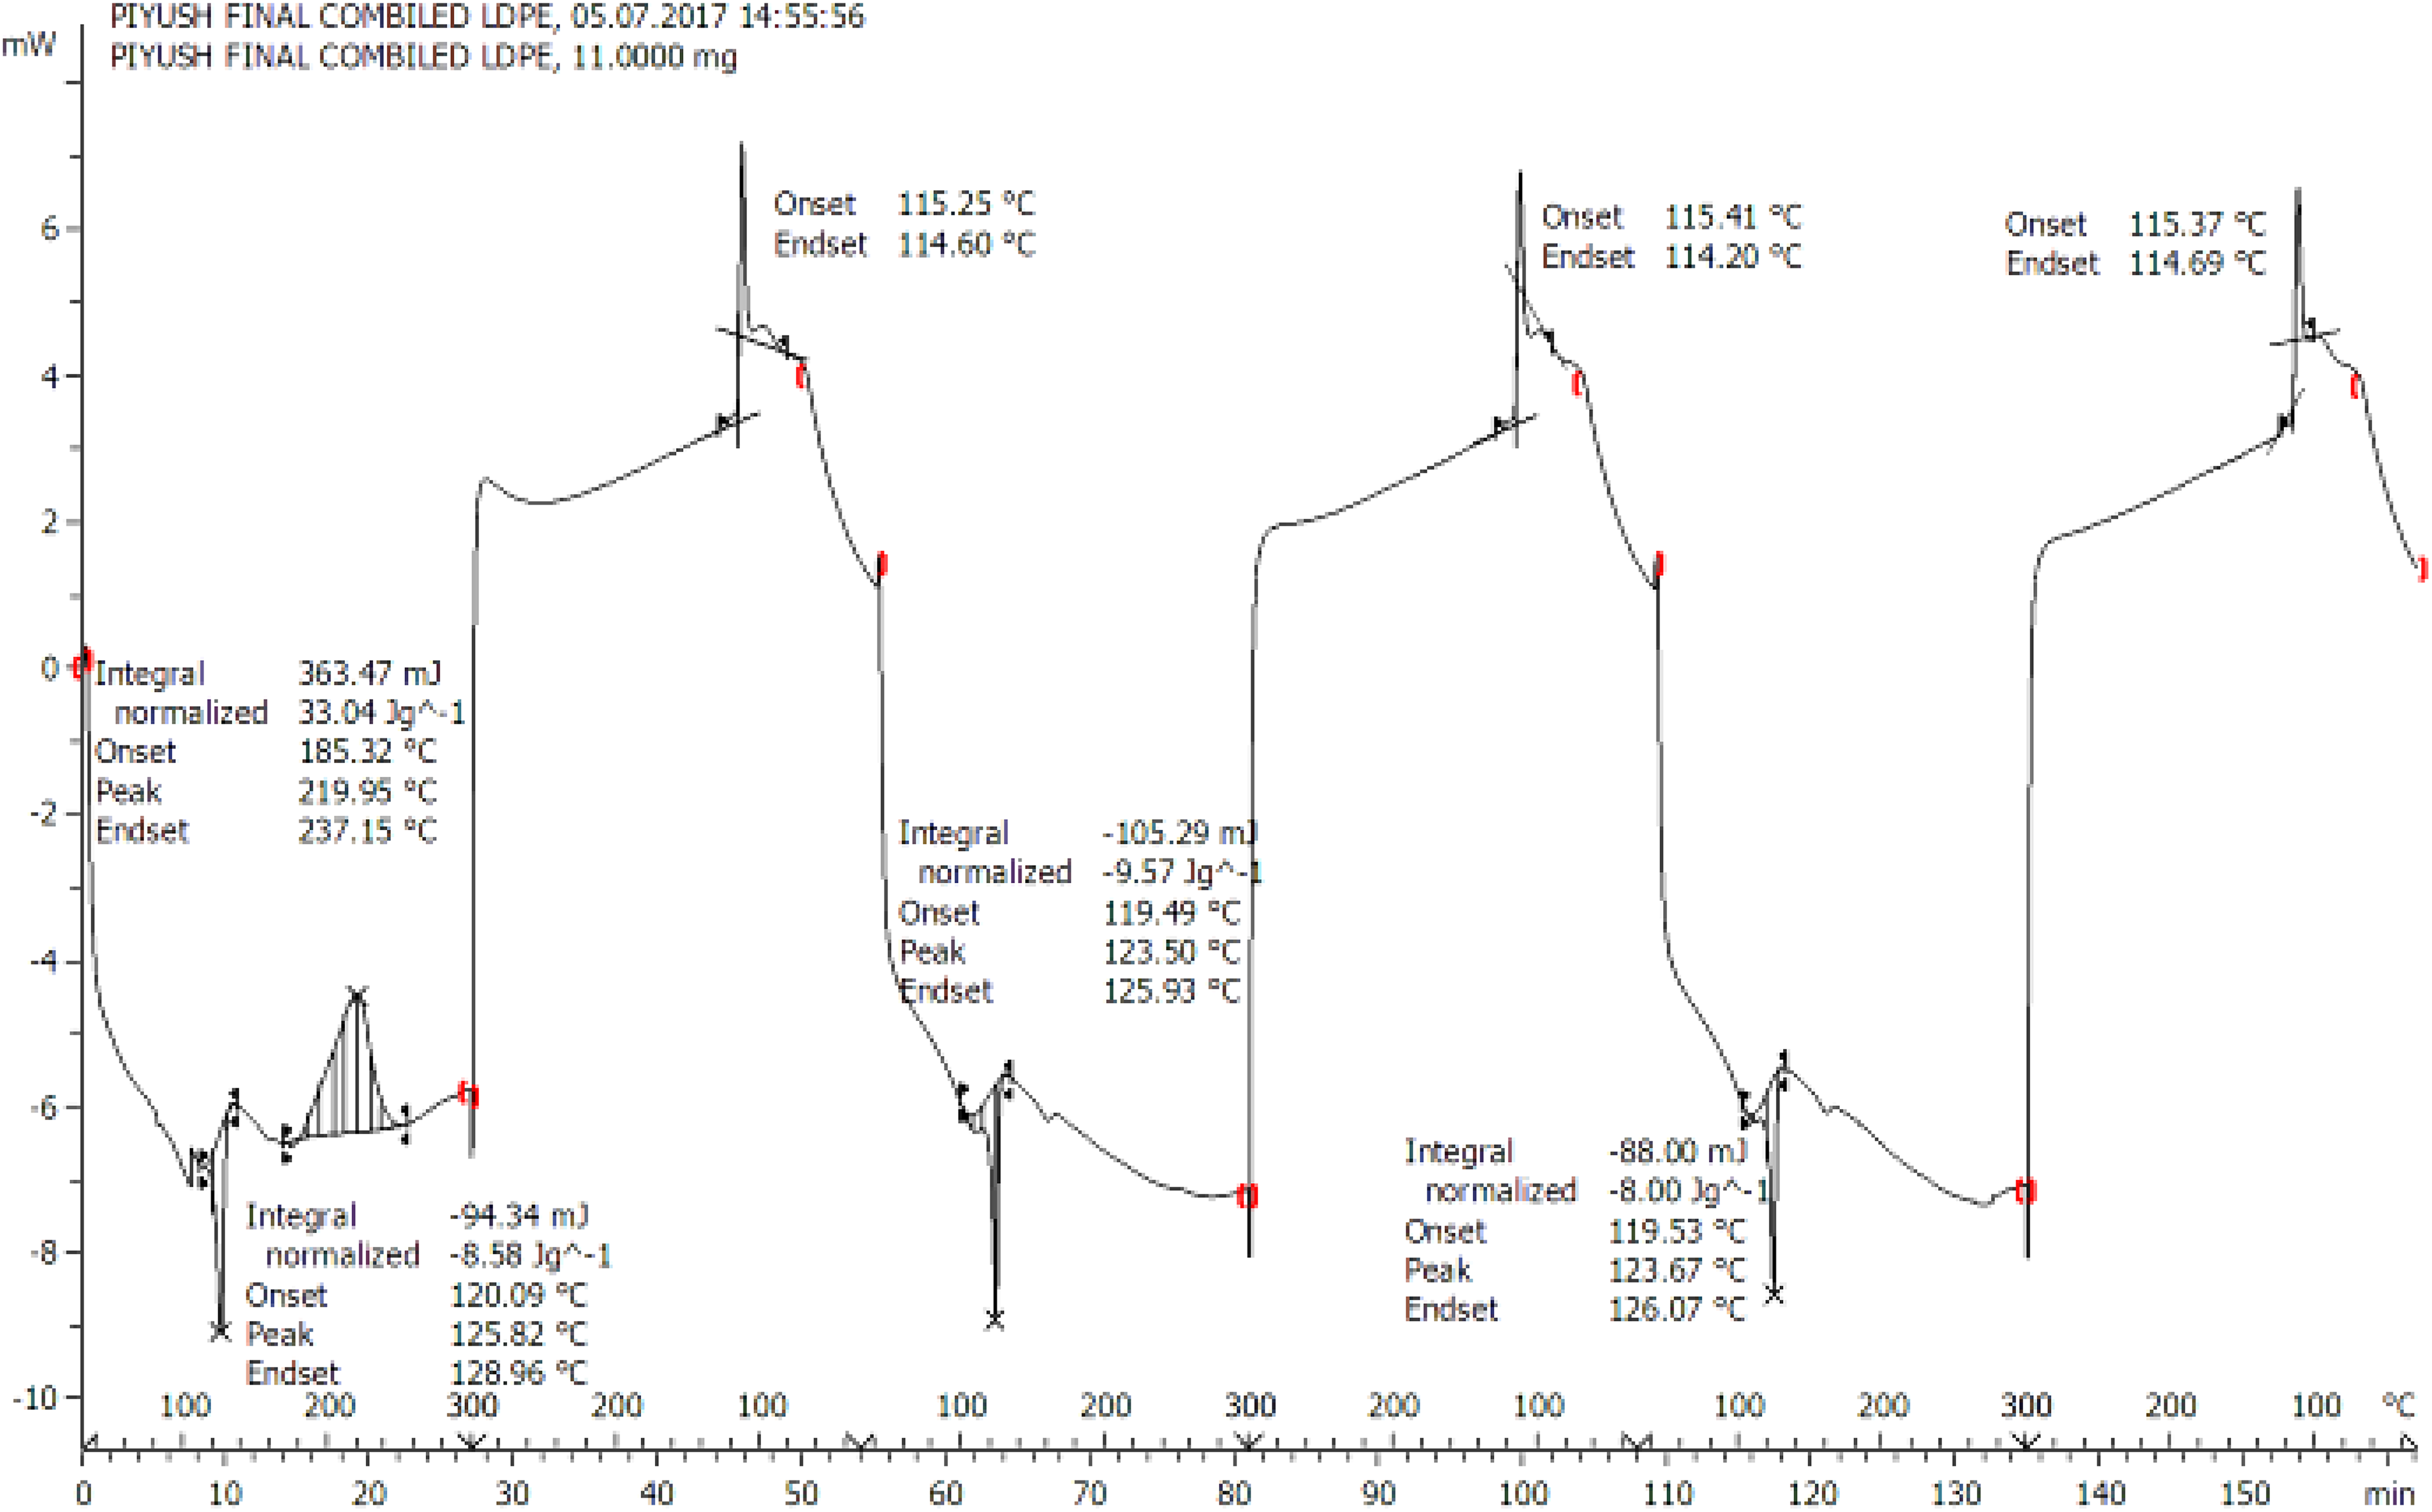
DSC plot for sample L6 as per Table 6. DSC: differential scanning calorimetry.
After that, cooling cycle starts and sudden cooling can be seen as straight vertical line. It can be easily observed that there is no evidence of decomposition of LDPE. Some uniformity has been observed in second and third cycles also without any evidence of LDPE decomposition. After three cycles of heating, no significant effect was observed in terms of melting and decomposition of material, thus it can be ascertained that the part prepared from such filament wire will have higher life cycle. These results are in line with the observations made by other investigators. 8,9
Conclusions
Following are the conclusions from this study: The results of study highlight that Al2O3-based DPS reinforcement resulted in the betterment of the mechanical properties of the feedstock filament. Hence the functional parts prepared from LDPE, requiring better mechanical properties, may be reinforced with Al2O3. Better mechanical properties have been achieved with LDPE composition/proportion as 50% by weight, Al2O3-400G as 25% by weight, Al2O3-500G as 25% by weight, load 5 kgf, RPM 35, and temperature 155°C. These results are at 95% confidence level. Further, DSC analysis concluded that the part prepared at proposed parametric settings will have higher life cycle (within given range of working temperature) as there is no evidence of decomposition found after three repeated cycles of heating and cooling. The dimensional accuracy and surface properties of the parts prepared with DPS Al2O3–reinforced LDPE are best when prepared at infill density (i.e. 80%), infill angle (75°), and infill speed (40 mm/s).
Footnotes
Funding
The author(s) disclosed receipt of the following financial support for the research, authorship, and/or publication of this article: This work was financially supported by the Department of Science and Technology, Ministry of Science and Technology (Government of India; award ID: TSG/NTS/2014/104).