
Abstract
Carbon fibers (CFs) were surface treated using nitric acid (HNO3). Afterward, polyamide 6/acrylonitrile–butadiene–styrene (PA6/ABS)-based hybrid nanocomposites containing 10 wt% of HNO3-treated short CFs and 0, 2, 5, and 8 wt% of calcium carbonate (CaCO3) nanoparticles were produced using a counter-rotating twin-screw extruder and injection molding machine. Scanning electron microscopic observations showed the formation of strong interaction between surface-treated CFs and polymer matrix. Dynamic mechanical thermal (DMTA) and thermoanalytical assessments were carried out. DMTA results indicated considerable improvements of storage modulus and viscose damping, in a wide range of temperature, by incorporating surface-treated CFs and CaCO3 nanoparticles. The glass transition temperatures of composites were noticeably greater than that of neat polymer because of the restriction effects of the fibers and nanoparticles on polymer chain mobility. Surface-treated CF and CaCO3 inclusions considerably elevated the heat of fusion and crystallinity. Results of thermogravimetric analyses indicated noticeable higher thermal stability against decomposition for composites as compared to the neat polymer. The adhesion of PA6/ABS polymer to surface-treated CFs and the presence of nanoparticles in polymer–fiber interphase were considered to be the key factors in determining the properties of composites.
Introduction
Carbon fiber (CF)-reinforced composites are progressively used in advanced structural applications due to their outstanding mechanical and thermal properties. 1 However, the mechanical performance of a polymer/CF composite is dependent upon the interfacial interaction of two corresponding phases. 2 The interfacial adhesion between CFs and polymer matrix is intrinsically poor. 3,4 This has been attributed to the fact that the oxygen-containing functional groups at the surface of CFs are very few. 5 Surface modifications such as oxidation, 5 grafting, 6 and plasma 7 treatments may improve the adhesion between CFs and polymer matrix.
Polyamide 6 (PA6) or nylon 6 is one of most important engineering thermoplastics that is semicrystalline in nature and has been widely employed in many industrial applications owing to its superior properties such as high tensile strength, good thermal stability, high creep resistance, low dielectric constant, and good chemical resistance. However, the primary drawbacks of PA6 are sensitivity to notch, brittleness at low temperatures, and water absorption. 8,9 PA6 can be mixed with other thermoplastic polymers to improve its performances. Acrylonitrile–butadiene–styrene (ABS) has been considered as a good candidate to be blended with PA6. ABS also comes within the category of engineering polymers and offers relatively good strength and high impact toughness. However, it has some shortcomings including susceptibility to chemical solvents and natural sensitivity to heat. 10 The main reason behind blending PA6 with ABS is to yield improved notch impact resistance. On the other hand, without using a suitable compatibilizer, the blend of PA6/ABS is immiscible due to the polar structure of PA and the nonpolar structure of ABS. 11
Recently, polymer nanocomposites have attracted many attentions in either academia or industry. Moreover, it is observed that the addition of nano-sized particulates into the fiber-filled thermoplastic polymers has synergistic effects on improvement of mechanical properties. 9 Among different mineral nanoparticles, calcium carbonate (CaCO3) is widely used in polymer nanocomposites due to its high modulus, isotropic structure, and ease of dispersion. 12,13
Many engineering applications of plastics require enduring harsh conditions of mechanical loads and heat. In these situations, dynamic mechanical thermal analysis (DMTA) can provide better assessment of long-term performances of polymeric systems when compared to simple standard mechanical tests. DMTA has been widely employed to investigate the viscoelastic behavior of materials over a wide range of temperatures or frequencies. DMTA can provide the storage modulus (E′), loss modulus (E″), and loss factor (tanδ) values of materials against temperature. The storage modulus value is related to the maximum energy that is elastically stored during deformation. The loss modulus relates to viscose response and indicates the capability of a material to dissipate energy as heat. The loss factor is the ratio of loss modulus to storage modulus and reaches its maximum value at glass transition temperature (Tg). The employments of fibers and mineral nanoparticles can considerably affect stored and lost energies and heat resistance of polymeric systems.
The addition of short CF into the PA6 elevated storage and loss moduli remarkably. 8 Rahmat et al. investigated the dynamic mechanical properties of PA6/ABS (60/40) blend systems compatibilized with ABS-grafted maleic anhydride (0, 1, 3, and 5 wt%) and reinforced with short glass fibers (10–30 wt%). They found noticeable increases of storage and loss moduli. 14 The simultaneous usage of glass fibers and CaCO3 nanoparticles in ABS/PA6 blend raised storage modulus. 15 The existence of CaCO3 nanoparticles in polymer matrix elevated both glass transition and thermal degradation temperatures. 16 The dispersion condition of nanoparticles in polymer matrix, fiber surface treatment, and blend morphology directly affect the mechanical and thermal behavior of multiphase hybrid nanocomposites. 17
This research aims to study the effects of nitric acid (HNO3)-surface treated carbon fiber (HSCF) and CaCO3 (CC) nanoparticle inclusions on the dynamic mechanical thermal behavior of PA6/ABS-based hybrid composites. In addition, scanning electron microscopy (SEM), thermogravimetry and non-isothermal differential scanning calorimetry (DSC) studies of different samples were accomplished.
Materials and methods
Materials
PA6/ABS (60/40) containing 3 wt% of metallocene polyethylene grafted maleic anhydride compatibilizer was supplied by KimiaforozTM (Iran). CFs (T700) was obtained from Torayca, Tacoma, WA, USA. The diameter of CFs was about 7 µm and they were chopped into short fibers of 3–4 mm in length. Cubic nano-precipitated CaCO3 with the average particle size of 40 nm was provided by NanoMaterials Technology Ltd (Singapore). The nanoparticles had stearic acid coating to promote their uniform dispersion in the polymer matrix.
Sample preparation
Short CFs were oxidized by immersing them in concentrated HNO3 for 2 h at 120°C. Afterward, distilled water was used to remove the residues of HNO3 from the surface of CFs and to obtain natural PH. Short CFs and PA6/ABS granular pellets were dried in an oven at 80°C for 24 h. Different composite samples were prepared by melt mixing process using a counter-rotating twin-screw extruder (Z-veiwellen/Collin, Germany). The diameter and length to diameter ratio of the extruder screw were 25 and 16 mm, respectively. The temperature of extruder from feed zone to die was set at 190°C, 200°C, 210°C, 220°C, and 230°C, respectively. The screw speed of the extruder was set at 60 r min−1. The compositions of all the samples are listed in Table 1.
Samples codes and compositions.
ABS: acrylonitrile–butadiene–styrene; PA6: polyamide 6; CaCO3: calcium carbonate; CF: carbon fiber.
PA6/ABS pellets and CaCO3 nanoparticles were mechanically mixed and fed through the main extruder hopper, while CFs were fed from the side feeder of extruder. The composite compounds obtained from extruder were ground into small pellets and then dried in oven at 80°C for 24 h. To prepare DMTA samples, the extruded compounds were injection molded into straps of 60.00 × 13.00 × 3.20 mm3 at melt temperature of 240°C and injection pressure of 80 bar.
Characterizations
Morphology observations
The surface of CF, before and after HNO3-surface treatment, was observed and characterized using SEM and Energy-dispersive X-ray spectroscopy (EDX) analysis. To study the dispersion conditions of ABS and short CFs in PA6 and the extent of interfacial adhesion between treated CFs and polymeric matrix, SEM images were taken from the notch impact fractured surfaces of specimens. Prior to SEM observations, ABS phase was stained dark with chloroform and all samples were coated with a thin layer of gold. The average diameter of dispersed ABS particles in PA6 was calculated using ImageJ software (ImageJ6, Developer: LOCI, University of Wisconsin, Wisconsin, United States).
DSC analysis
The melting enthalpy and crystallinity of different samples were examined using DSC (Jade, PerkinElmer, Shelton, CT). The sample weight was 5 mg, and for each test, the sample was heated from 25°C to 250°C at a scanning rate of 10°C min−1. The peak temperature of heating scan was taken as melting temperature and the peak area was used to determine the melting enthalpy and crystallization rate.
Dynamic mechanical thermal analysis
DMTA was performed by employing a Tritec 2000 dynamic mechanical analyzer (Triton Technology, UK) in a single cantilever bending mode with a fixed frequency of 1 Hz, displacement amplitude of 0.025 mm, and preload of 0.23 N on specimens with effective length of 15.00 mm. The temperature fluctuated from 20°C to 180°C at a rate of 5°C min−1. Storage modulus (E′), loss modulus (E″), and tandelta (tanδ) values against temperature were measured.
Thermogravimetric analysis
Thermogravimetric analyses (TGA) were carried out in a nitrogen atmosphere using a TA instruments-Q50 thermogravimetric analyzer. Firstly, the sample powders with an average weight of 20 mg were placed uniformly in a platinum crucible. Then, a heating cycle incorporated to probe the thermal degradation pattern and the thermal stability of samples. The heating initiated from room temperature and ended at 630°C with a rate of 10°C min−1.
Results and discussion
Morphology observations
Figure 1 illustrates the CF before and after HNO3-surface treatment. No major defect is observed on the CF after surface treatment. The surface treatment affected the surface texture of CF to some extent. The roughness of CF is evidently increased and deeper grooves were formed on fiber; this may lead to higher polymer–fiber mechanical interaction in composite. The result of EDX analysis of CF, before and after HNO3-surface treatment (Figure 2 and Table 2), indicates the existence of oxygen and nitrogen elements on the surface of CF after treatment, and hence supports the successful surface oxidation of CF.
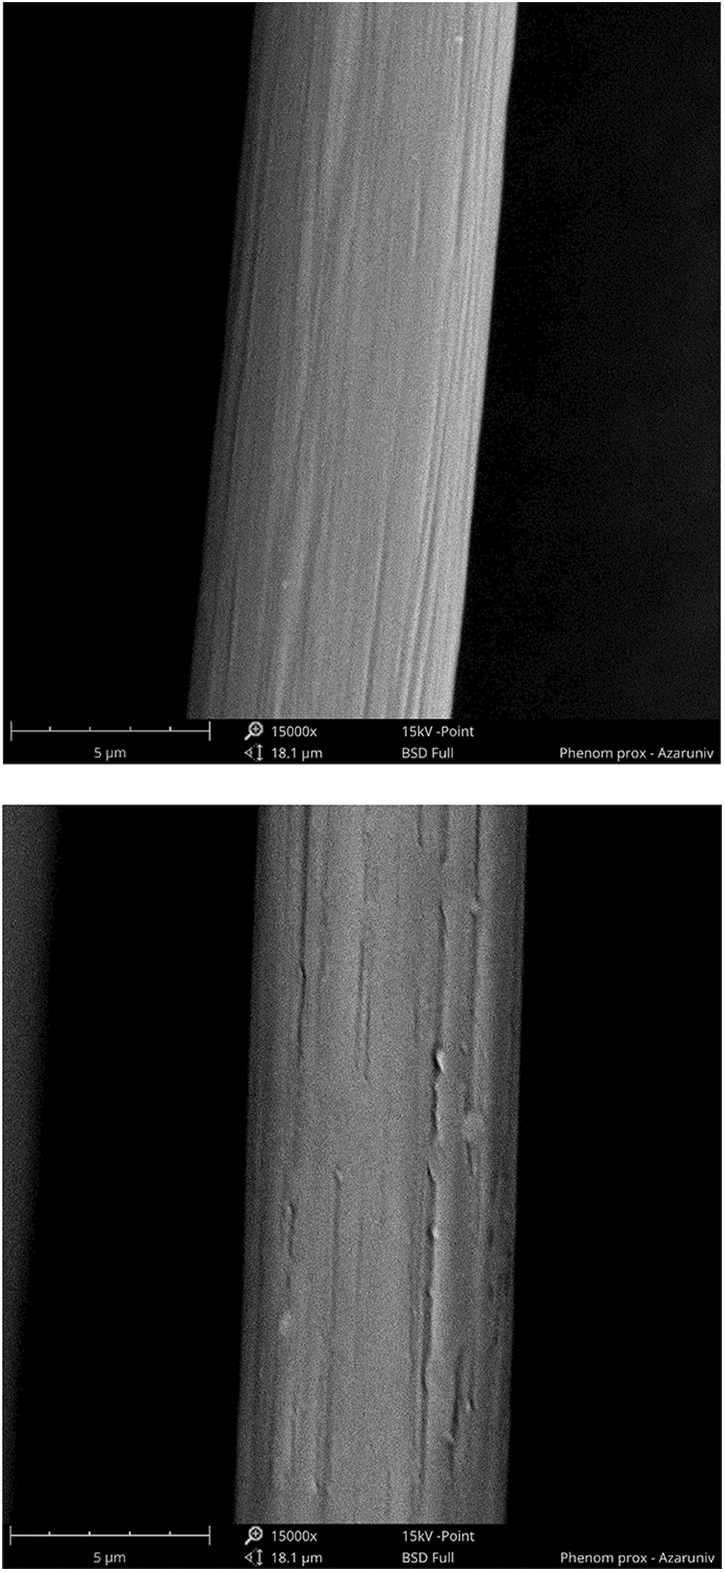
SEM of carbon fiber: before (top) and after (bottom) surface treatment.
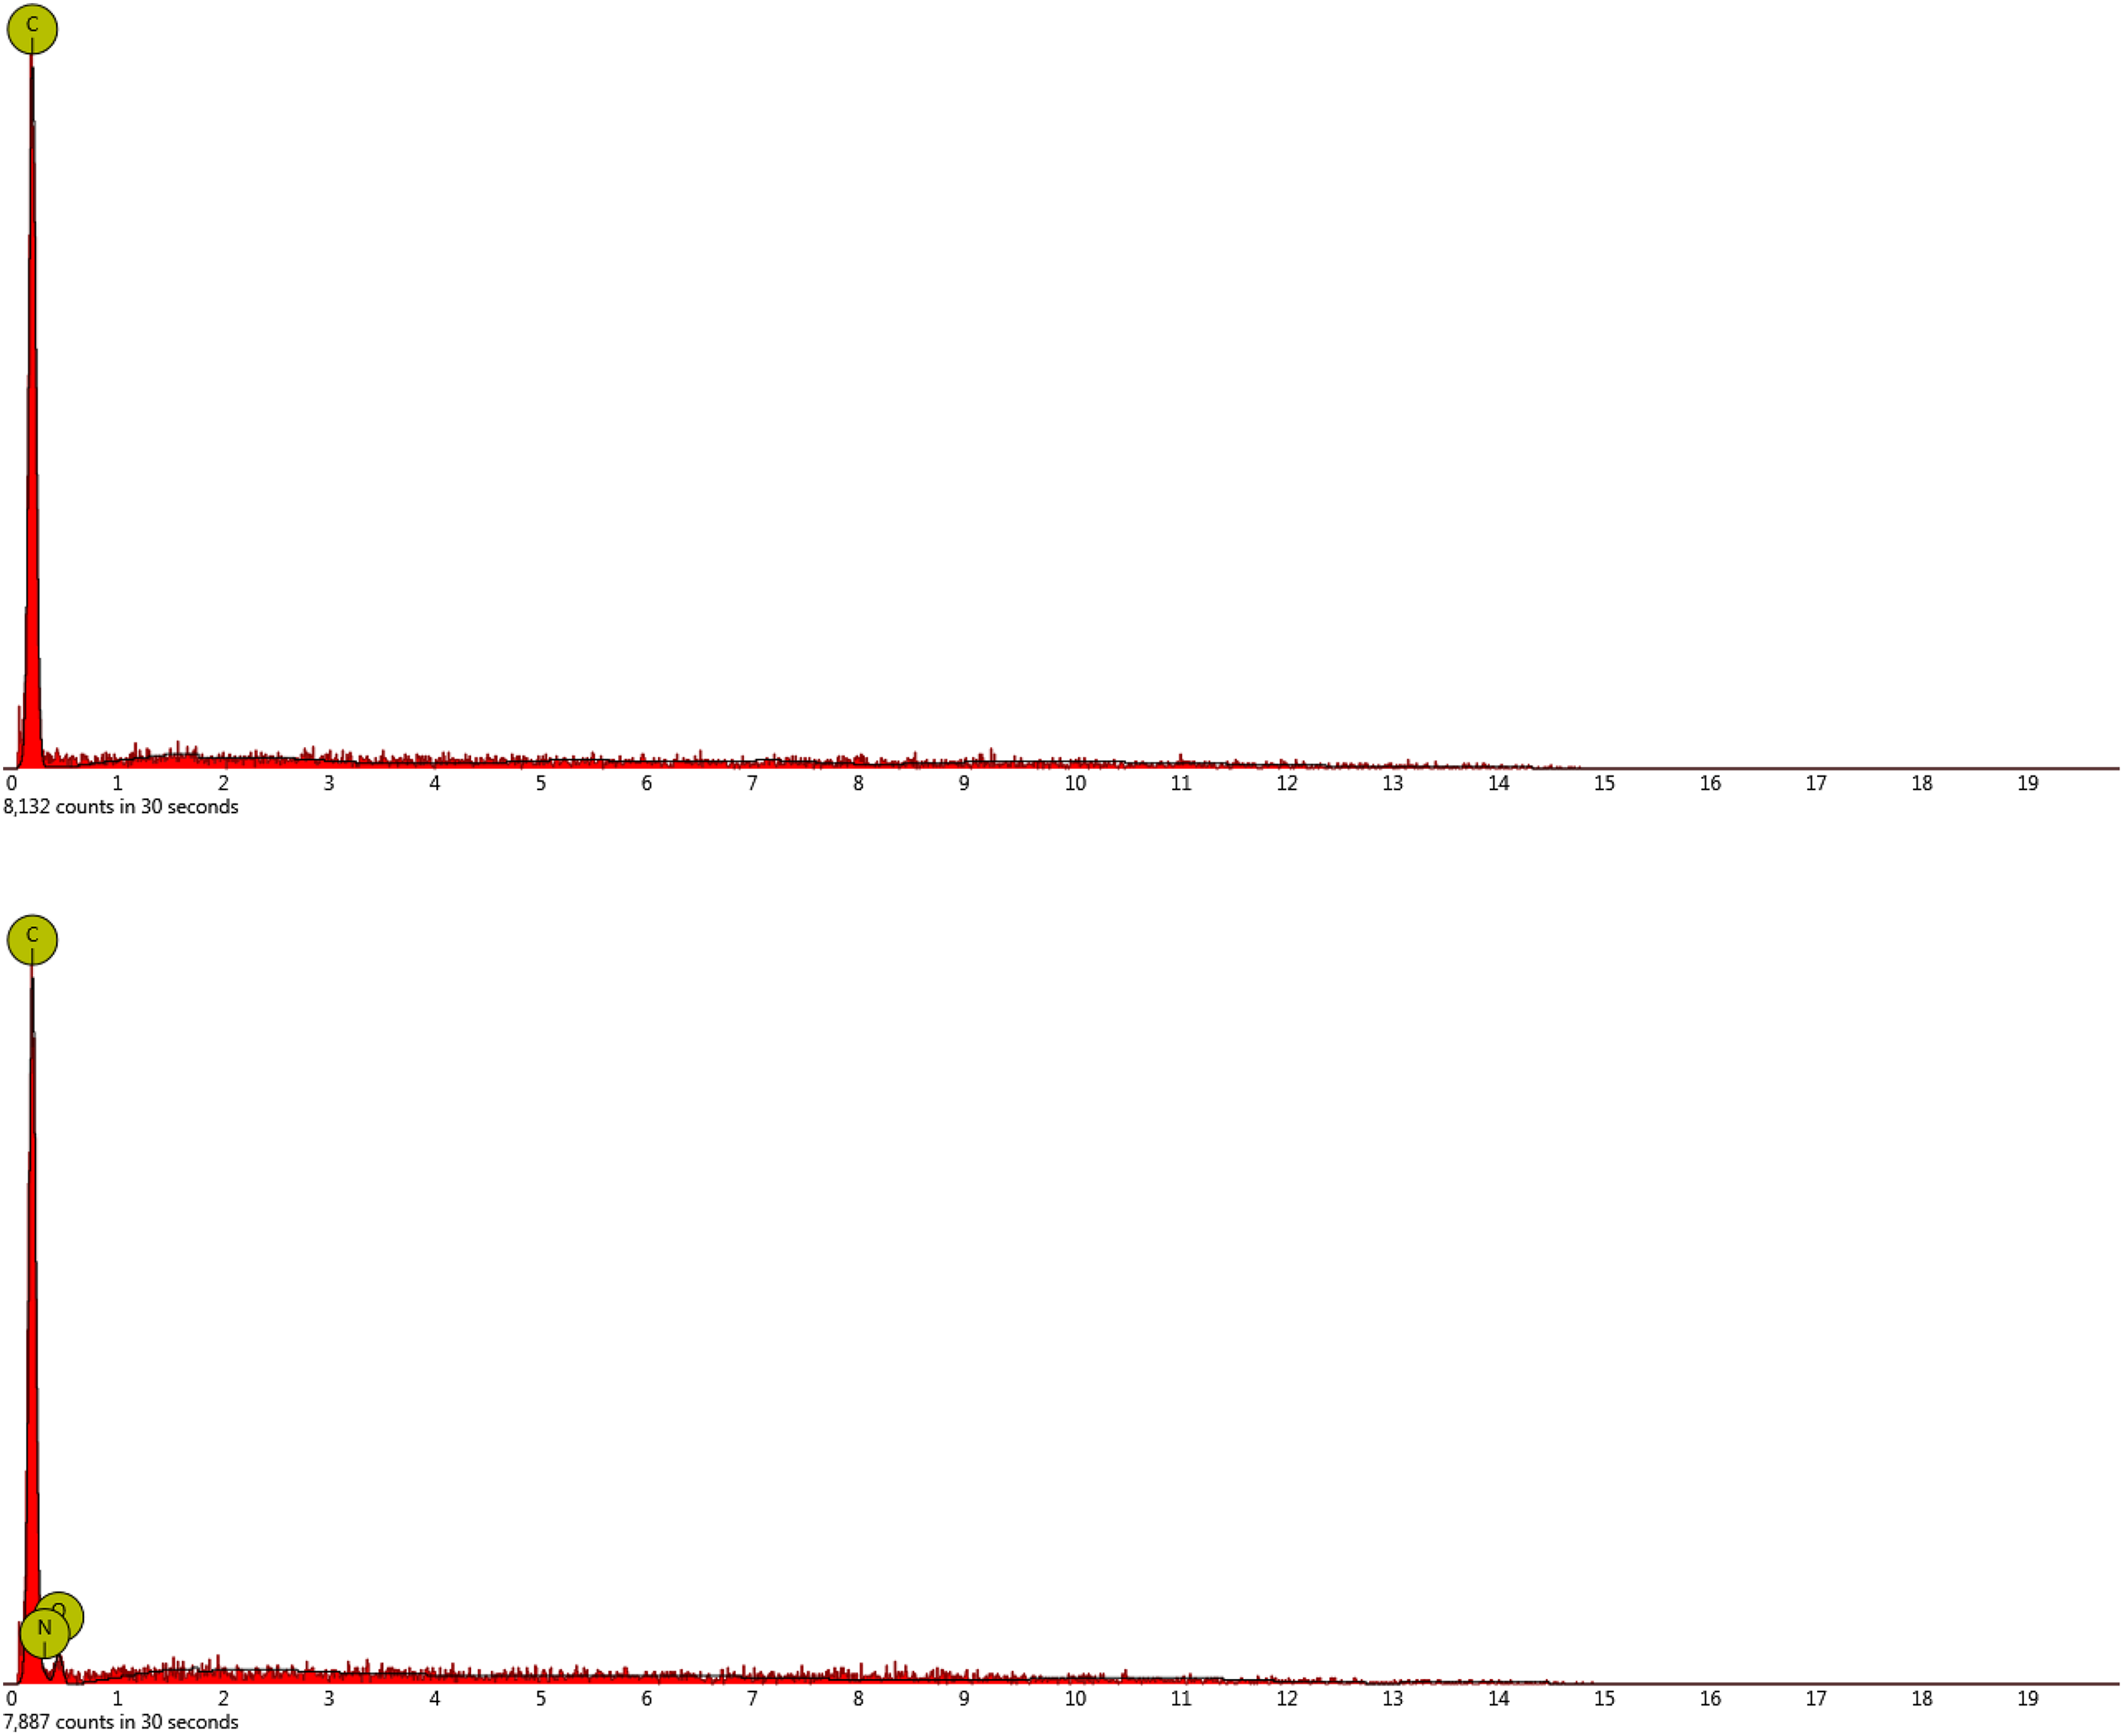
EDX analysis of carbon fiber: before (top) and after (bottom) HNO3-surface treatment.
The results of EDX of CF.
CF: carbon fiber.
Figure 3 shows the distributions of ABS phase and HSCFs in PA6 for various samples. The ABS phase has been successfully stained dark with chloroform. Surface-treated CFs are uniformly dispersed throughout the polymeric matrix (Figure 3(b) to (e)). With incorporations of surface-treated CFs (10 wt%) and nano-CaCO3 (2 wt%), the average size of ABS droplets reduced from 9.53 µm to 4.89 µm and 3.35 µm, respectively. The particle size of dispersed phase is dependent upon constituents melt viscosities, viscosity ratio (viscosity of dispersed phase to viscosity of continuous phase), and the interfacial tension of phases. As the melt viscosity ratio of the blend components decreases, the average droplet size of the dispersed phase reduces. 18,19
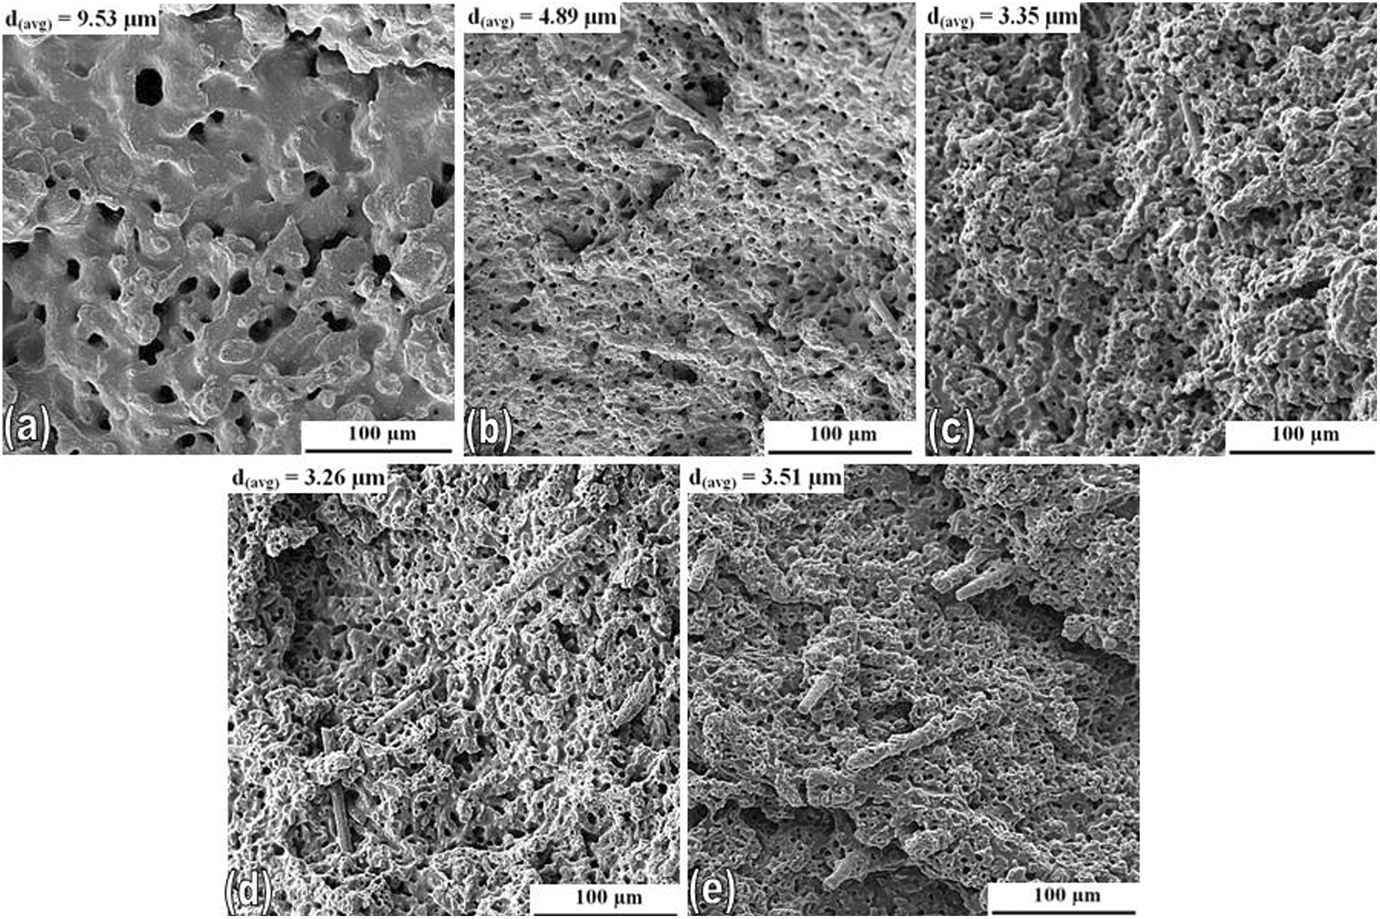
ABS and CFs distributions within various compounds: (a) CF0CC0, (b) CF10CC0, (c) CF10CC2, (d) CF10CC5, and (e) CF10CC8.
Figure 4 clearly illustrates the adhesion of polymer to fiber. The degree of fibers–polymer adhesion on pulled out CFs can ascertain the extents of stress transfer, energy loss, and absorption in composite. The surfaces of fibers are entirely covered by the polymeric sheath. This can justify that the surface treatment of CFs with HNO3 improves the adhesion between fibers and matrix.
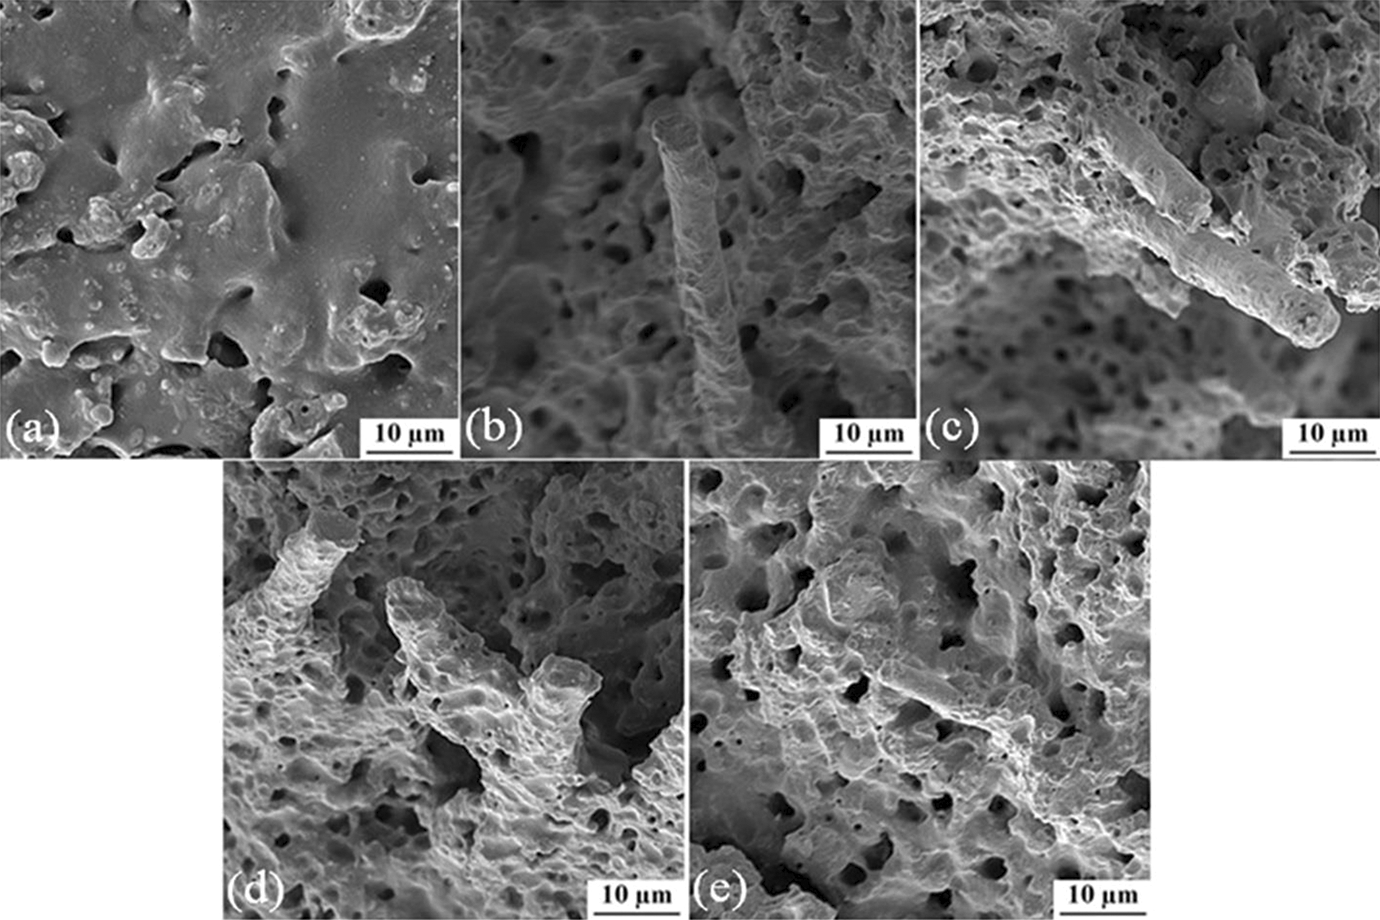
Fiber–matrix interaction: (a) CF0CC0, (b) CF10CC0, (c) CF10CC2, (d) CF10CC5, and (e) CF10CC8.
According to the close-up view from CF, shown in Figure 5, the distribution of mineral nanoparticles on the surface of CFs can be seen clearly. At high concentration of CaCO3 nanoparticles (8 wt%) in the polymeric matrix, the agglomerated nanoparticles sites unavoidably become prevalent, as indicated with arrow. The high loadings and surface tension of nanoparticles lead to clustering and agglomeration. 20
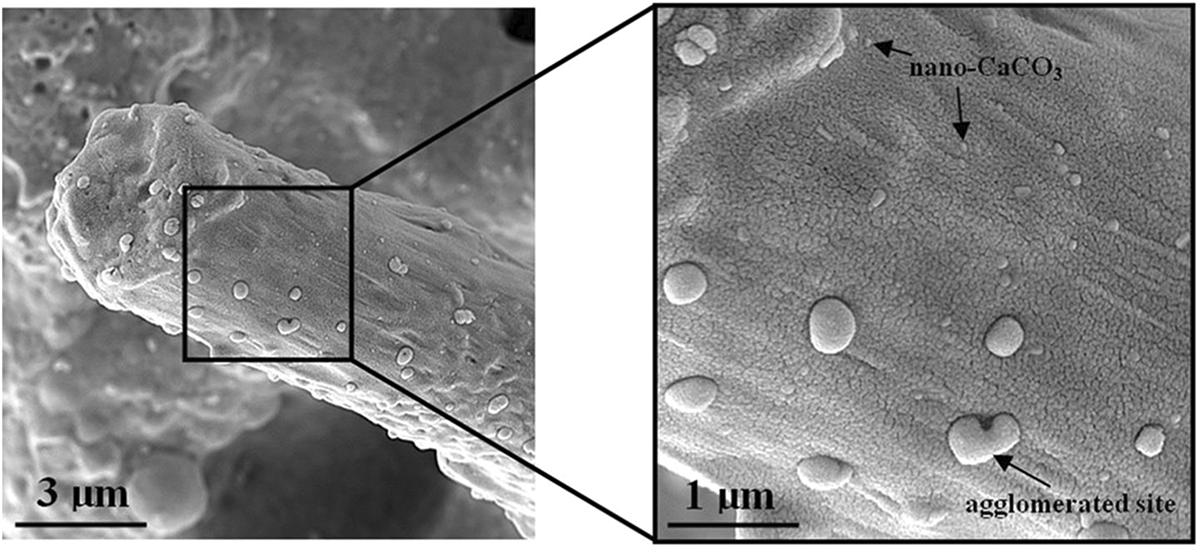
Presentations of CaCO3 nanoparticles and polymer on the pulled out CF.
Figure 6 shows composition mappings of various hybrid nanocomposites for calcium element. It is noteworthy that relatively good dispersions of the CaCO3 nanoparticles have been achieved. However, agglomerated spots are manifested as observed in Figure 6(c). Since nanoparticles have high surface energy, they have a strong tendency toward agglomeration. 21,22
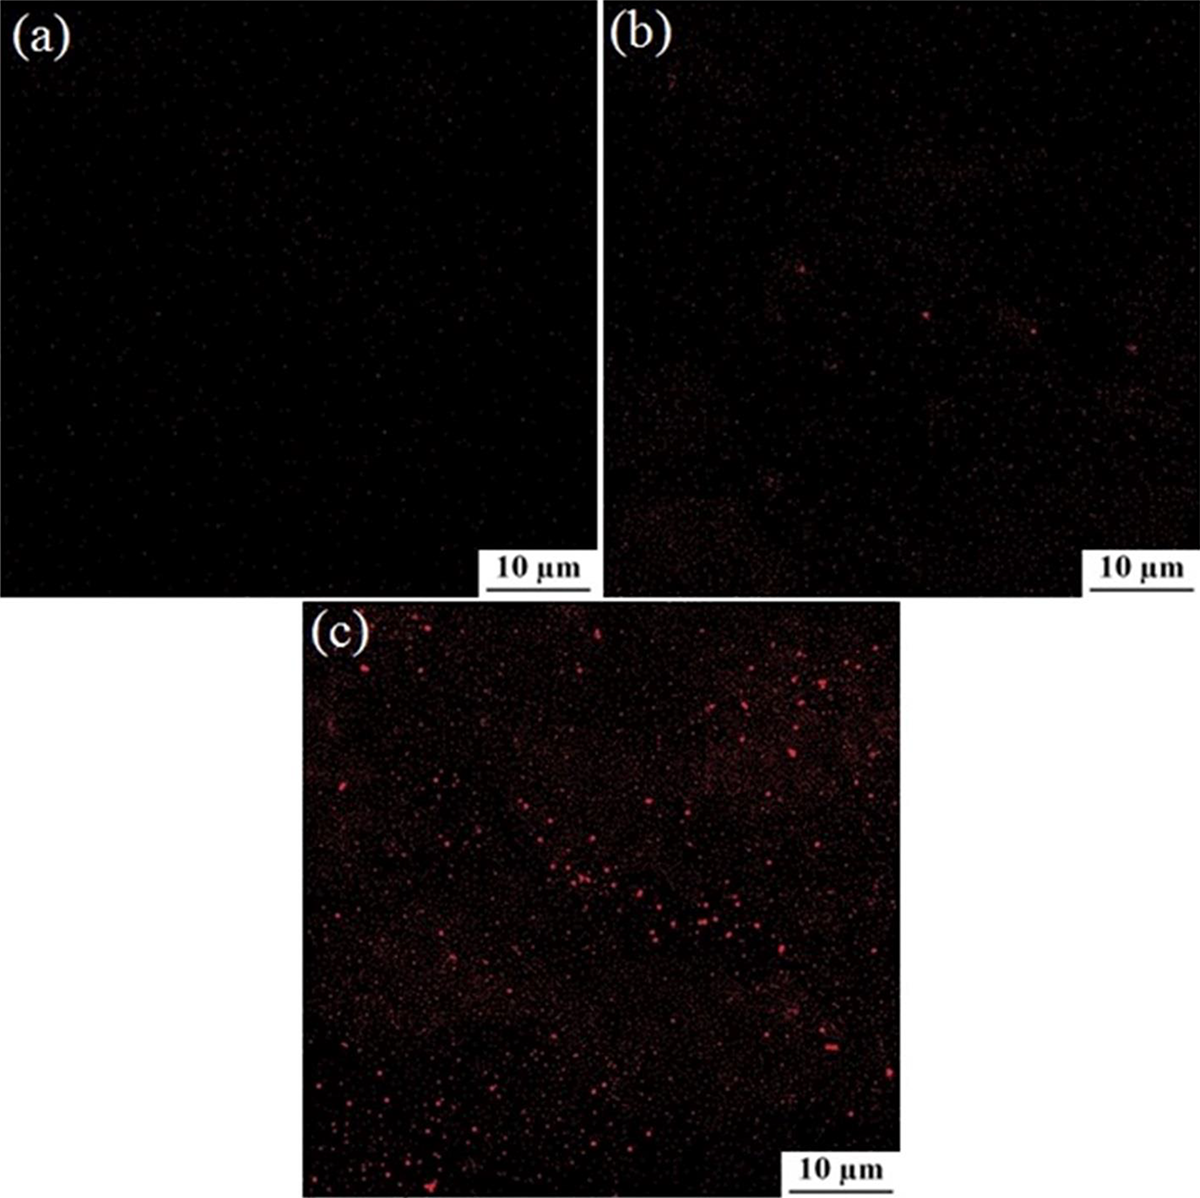
SEM-EDX mappings of Ca element: (a) CF10CC2, (b) CF10CC5, and (c) CF10CC8.
Differential scanning calorimetry
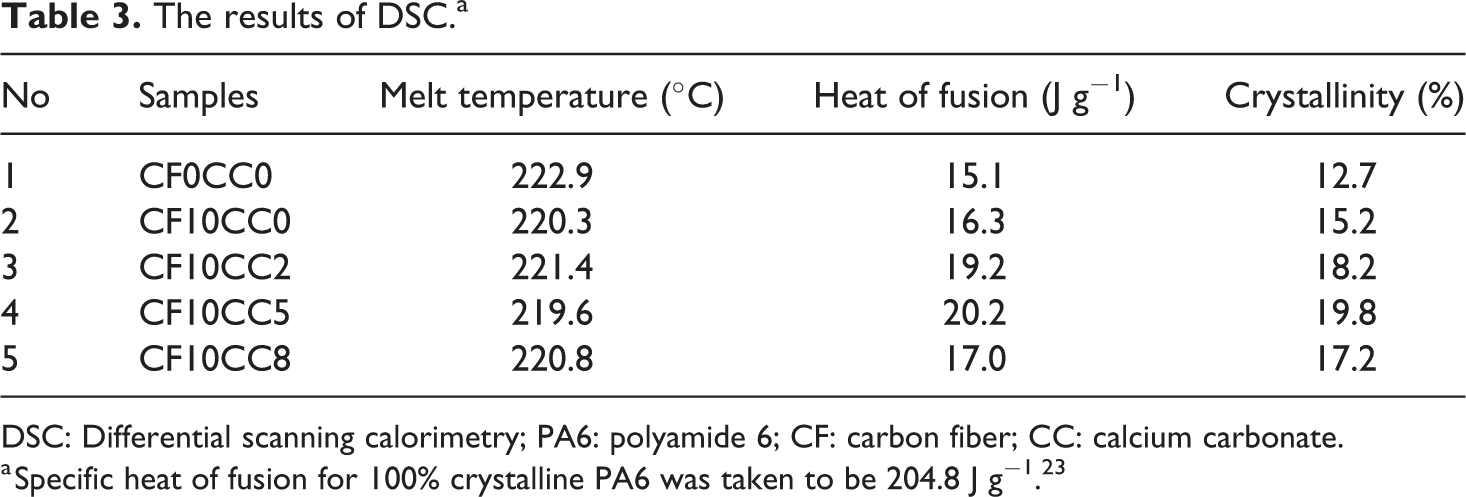
According to DSC thermoanalytical data (Table 3), the inclusions of CFs and nano-CaCO3 slightly affected melt temperature, yet noticeable increases in melt enthalpy and crystallinity were observed. Both reinforcements had crystal nucleating effects and the maximum crystallinity (19.8%) was obtained for sample containing 10 wt% CF and 5 wt% CaCO3 nanoparticles.
The results of DSC.a
DSC: Differential scanning calorimetry; PA6: polyamide 6; CF: carbon fiber; CC: calcium carbonate.
a Specific heat of fusion for 100% crystalline PA6 was taken to be 204.8 J g−1. 23
Dynamic mechanical thermal analysis
Storage modulus (E′)
Figure 7 presents the storage modulus versus temperature of PA6/ABS and PA6/ABS-based composites containing 10 wt% surface-treated CF and 0, 2, 5, and 8 wt% CaCO3 nanoparticles. It can be seen that the addition of HSCFs to PA6/ABS matrix leads to a significant increase (about 70%) of storage modulus over the entire range of temperature. The storage modulus enhancement with the addition of HSCFs can be explained by the high stiffness of HSCFs and proper stress transfer between the matrix and fibers. Strong interaction between fibers and polymer matrix hinders the mobilization of polymer chains. 24 –26 SEM micrographs demonstrates complete matrix–fiber adhesion (Figure 4) which facilitates polymer–fiber stress transfer. 4 According to Figure 7, as temperature increases, the composite state tends to change from glassy to rubbery and hence the stiffening effect of HSCFs slightly reduces. Above Tg, the stress transfer between fibers and polymeric matrix becomes less effective. 26 –29 Furthermore, the addition of CaCO3 nanoparticles into PA6/ABS/HSCF system increased the storage modulus of composite. This is mainly due to the stiffening effect of CaCO3 nanoparticles. Since CaCO3 nanoparticle has much greater stiffness than neat polymer, it restricts the dislocation of polymer chains. 30,16 In addition, according to Figure 7 and Table 3, there is a correlation between crystallinity and storage modulus. The crystalline regions have higher modulus than noncrystalline regions. 17 Moreover, the presence of nanoparticles at polymer–CF interphase (Figure 5) can form an interphase layer possessing higher stiffness as compared to neat polymer. This can promote polymer matrix–fibers stress transfer, and as a consequence, increase the storage modulus. At highest CaCO3 nanoparticle content (8 wt%), the storage modulus declined owing to the agglomeration of nanoparticles. The agglomerated mineral particles act as stress concentration spots. They also cause weak interaction between polymeric matrix and reinforcements. 16
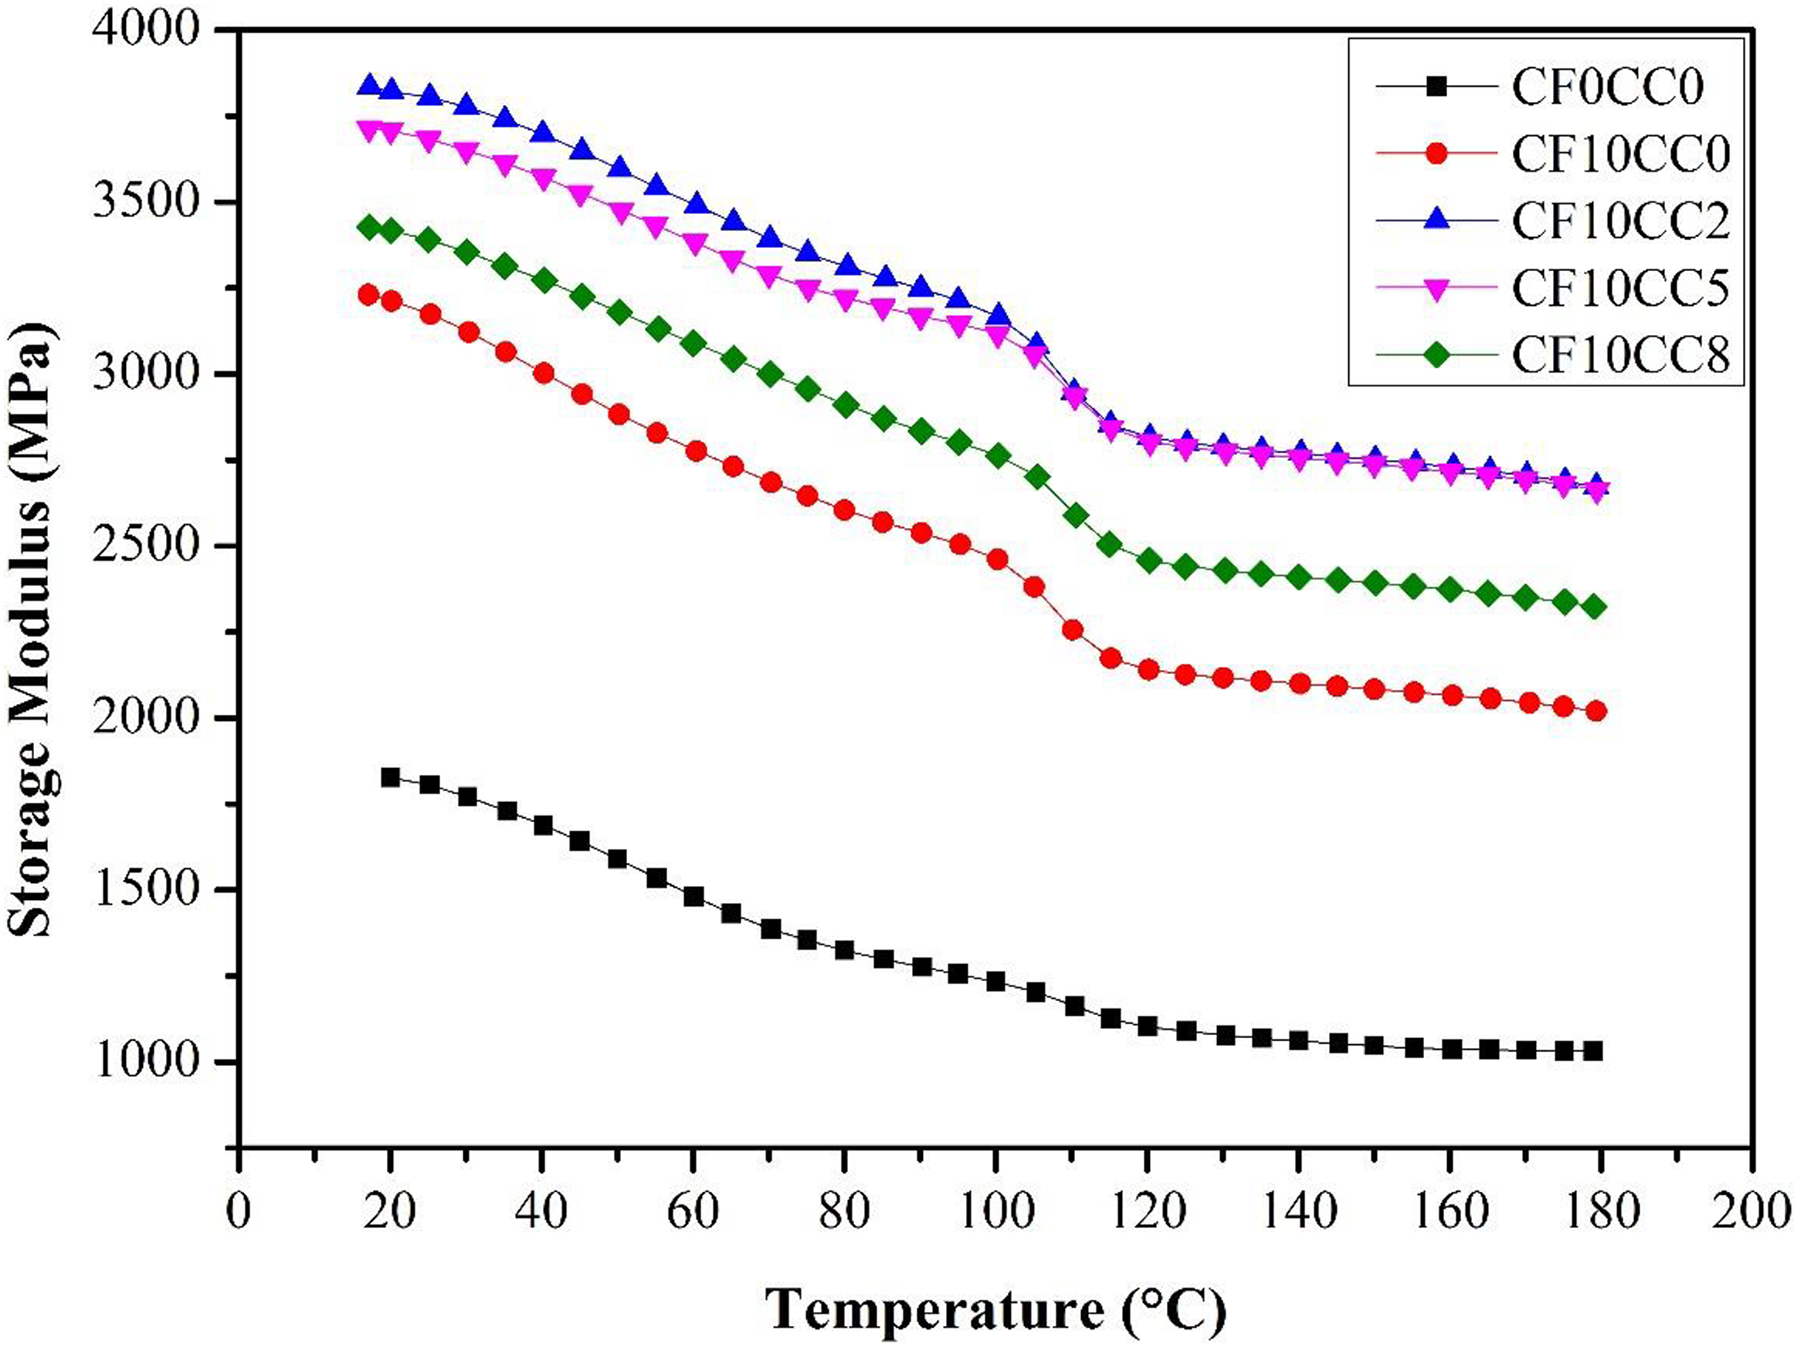
Variation of the storage modulus against temperature.
Loss modulus (E″)
The loss modulus–temperature plots for neat polymer and various composites are shown in Figure 8. By incorporating surface treated CF, the loss modulus displays a rise similar to that of storage modulus. The loss modulus generally specifies the lost energy capability and expresses the viscous damping behavior of polymer during the deformation. The lost energy corresponds to the molecular rearrangement and heat generation when material subjected to stress. The mechanical interaction of polymer chains with CF and their interfacial bonding affect energy dissipation. The increase of shear stress in matrix–fiber interface increases the energy damping. 26 According to Figure 8, the loss modulus reaches its maximum at the vicinity of Tg. As temperature goes above Tg, the loss modulus decreases. Moreover, the presence of CaCO3 nanoparticles in CF-reinforced PA6/ABS system remarkably increased the loss modulus value. This enhancement in loss modulus can be attributed to the restriction effect of homogenous dispersed nanoparticles on the mobilization of polymer chains. As it is seen from Figure 8, further addition of nanoparticles (8 wt%) slightly decreased the loss modulus value due to the agglomeration. The agglomeration of CaCO3 nanoparticles reduces specific surface area and leads to the weak interaction between nanoparticles and polymeric matrix.
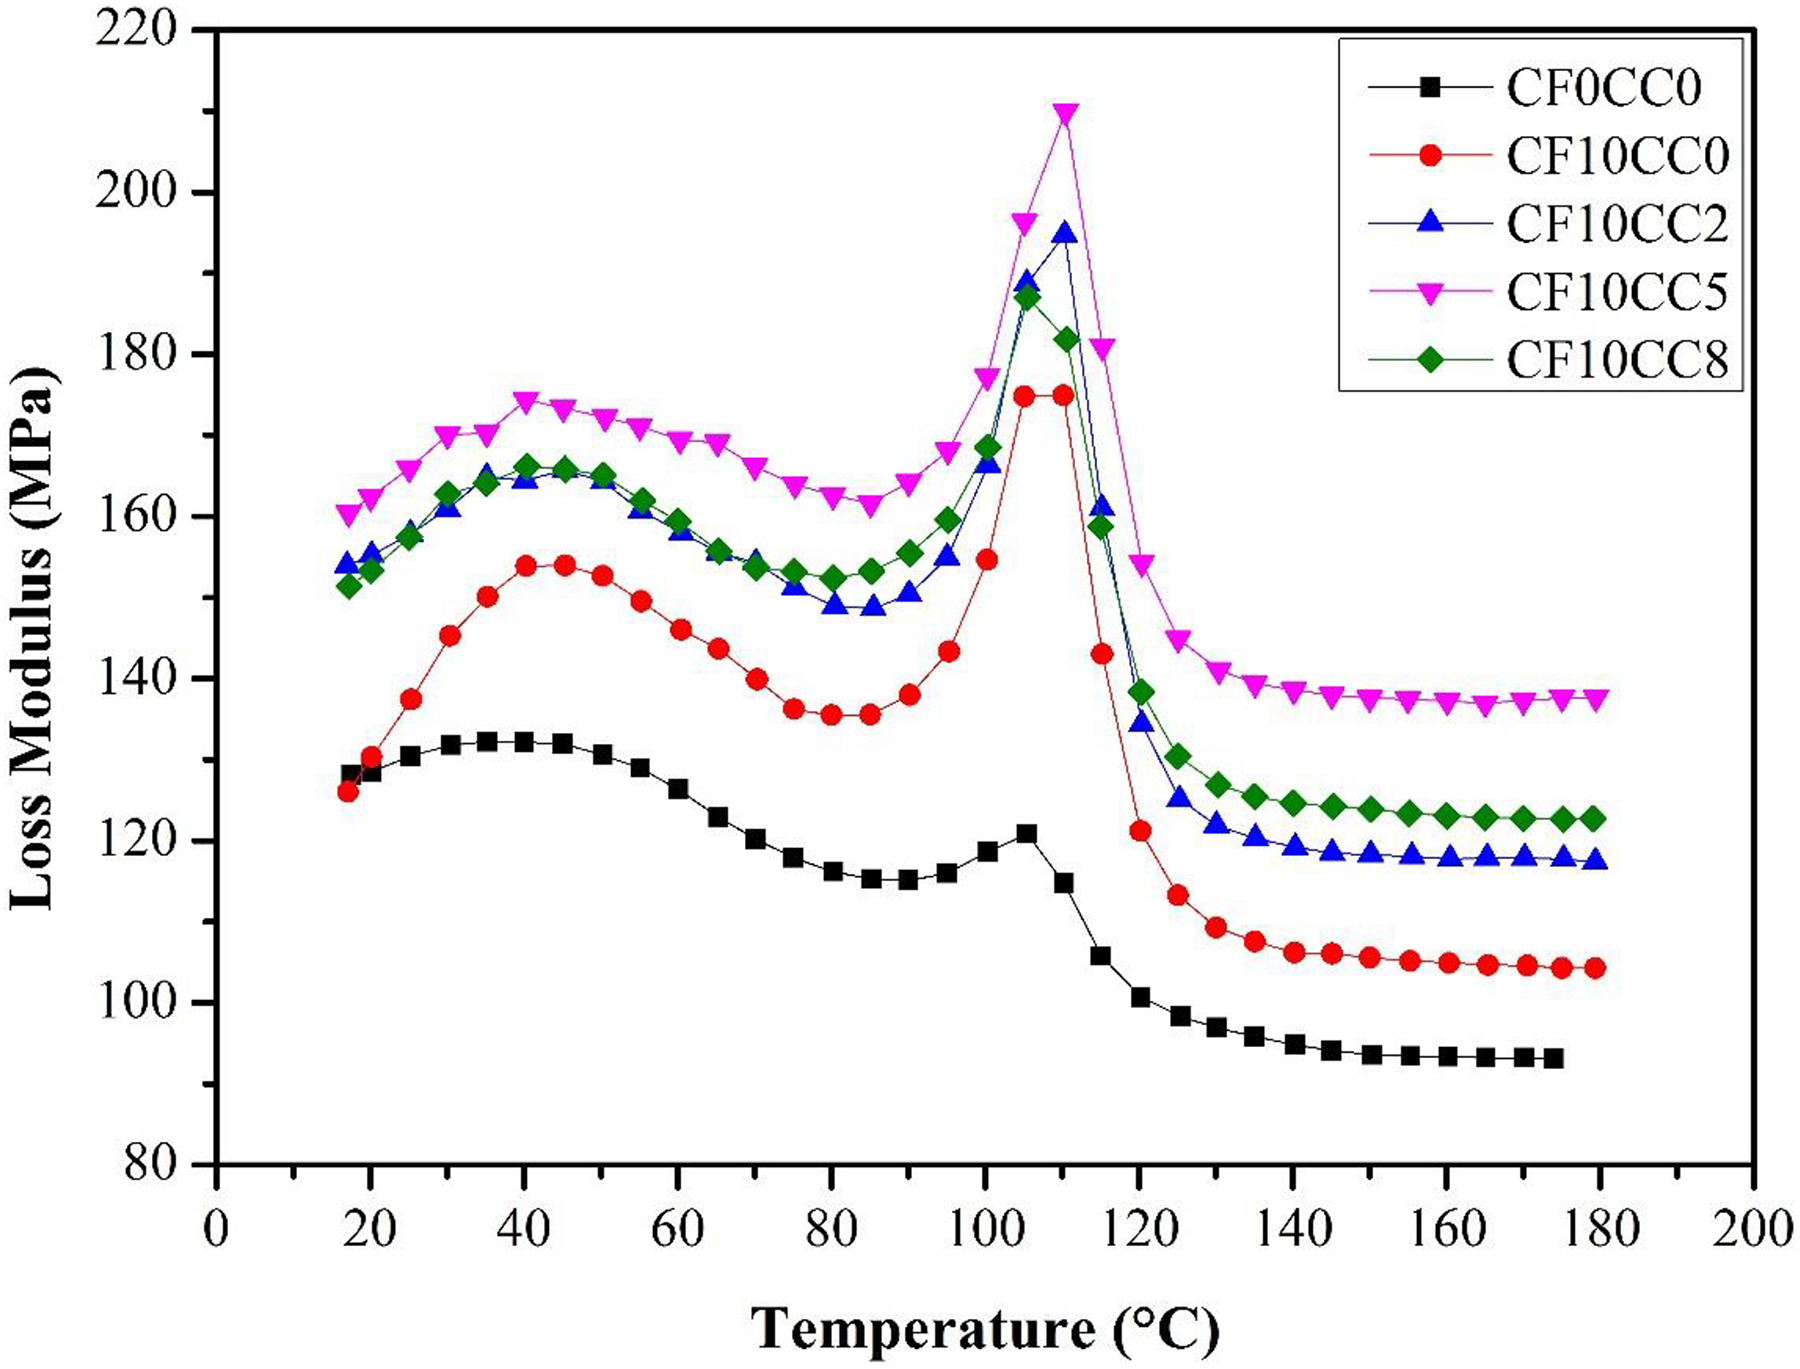
Variation of the loss modulus against temperature.
Damping factor (Tanδ)
Figure 9 illustrates the tanδ curves of different compounds. It is well known that tanδ is the ratio of loss modulus to storage modulus and usually called mechanical damping factor. Tanδ is an important parameter to assess the material property in terms of ability to lose energy and generally associates with molecular rearrangements. There is a peak point in tanδ-temperature curve that corresponds to the Tg and relates to α relaxation of polymer matrix chains. 31,32 According to Figure 9, incorporations of HSCFs and 2 wt% CaCO3 nanoparticles noticeably dropped tanδ. These reductions are attributed to the fact that CFs and CaCO3 nanoparticles confine the movements of polymer chains. The inclusions of much further nanoparticles (5 and 8 wt%) led to higher tanδ owing to the nanoparticles agglomeration. When there is a poor dispersion of nanoparticles within the polymeric matrix, the effective role of nanoparticles in the polymer chains obstruction is reduced. 33 The quantitative results of DMTA in terms of the tanδ and Tg data are tabulated in Table 4. The Tg was significantly improved through the incorporation of HSCFs. The positive shift in Tg value yields higher thermal stability and indicates the efficiency of CFs reinforcement. It is noteworthy that the Tg values obtained from the peak points of loss modulus curves are found to be lower than those acquired from tanδ curves (Table 4). It was reported that Tg obtained from loss modulus peak is more reasonable and realistic in comparison with that attained from tanδ peak. 34,35 It is also interesting to note that the addition of HSCFs to PA6/ABS system led to the generation of tanδ curve with higher underneath area in transition zone. Generally, the area under the curve of tanδ around the transition region is a measure of the absorbed energy. 14 Because of the restriction effect of CF, greater energy is required to make polymer chains to slip one past another.
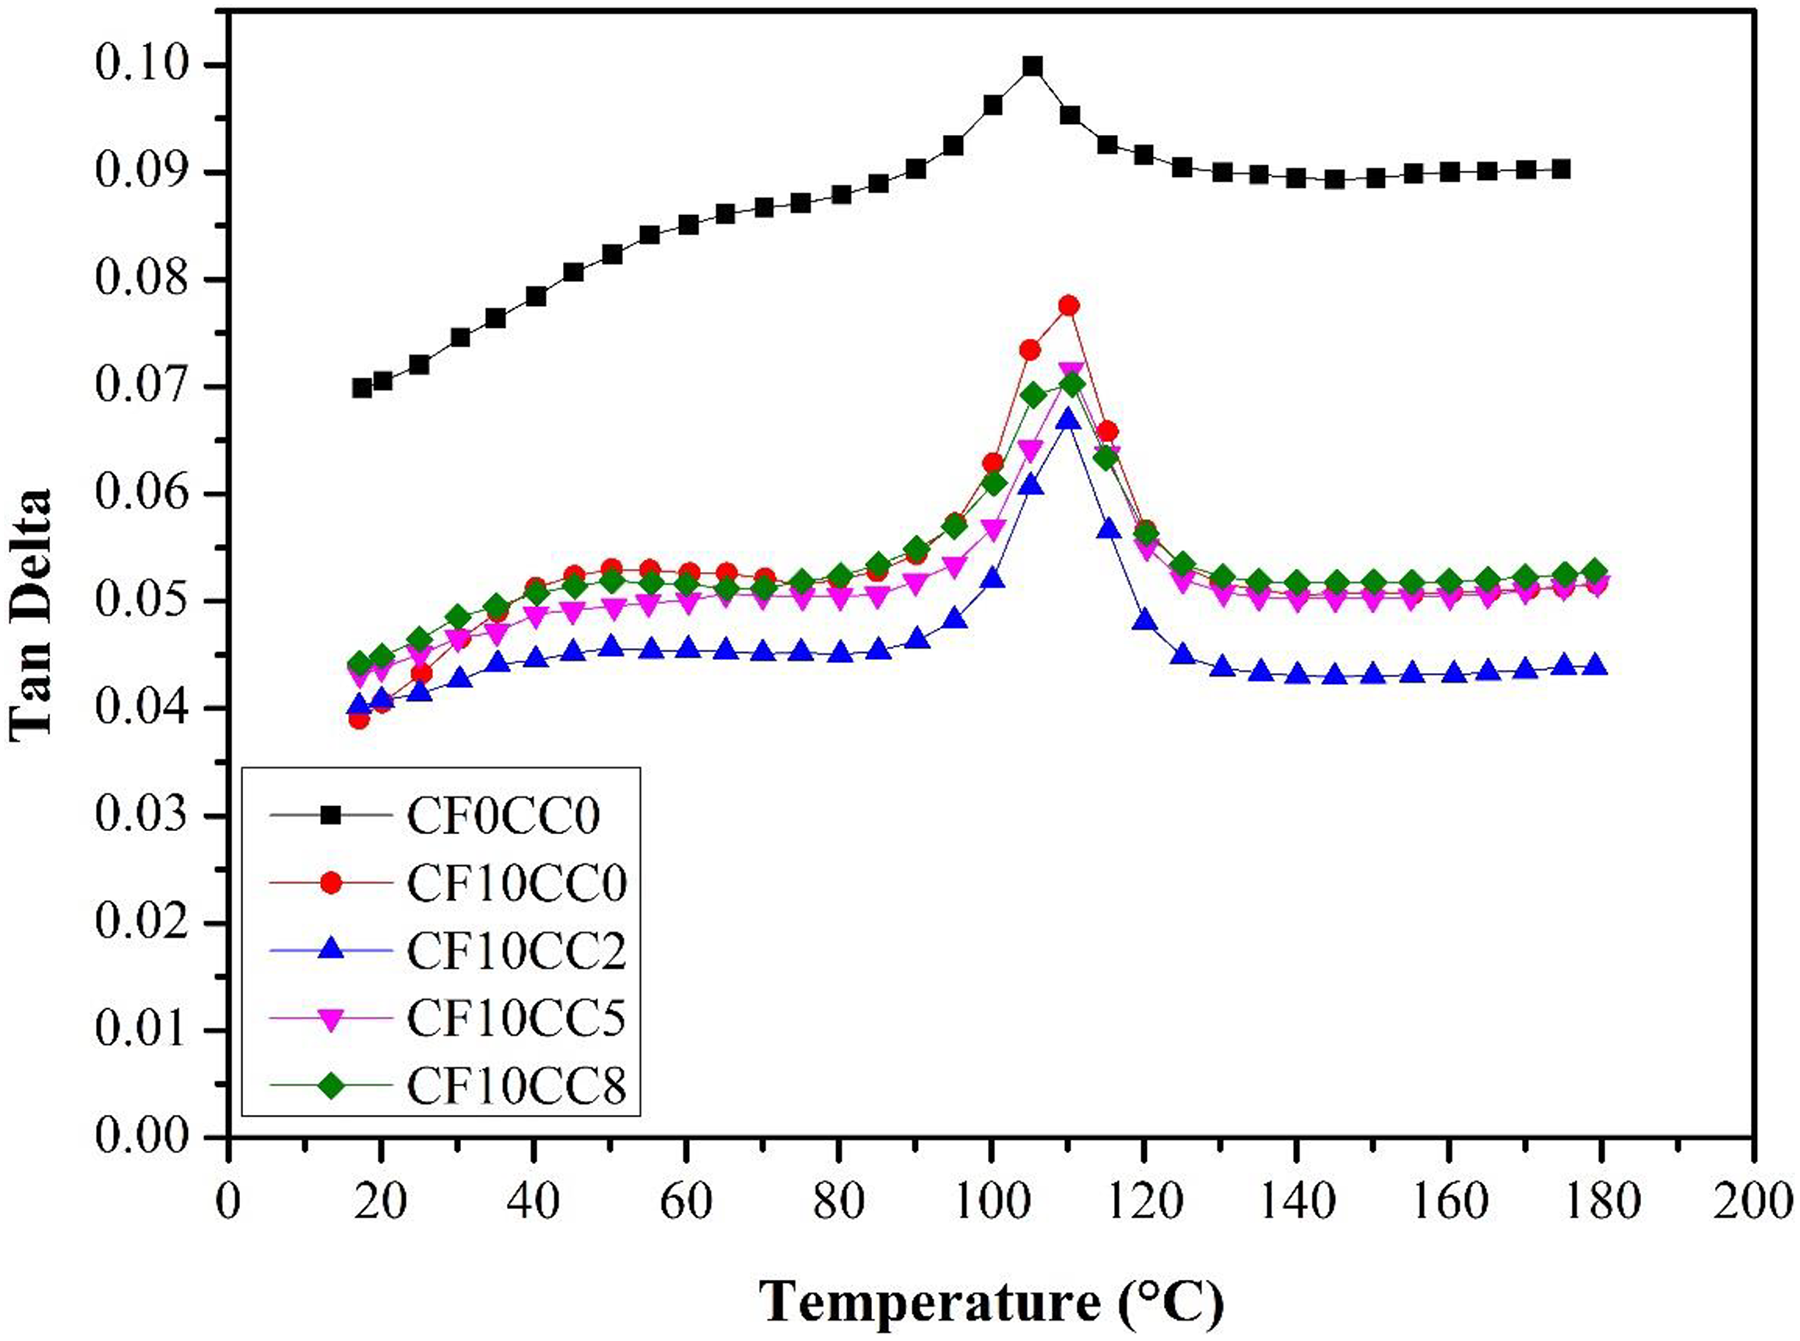
Tanδ curves for different samples.
Results of DMTA analysis in terms of Tg and Tanδ.
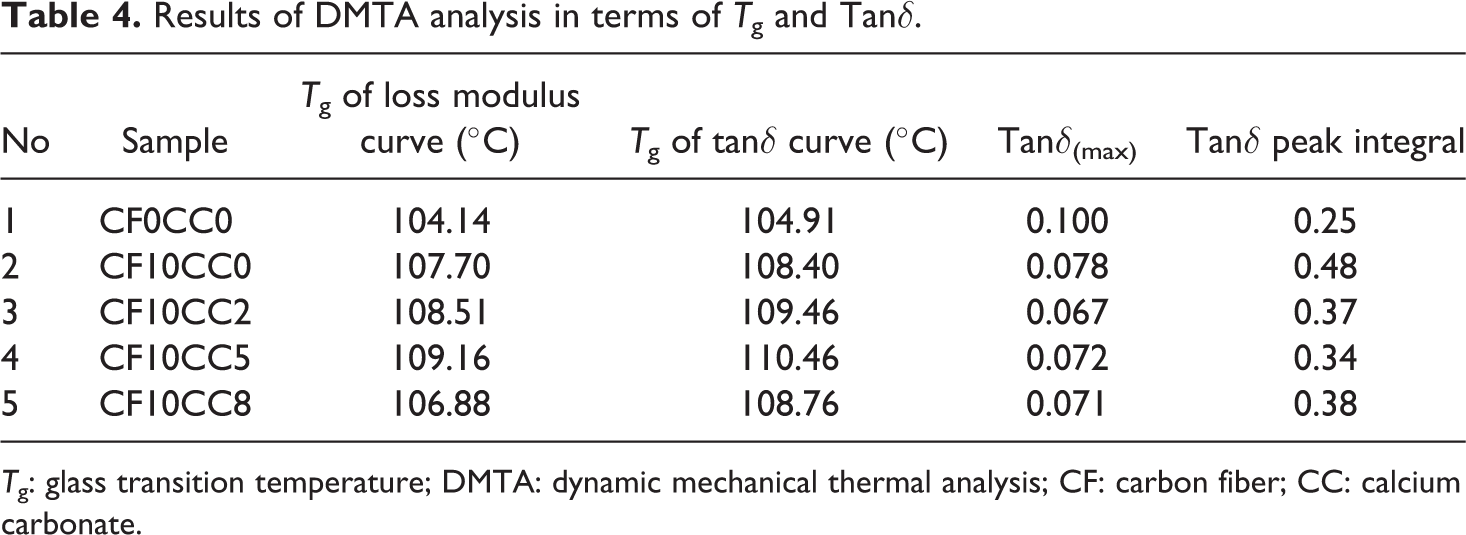
Tg: glass transition temperature; DMTA: dynamic mechanical thermal analysis; CF: carbon fiber; CC: calcium carbonate.
Cole–Cole plot
Cole–Cole plot is an important scheme for evaluating the correlation between loss modulus (E″) and storage modulus (E′) values. Cole–Cole plot indicates the variation of loss modulus against storage modulus and reveals the homogeneity characteristics of material system. High degree of homogeneity establishes a smooth semicircular curve, while the inconsistency of a material system yields a noncircular and irregular graph. 36,37 According to Figure 10, the incorporations of surface-treated CF and CaCO3 nanoparticle into PA6/ABS polymer matrix have changed the shape of Cole–Cole plot from semicircular to irregular shapes. In another words, when there is a heterogeneous or two-phase system, the corresponding Cole–Cole plot consists of two modified circles. 38 This phenomenon can be explained by the fact that composites have different relaxation mechanisms in contrast to the homogenous polymeric system. 28 The irregularity of Cole–Cole plot for composites induced from very high variation of loss modulus when compared to storage modulus at vicinity of Tg (Figures 7 and 8). The high interfacial adhesion between surface-treated CFs and polymeric matrix is believed to be the most important influencing factor that led to the noticeable deviation from the semicircular shape of Cole–Cole plot.
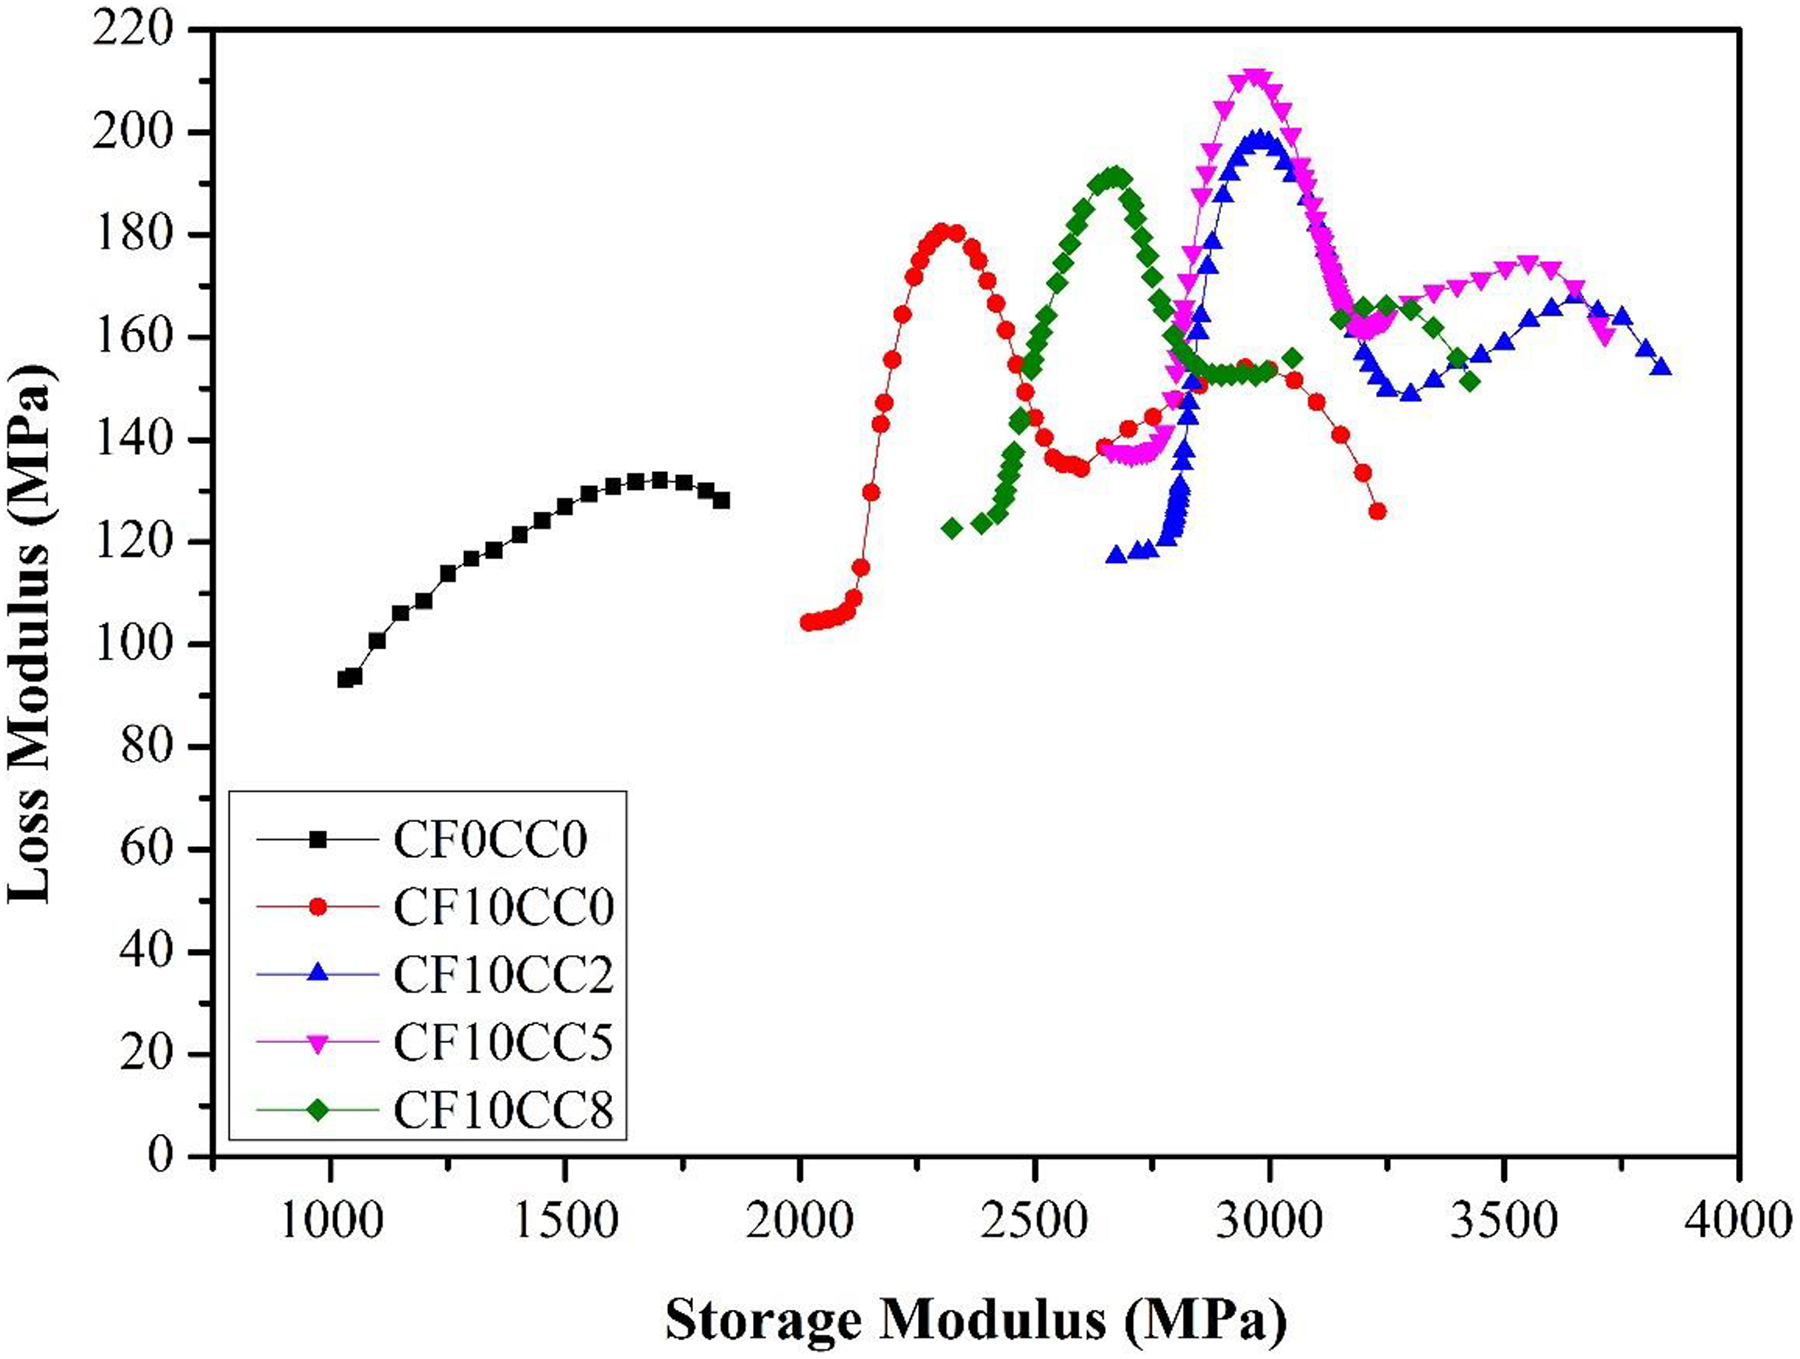
Cole–Cole plots of different samples.
Thermogravimetric analysis
TGA thermograms of different samples are shown in Figure 11. It is evident that there is no reduction in weight below 100°C (Figure 11(a)). This implies that the moisture removing process has been successfully accomplished. The onset of decomposition temperature with 5% weight loss (T5 wt%) and the maximum degradation temperature (Tmax) are obtained and listed in Table 5. Careful observation shows that there is a noticeable decrease in the slope of degradation curves around 470–480°C for composites (Figure 11(a)). According to Figure 11(b), there are two peaks in the derivative TGA curves which are attributed to two major thermal decomposition stages. The first peak indicates polymer chain scission phenomenon and the second peak represents complete degradation of polymer chains. 39 The results indicate that the thermal stability and degradation temperature have been improved with the addition of surface-treated CFs and CaCO3 nanoparticles to neat PA6/ABS. The improvement in thermal stability is attributed to the restriction effect of CFs and nanoparticles on polymer chains movement. 16,40 The high thermal stability of mineral CaCO3 nanoparticle and CF is another important factor elevating the decomposition temperature. 40,41 Moreover, CFs reduce the heat release rate and act as physical mass transport barriers which prevent the escape of the volatile decomposed products out of polymeric matrix. 40 It is also interesting to note that there is a correlation between crystallinity and initial decomposition temperature. At high temperature, the resistance of crystalline regions against polymer chain scission phenomenon is higher than that of amorphous regions. 42
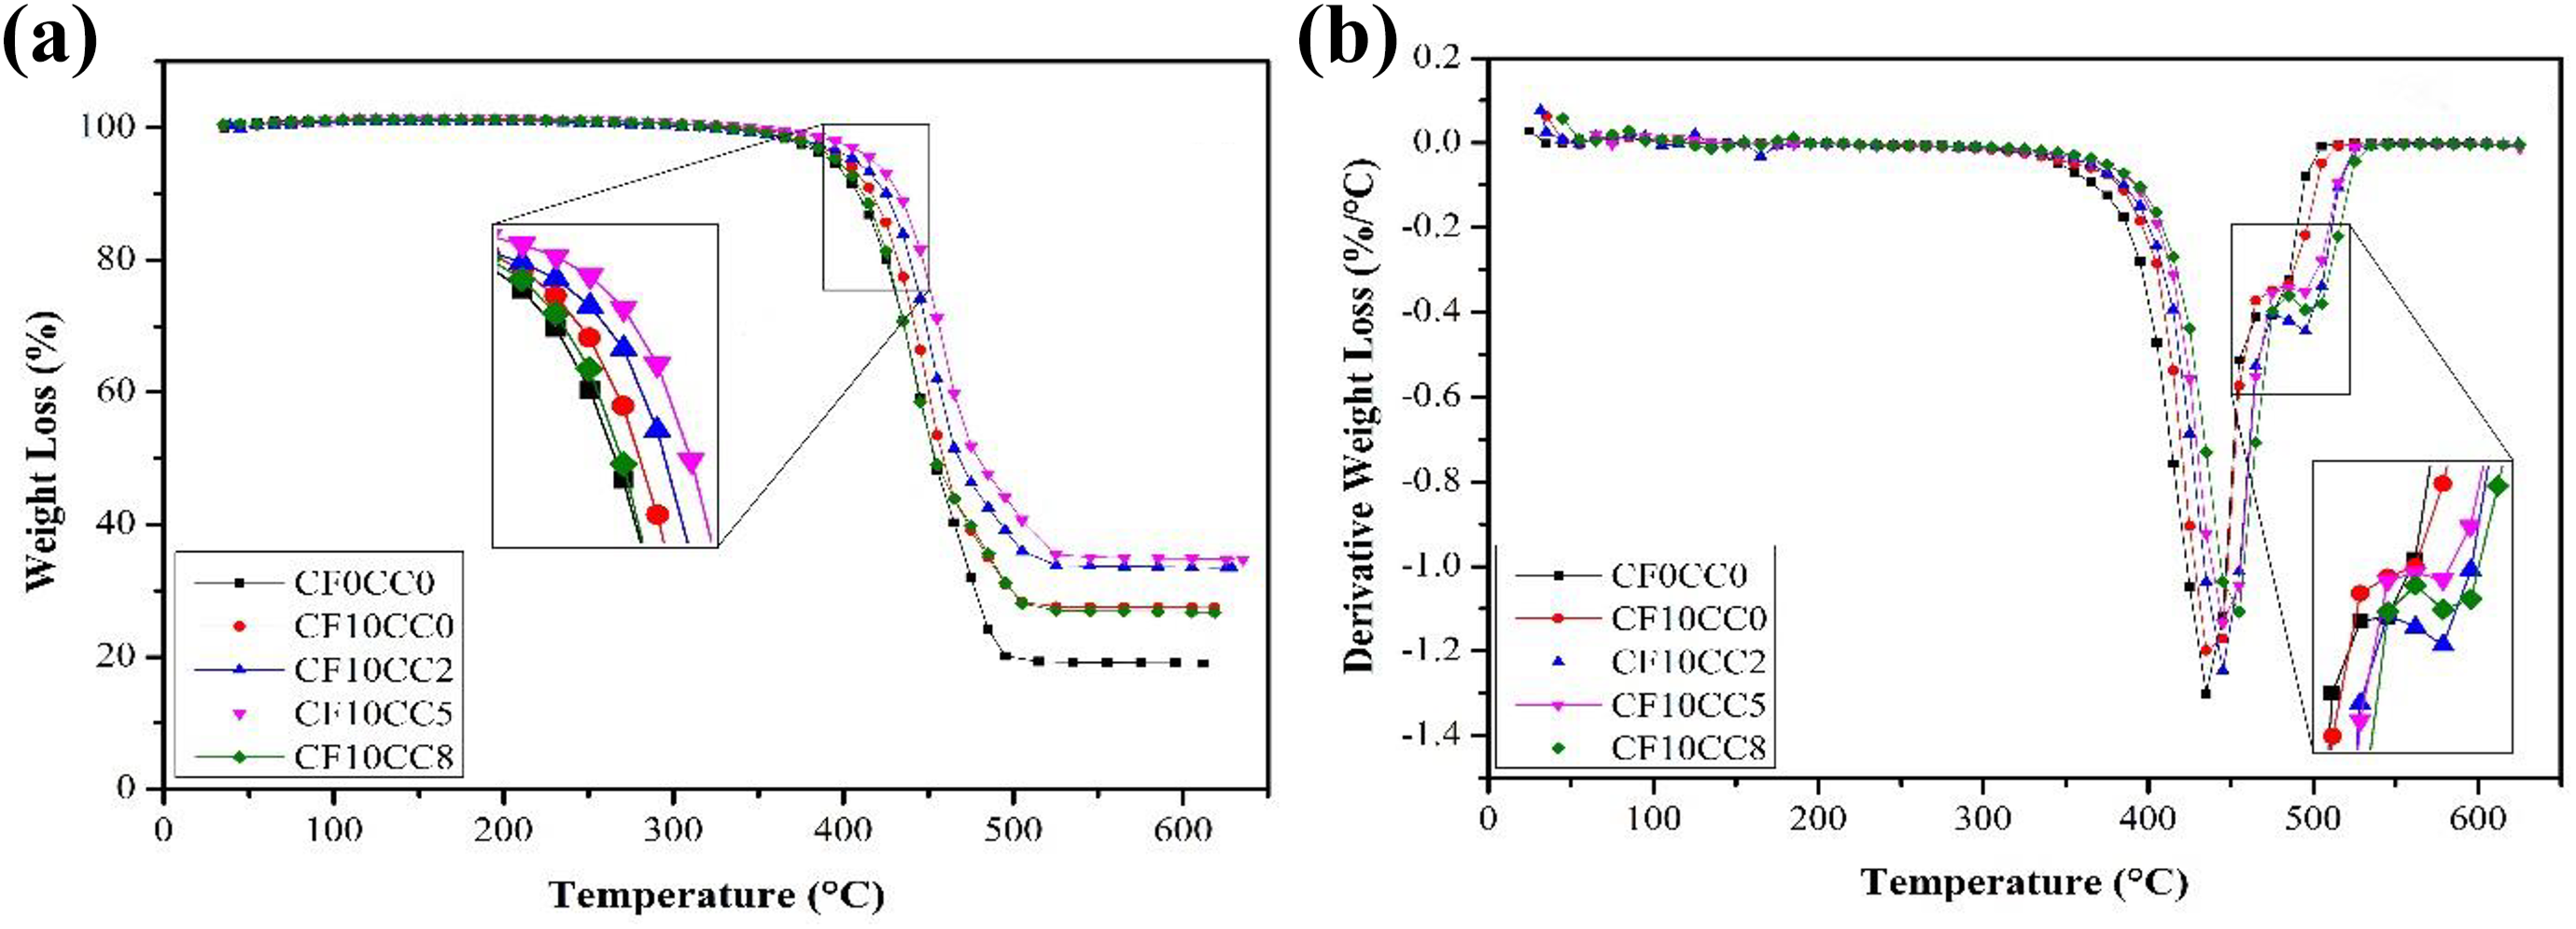
(a) TGA and (b) DTGA of PA6/ABS and its hybrid nanocomposites.
Results of TGA analysis.
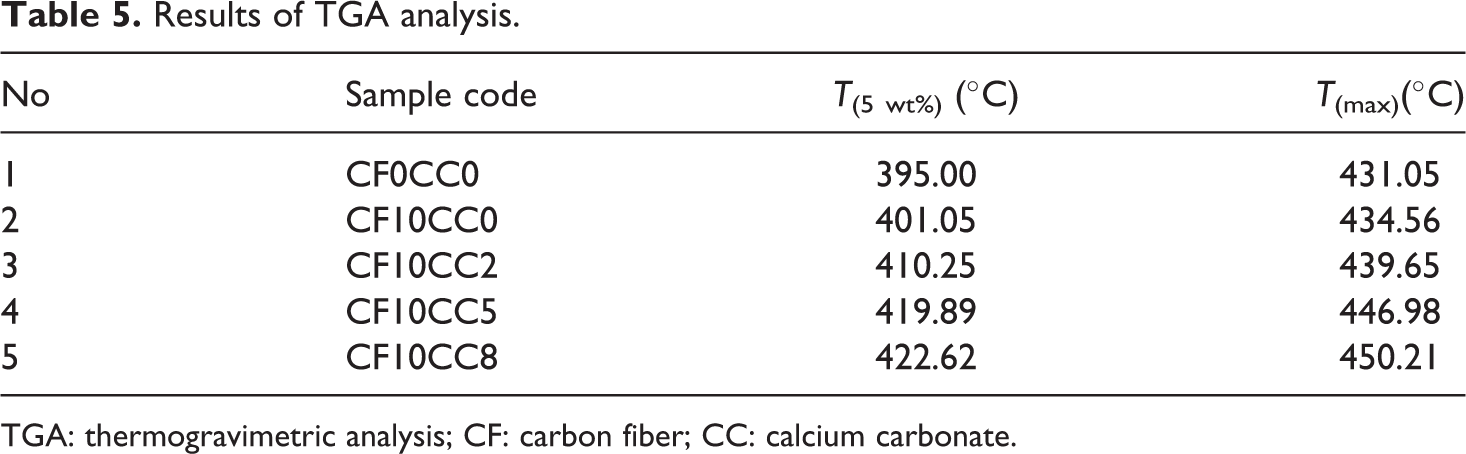
TGA: thermogravimetric analysis; CF: carbon fiber; CC: calcium carbonate.
Conclusions
The aim of this study was to investigate the effects of HSCFs and CaCO3 nanoparticles on the dynamic mechanical thermal behavior and thermal degradation of PA6/ABS-based composites. SEM observations showed the formation of strong interaction between surface-treated CFs and polymer matrix. Significant improvements in the thermal stability and dynamic mechanical properties were achieved by the addition of treated CFs and CaCO3 nanoparticles. The incorporations of HSCFs and CaCO3 nanoparticles enhanced both storage and loss moduli over a wide temperature range and elevated the Tg. TGA studies indicated enhancements of degradation temperatures with the addition of HSCFs and CaCO3 nanoparticles. A correlation between crystallinity and decomposition temperature was perceived. The improvements of thermomechanical properties and degradation temperature were attributed to the successful surface treatment of CFs, good dispersion of nanoparticles in polymer, and presence of nanoparticles inside the polymer–CF interphase zone.