
Abstract
Accelerated weathering of polyvinyl alcohol (PVA) and PVA reinforced with 20 wt% of zinc chloride (ZnCl2) was investigated. The developed PVA composites were subjected to 100, 200, and 300 h of accelerated weathering exposure times. The effects of exposure on the PVA composites were characterized by Fourier transform infrared (FTIR), thermal properties as thermogravimetric analysis and differential scanning calorimetry, the mechanical and morphology properties, and X-ray diffraction analysis. The results of FTIR displayed that lower carbonyl and hydroxyl indexes are due to PVA composite. The results of mechanical tests showed that the accelerated weathering reduced the tensile strength of PVA. However, PVA composites exhibited fewer reduction of the tensile strength values. PVA composites exhibited better thermal stability after extent to ultraviolet irradiation. The storage modulus from dynamic mechanical analysis results that displayed a higher value for the storage modulus is related to PVA composites, compared to PVA. Before exposure, PVA composite showed a high intensity, compared to PVA. After exposure to accelerated weathering, the intensity of all samples shifted and decreased. Scanning electron microscopic micrographs showed that the surface of the PVA composites had fewer defects compared to the PVA after exposure. The results of characterization revealed that 20% of ZnCl2 into the PVA made less vulnerable to environmental degradation, and these PVA composites are suitable as packaging films for use in outdoor applications.
Introduction
Polyvinyl alcohol (PVA)/inorganic composites have been used for several applications because of their low cost and good performance such as high strength and stiffness, good heat resistance, 1 –4 and dimensional stability polymer with excellent physical properties and chemical resistance with broad applications in the adhesive, paper, and textile industries. 5 –7
PVA is a multi-hydroxyl polymer with high polarity; 8 hence, it shows good compatibility with most inorganic/organic fillers, and PVA-based composites with high performance are expected to be prepared without the need to introduce coupling agents and interfacial modifiers. 9 –11 This mostly avoids the performance loss of the composites, eliminates unnecessary chemical pollution caused by small molecule modifiers, and shortens the processing procedures. 12 –15
PVA has become one of the most popular environmentally friendly materials. Recently, there has been sustained growth in the number of the studies on PVA and its composites. 16 –18 There are three primary techniques that have been adopted to improve the processability of PVA: blending with other thermoplastic polymers, chemical modification, and plasticization. 19 –21 Plasticization is identified as a simple, economical, and highly efficient technology. 22,23
Several previous works investigated the effect of inorganic and natural fillers on the biodegradation on PVA matrix. In this work, the novel effort was developed to improve and give more long longevity toward environmental degradation resistance using high-performance photostabilizer (zinc chloride (ZnCl2)) in the PVA polymer matrix. The results before and after exposure to ultraviolet (UV) irradiation were analyzed by Fourier transform infrared (FTIR), thermogravimetric analysis (TGA), tensile tests, and X-ray diffraction (XRD) to evaluate and compare the improvements.
Experiment
Materials
PVA (MW = 124.000–186.000); the degree of hydrolysis 87–89 mol% and ZnCl2 are provided by Sigma-Aldrich Company, Germany.
PVA-ZnCl2 composites preparation
PVA composites have been prepared by the solution casting method from 80 wt% PVA and 20 wt% ZnCl2. PVA was dissolved in water under constant stirring at 80°C for 3 h to obtain a 100% (w/w) solution. Then 20 wt% ZnCl2 was then mixed with dissolved PVA solution and heated for 1 h at 80°C. The mixture was cast into a glass plate dish and placed on a leveled flat surface with an appropriate thickness of 40 µm. The PVA/ZnCl2 mixture was left at room temperature for 3 days, followed by drying in an air oven at 60°C for 3 days. The dried composite films were then peeled off from their dishes and then stored in a desiccator for future characterization use. Figure 1 shows the chemical formation between PVA and ZnCl2.
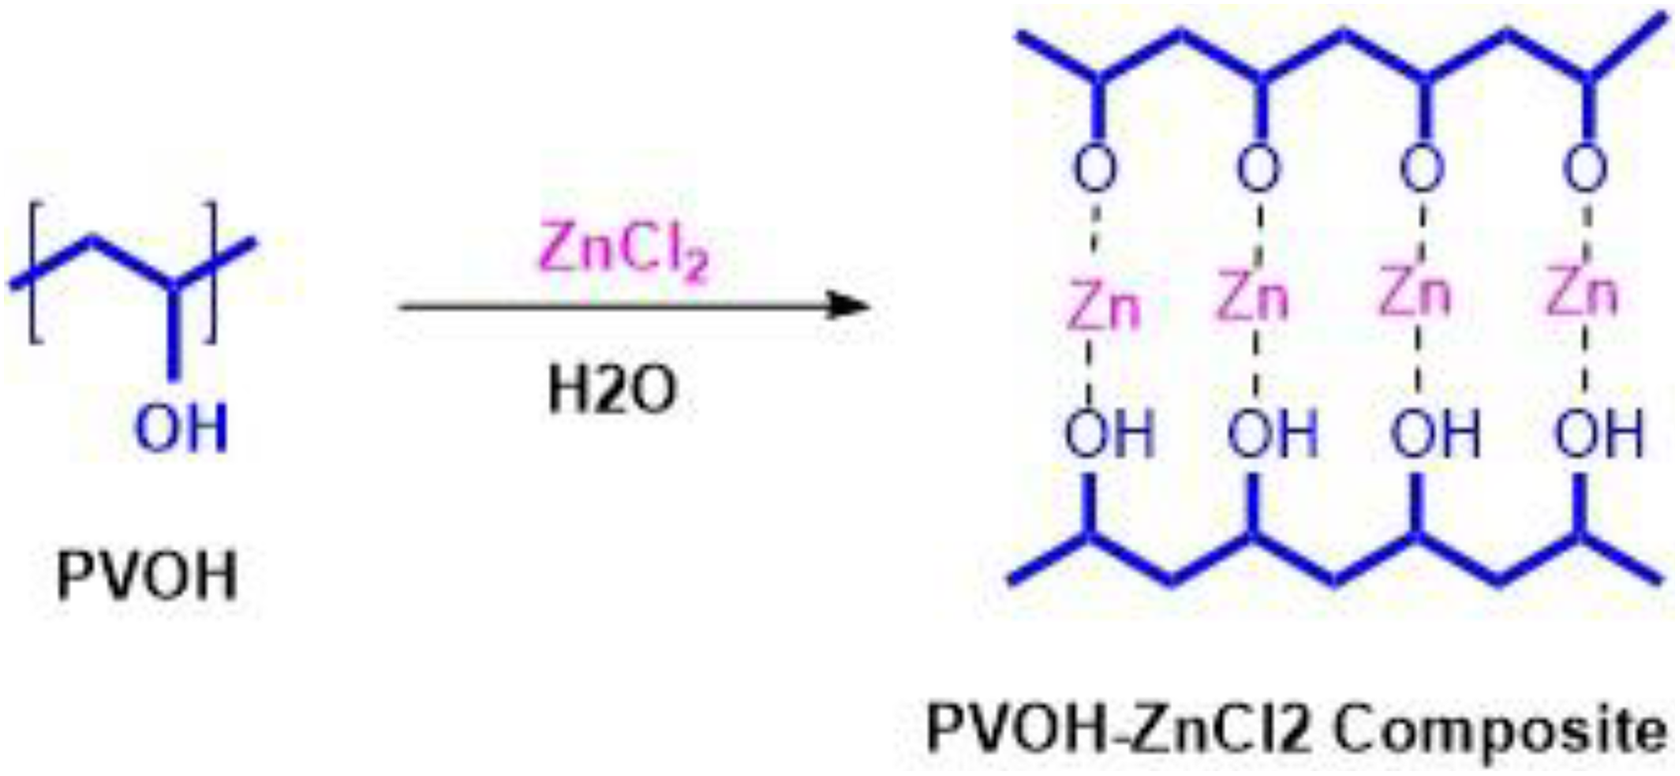
Formation of intercalated of ZnCl2 and PVA.
Accelerated weathering of PVA-ZnCl2 composites
The PVA composite samples were exposed to accelerated weathering (UV irradiation) using Q-UV weathering chamber (Q-Lab Corporation, Florida, USA) equipped with eight fluorescent lamps type (0.8 W·m−2, UVA-340 nm). All samples were placed vertically to the radiation lamps to ensure that the source of UV irradiation is vertically incident on the samples. The exposed samples were changed from time another to make that both the two faces are equal during the irradiation process. The samples were exposed to accelerated weathering cycle that was subjected for 8 h of UV exposure, followed by 4 h of condensation. All samples were exposed for 100, 200, and 300 h to combined accelerated weathering, and the obtained results were investigated and compared.
Performance testing and characterization
FTIR spectroscopy analysis
FTIR spectroscopy was conducted using the PerkinElmer (Llantrisant, UK) Spectrum Two FTIR spectrometer. The results of FTIR provided detailed information on the functional groups present on the surfaces of composites before and during exposing to weathering. For each sample, FTIR spectra were recorded in absorbance units from 4000 cm−1 to 500 cm−1. Chemical changes of PVA and PVA composites were focused on following the bands associated with a carbonyl (1710 cm−1), hydroxyl (3280 cm−1), and vinyl groups (1462 cm−1) as a reference


where I 3280 , I 1710, and I 1462 represent the values of absorbance at 3280, 1710, and 1462 cm−1, respectively.
Thermogravimetric analysis
TGA studies were carried out using an SDT 2960 (TA Instruments, The New Castle, DE, USA) simultaneous. The samples were weighted from 5 mg to 10 mg and placed in the sample pan and heated within a scanned temperature range of 25–600°C. All the measurements were taken while maintaining a static air flow of 150 ml min−1 with a constant heating rate of 10°C min−1 in an open alumina crucible.
Dynamic mechanical analysis
Dynamic mechanical analysis (DMA) type (Seiko Model DMS 110, Japan) was conducted at 10 Hz at a heating rate of 2°C min−1 within the range of temperature 25–140°C and on bundles of 10 filaments at 25-mm gauge length.
Differential scanning calorimetry
Differential scanning calorimetry (DSC) test was carried out to investigate the transition glass temperature (T g) behavior of the PVA and PVA composite using a TA Q20 Instrument. For each experiment, 5–10 mg were heated from 30°C to 300°C at a heating rate of 10°C min−1 under nitrogen atmosphere.
Tensile tests
PVA and PVA composites before and after accelerated weathering were tested using a tensile testing machine (Instron model 3367, UK) with a 2-kN load cell at room temperature (25°C). Tension tests were performed at a crosshead speed of 1 mm·min−1, using dumbbell-shaped specimens. The tensile tests of weathered samples were compared with unweathered samples to evaluate the extent of degradation. The tests were applied according to the ASTM D638standard test method.
XRD tests
XRD of PVA and PVA composites was carried out using a PANalytical (Model X pert PRO) at a scan rate of 0.106°·s−1, and the range of 2θ was between 0° and 60°. The X-ray beam wavelength was λ = 1.5 Å radiations (copper K α radiation) operated at 40 kV and 15 mA.
Scanning electron microscopy
Scanning electron microscopy (SEM) was used to investigate the degradation occurred on the sample surface. SEM type (JCM-6000PLUS NeoScope Benchtop JEOL SEM, MA, USA) was utilized to observe the surface morphology of weathered samples. The samples were prepared and coated with a gold coating.
Results and discussion
Chemical changes of PVA and PVA composites
FTIR spectrometry analysis followed the chemical changes of the PVA composites under accelerated weathering exposure. The FTIR spectra of the PVA and PVA composites at the different exposure durations are displayed in Figures 2 and 3, where most of the spectral features have changed after exposure to UVA irradiation. Calculated values of the carbonyl and hydroxyl indexes are shown in Figures 4 and 5. The spectrum of the control sample PVA showed a clear absorption carbonyl peak at 1710 cm−1. The carbonyl and hydroxyl indexes of the PVA and PVA composites dropped during the first 100 h of exposure and then showed slight deviations after the exposure to 300 h. The drop in the carbonyl and hydroxyl indexes of the weathered reference composite was slightly higher than that of unweathered samples. The carbonyl indexes of the PVA were found to increase with an increase in UV exposure time to 200 h. Up to 300 h exposure, the values of carbonyl and hydroxyl indexes were higher than that of PVA composites (Figures 4 and 5).
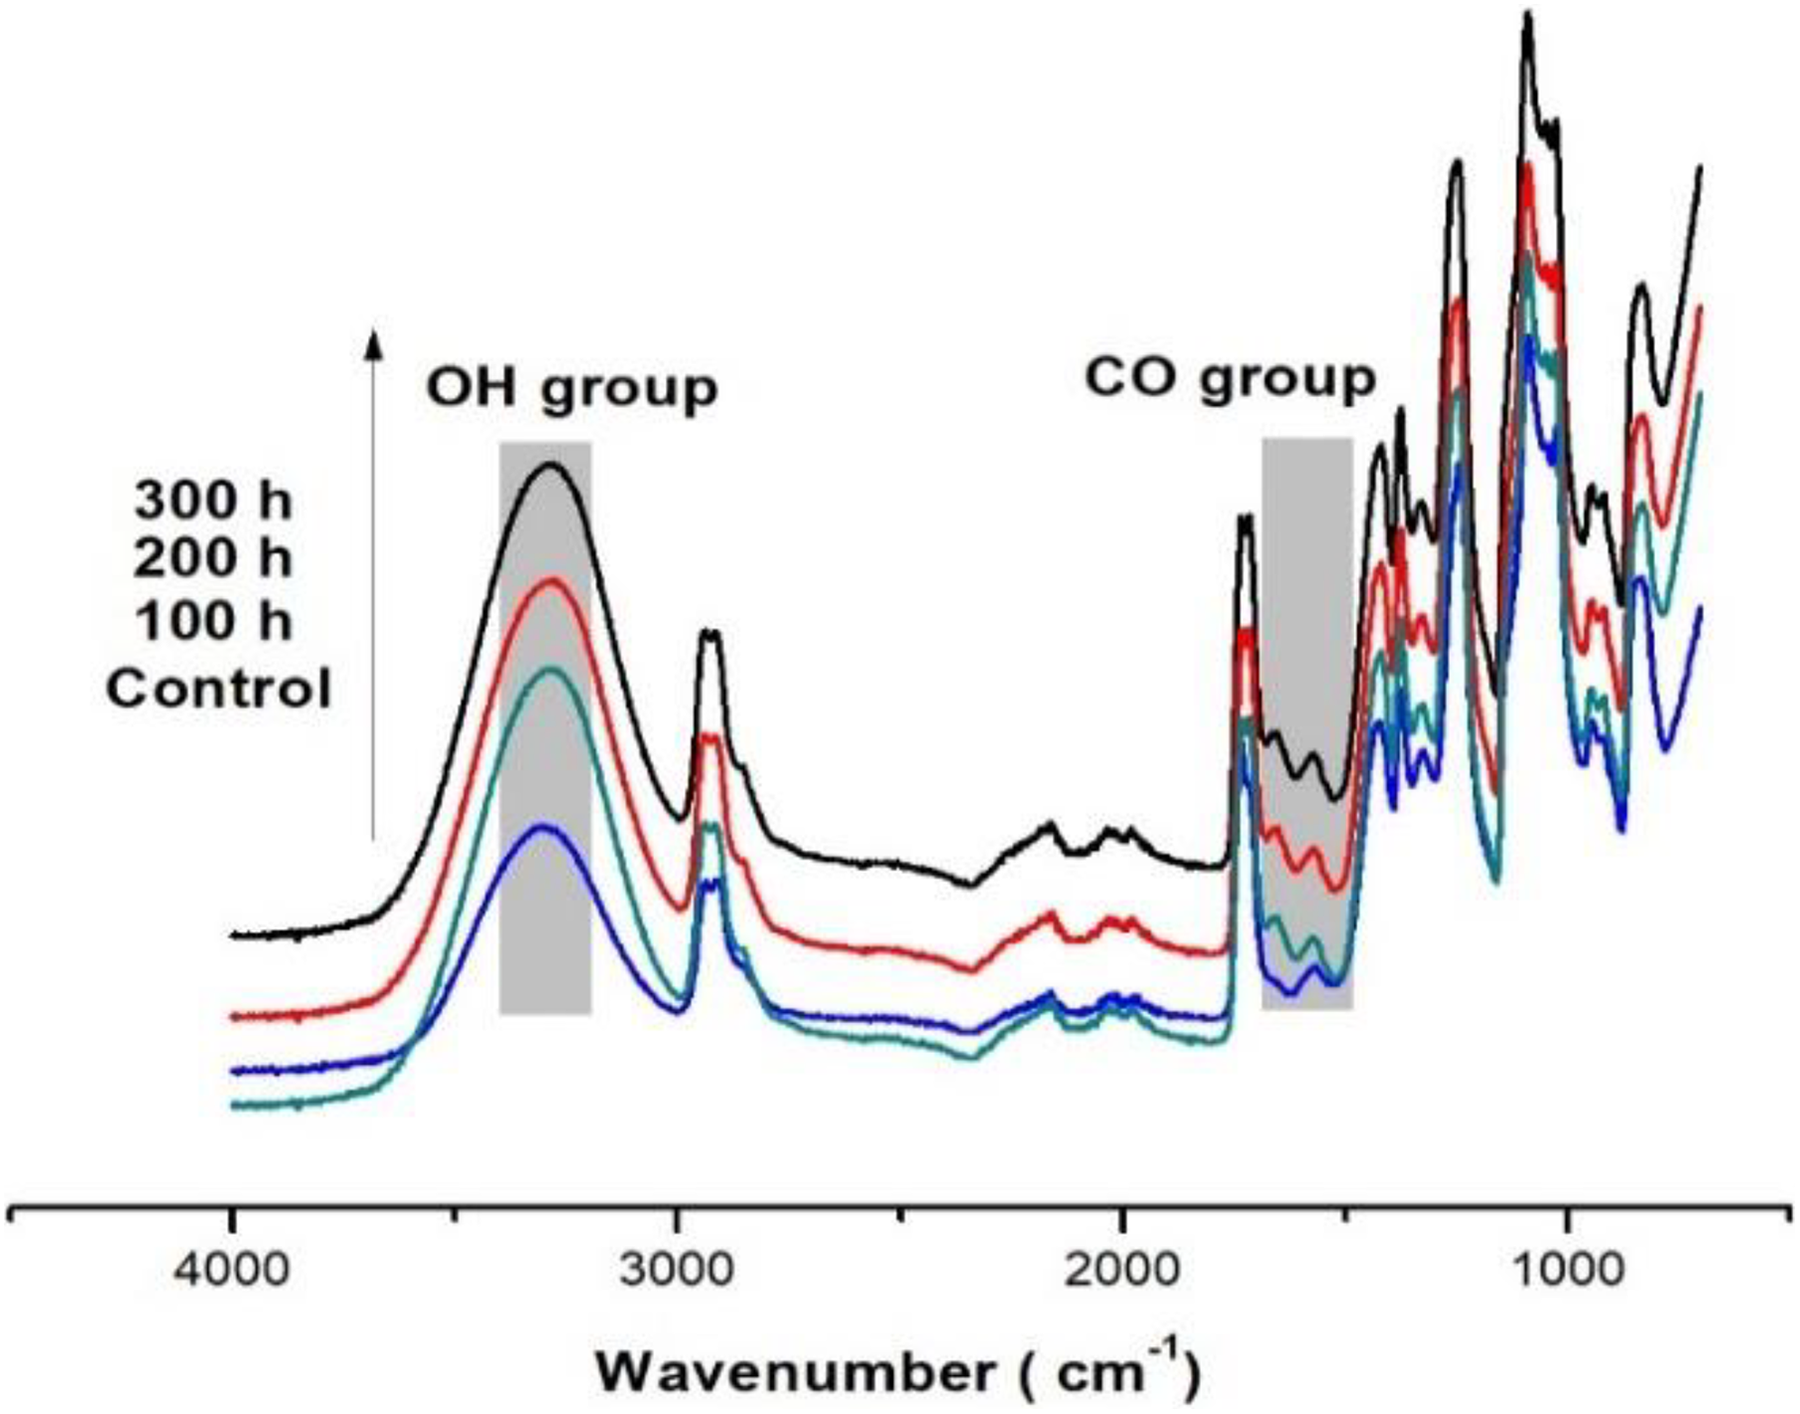
FTIR spectra of PVA composite samples in the fingerprint (4000–500 cm−1) before and after exposure to 100-, 200-, and 300-h accelerated aging.
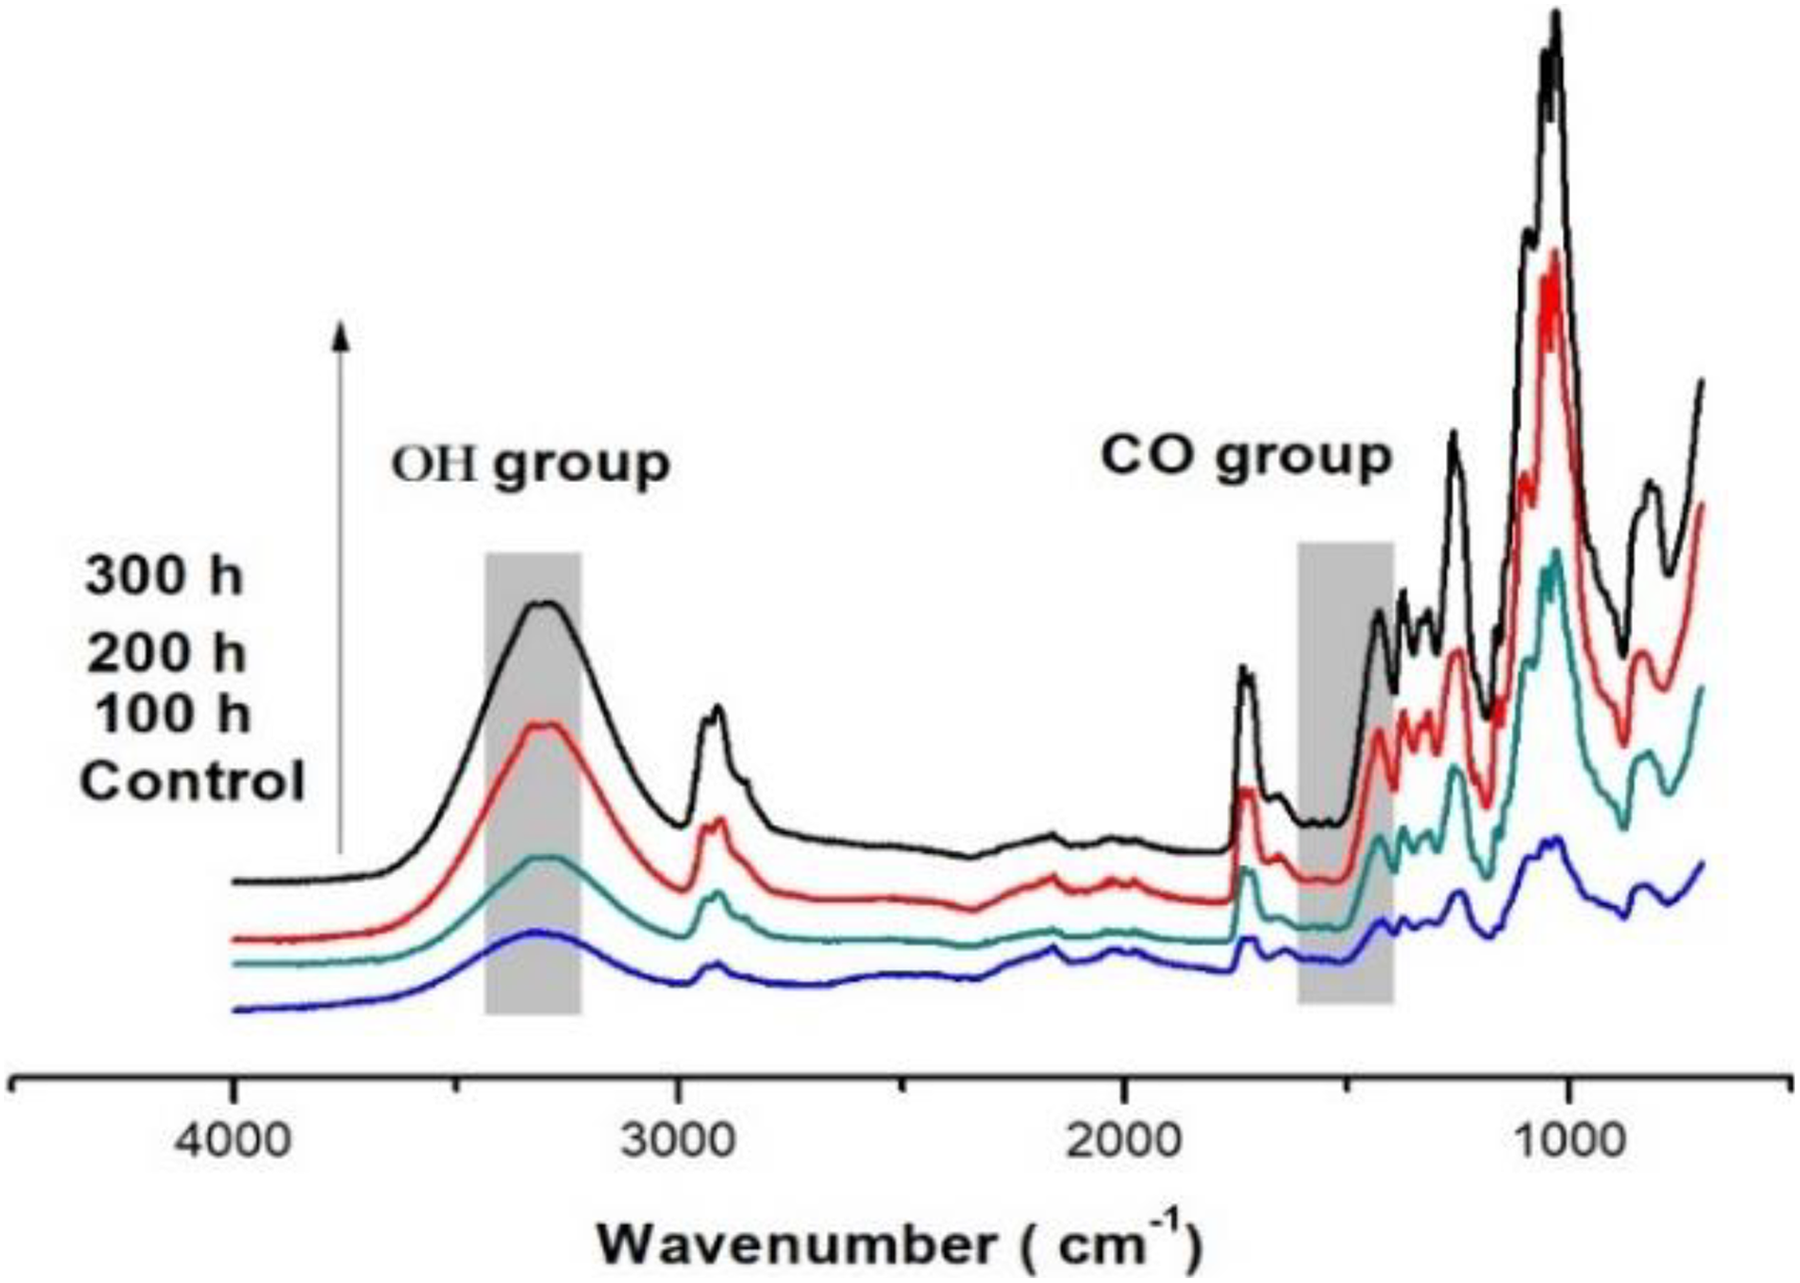
FTIR spectra of PVA composite samples in the fingerprint (4000–500 cm−1) before and after exposure to 100-, 200-, and 300-h accelerated aging.
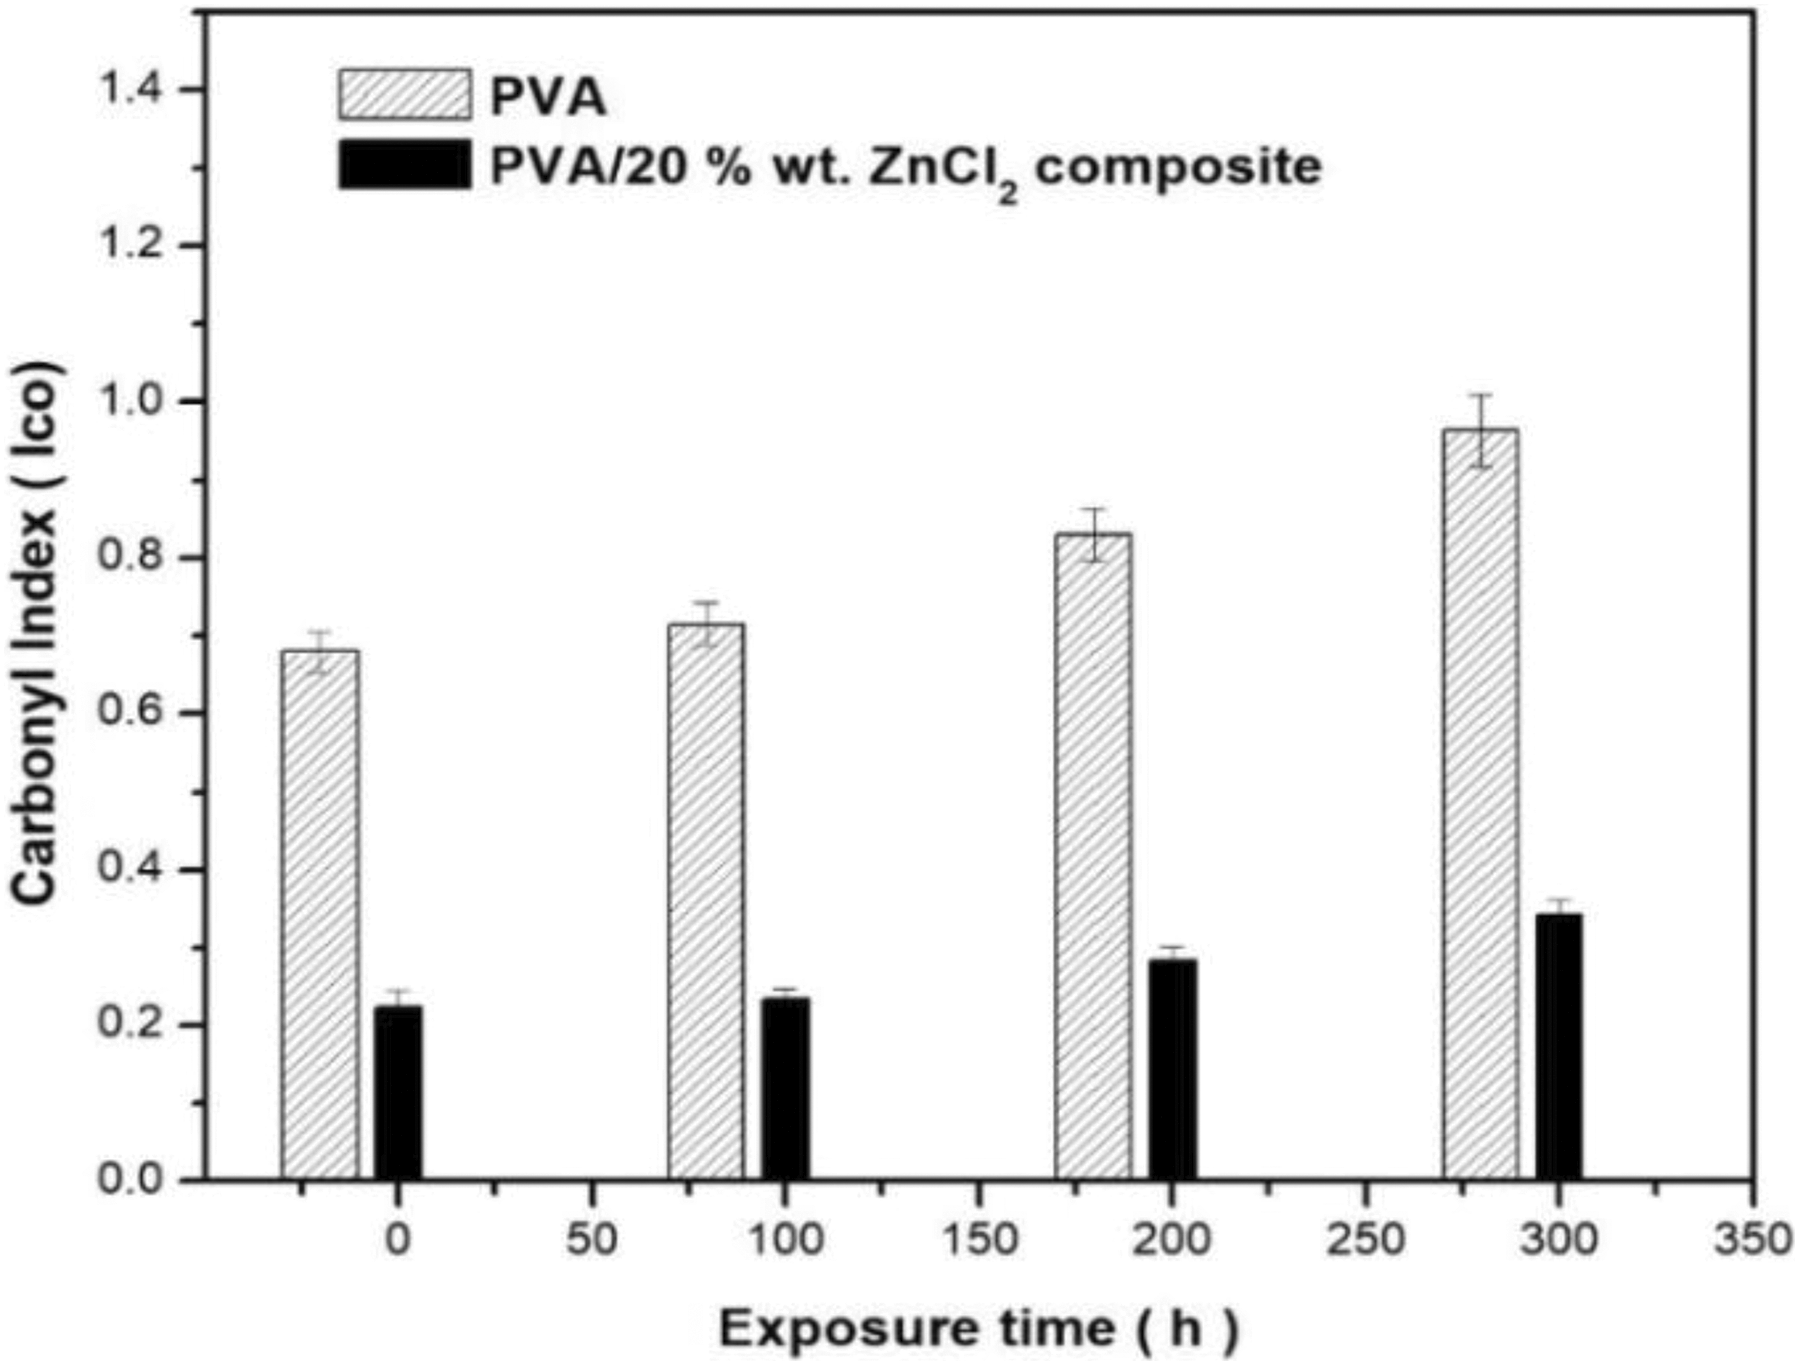
Carbonyl index of PVA and PVA composites for different accelerated weathering times.
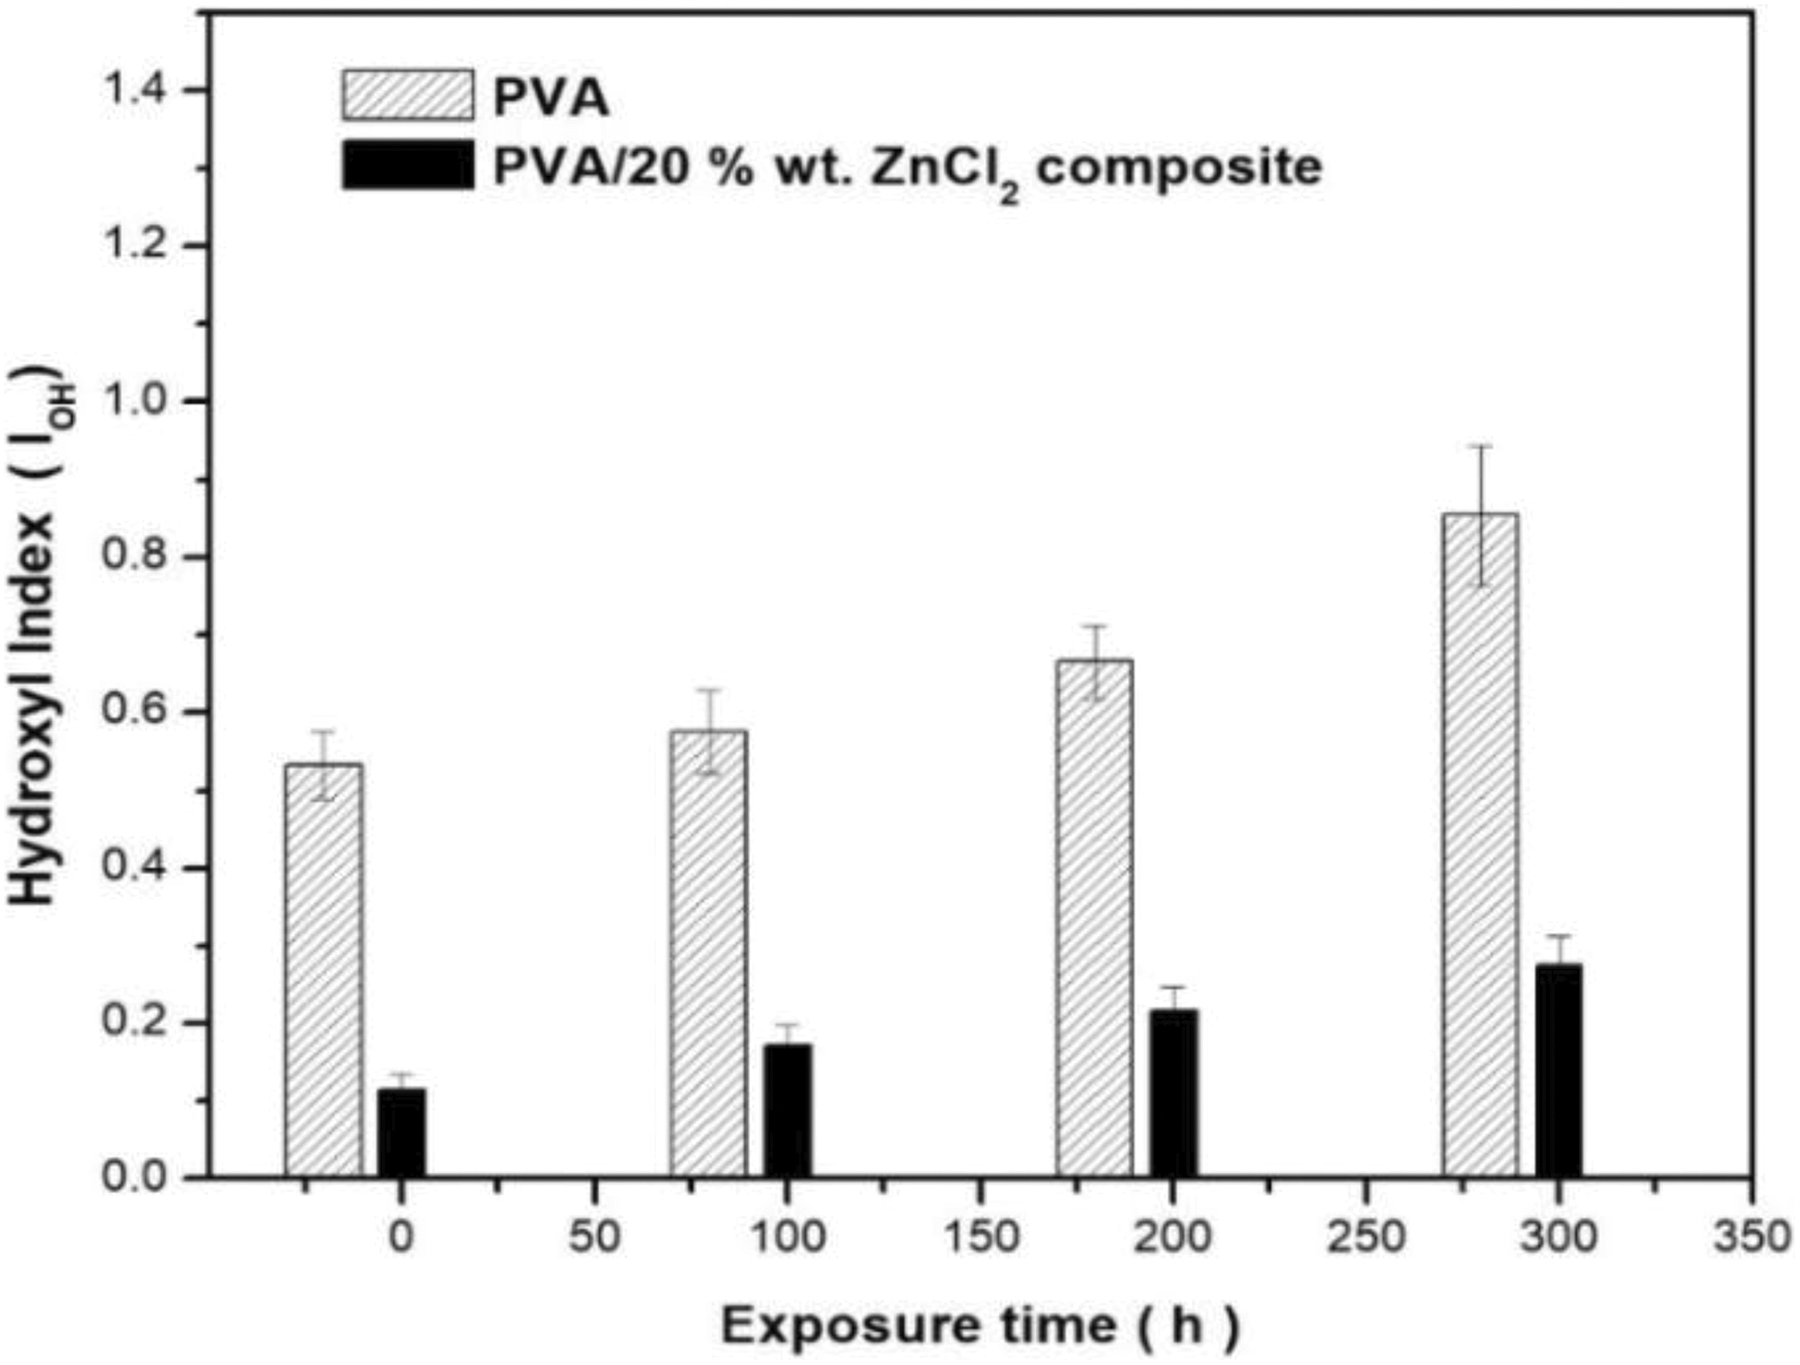
Hydroxyl index of PVA and PVA composites for different accelerated weathering times.
Thermal degradation of PVA composites
TGA was used to investigate the effect of 20% ZnCl2 on the thermal stability of the composites after exposure to different UV irradiation times. Thermogravimetric and differential thermogram (DTGs) plots for the neat PVA, PVA, and PVA/20% ZnCl2 composites are shown in Figures 6 and 7. The summary of the thermal stability of each composition showing the onset temperature (T i), the temperature at 50% weight loss (T 50), and T max including residue for all samples are exhibited in Table 1. In the obtained PVA thermograms (Figure 7), three main weight loss regions can be observed. All the samples showed an initial weight loss in the region 75–150°C that was caused by the water evaporation. The second stage is found between 200°C and 350°C, and the third stage is above 400°C. The second and third stages are due to the degradation of PVA/20% ZnCl2 films.
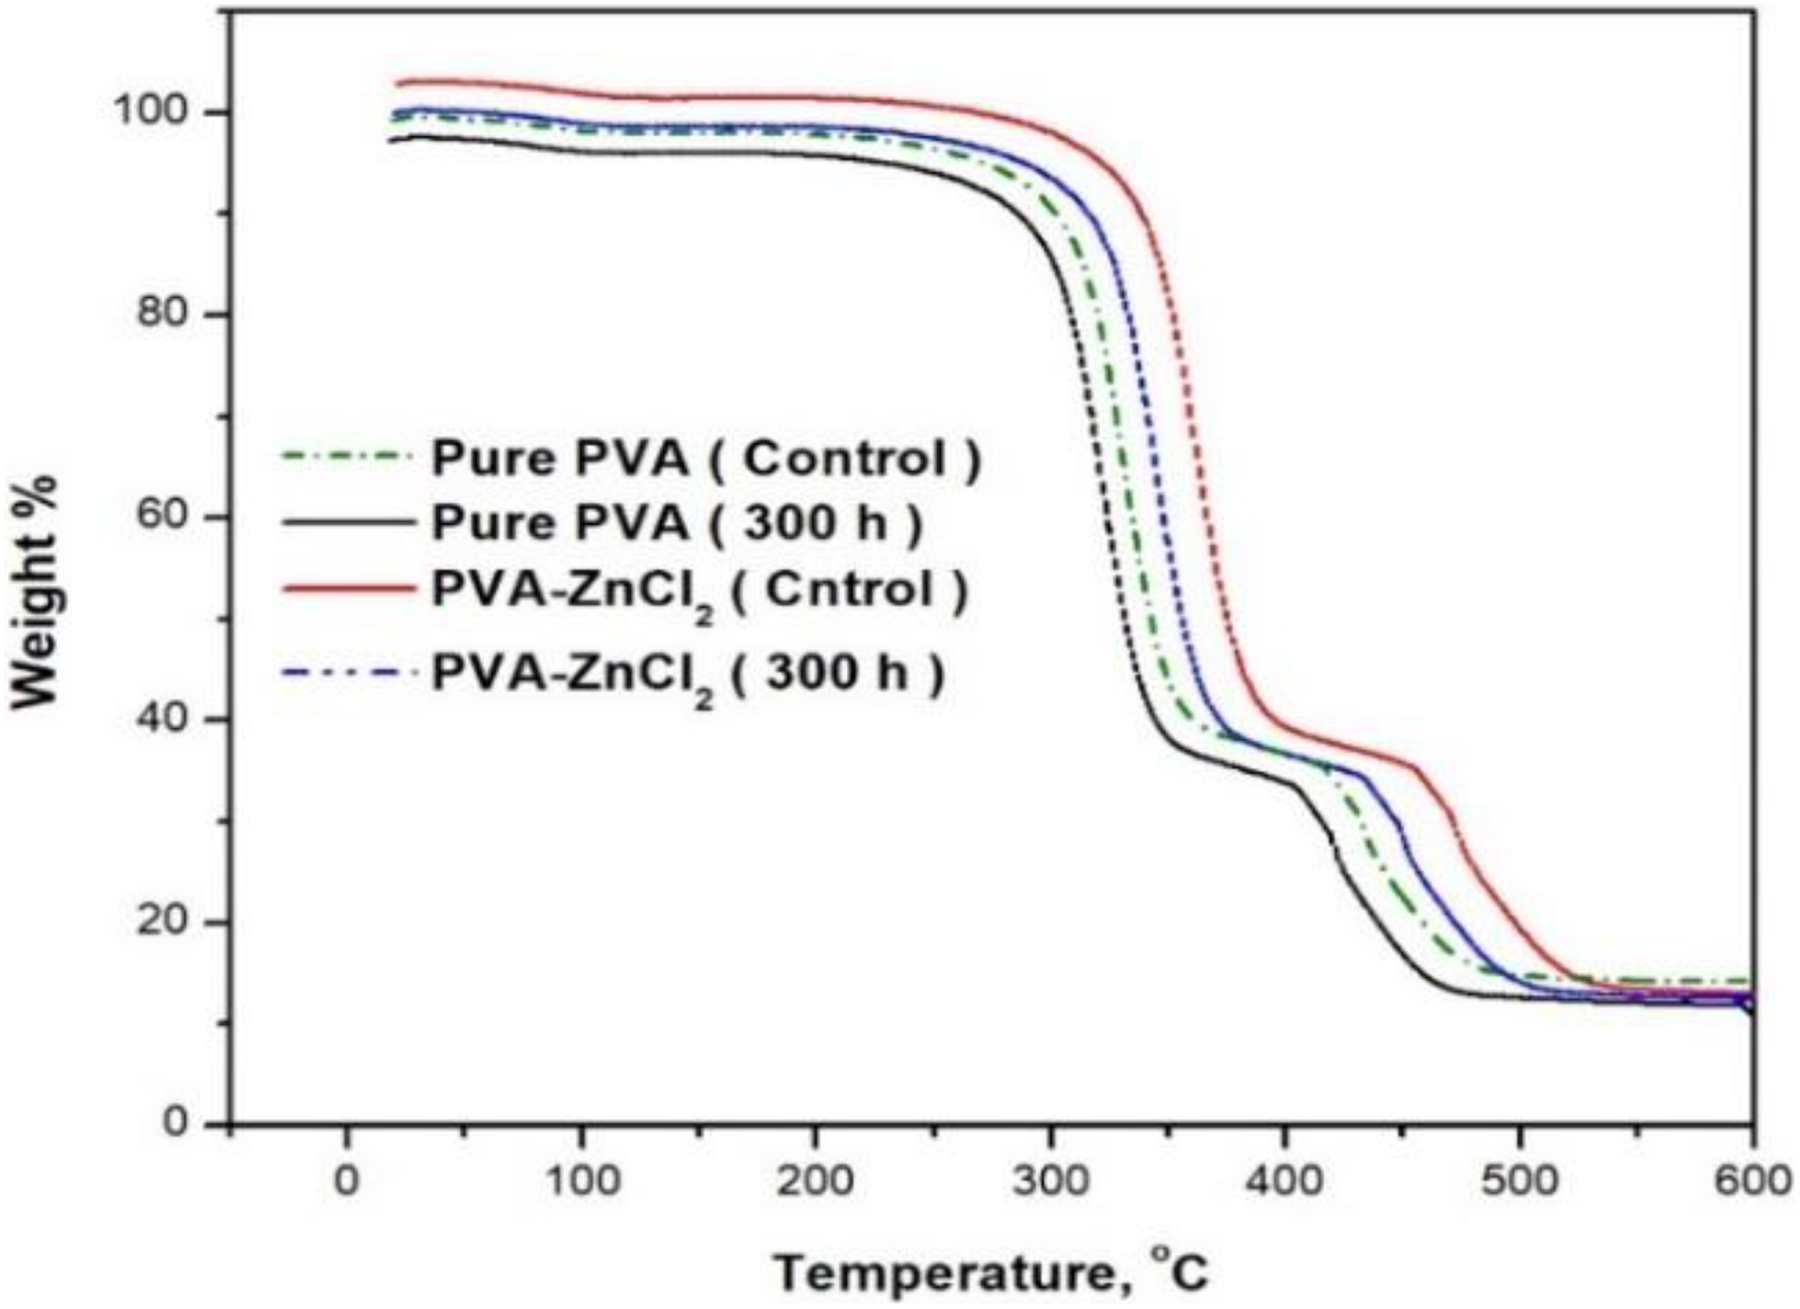
The mass loss curves of PVA and PVA composites before and after exposure to 300-h UV irradiation time.
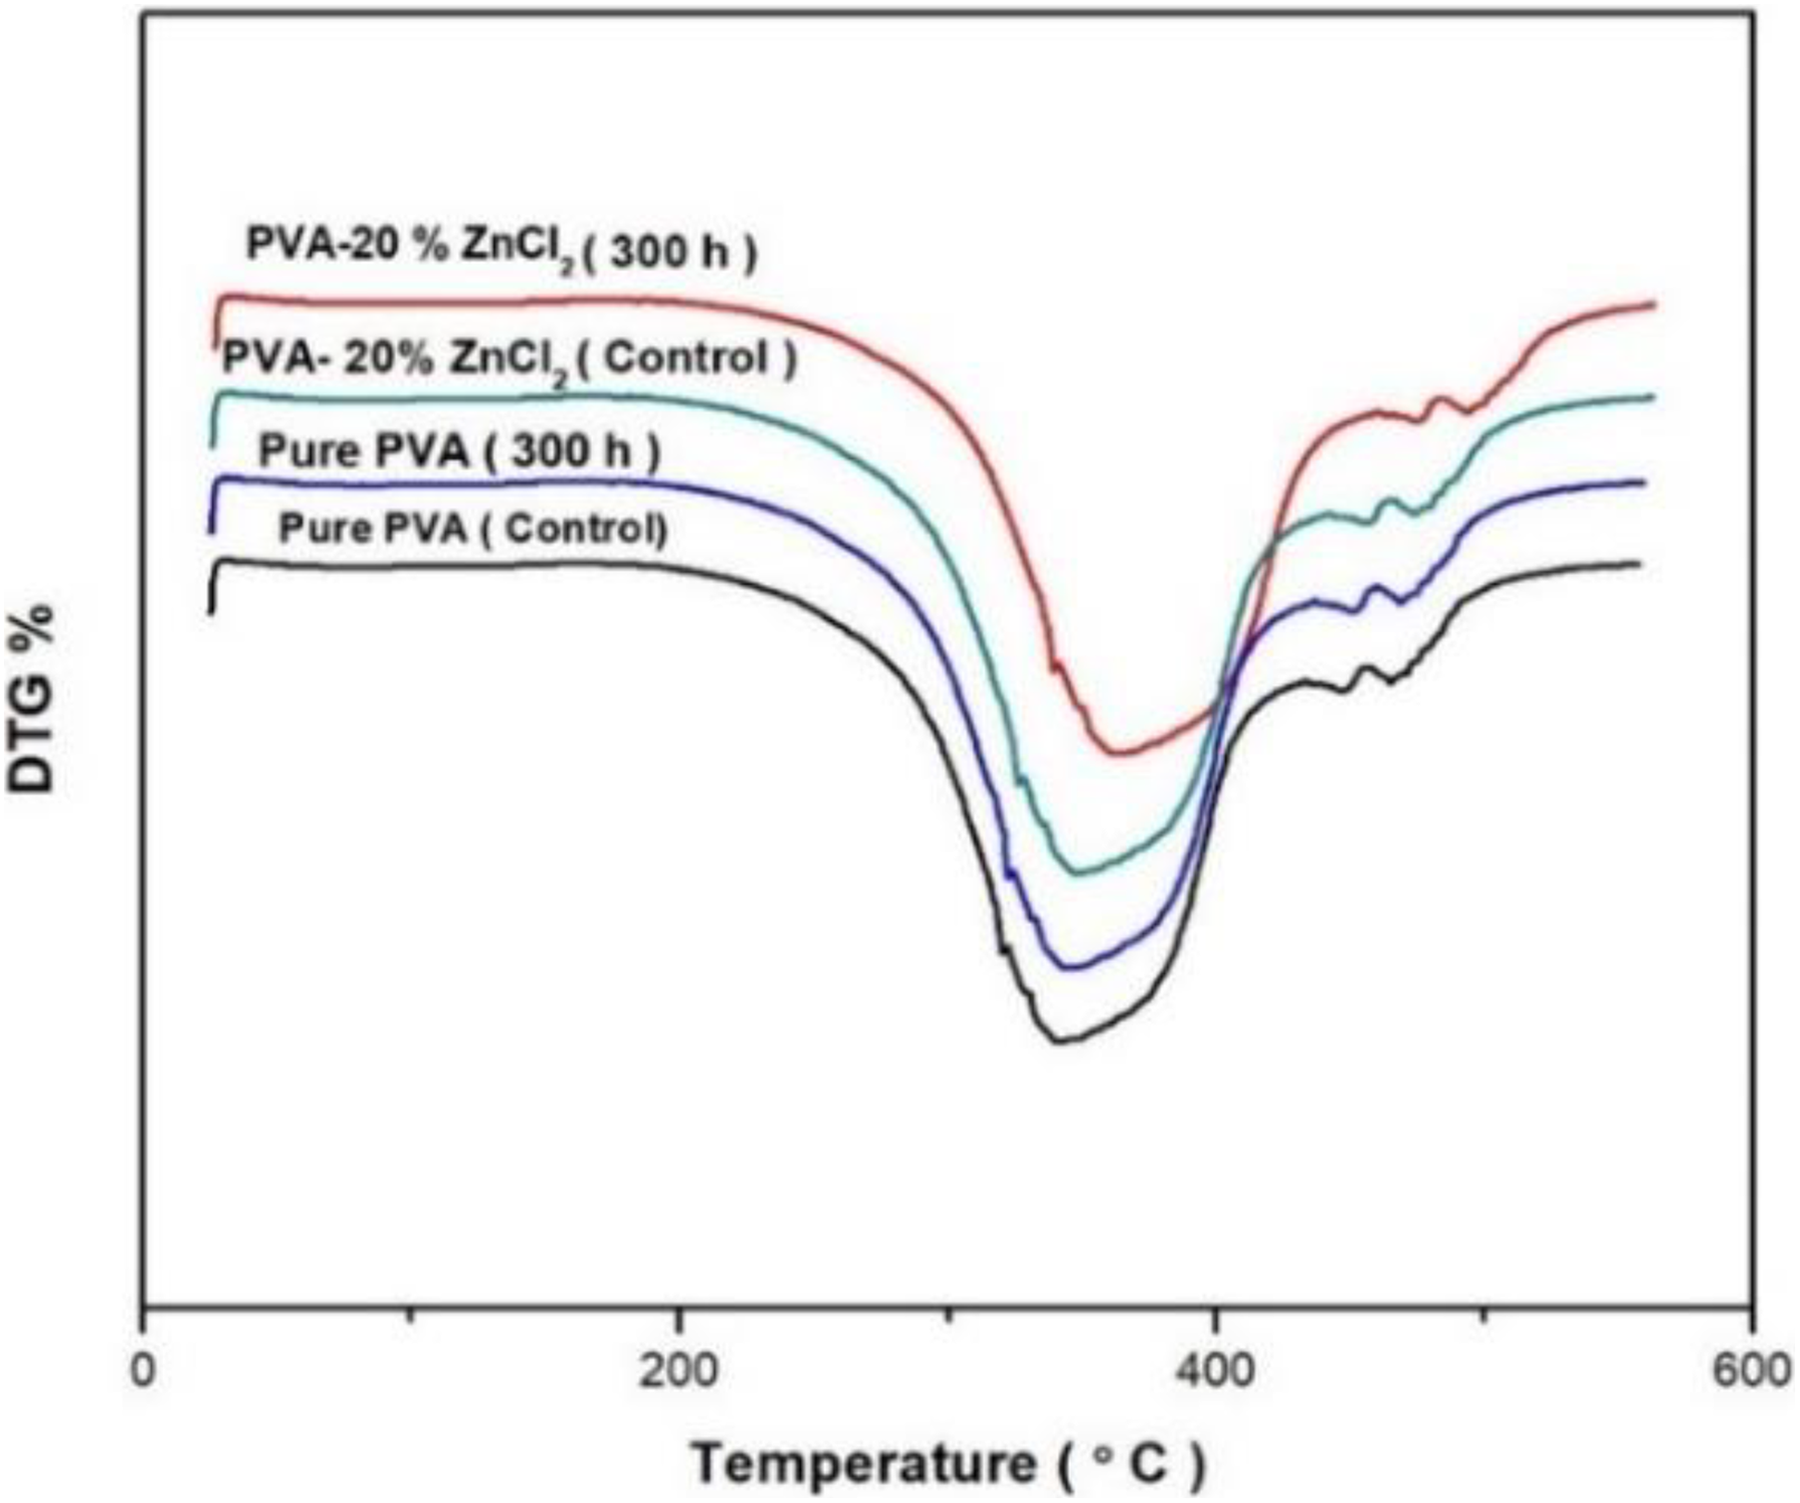
DTG curves of PVA and PVA composites before and after exposure to 300-h UV irradiation time.
TGA data of PVA and PVA–ZnCl2 composites before and after exposure to different irradiation times.
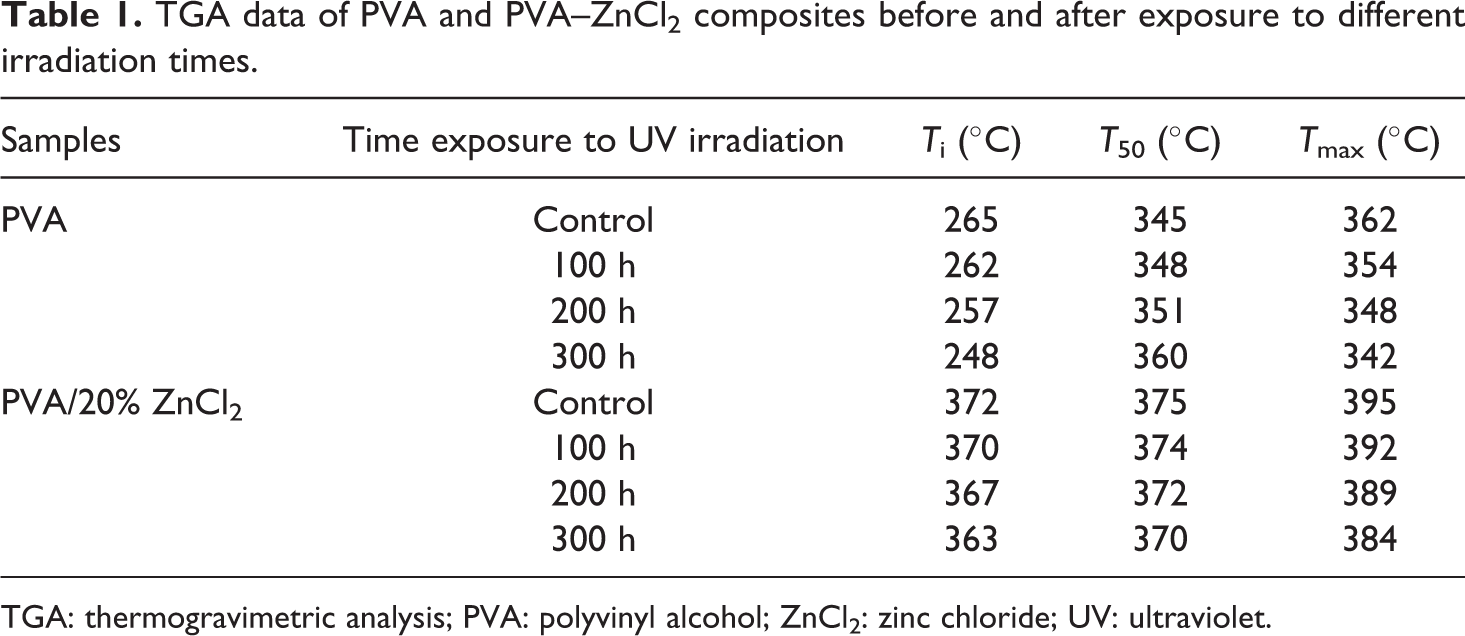
TGA: thermogravimetric analysis; PVA: polyvinyl alcohol; ZnCl2: zinc chloride; UV: ultraviolet.
Before exposure to UV irradiation, The 20% ZnCl2 into PVA exhibited a higher initial decomposition temperature (372°C) than that of PVA sample (322°C). After 300 h of exposure, PVA composites showed more resistant to reduce the mass loss at the T max (384°C); the presence of high surface area ZnCl2 dispersed throughout the PVA improves its stability, resulting in increased melting temperatures. Further increasing of exposure time (100, 200, and 300 h), the rate of decomposition temperature decreased for all samples. The decomposition rate of the PVA composite, after 300 h UV of exposure, showed more thermal resistance and stability (384°C), compared to PVA sample (342°C). These results proved that the presence of 20% ZnCl2 was a significant photostabilizer to resist UV exposure when compared to PVA
DMA of PVA composites
DMA monitored the viscoelastic behavior of the samples within a range of temperature, the stiffness, and damping of the samples exposed to oscillatory load and tested as modulus and tan δ. The storage modulus–temperature curves of PVA and PVA composites are shown in Figure 8. All samples underwent a drop in stiffness as the temperature increased from 25°C to 140°C. Storage modulus of PVA composites improved and exhibited more resistance after exposure to 300-h UV irradiation, compared to PVA that decrease significantly after UV irradiation exposure (Figure 8). Figure 9 shows tan δ as a function of temperature for PVA composite at a fixed frequency of 40 Hz. It can be observed that all PVA composites did not show significant changes on peak corresponding to its glass transition temperature (T g) after exposure to 300-h UV exposure. These indicate the stronger interaction between PVA and ZnCl2 filler as compared to PVA.
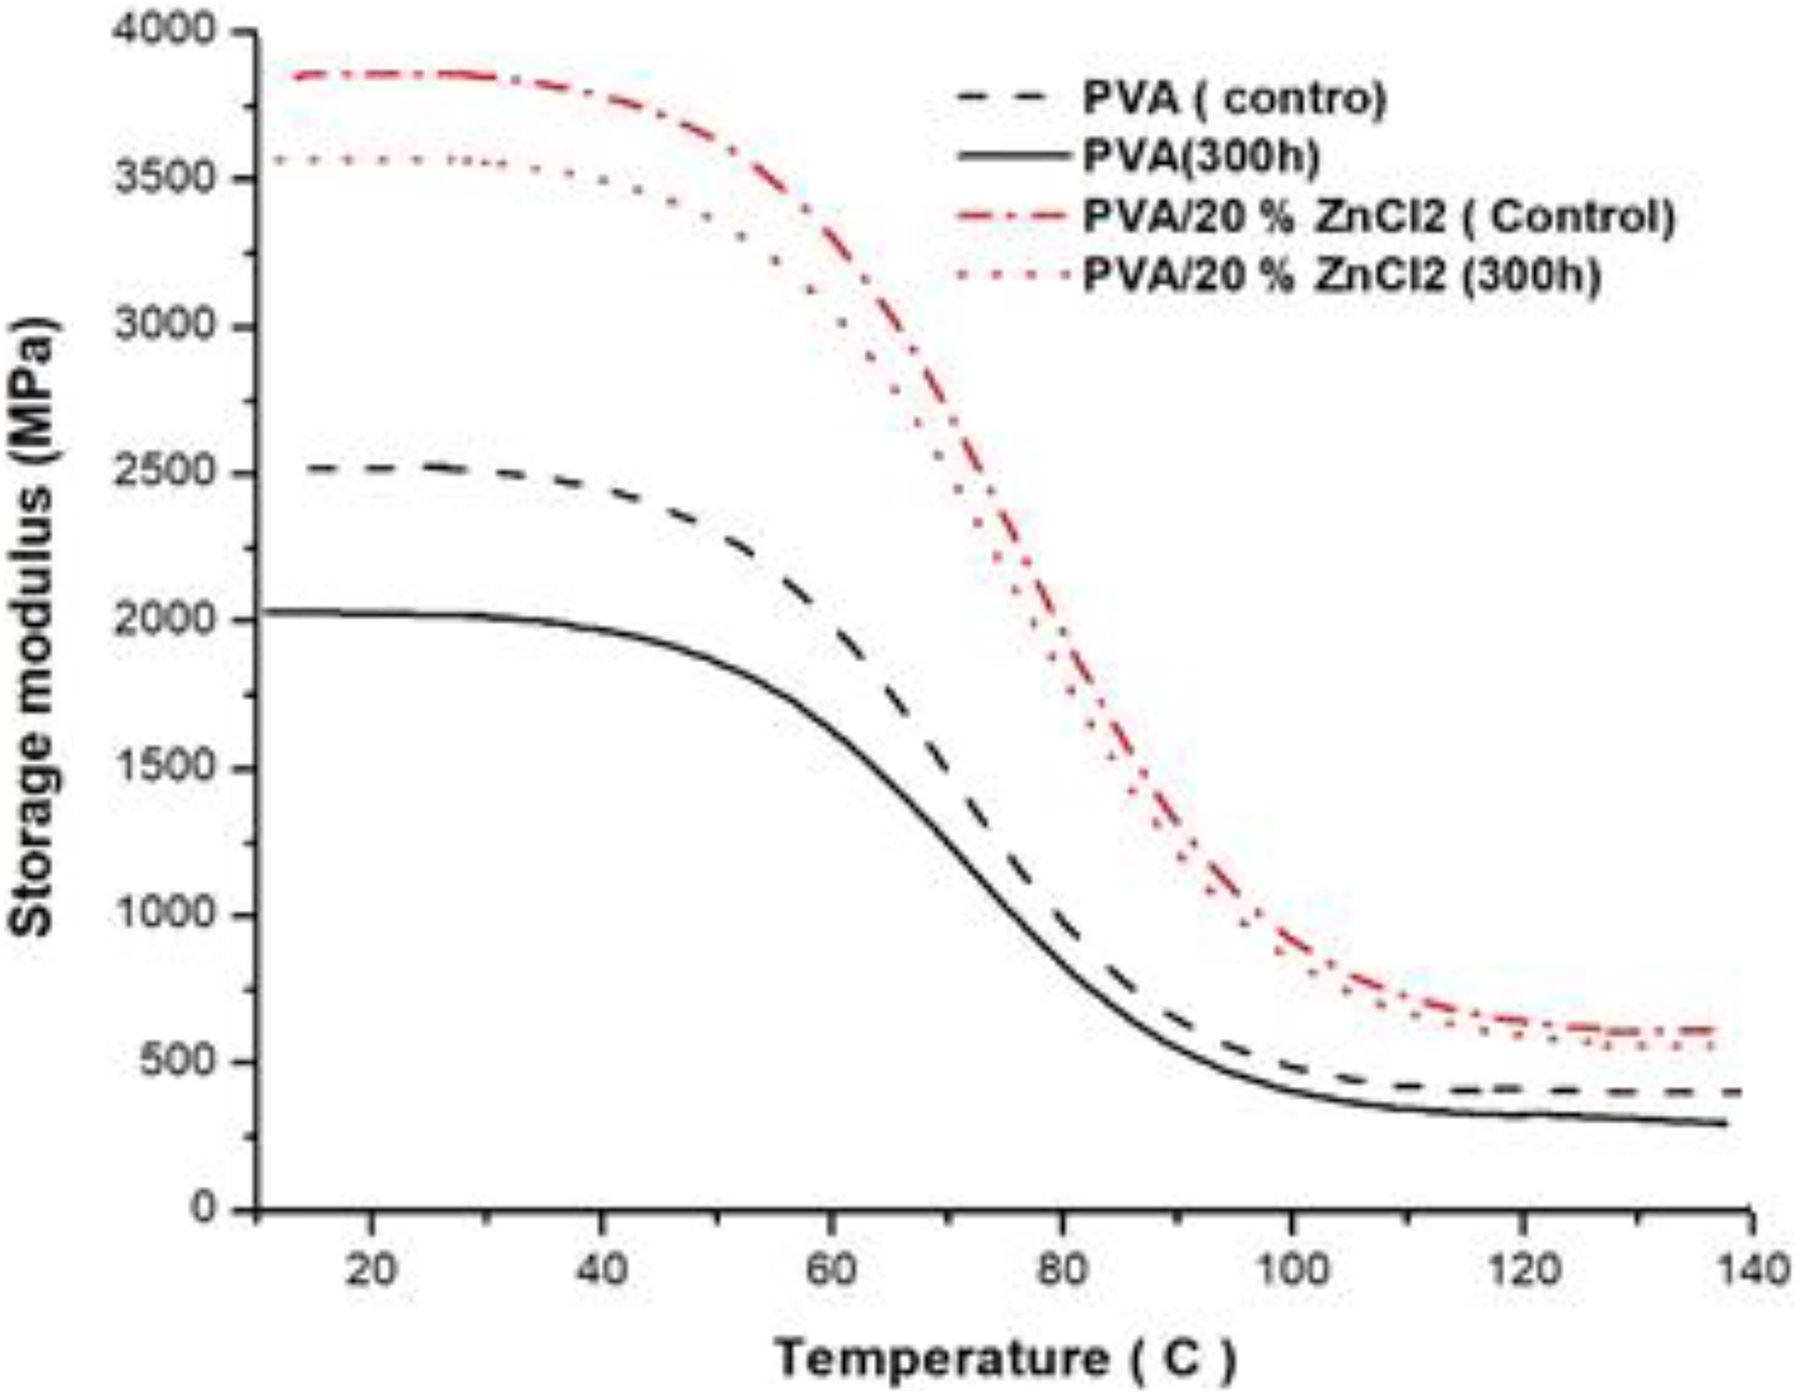
Storage modulus versus temperature for PVA composites before and after exposure to 300-h UV irradiation time.
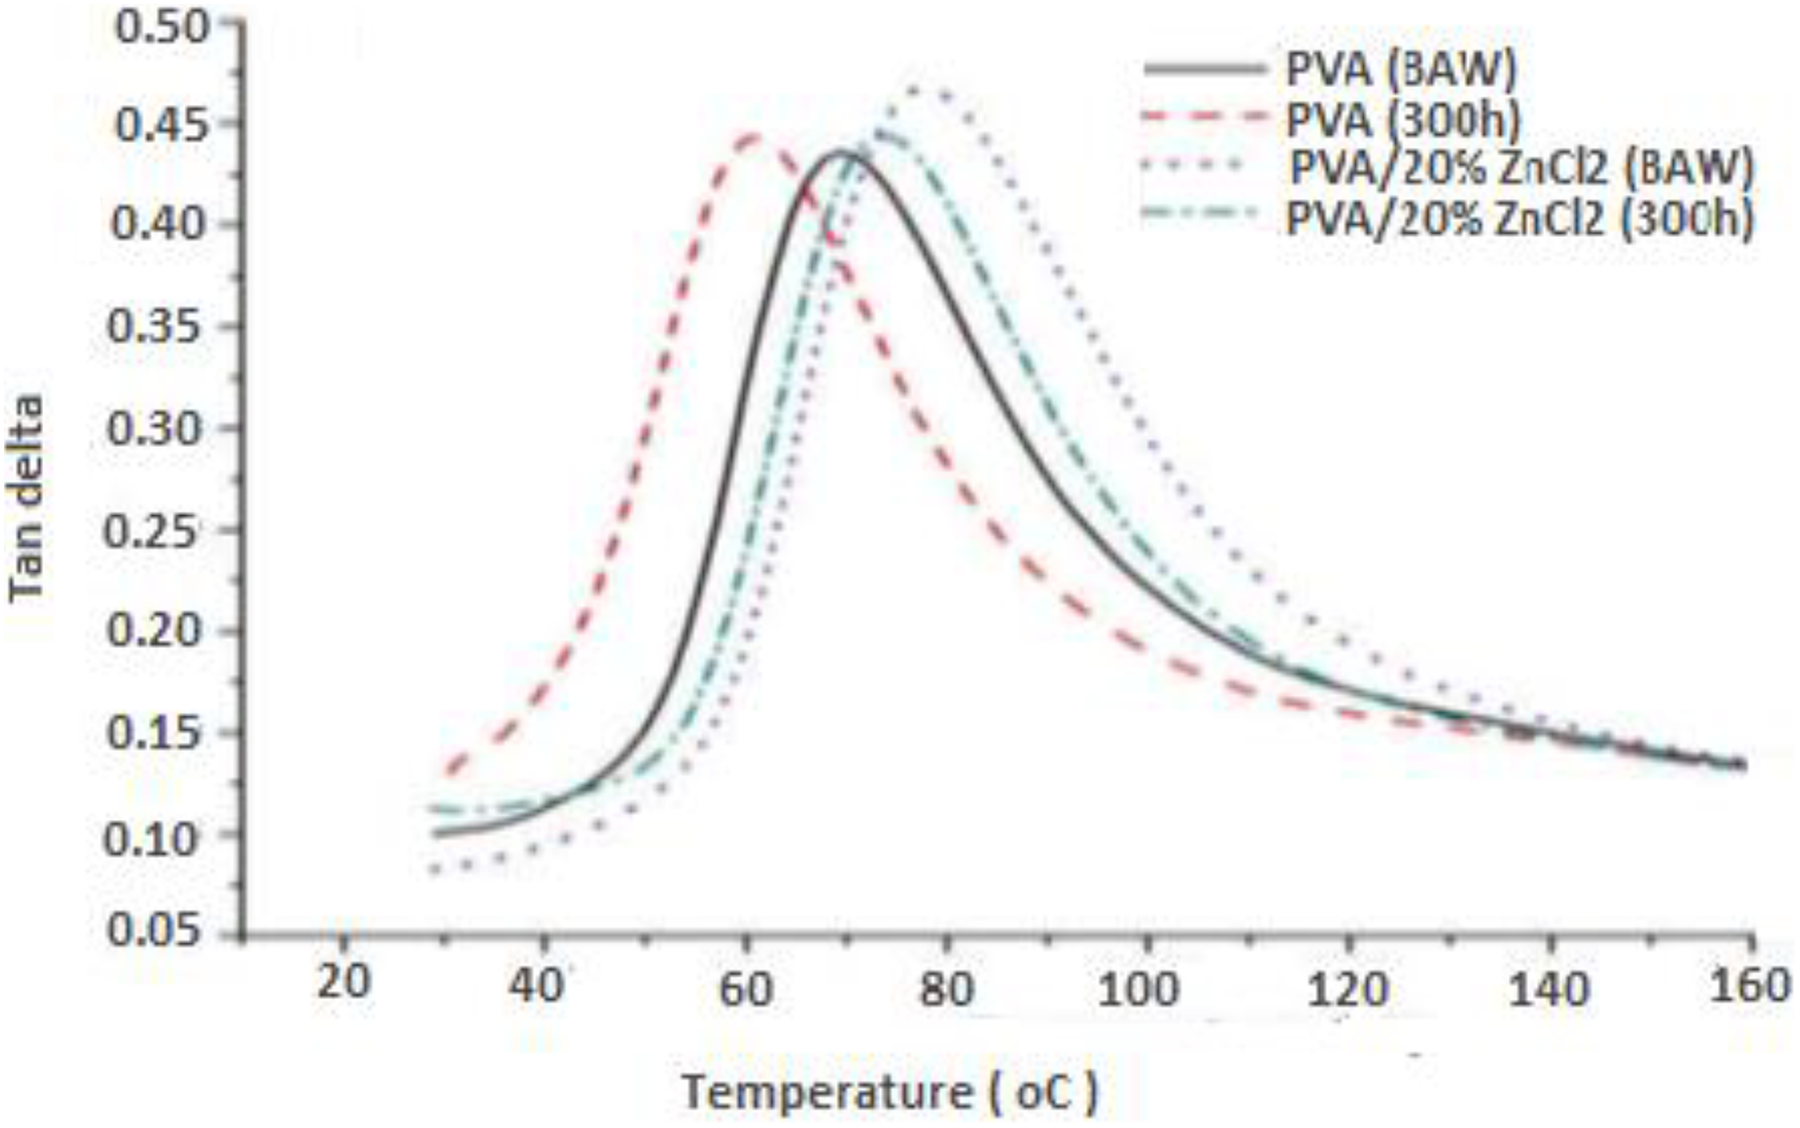
Tan δ as a function of temperature for PVA composites before and after exposure to 300-h UV irradiation time.
DMA of PVA composites
DMA monitored the viscoelastic behavior of the samples within a range of temperature, the stiffness, and damping of the samples exposed to oscillatory load and tested as modulus and tan δ. To evaluate the consequences of accelerated weathering exposure on the storage modulus and tan δ, DMA tests were conducted, and storage modulus versus temperature curves of PVA and PVA composites are shown in Figure 8. All samples underwent a drop in stiffness as the temperature increased from 25°C to 140°C. Storage modulus of PVA composites improved and exhibited more resistance after exposure to 300-h UV irradiation, compared to PVA that decrease significantly after UV irradiation exposure (Figure 8). Figure 9 shows tan δ as a function of temperature for PVA composite at a fixed frequency of 40 Hz. It can be observed that all PVA composites did not show significant changes on peak corresponding to its T g after exposure to 300-h UV exposure. These indicate the stronger interaction between PVA and ZnCl2 filler as compared to PVA.
T g evaluations of PVA and PVA composites
The T g is the temperature at which the mechanical properties of the polymer changed completely due to the internal changes of the polymer chains. 24 T g is one of the most significant features to evaluate the efficiency of polymeric materials. 25 Figure 10 shows the DSC thermograms for all conditions. T g of neat PVA was 87.5°C. After exposure to 300 h of UV exposure, the T g was slightly lower (72.4°C) than in other conditions, that is, 100 and 200 h (84.5 and 82.6°C), respectively (Figure 11). The drop in T g values was due to the effect of UV irradiation absorbed during degradation. PVA composite exhibited higher T g (107.5°C) than that of PVA (95.2°C) after exposure to UV irradiation. PVA composites showed more resistant to reduce the T g values than that of PVA because UV irradiation made more brittle for PVA sample.
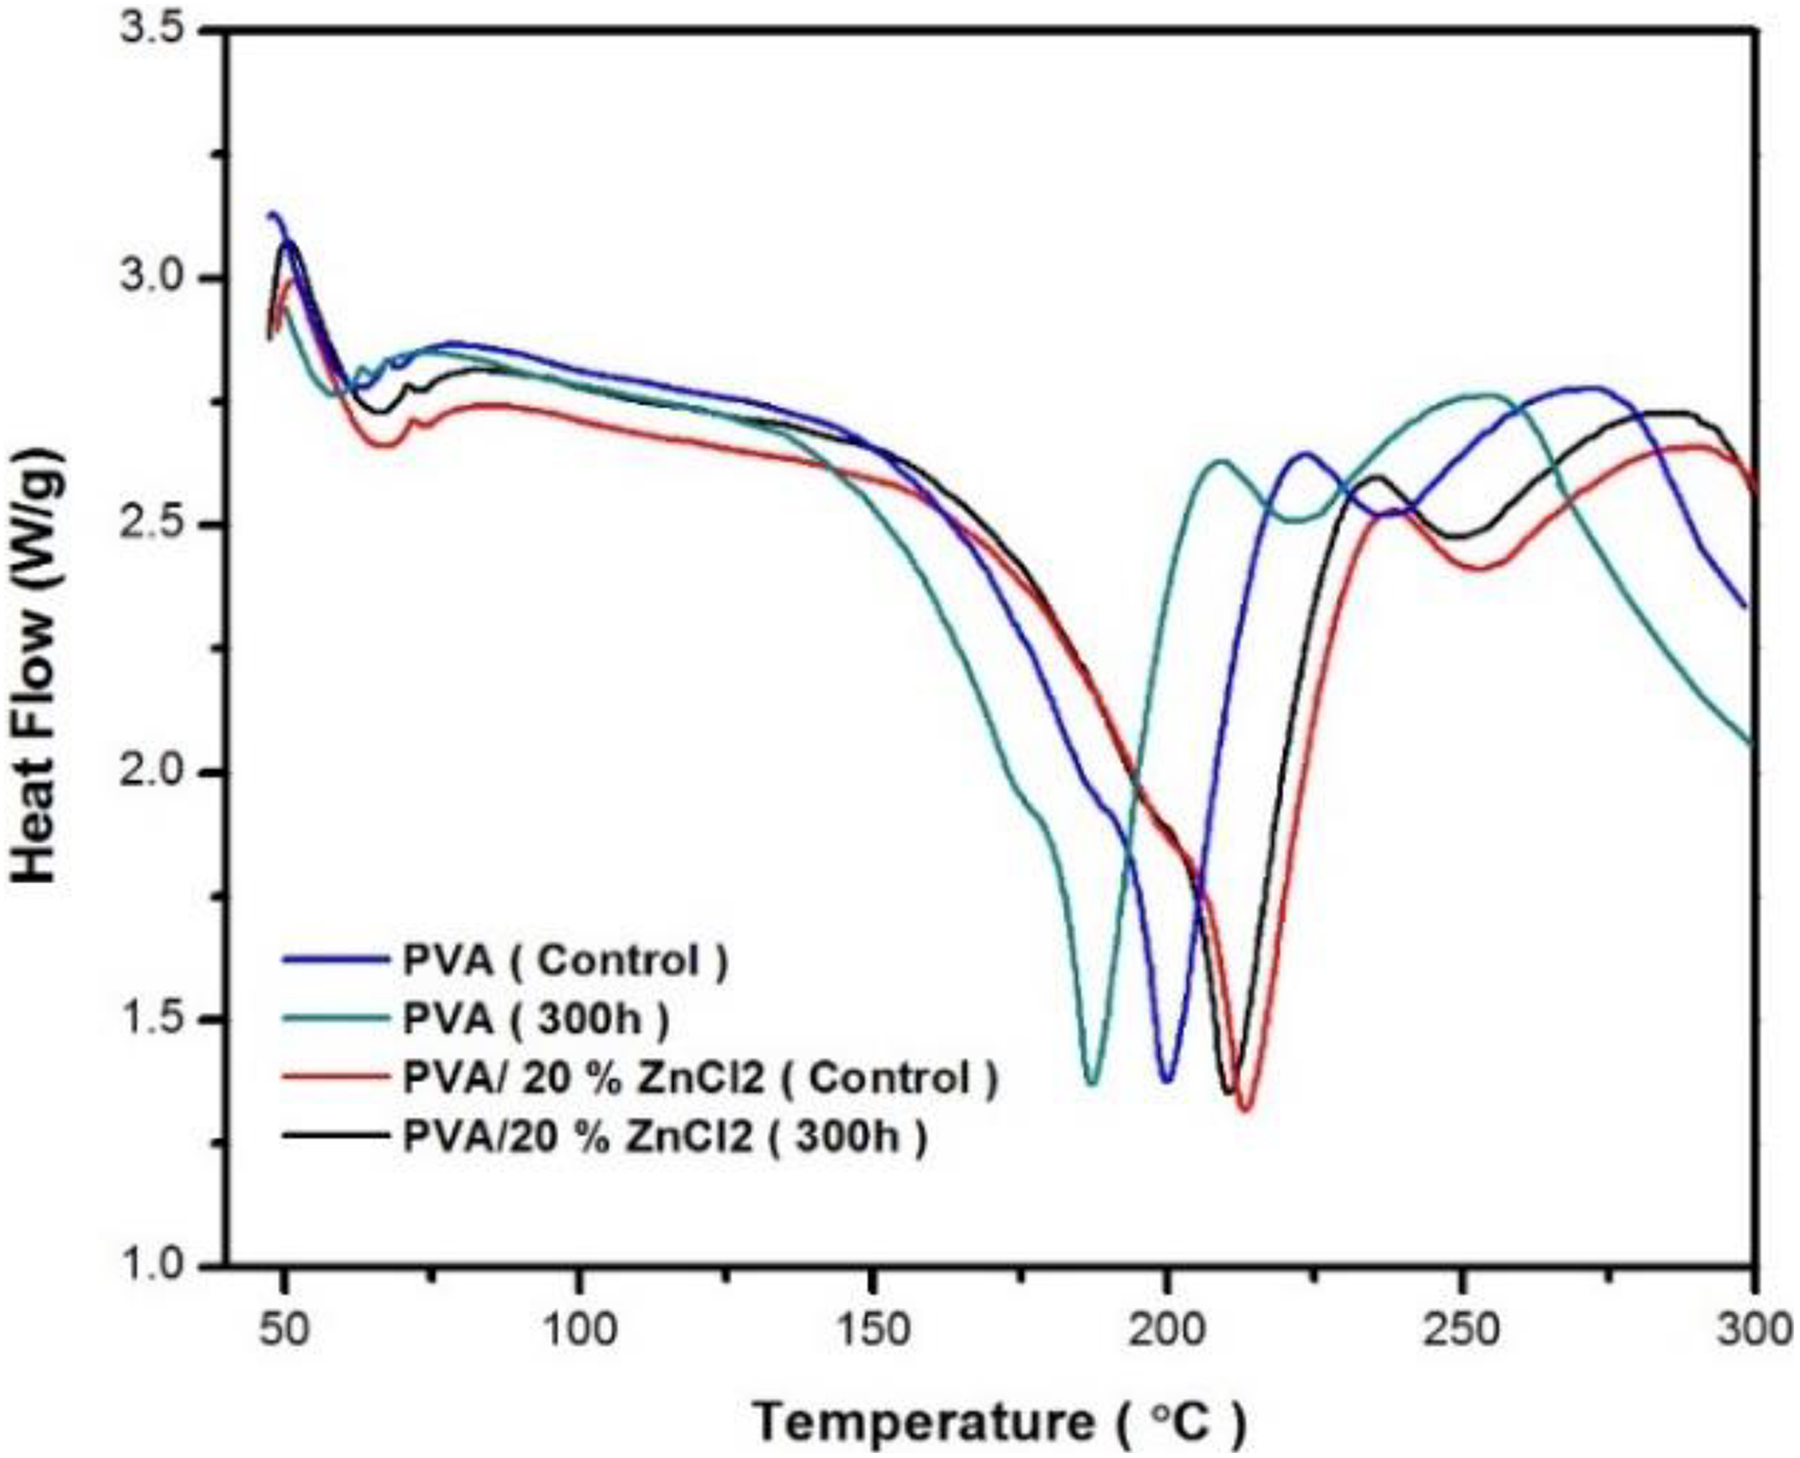
Heating DSC thermograms curves of PVA and PVA composites before and after exposure to 300-h UV irradiation time.
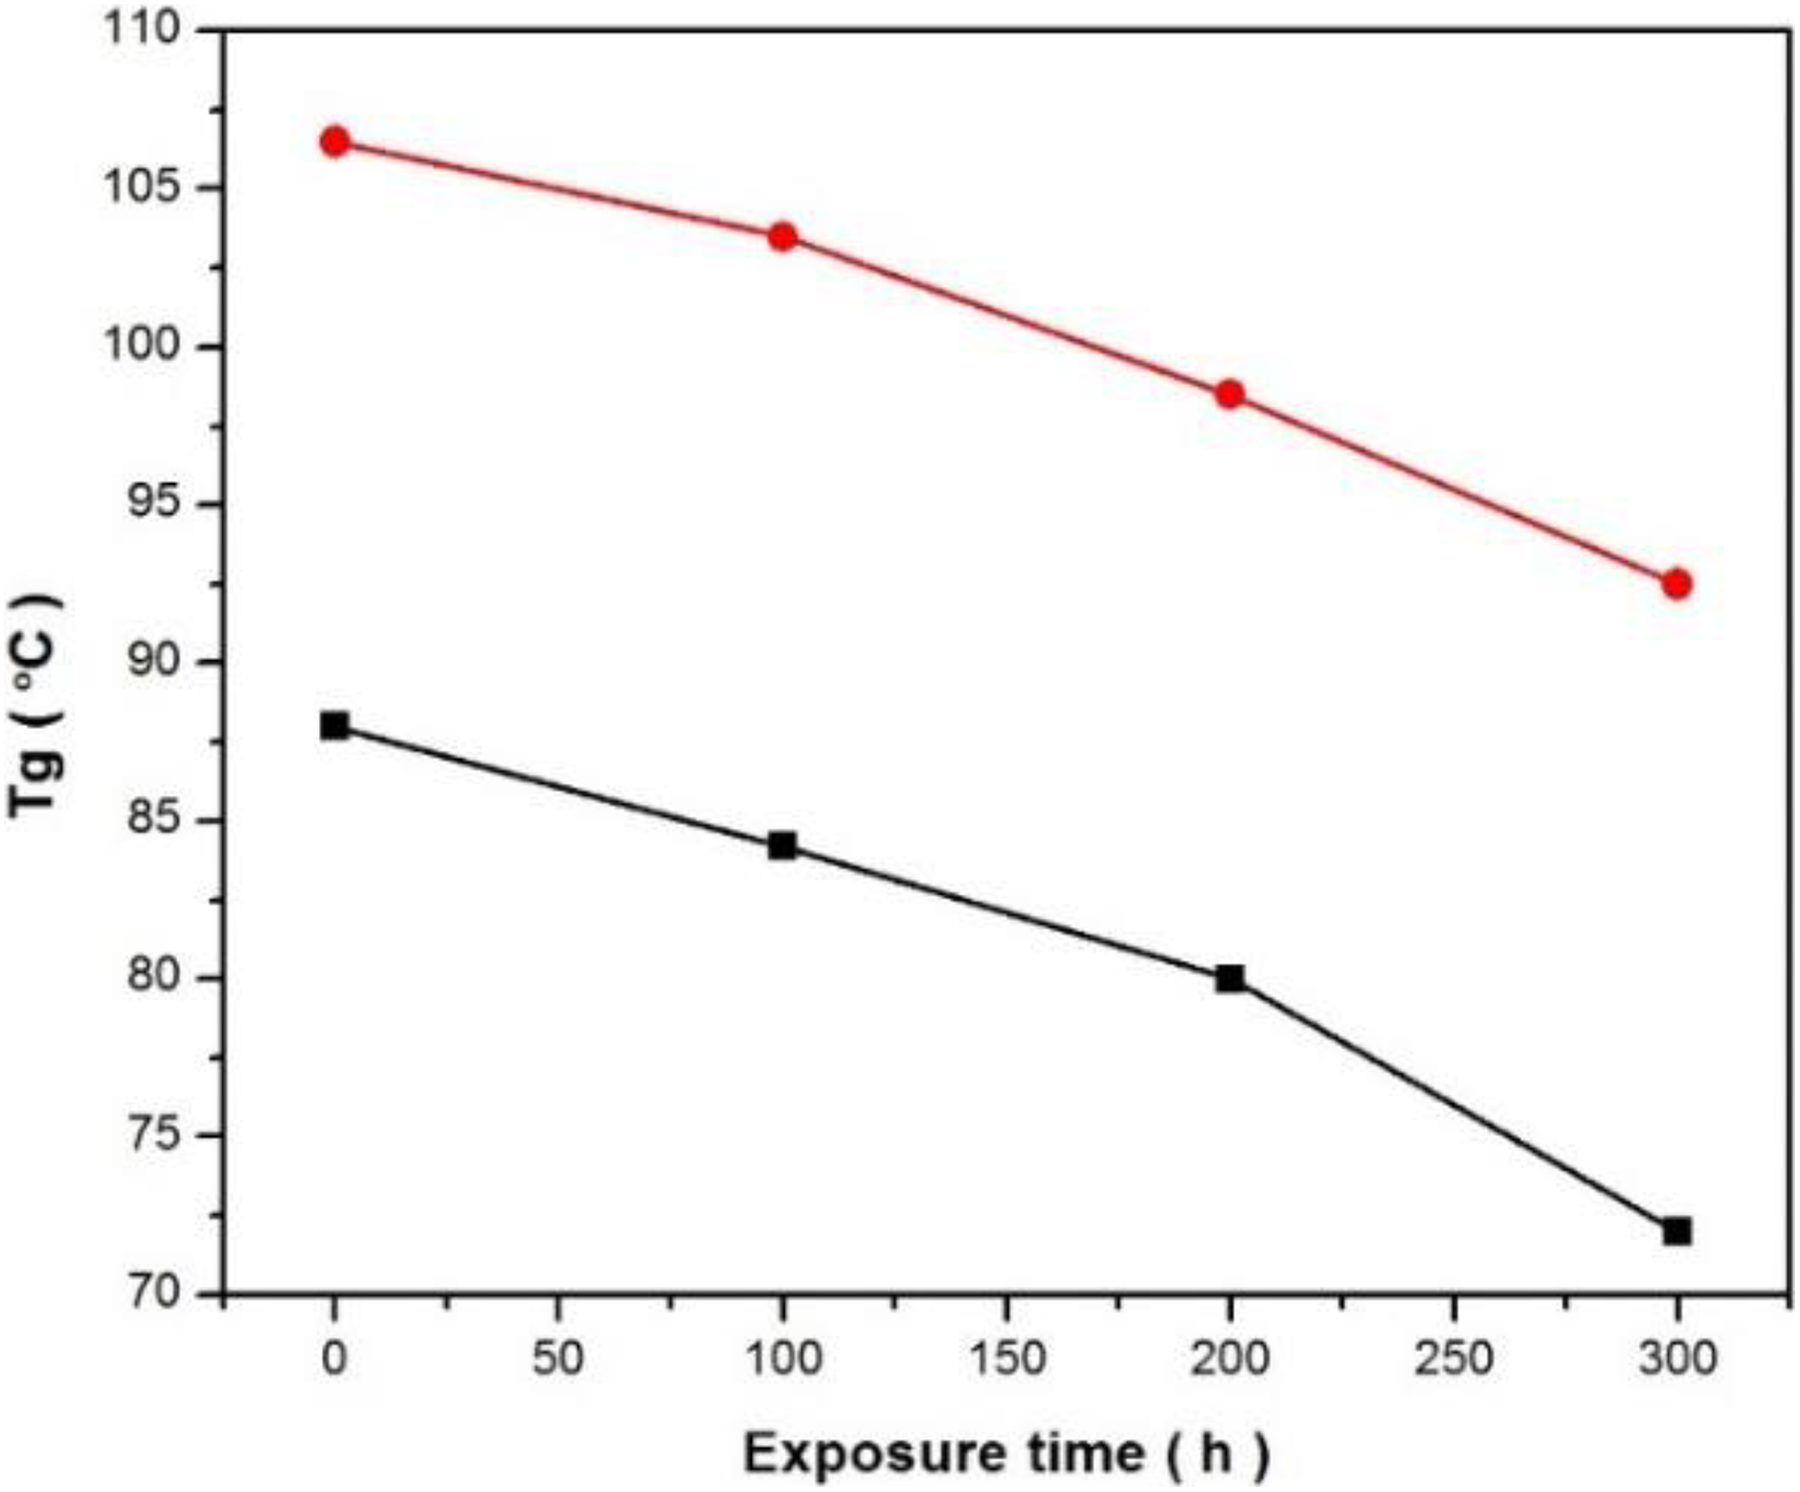
T g values from DSC thermograms curves of PVA and PVA composites before and after exposure to different UV irradiation times.
Tensile properties
Mechanical measurements can reflect accelerated weathering resistance directly. 26,27 Based on the reason, the effect of 20 wt% ZnCl2 on the mechanical properties was examined by studying tensile strength and elongation at break. The changes in tensile strength and elongation at break of PVA and PVA composite are presented in Figures 12 and 13, respectively. Before accelerated weathering exposure, the tensile strength of PVA composite showed a higher value (22.6 MPa) than that of PVA (12.7 MPa) before exposure to accelerated weathering. In the case of 20 wt% ZnCl2-filled PVA, the tensile strength dropped by 13, 21, and 46% upon the exposure period of 100, 200, and 300 h, respectively. While in the case of the control system (PVA), the strength decreased by 22, 40, and 56% for 1, 2, and 300 h exposure, respectively.
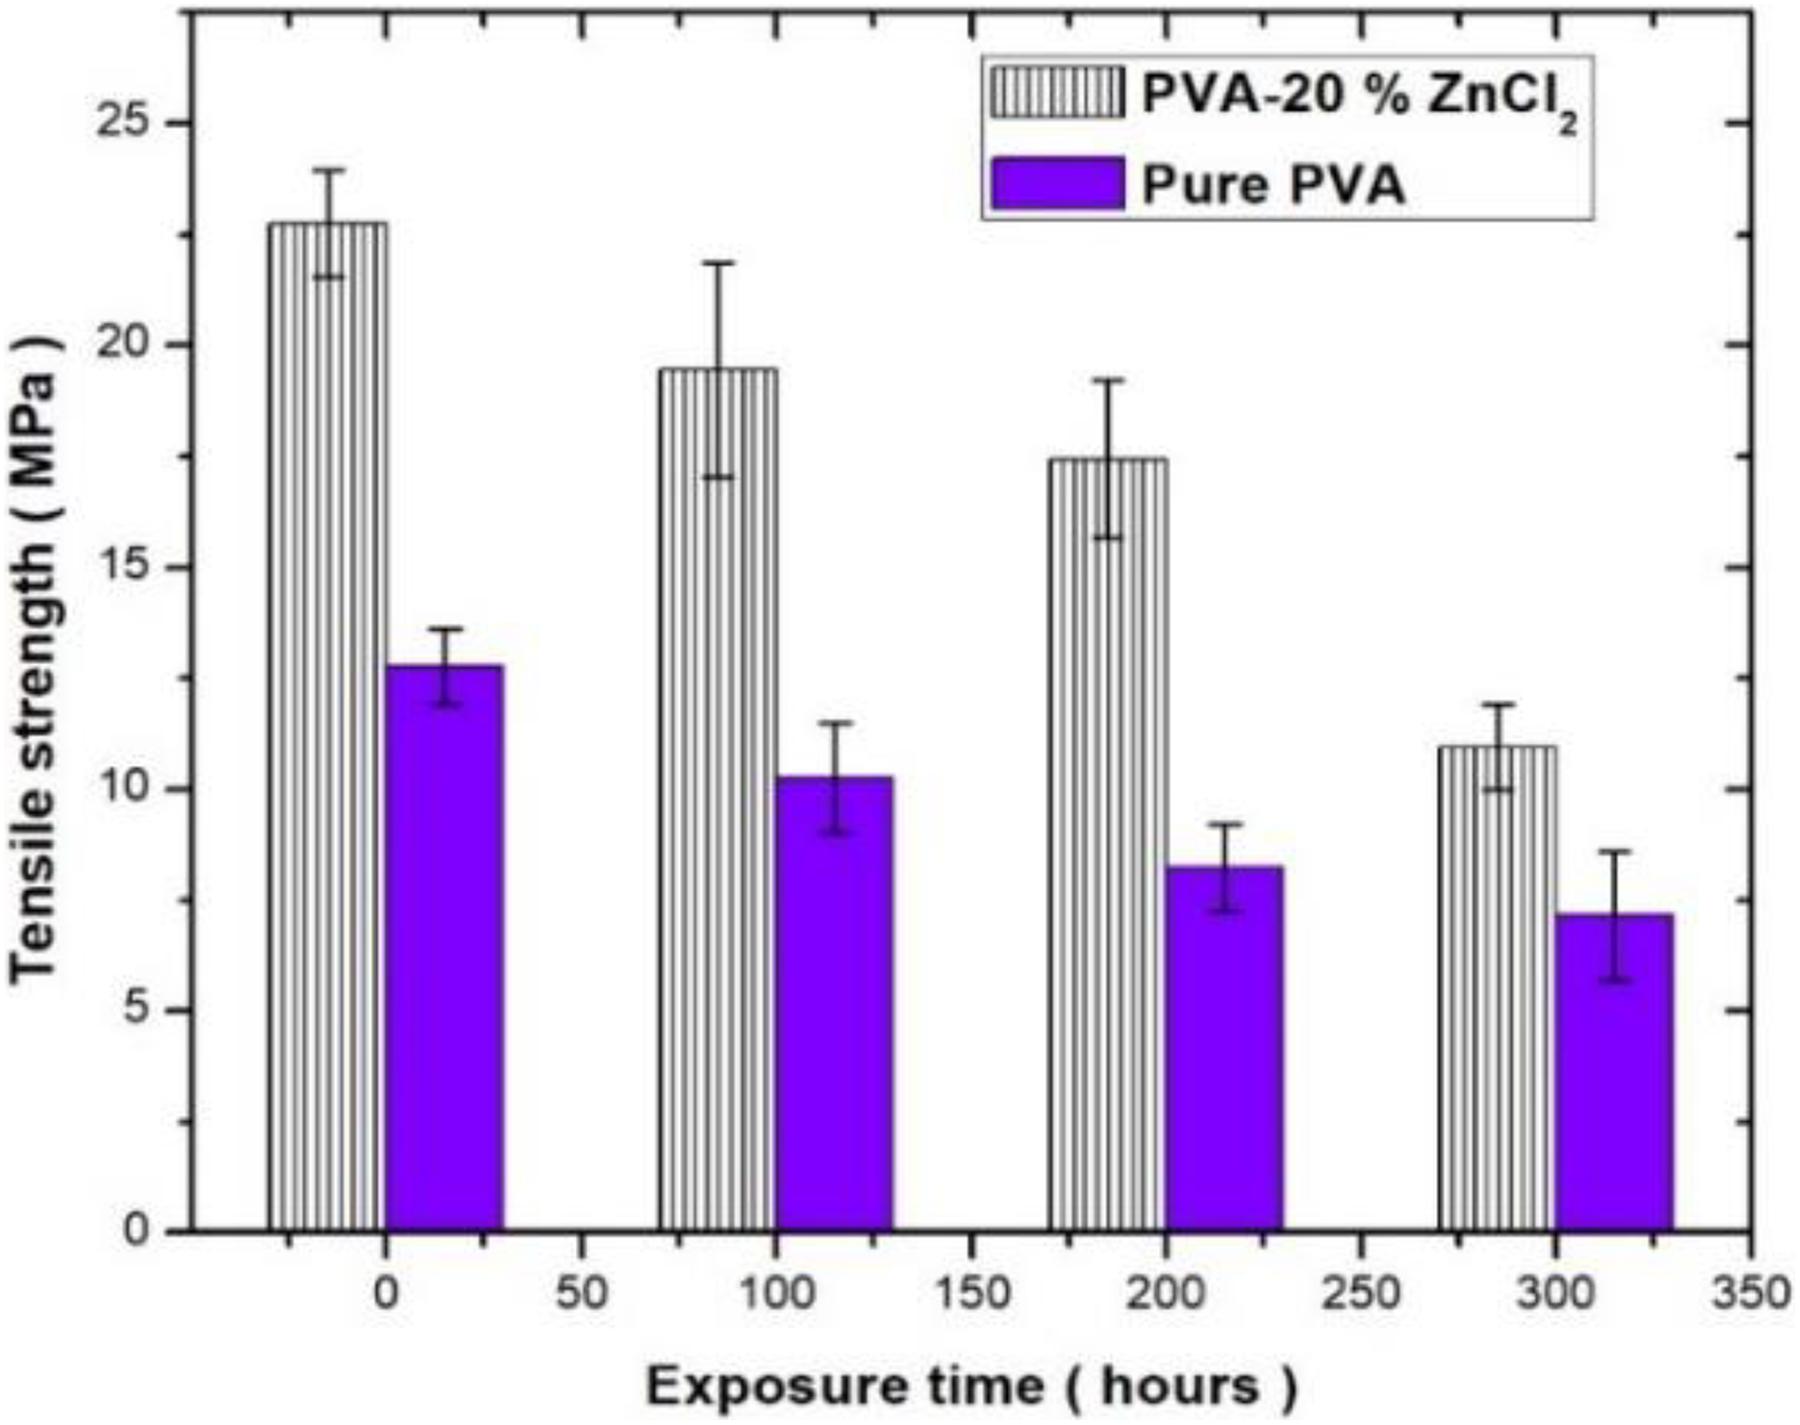
Tensile properties of PVA composites as a function of UV irradiation exposure durations.
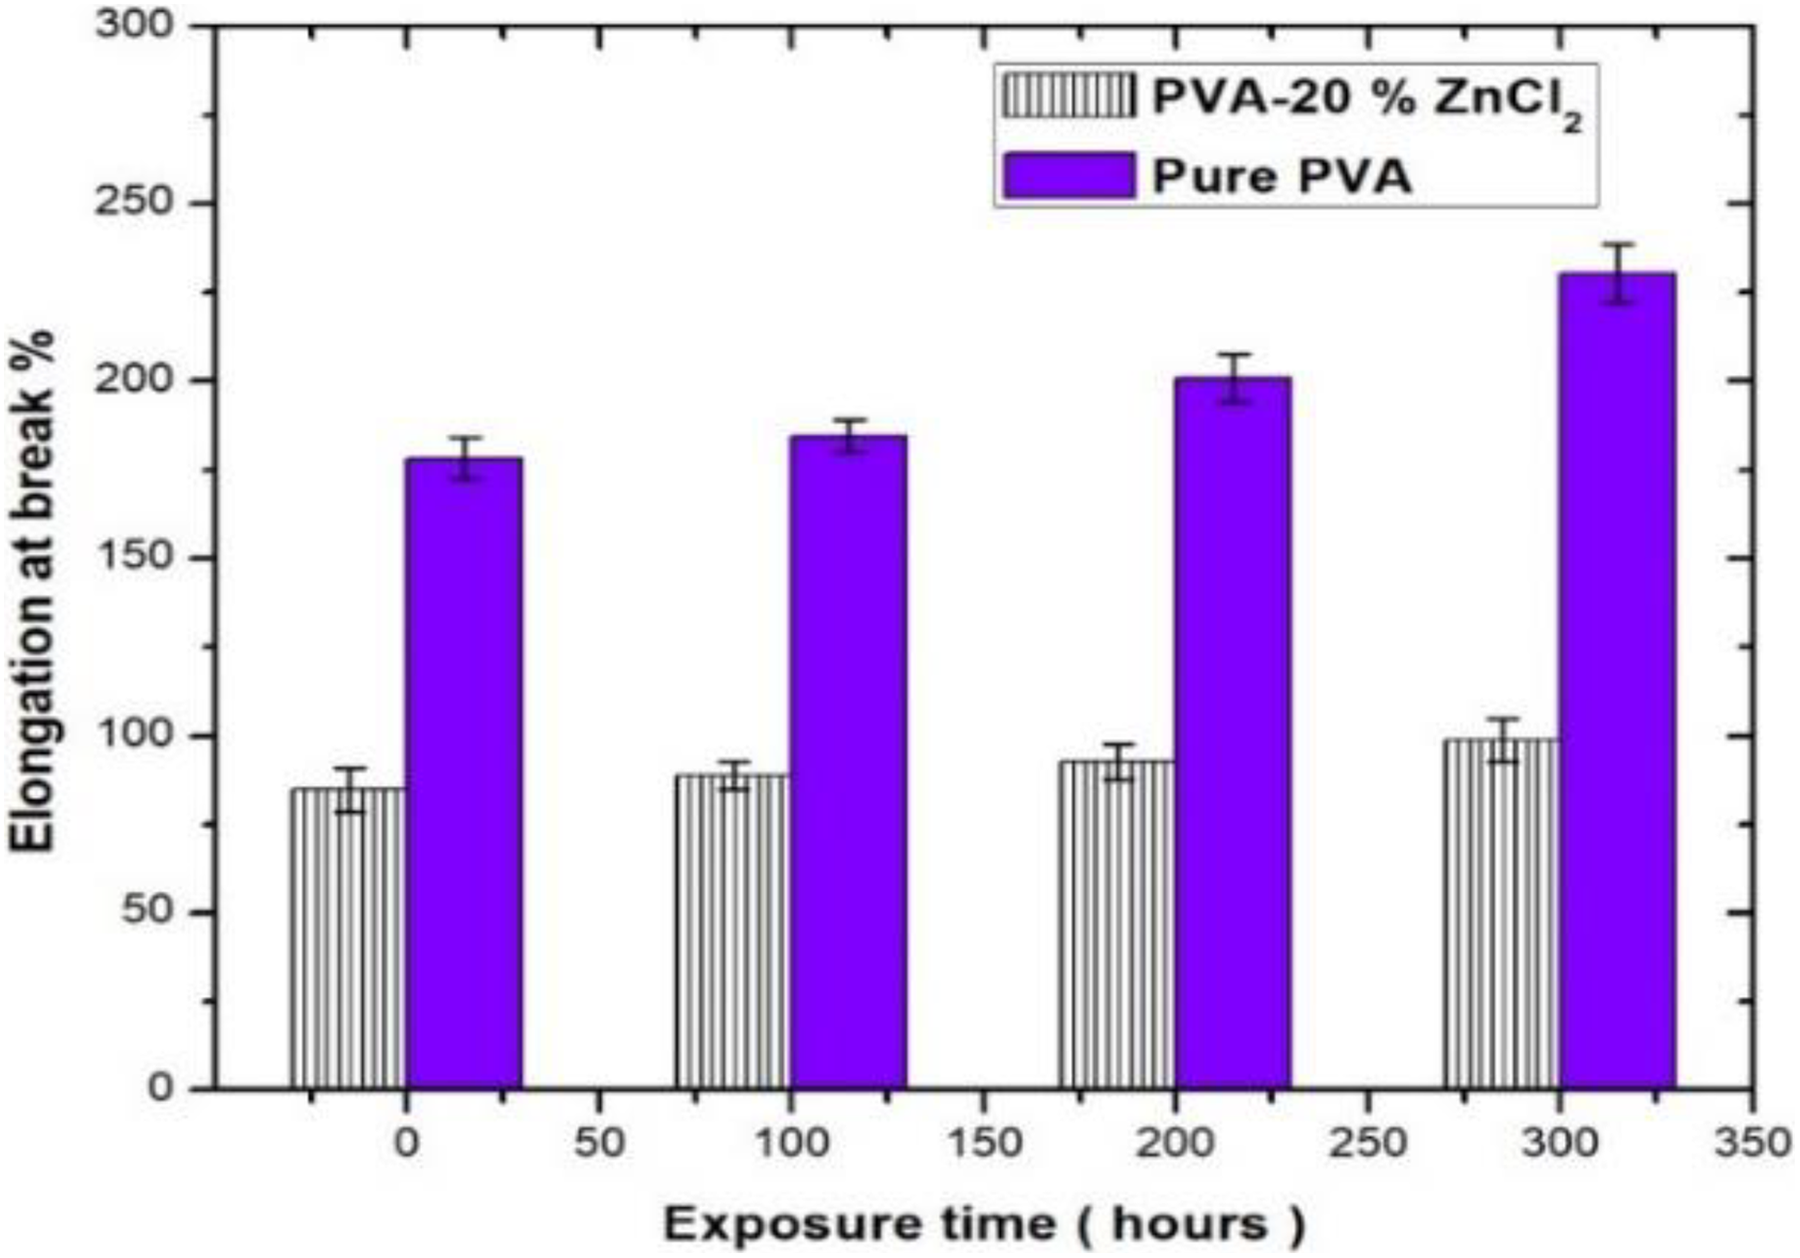
Elongation at break of PVA and PVA composites as a function to different UV irradiation exposure times.
Mechanical degradation causes excessive brittleness by chain cross-linking and reduced strength by chain scission when exposed for a long time to UV irradiation. Before exposure, elongation at break of PVA exhibited lower elongation a fewer elongation (80%), compared to that of PVA (175.5%). Upon 300 h of exposure, the elongation at break of PVA reduced the increase in elongation at break by 64% compared with the control system (PVA). The changes in mechanical results indicated that the presence of ZnCl2 in PVA matrix inhibits accelerated weathering of PVA.
XRD analysis
The XRD pattern of PVA and PVA composites before and after exposure is shown in Figure 14. Before exposure to UV irradiation, PVA composite indicated that a higher intensity at 19.6°, compared to PVA. It was obviously due to the high contribution of the ZnCl2 in the PVA. Figure 14 shows that the XRD patterns after 300-h UV exposure results in a reduction in the intensity of PVA and PVA composite, but the decline in intensity of PVA was more than PVA composites.
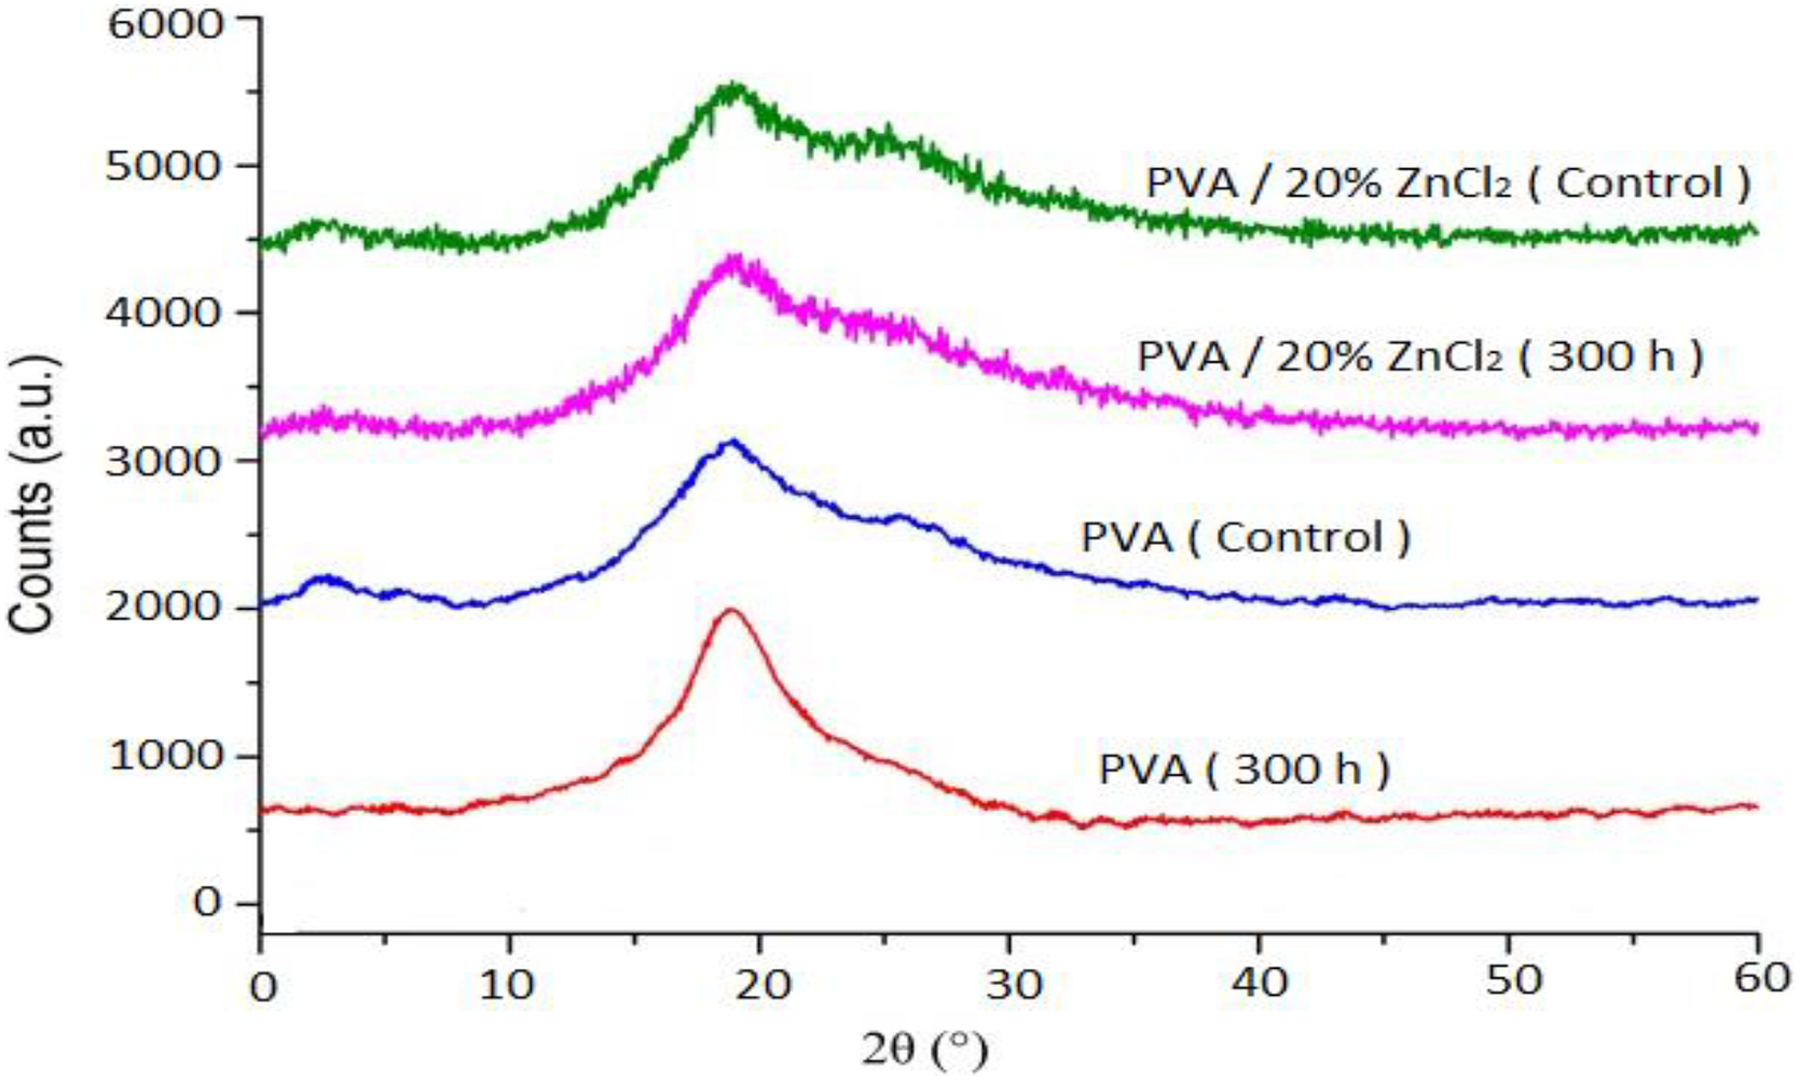
XRD patterns curves of PVA and PVA composites before and after exposure to 300-h UV irradiation.
Morphology tests
Figure 15 shows the SEM micrographs of PAV and PVA composites before and after exposure to UV irradiation. A disclosure of 300 h to UV irradiation caused obvious cracks and voids on the surface of neat PVA as shown in Figure 15(b), compared to neat PVA before exposure that showed smooth surface (Figure 15(a)). PVA composites showed minimal voids on the surface and irradiation (Figure 15(d)), compared to neat PVA after exposure to 300-h UV irradiation (Figure 15(c)).
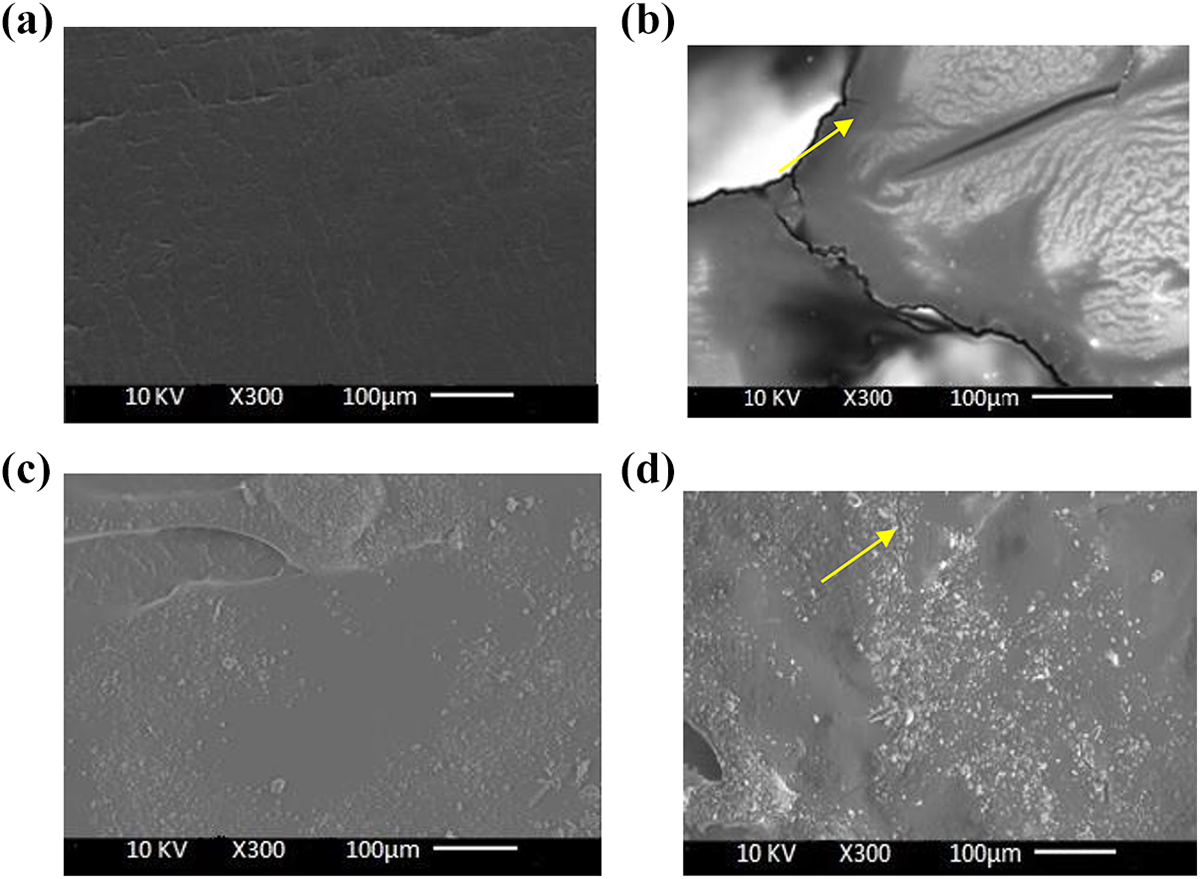
SEM micrographs of PVA (a) before, (b) after exposure, and PVA composites before (c) and after (d) exposure to 300-h UV irradiation.
Conclusions
The weathering stability of 20 wt% ZnCl2-reinforced PVA composites was improved after exposure to 300-h accelerated weathering. The general trend of PVA composite accelerated weathering showed that surface oxidation increased after exposure for PVA and PVA composite samples. However, after exposure to 50, 100, and 300 h of accelerated weathering, the PVA composite samples exhibited less carbonyl and hydroxyl indexes as compared to PVA samples. The results of TGA and DTG showed that PVA composite has more thermal stability before and after exposure to different UV irradiation times, compared to PVA samples. The storage modulus of PVA composites from DMA curves improved with the incorporation of 20 wt% ZnCl2 before exposure and exhibited more resistance to reduce storage modulus after exposure to 300-h UV irradiation, compared with PVA samples. After 300-h UV exposure, the tensile strength of PVA and PVA composite decreased, but PVA composites exhibited more resistance to the reduction in tensile strength, compared to PVA. Elongation at break increased with further UV again. However, PVA composite exhibited more resistance to elongation than that of PVA samples after exposure to 300 h. The SEM images showed no significant changes on the surface of PVA composites after exposure to 300-h UV irradiation, compared with the surface of PVA samples.
Footnotes
Acknowledgements
The authors would like to thank USM University for Research supportsand also thank School of Material Science and Engineering, Yarmouk University for instrumental assistance.
Funding
The author(s) received no financial support for the research, authorship, and/or publication of this article.