
Abstract
In thick thermoplastic composite laminates, nonuniform temperature and cooling rate distribution arises in the through-thickness direction during cost-effective high-rate manufacturing processes. Annealing is often carried out after molding to homogenize degree of crystallinity (DOC) and to reduce residual stress. Even though the change in the residual stress/strain distribution occurring inside thick laminates by this heat treatment is practically important, the changing process and the detailed mechanism are not sufficiently clarified. This present study addresses development and redistribution behavior of residual stress through both molding and annealing using multiple optical fiber sensors deployed in the thickness direction. This article begins by explaining about process monitoring of thick laminates to discuss process-induced strain distribution depending on cooling conditions during molding. Next, strain monitoring is performed during annealing, and the strain change caused by cold crystallization is clarified. Finally, the residual stress distribution is evaluated by a transverse three-point bending test, and the validity of the redistribution mechanism deduced from the strain measurement is confirmed.
Introduction
Carbon fiber-reinforced thermoplastics (CFRTP) are increasingly used as structural materials in aircraft structures because of their excellent material properties and short manufacturing time. Even though current application of thermoplastic composites is mainly limited to secondary structures like clips and ribs, it is expected that their application expands to larger and thicker parts in primary structures. 1 In the case of thick CFRTP laminates (typically thickness > 5 mm), nonuniform temperature distribution arises in the through-thickness direction during cost-effective high-rate manufacturing processes. This causes the so-called “thermal skin–core effect” (Figure 1). The surface region solidified in advance constrains shrinking of the inside region, so nonuniform residual stress/strain distribution arises along the through-thickness direction. 2,3 The authors have investigated the thermal skin–core effect generated in unidirectional (UD) carbon fiber/polyphenylenesulfide (CF/PPS) laminates using a new approach combining fiber-optic–based strain monitoring and process simulation. 4 Meanwhile, under a molding condition with a higher cooling rate, the cooling rate is also nonuniform in the thickness direction in addition to the temperature. When the matrix resin of the thermoplastic composite is semicrystalline, the crystallization behavior of the matrix depends on the cooling rate, 5 so nonuniform distribution of degree of crystallinity (DOC) is formed in the thickness direction. This is known as the “morphological skin–core effect.” 6
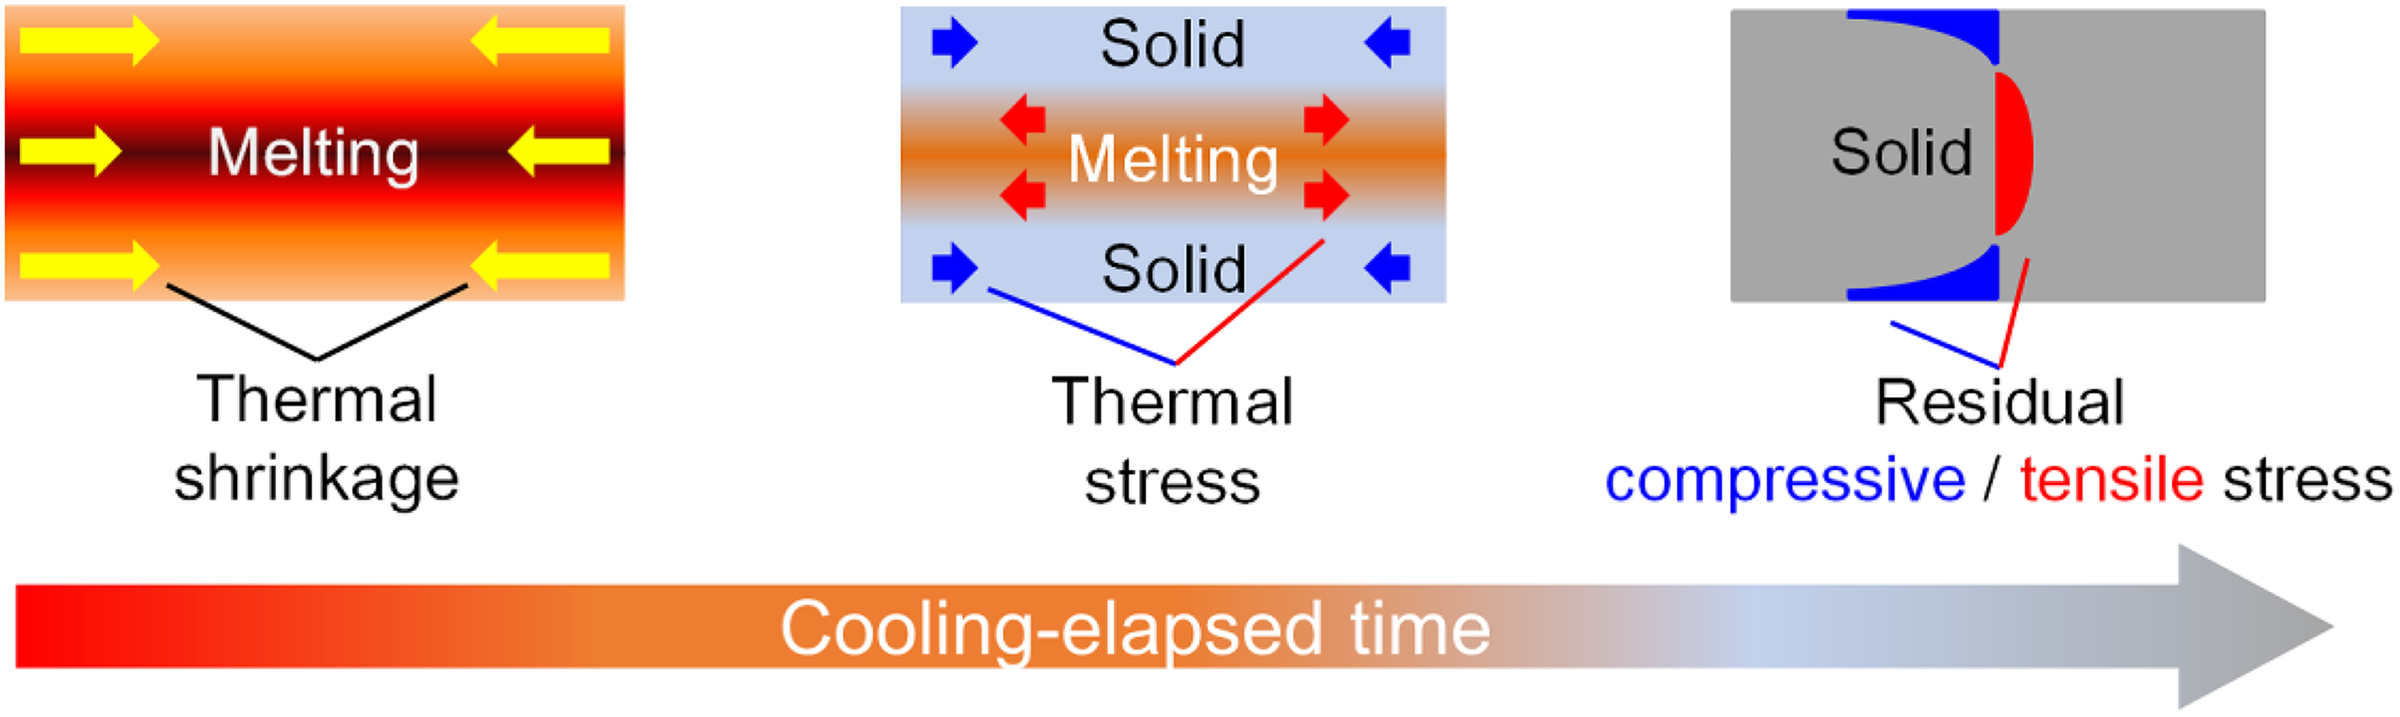
Developments of parabolic residual stress distribution due to thermal skin–core effect; surface (inside) region has residual compressive (tensile) stress. 4
Annealing is often carried out for thermoplastic composites after molding to homogenize DOC and to reduce residual stress. 2,7,8 Even though the change in the residual stress/strain distribution occurring inside thick laminates by this heat treatment is practically important, the changing process and the detailed mechanism are not sufficiently clarified. Unger and Hansen 9 conducted in situ measurement of residual strain change in thermoplastic composite laminates during annealing using strain gages. It was experimentally shown that shrinkage occurred due to cold crystallization during the heat treatment and compressive strain increased. They also discussed relaxation of nonuniform stress distribution along the thickness direction from the test results using plates with various thicknesses. However, since only a single strain gauge embedded in the laminate surface was used, internal stress redistribution was not directly evaluated.
This present study clarifies development and redistribution behavior of residual stress through both molding and annealing using multiple optical fiber sensors deployed in the thickness direction, which was utilized in our previous study. 4 The focus is on the behavior in the composite transverse direction dominated by the matrix resin properties because the transverse property determines residual stress and shape distortion. 10 This article begins by explaining about process monitoring of thick UD laminates to discuss process-induced strain distribution depending on cooling conditions during molding. Next, strain monitoring is performed during annealing, and the strain change caused by cold crystallization is clarified. Finally, the residual stress distribution is evaluated by a transverse three-point bending test, and the validity of the redistribution mechanism deduced from the strain measurement is confirmed.
Fiber Bragg grating sensors
Fiber Bragg grating (FBG) is a type of optical fiber sensors widely applied to in situ process monitoring. 11 –15 They are highly sensitive to changes in strain and temperature. The optical fiber used in this current study is made of silica glass coated by polyimide. The coating diameter is 150 μm, so FBG sensors can be embedded into composites in a minimally invasive manner due to their small size. The internal structure of an optical fiber is divided into the core and the cladding. When incident light enters into the optical fiber, the light transmits in the core which has higher refractive index than that of the cladding. FBG has periodic variation in the core refractive index. A schematic of an FBG sensor is presented in Figure 2. When broadband light transmits into the optical fiber with FBG, narrowband spectrum with a specific peak wavelength (Bragg wavelength λ B) is reflected at the region of the grating. λ B is given by

where n 0 is the effective refractive index of the sensor and Λ is the grating period. When the grating period and refractive index change due to strain and temperature applied to the FBG, the shift amount of the Bragg wavelength Δλ is expressed by the linear sum of the strain and temperature contributions, 16

where Δε is the axial strain change and ΔT is the temperature change. C s and C T are the coefficients of strain- and temperature wavelength. Since the measured shift amount Δλ during composite manufacturing with significant temperature change includes a large temperature contribution, it is necessary to compensate the influence of temperature when calculating Δε. In this current work, it was assumed that there was no temperature gradient between a laminate and the embedded optical fibers (i.e. the laminate and the sensors had the same local temperature). So, it was possible to calculate strain changes Δε using temperature histories measured by thermocouples embedded close to FBG sensors.
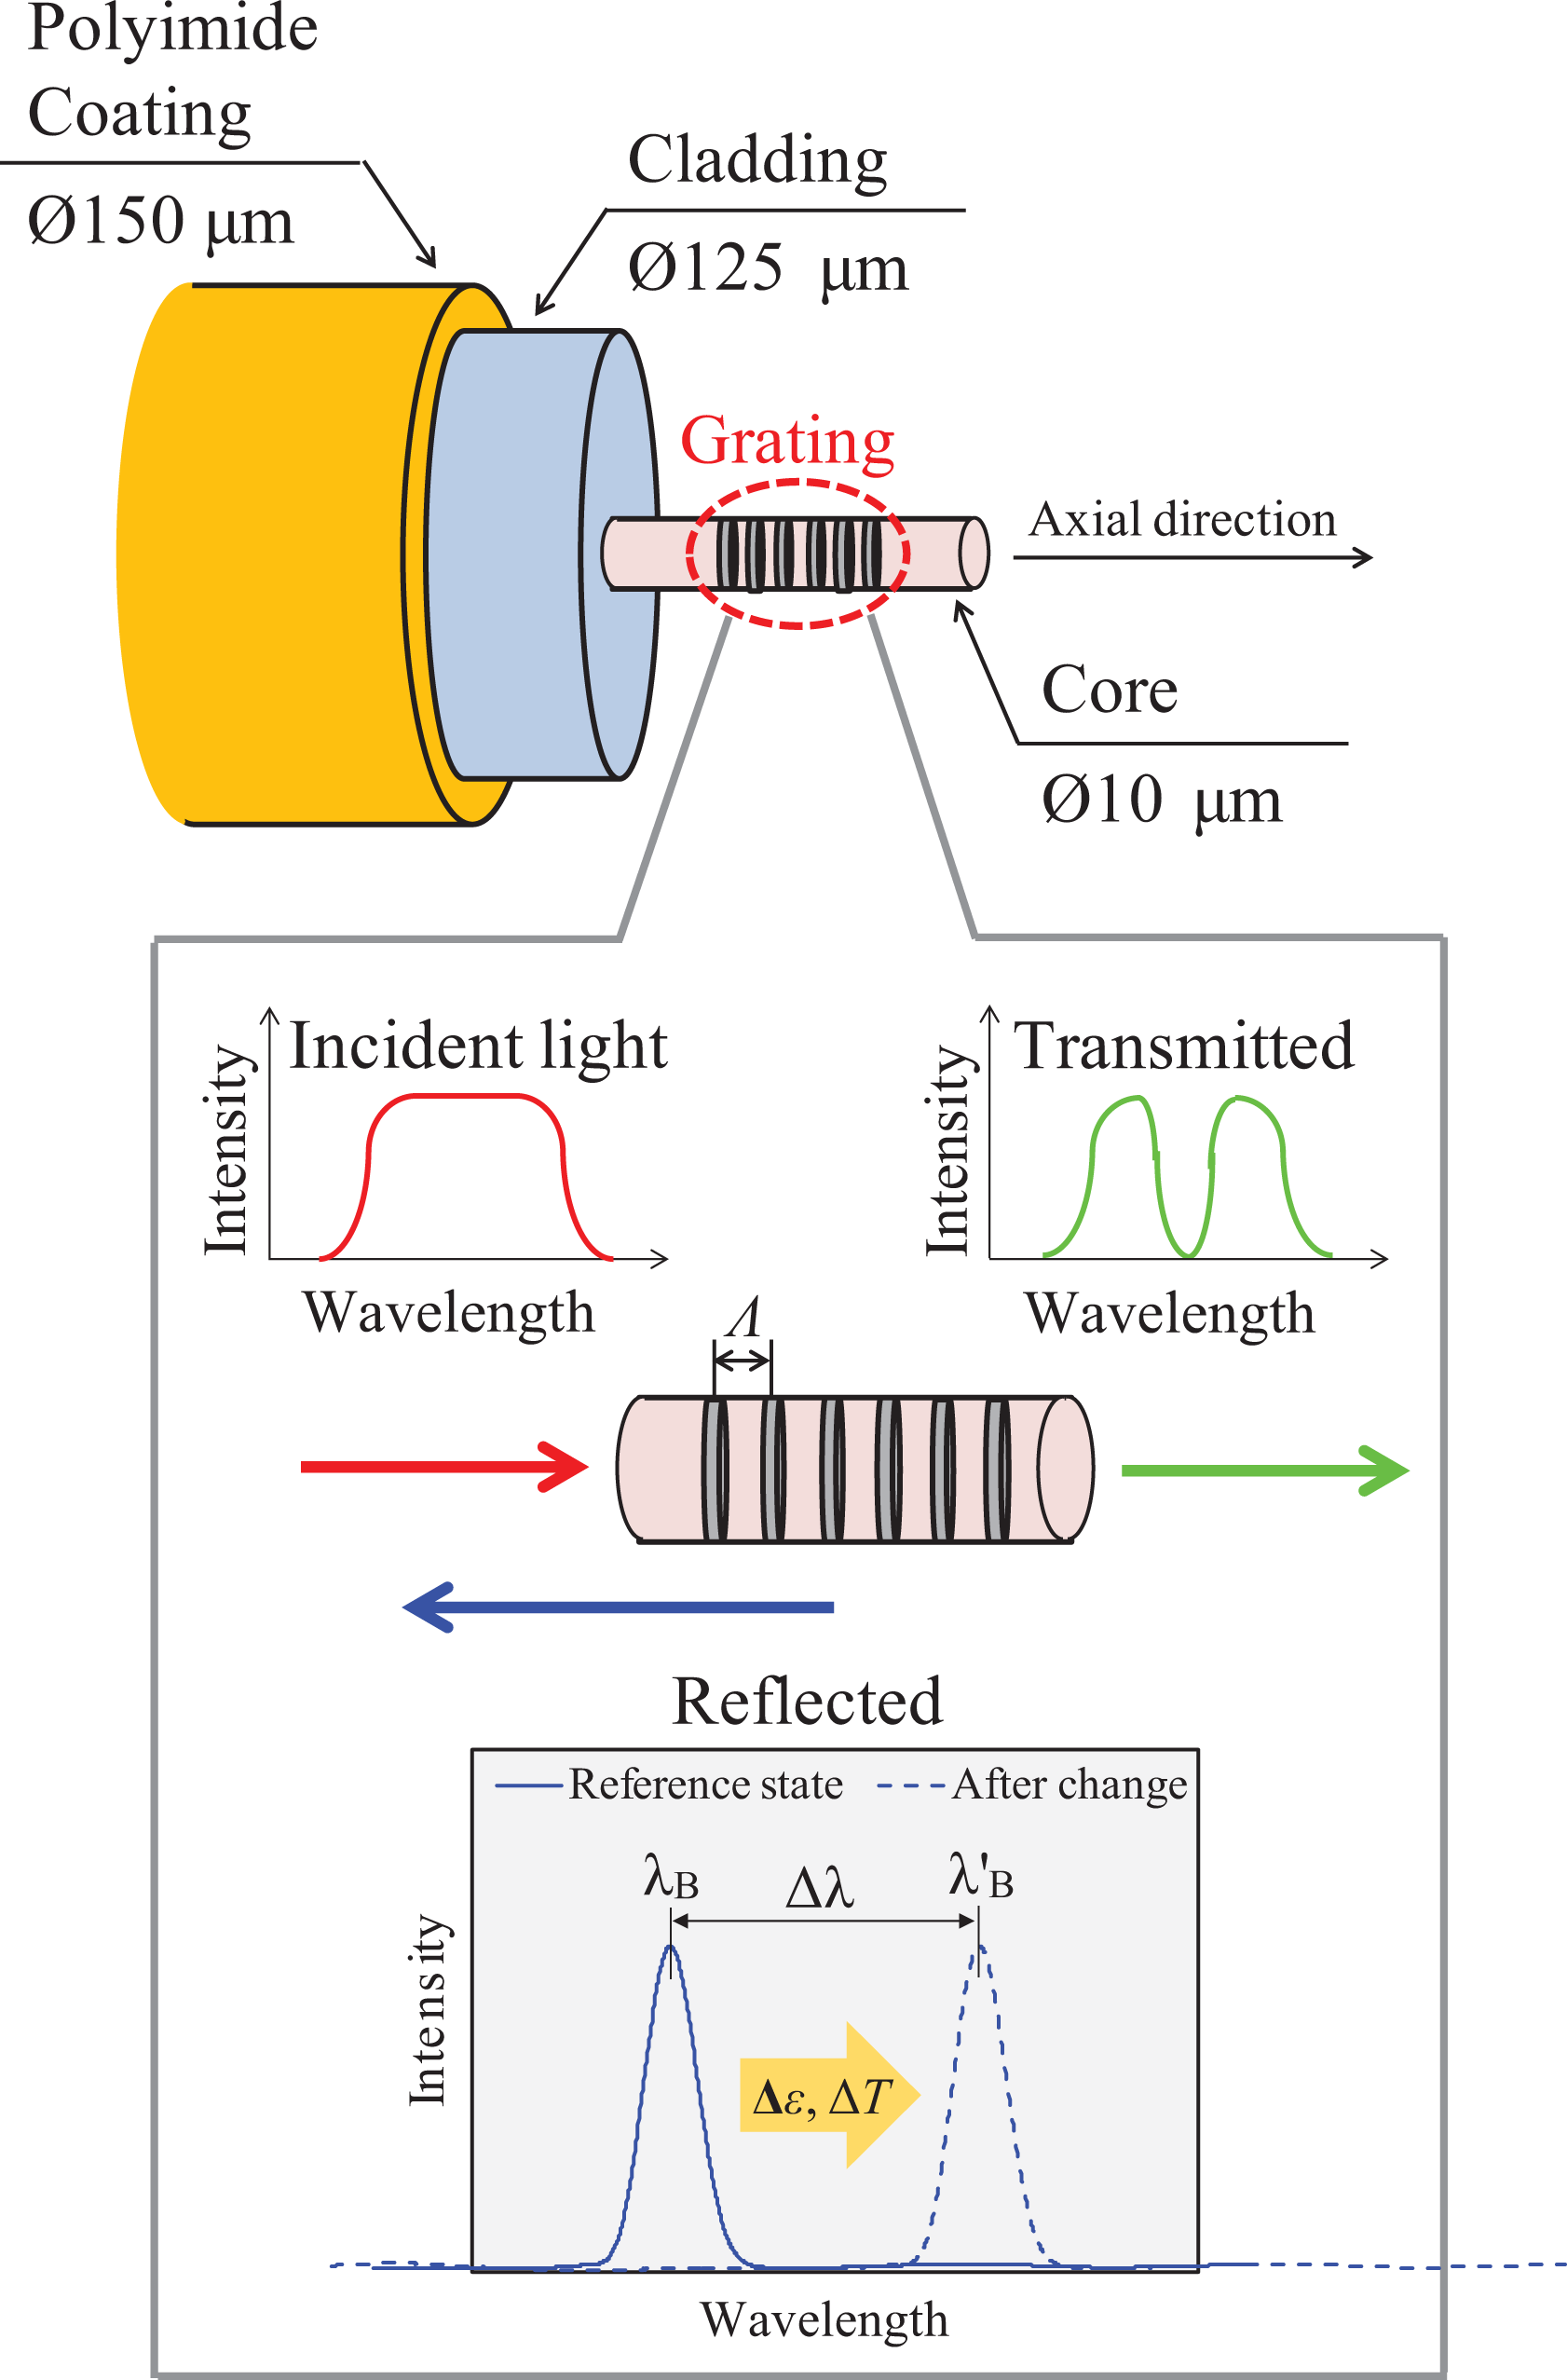
Schematic of FBG sensor with typical reflection spectrum.
Strain monitoring during cooling
Materials and methods
Figure 3 depicts the schematic of the specimen used. CF/PPS prepreg (AS4A/TC1100, TenCate Co., Ltd., California, U.S.), ply thickness: 0.175 mm) was used. In-plane dimension of the specimen was 100 × 100 mm2, and the stacking sequence was [048] (thickness: 8.4 mm). During layup, three FBG sensors (grating length 1 mm, uniform grating period, apodized index change, Technica SA, Georgia, U.S.) were embedded between the 4th and 5th plies (surface), the 12th and 13th plies (near surface), and the 24th and 25th plies (inside) along the composite transverse direction. The coefficients Cs and CT in equation (2) were determined to be 1.2 pm/µε and 12.26 pm °C−1 in preliminary tests. Three K-type thermocouples were also embedded in the same interfaces with the FBG sensors. The specimen was covered by two layers of polyimide film (UPILEX-25 S, Ube Industries, Ltd., Tokyo, Japan) to suppress the resin flow and to minimize the frictional constraint on the specimen from the tool (i.e. tool–part interaction). 14 Three kinds of molding conditions were set. Because the main difference in the three conditions was the cooling rate, they were defined as slow cooling (SC), medium-speed cooling (MC), and fast cooling (FC). Under the SC and MC conditions, the specimen was heated and cooled from both upper and lower surfaces using heating–cooling copper plates (HK-600C, Takagi Mfg Co., Ltd., Aichi, Japan), which were pressed to the specimen by a universal hydraulic servo tester (EHF-E50kN, Shimadzu Corporation, Japan). The specimen was heated from 30°C to 330°C for 15 min, and cooling was started after isothermal holding at the maximum temperature for 30 min. The MC condition was generated by passing water through flow channels in the heating–cooling copper plates after turning off the heaters. In contrast, the SC condition was generated by simply turning off the heaters (i.e. water flow was not used). Throughout the molding, the pressing pressure was kept constant at 0.1 MPa. This low pressure further minimized friction between the specimen and the copper plates, allowing the specimen to expand/shrink freely. On the other hand, under the FC conditions, the specimen was heated using a hot plate from 30°C to 340°C for 15 min and kept at the maximum temperature for 30 min. After this isothermal holding, the heated specimen was sandwiched between room-temperature aluminum plates and pressed at 0.1 MPa using the universal hydraulic servo tester.
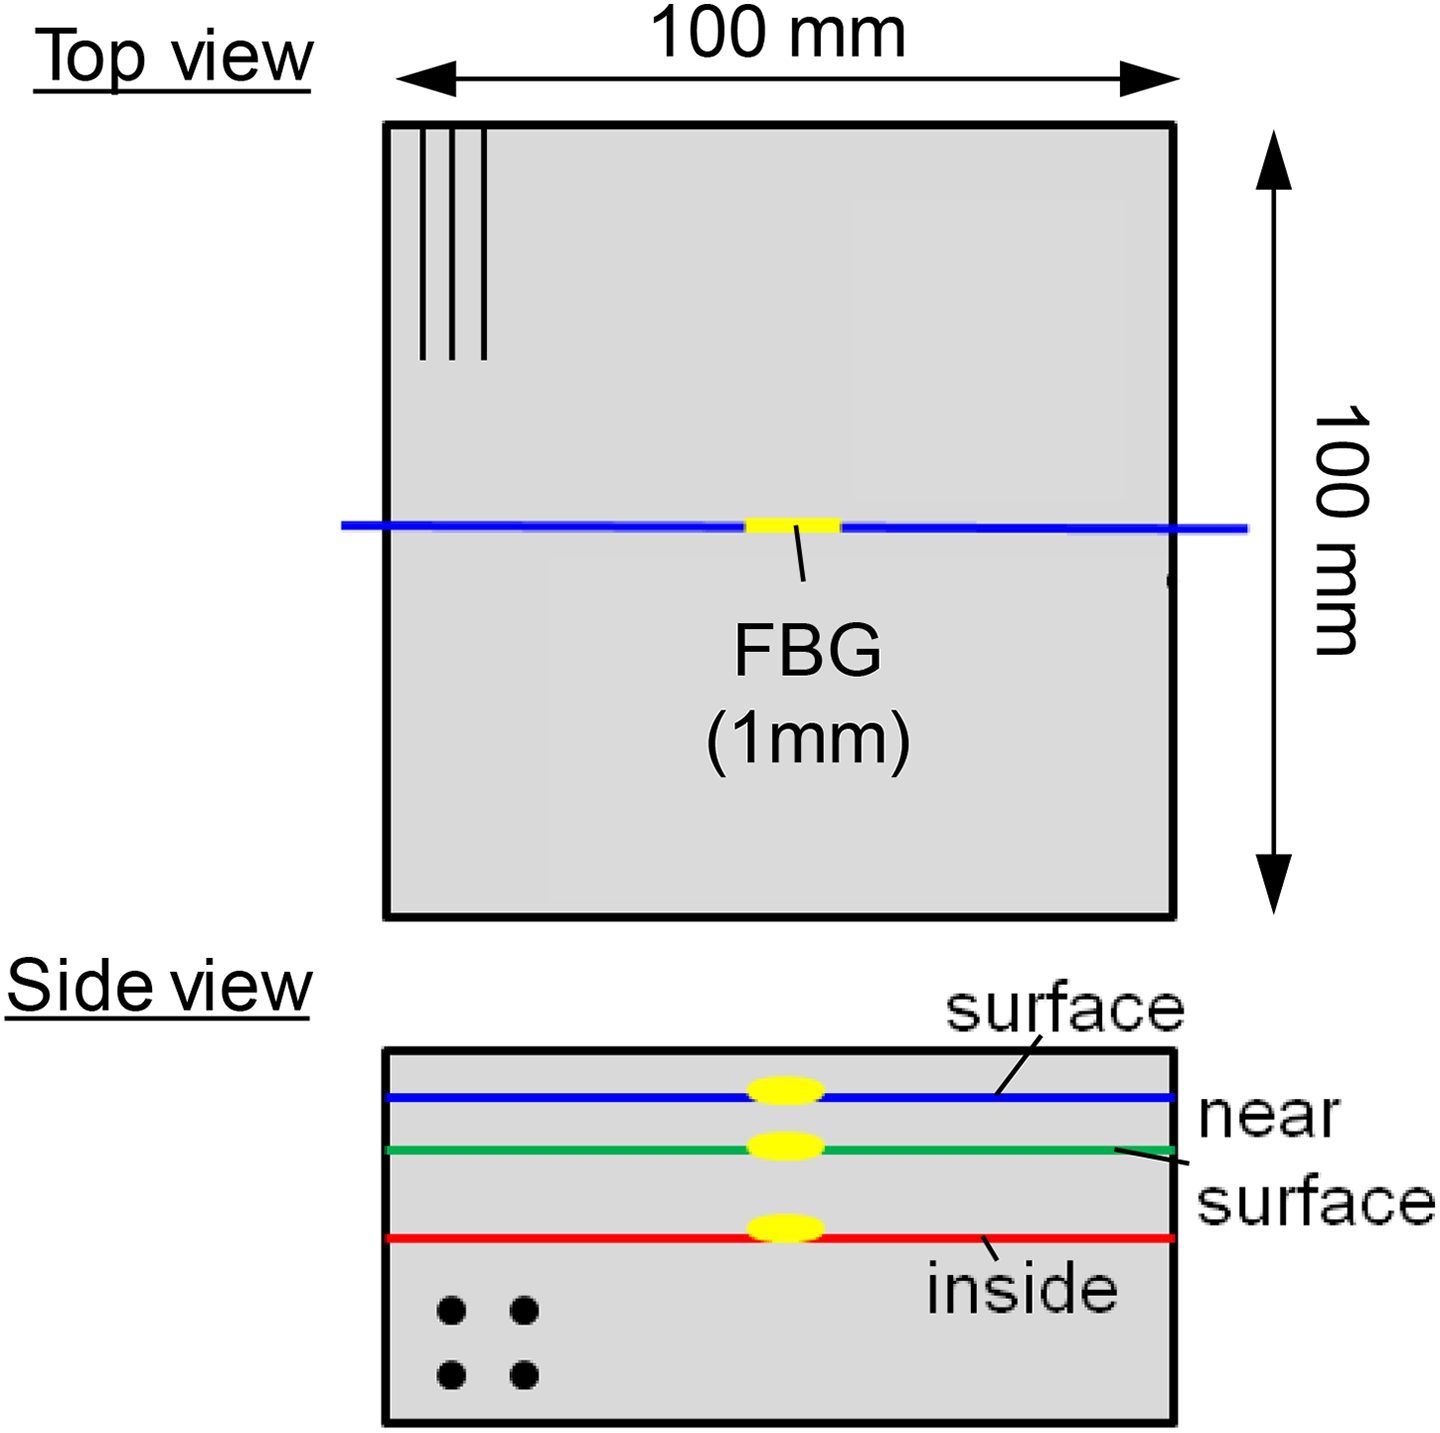
Schematic of specimen for in situ strain monitoring using three FBG sensors at surface, near surface, and inside.
An optical measuring device (EFOX-1000A-4, Kyowa Electronic Instruments Co., Ltd., Tokyo, Japan) was used for FBG measurement. The reflected FBG spectra were measured at 10 Hz, and the strain was calculated from the center wavelength λ B. It is important to note that distortion of the FBG spectrum due to strain nonuniformity was minimal because the grating length of the sensor was short and the spectrum bandwidth was wide (>1 nm). As a result, stable strain measurement was possible throughout the molding process. The internal temperature during molding was also measured at 10 Hz using the three thermocouples embedded close to the FBG sensors and used for temperature compensation of the FBG response.
Results
This section focuses on the cooling process to clarify the influence of temperature and the cooling rate on the strain distribution after molding. So, only the results measured during cooling are presented.
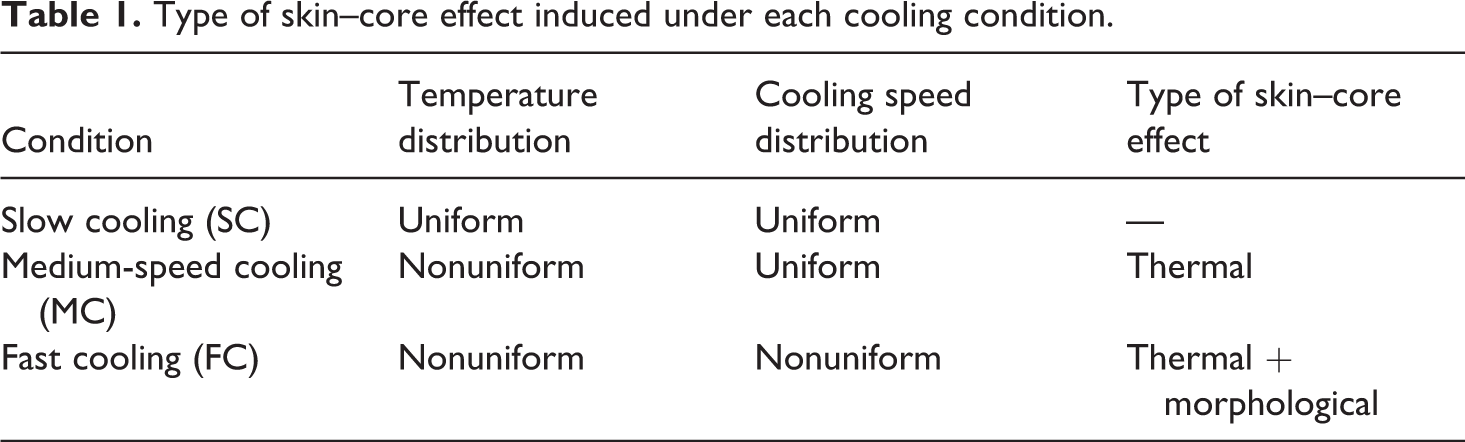
Figure 4 shows the temperature distribution measured under the three cooling conditions. Under the SC condition, the specimen was cooled almost uniformly, but remarkable temperature distribution occurred under the MC and FC conditions. Under the MC condition, a temperature difference of up to 110°C occurred between the surface and the inside, while the cooling rate at the crystallization temperature range of the PPS resin (from 250°C to 200°C 14 ) had almost uniform value of −200°C min−1. Under the FC condition, a temperature difference of up to 160°C was generated between the surface and the inside, and the cooling rate was significantly nonuniform. The cooling rate exceeded −500°C min−1 at the surface, whereas it was about −200°C min−1 in the other regions. The characteristic of each cooling condition and the expected type of the skin–core effect are summarized in Table 1. Under the SC condition, no skin–core effect occurs because the temperature and the cooling rate are uniform, whereas the thermal skin–core effect occurs under the MC and FC conditions due to the nonuniform temperature distribution. Furthermore, under the FC condition, since the cooling rate is also nonuniform, it is expected that the morphological skin–core effect occurs in addition to the thermal skin–core effect.
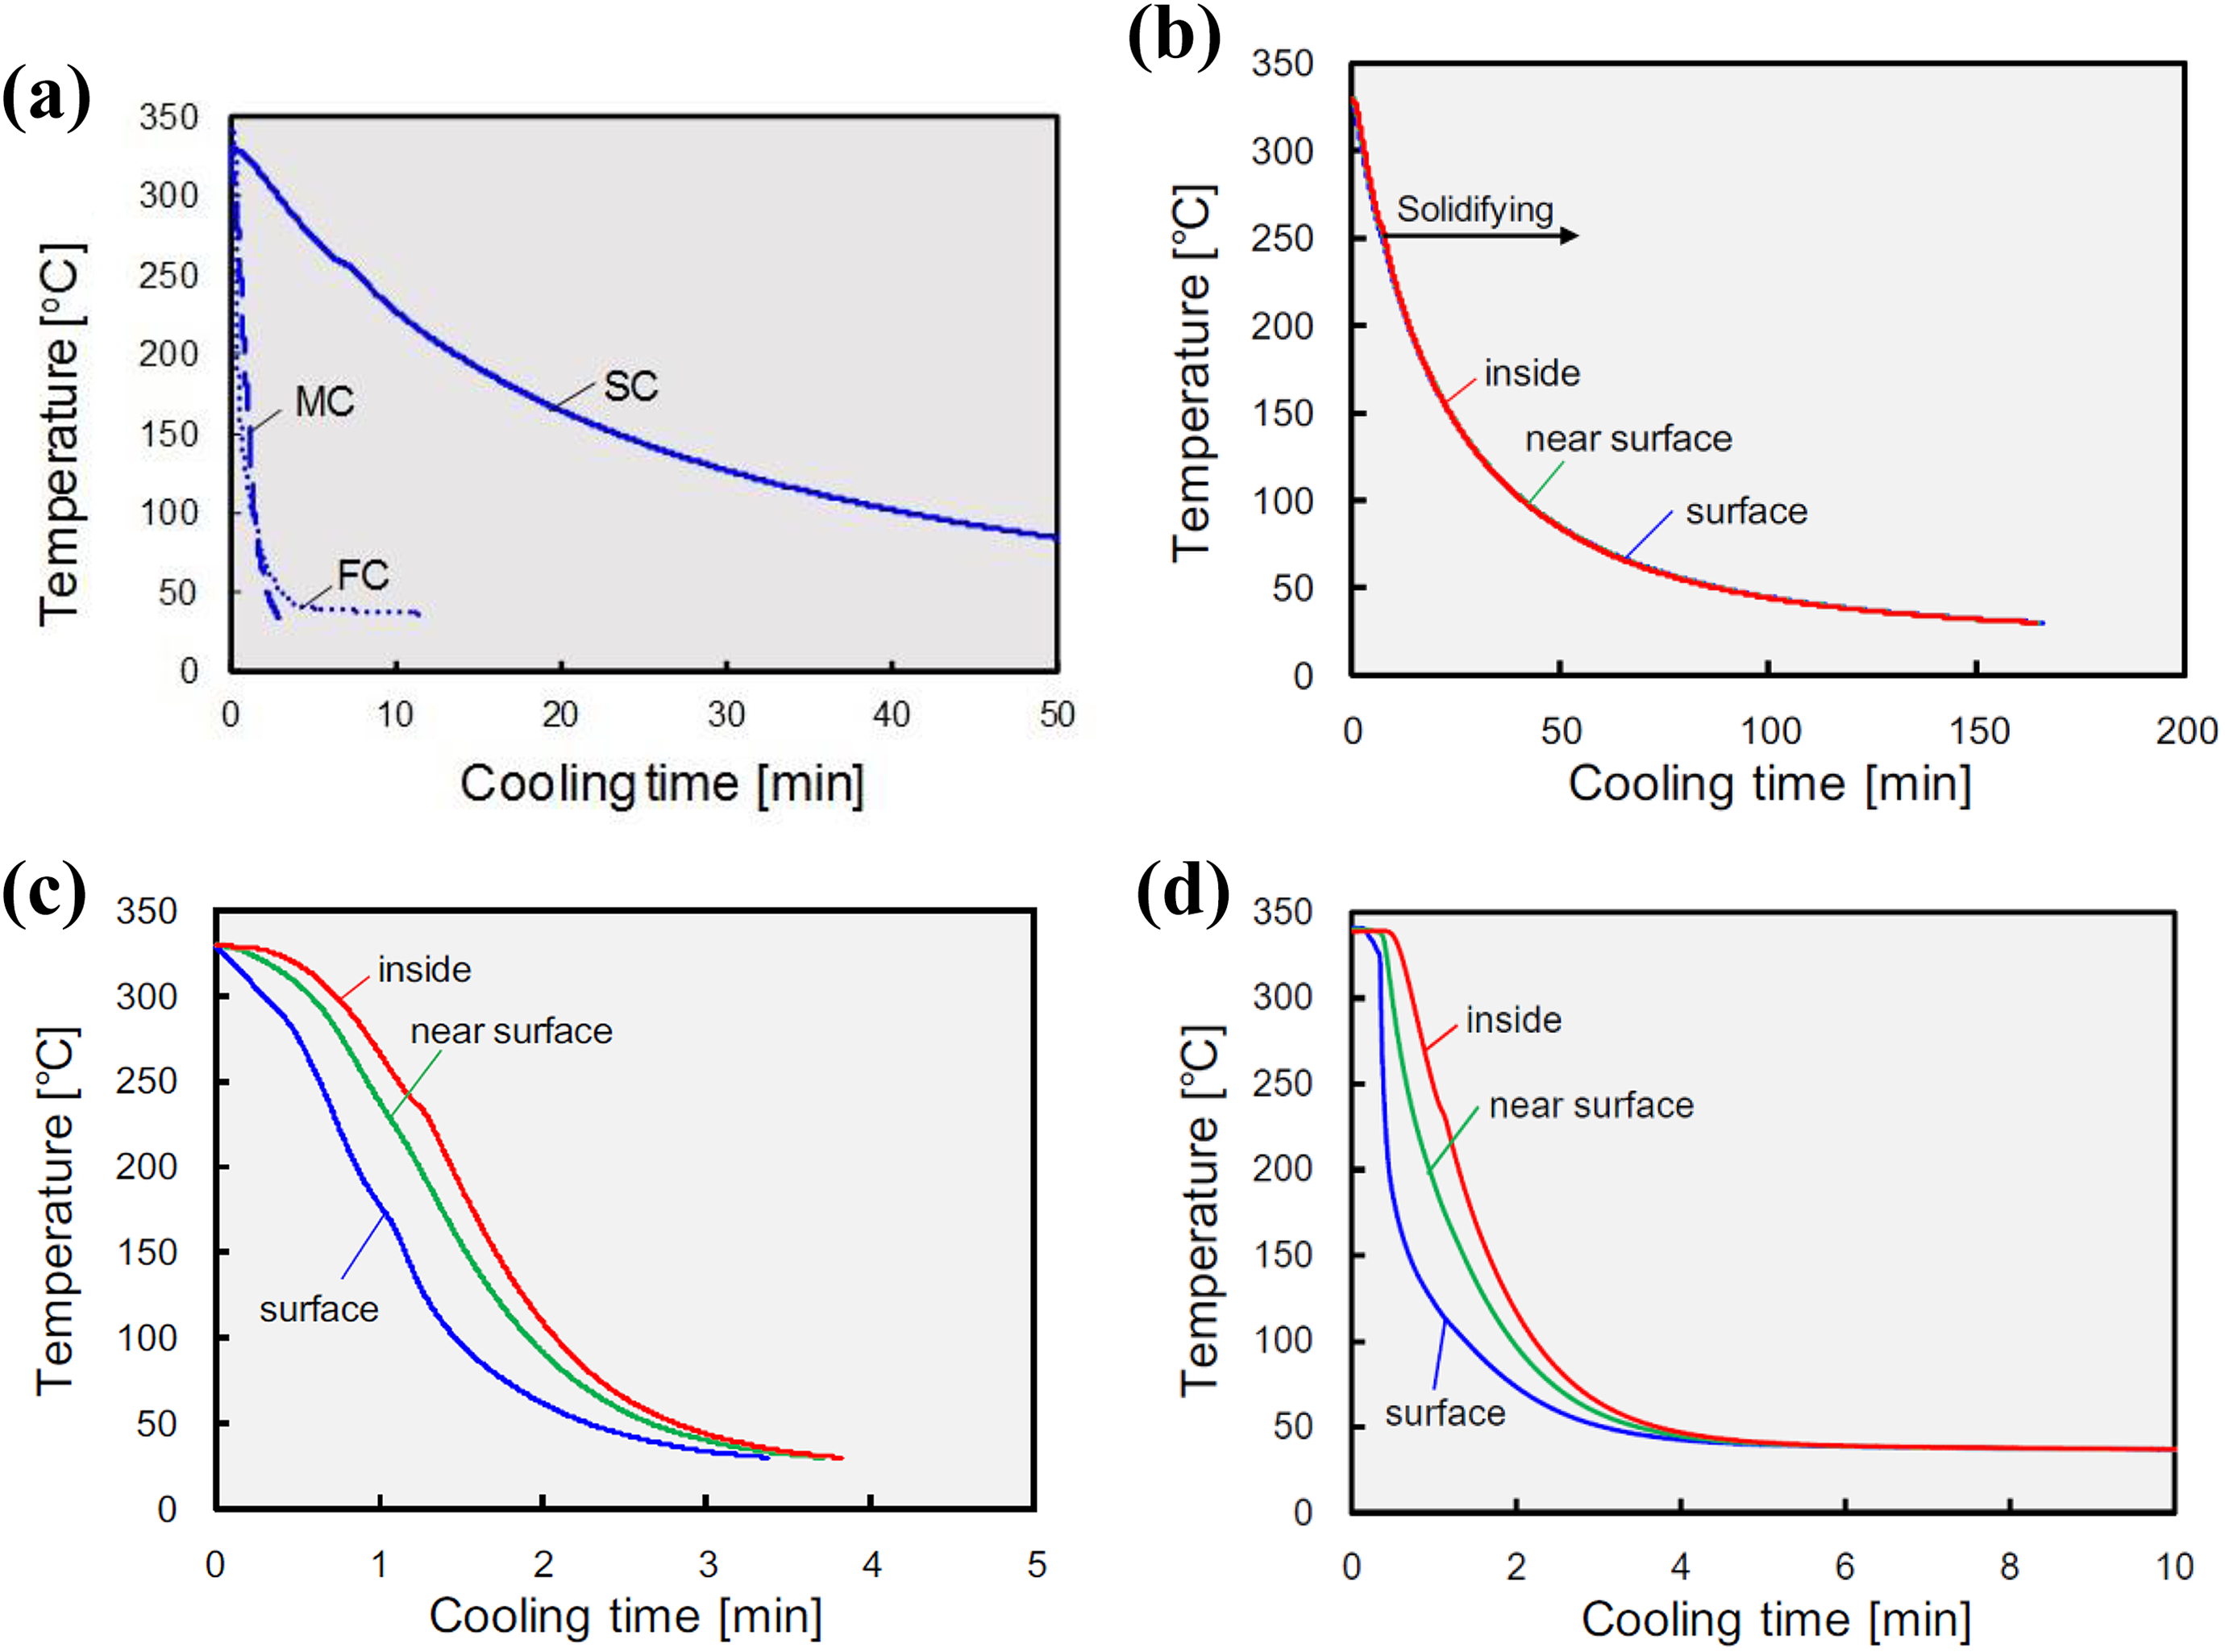
Temperature change measured during cooling: (a) Comparison of temperature at surface under three cooling conditions, (b) SC condition, (c) MC condition, (d) FC condition.
Type of skin–core effect induced under each cooling condition.
Strain histories under the three cooling conditions are shown in Figure 5. The strain at the beginning of cooling is set to zero as a reference point. Even though the results of the SC and MC conditions have been already included in our previous article, 4 they are presented again for completeness. The FBG sensors started to measure significant compressive strain due to crystallization and solidification below solidification temperature, regardless of cooling conditions. Under the SC condition, the strain histories in the three positions almost matched, and a slight strain difference of 1000 με was induced after cooling. In contrast, under the MC and FC conditions, nonuniform strain distribution was formed along the through-thickness direction due to the nonuniform temperature. The strain values of the three sensors at a specific time are identified using the same markers. The surface region solidified in advance constrained shrinking of the inside region (Figure 1), so compressive strain was smaller in the inside region. 4 Since the maximum temperature difference between the surface and the core generated during cooling was larger under the FC condition, it was expected that the thermal skin–core effect and thus strain difference between the surface and the inside would be more significant under the FC condition. However, the strain difference after cooling was larger under the MC condition. This was because the DOC at the surface was lower under the FC condition, and thus, the crystalline shrinkage was smaller.
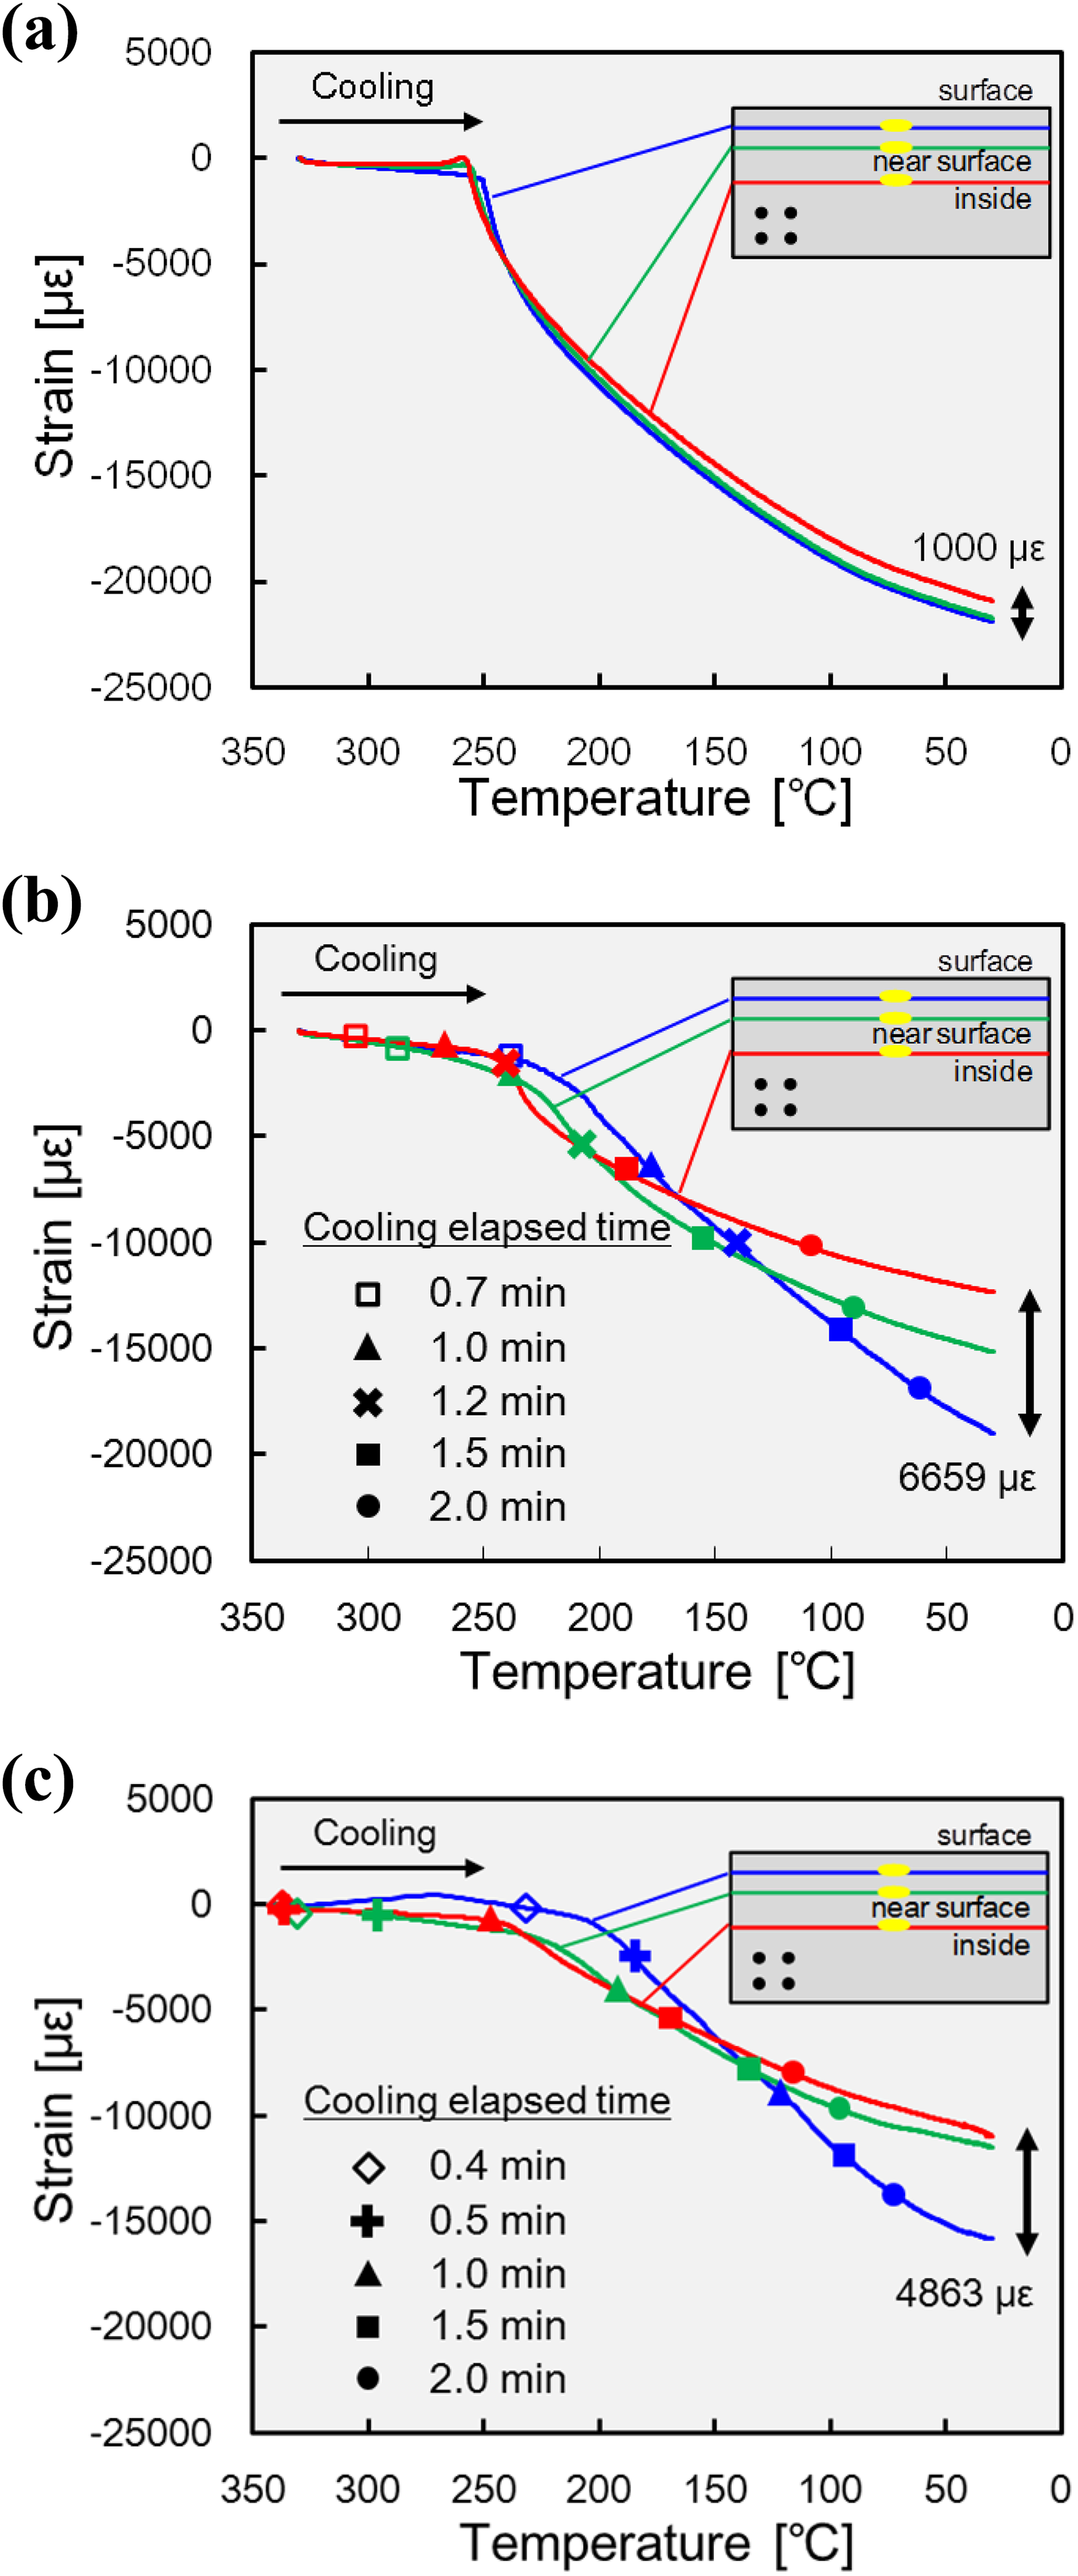
In-plane transverse strain histories measured during three cooling processes: (a) SC condition, (b) MC condition, and (c) FC condition.
Strain monitoring during annealing
Selection of heat treatment condition
Heating temperature range and heating rate during annealing were selected using differential scanning calorimetry (DSC 8500, Perkin Elmer Co., Ltd., Massachusetts, U.S.). A CF/PPS prepreg sheet (weight 5.5 mg) was used, and the heat flow was measured under four different temperature cycles. Each temperature cycle consisted of three processes: a melting process, a cooling process, and an annealing process. The four temperature cycles had the same melting process, but different conditions were used in the cooling process and the annealing process. In the melting process, the sample was heated from −50°C to 350°C at a heating rate of 100°C min−1. In the cooling process, the sample was cooled from 350°C to −50°C at either of the two cooling rates, −500°C min−1 and −200°C min−1. These two cooling rates simulated the FC and MC conditions defined in the strain measurement experiment above. In the annealing process after cooling, the specimen was heated from −50°C to 350°C at either of the two heating rates, 2°C min−1 and 30°C min−1. The cold crystallization behavior was evaluated from the exothermal heat flow history. Four combinations of cooling conditions (−500°C min−1 and −200°C min−1) and heating conditions (2°C min−1 and 30°C min−1) were defined as conditions A, B, C, and D, respectively (Table 2). The number of DSC samples was three.
Measurement result of exothermal reaction heat under each condition.
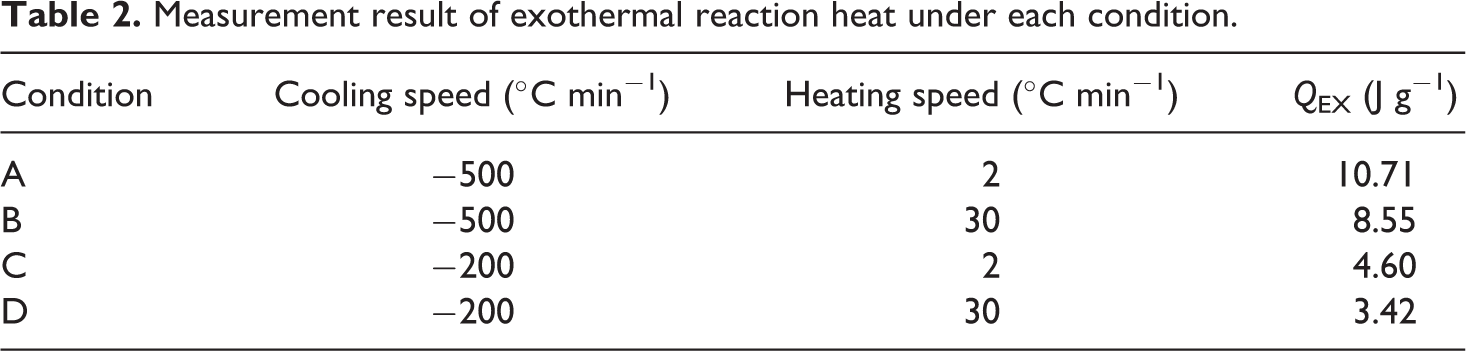
An exothermic reaction due to cold crystallization occurred in the temperature range up to 175°C under all the four conditions. Table 2 shows the average value of the generated reaction heat per unit mass Q EX. As the cooling rate was higher and the heating rate was lower, the reaction heat increased. In condition A where the cold crystallization was promoted the most, the reaction occurred immediately after the temperature exceeded the glass transition temperature (T g) of 90°C. In contrast, an endothermic reaction accompanying resin melting began in the temperature range of T ≥ 250°C and the existing crystals gradually disappeared. From these results, the maximum heating temperature and the heating rate was selected to be 200°C and 2°C min−1, respectively, as a condition to complete the cold crystallization.
Strain monitoring result
Strain measurement during heat treatment was carried out using the three specimens molded in “Strain monitoring during cooling” section. Based on the above selection results of the annealing conditions, the specimens were heated from 30°C to 200°C at 2°C min−1 and then cooled to 30°C at −10°C min−1. The strain history during annealing is presented in Figure 6. Strain at the beginning of heat treatment was redefined as zero for comparison between the three sensors.
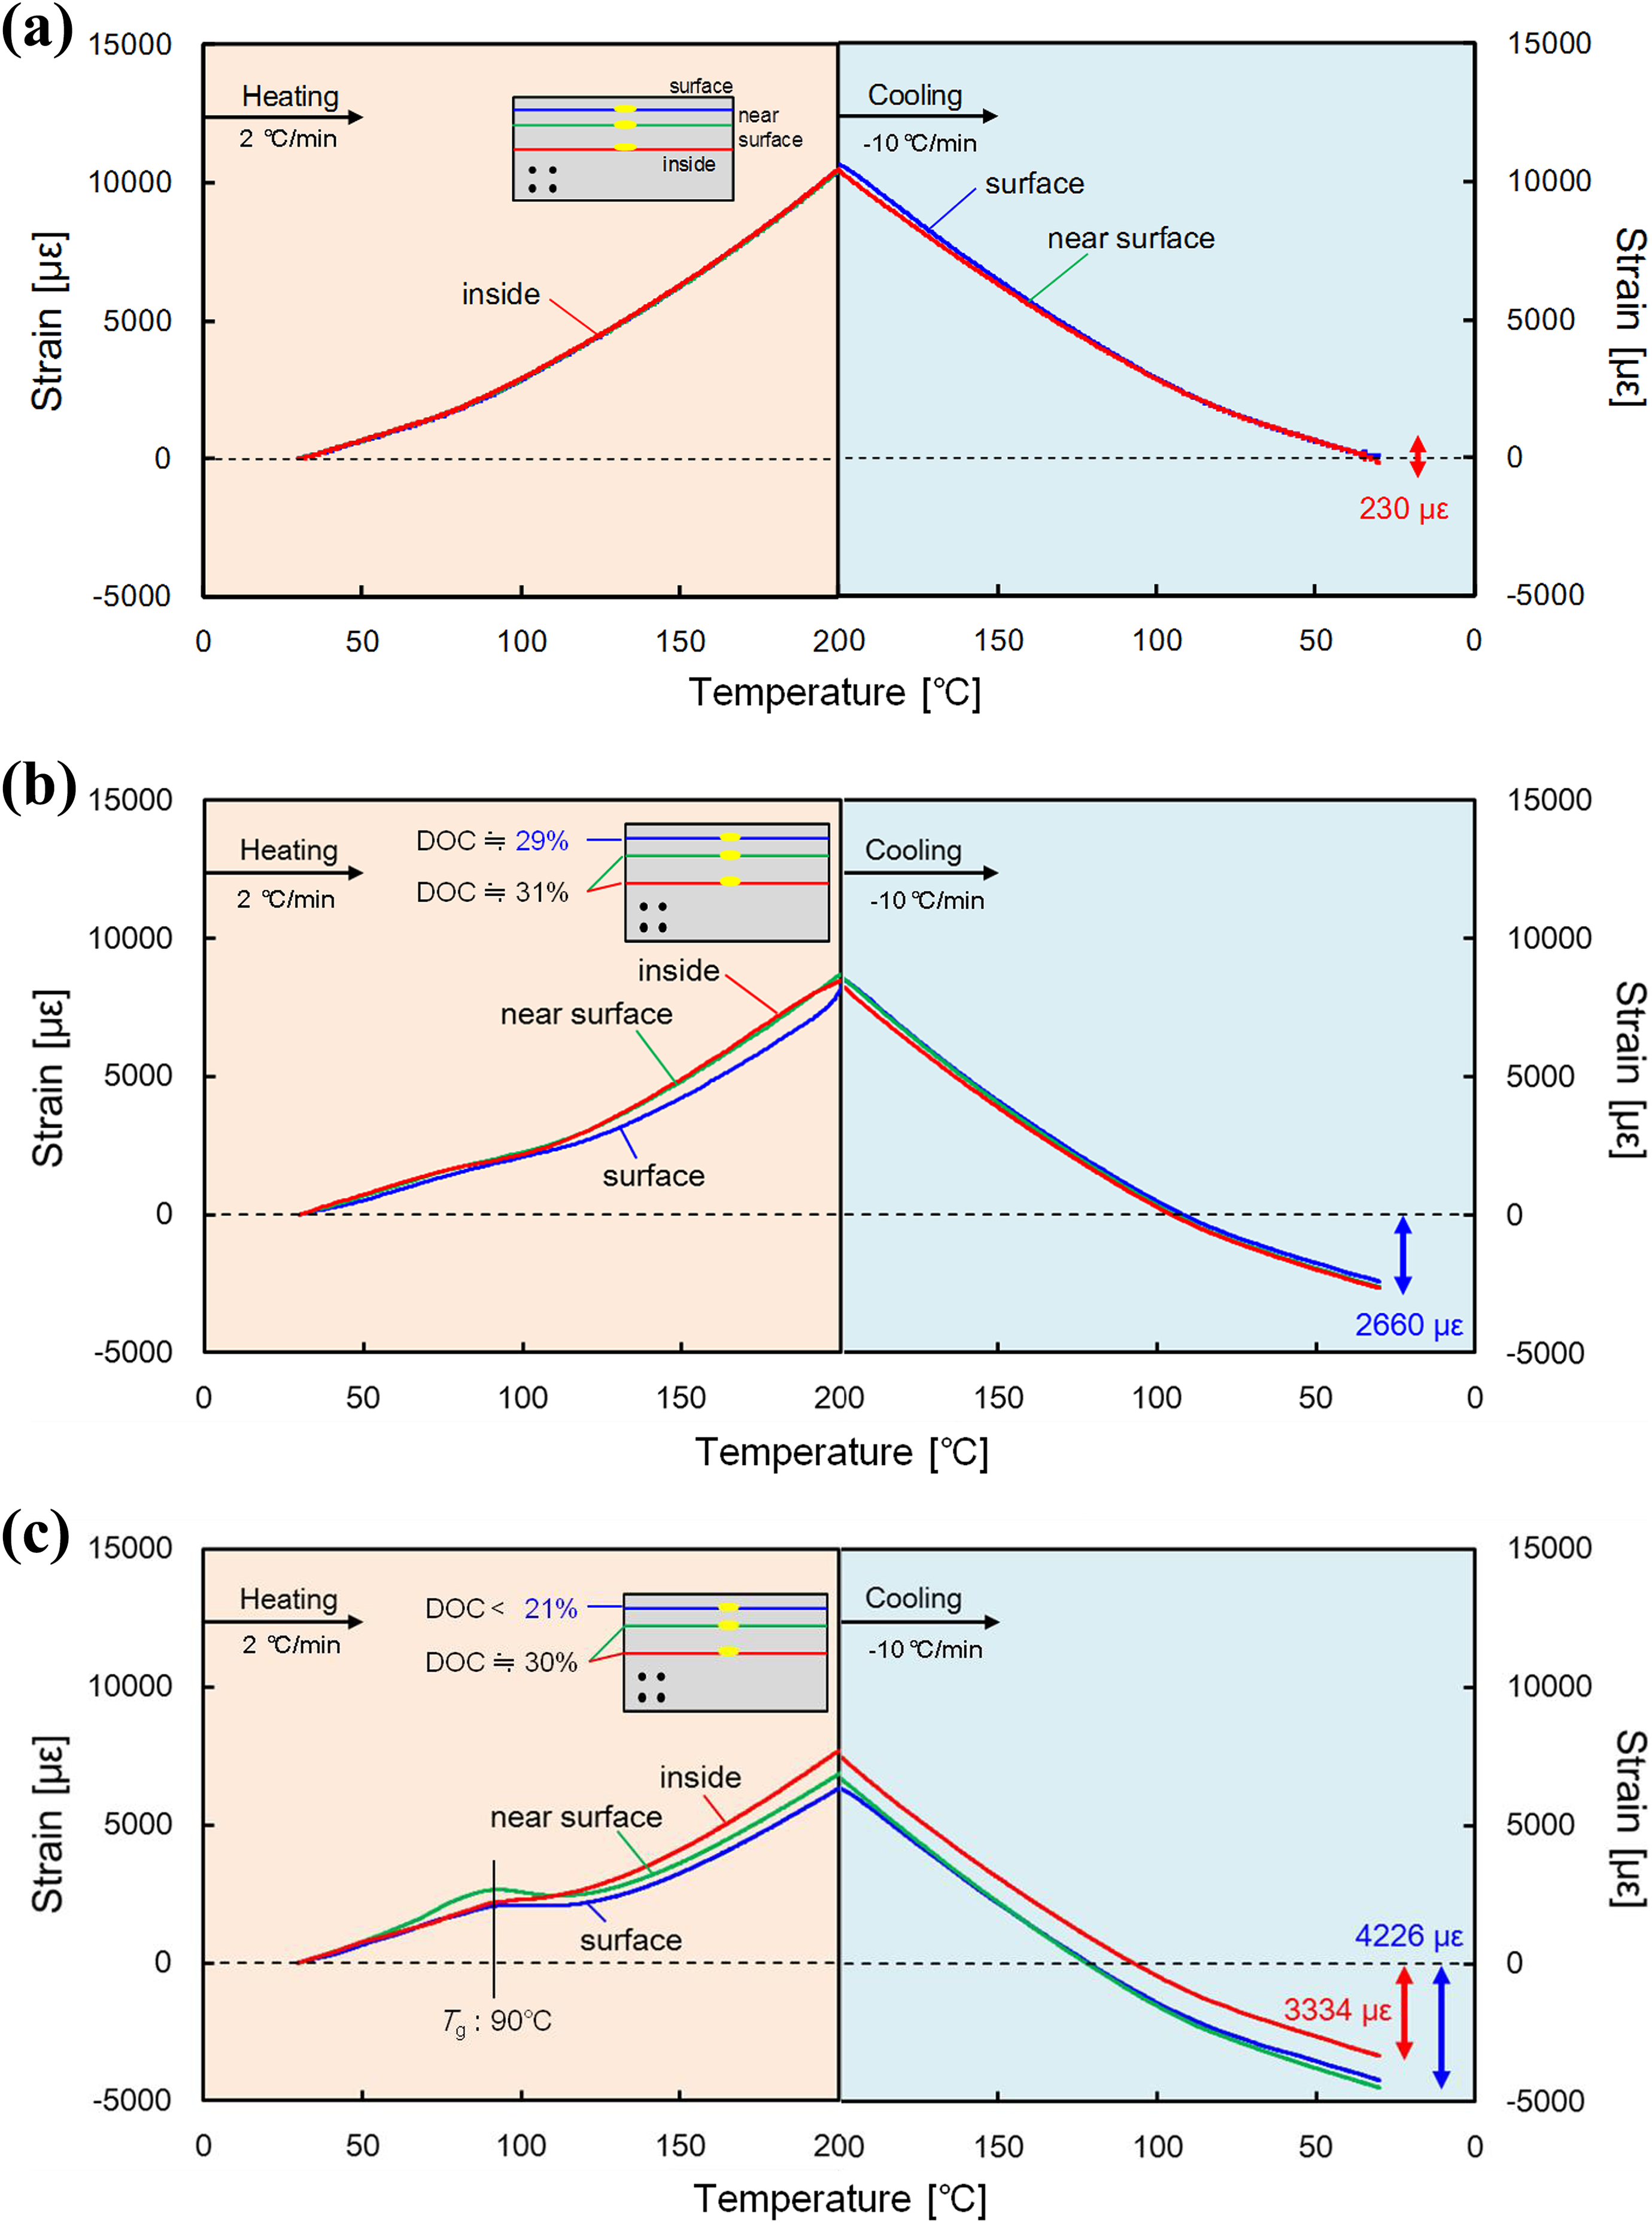
In-plane transverse strain history measured at each position during annealing after three cooling processes: (a) SC specimen, (b) MC specimen, (c) FC specimen.
In the SC specimen (Figure 6(a)), the strain amount did not significantly change after the heat treatment, and the three sensors in different positions measured almost the same strain. This was due to the fact that the temperature, the cooling rate, and the strain were almost uniform along the through-thickness direction during cooling in the molding process, and cold crystallization did not occur during the heat treatment. An additional DSC test confirmed that an exothermic reaction due to cold crystallization did not occur in the SC specimen under the heat treatment.
In the MC specimen (Figure 6(b)), the strain increase during heating was gentle compared with the SC specimen. The strain at the end of heating (200°C) was 2500 με smaller than the SC specimen, indicating that cold crystalline shrinkage occurred. After exceeding 110°C, the strain distribution changed. The strain increase measured at the surface was slightly small, indicating that shrinkage due to cold crystallization was more significant than at the other regions. Figure 6(b) includes the distribution of DOC obtained by performing additional DSC tests using cooling rates measured at the three FBG positions during molding. The DOC of the surface was 29%, which was slightly lower than 31% at the other measurement positions. As a result, larger crystalline shrinkage occurred at the surface during annealing. In contrast, in the cooling process after the heat treatment, the strain of the three sensors similarly changed, and as a result, remarkable change in the strain distribution was not induced. Although the strain decreased by 2700 με after the heat treatment because of the cold crystalline shrinkage during heating, it was implied that the residual stress caused by the thermal skin–core effect did not relax by the heat treatment because the strain difference between the surface and the inside did not change.
In the FC specimen (Figure 6(c)), the strain increase during heating was even gentler. Similarly to the MC condition, the strain distribution changed during heating, but the change occurred from the lower temperature range of T ≥ T g. This may be attributed to the fact that remarkable DOC distribution was generated in the thickness direction after molding. The strain history during annealing at each FBG position would have differed depending on the amount of cold crystalline shrinkage. To validate this discussion on the strain change, additional strain monitoring tests were conducted using thin laminate specimens, which had a uniform cooling rate in the through-thickness direction and thus were not affected by the skin–core effect. The stacking sequence of the specimen was [012], and the two specimens were molded using the same cooling rates as the surface and inside parts of the thick plate [048], which were defined as [012- T surface] and [012- T inside], respectively. The thin specimen and the corresponding position in the thick specimen had the same DOC. The strain measurement results of the thick specimen and the thin specimens during annealing are compared in Figure 7. Even though cold crystallization equally progressed in [012- T surface] and [048-surface] by annealing, crystalline shrinkage strain was smaller in [048-surface] than [012- T surface]. In contrast, shrinkage strain was larger in [048-inside] than [012- T inside]. This indicates that in the thick laminate the inside region constrained shrinking of the surface during the heat treatment and that the morphological skin–core effect was the driving force of the stress redistribution during annealing. In the cooling process after the heat treatment, uniform thermal shrinkage occurred similarly to the SC and MC specimens. The final strain change after the heat treatment was different in the through-thickness direction, and a strain difference of about 900 με was newly formed between the surface and the inside. The result above implies the mechanism of internal stress change during annealing in the thick specimen molded under the FC conditions, schematically illustrated in Figure 8. After the molding process, residual compressive and tensile stress is generated at the surface and the core due to the thermal skin–core effect. But the cold crystallization shrinkage is larger at the surface having lower DOC before annealing, so contrary to the stress development during molding tensile stress occurs in the surface and compressive stress in the core after annealing, which finally results in reduction of the residual stress.
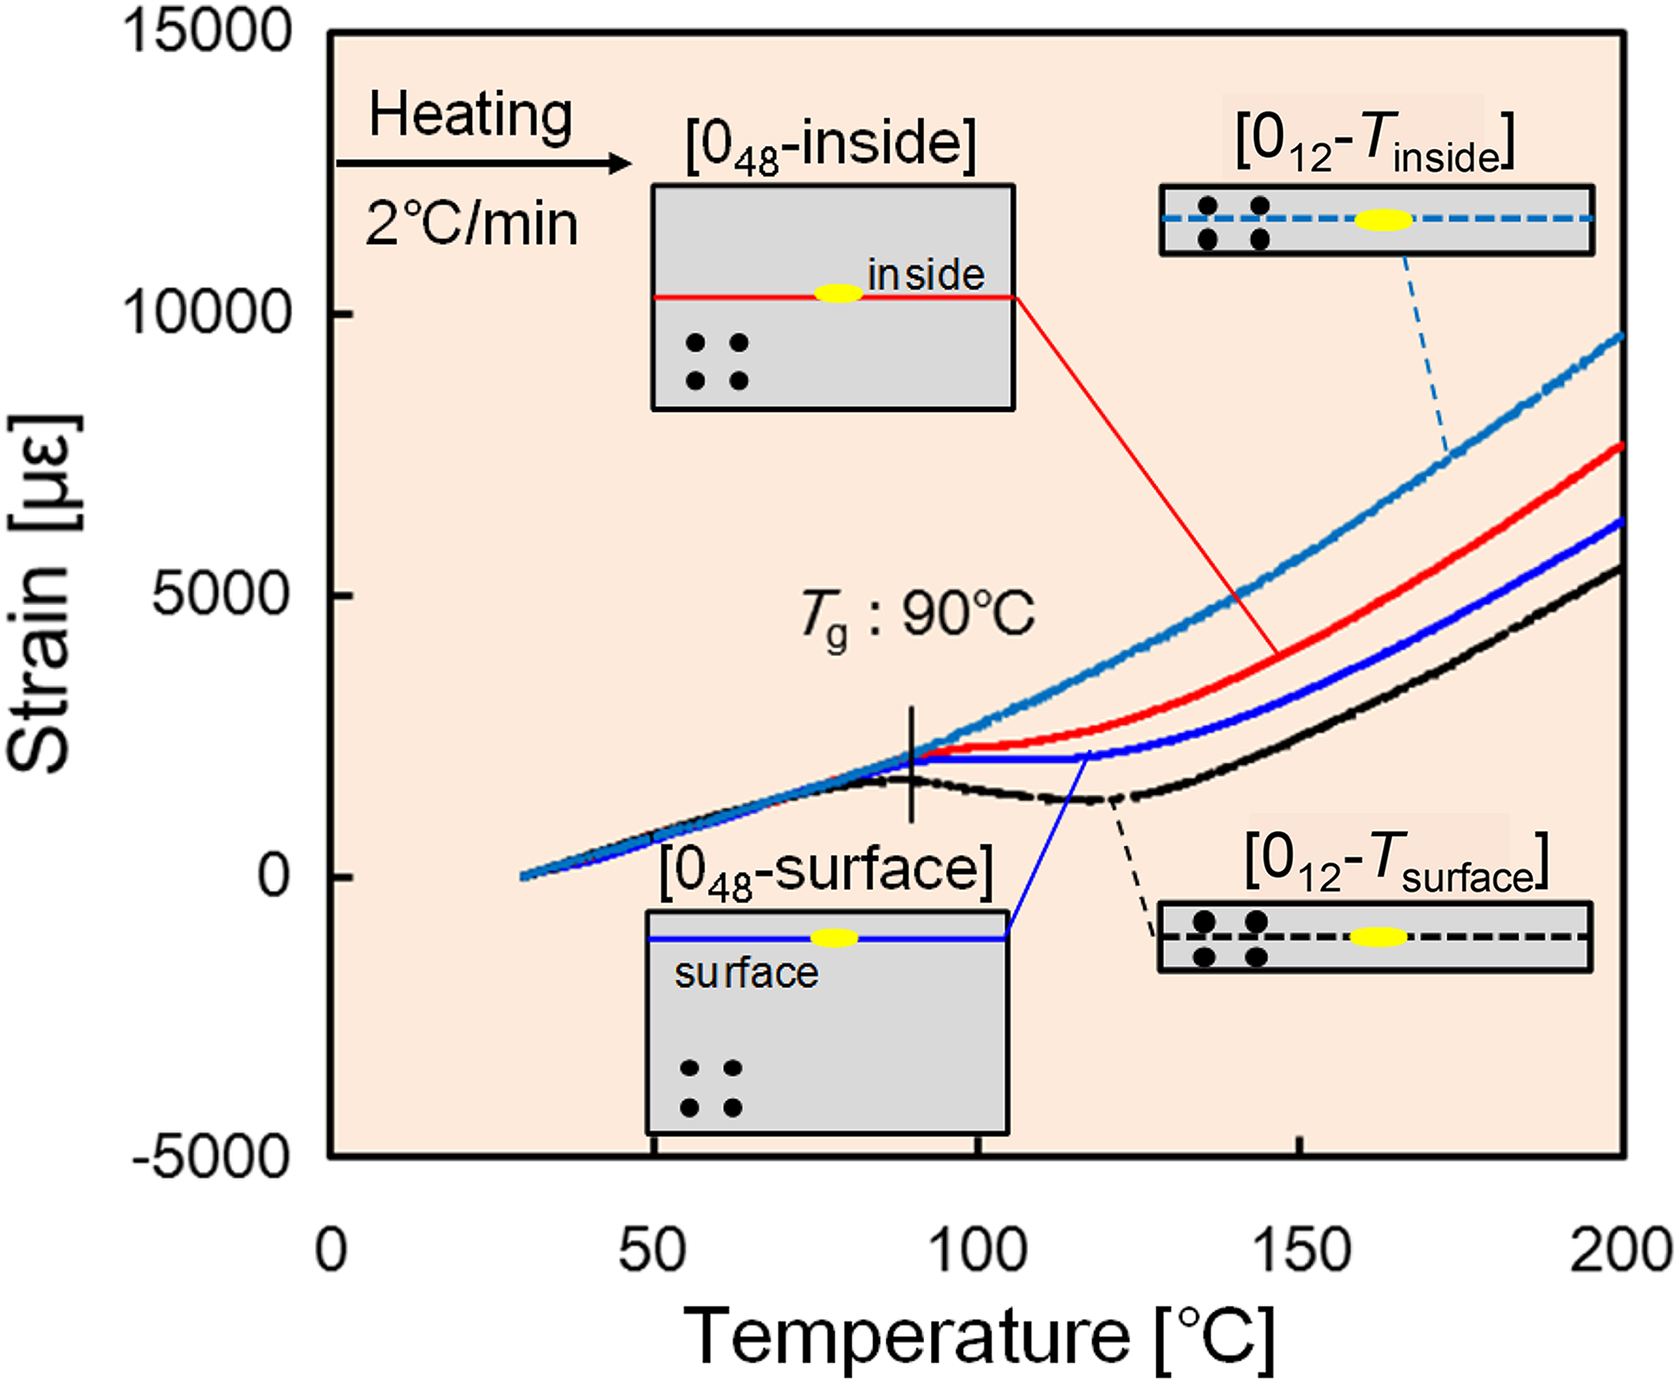
Comparison of strain histories of thick and thin laminates during annealing process.
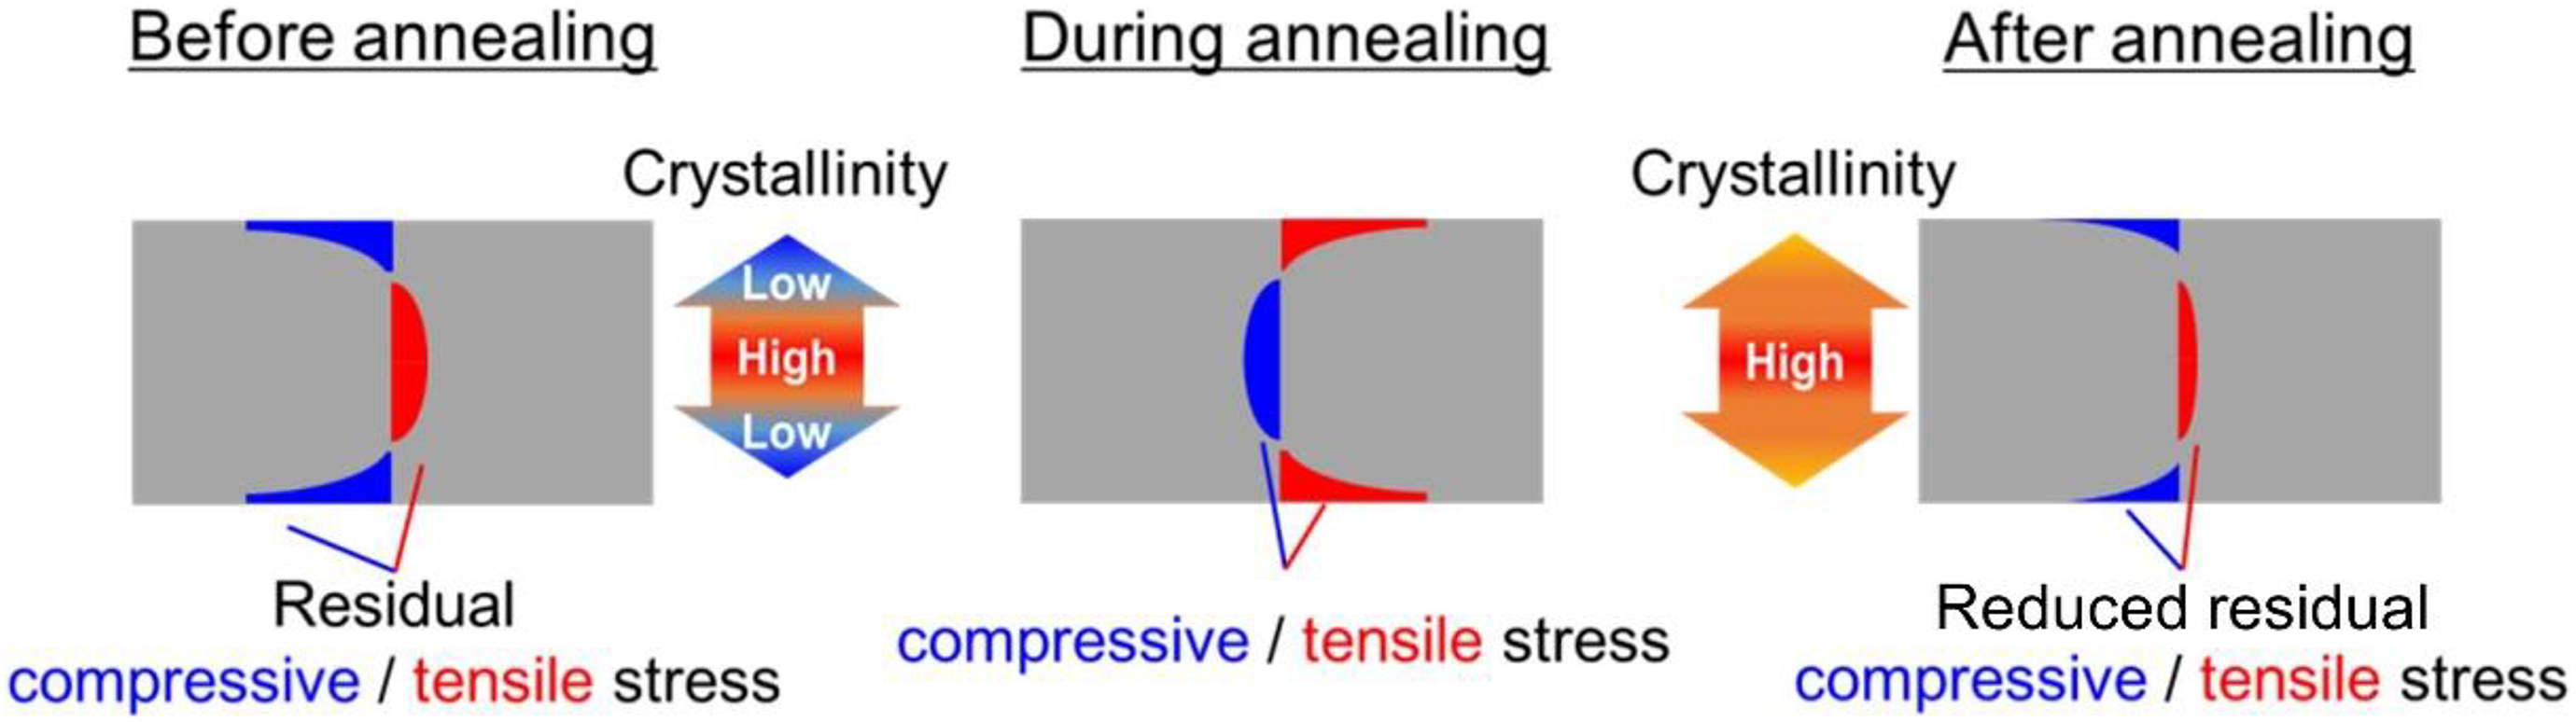
Residual stress redistribution mechanism during annealing in thick laminates with morphological skin–core effect.
Validating residual stress redistribution by transverse three-point bending test
The process monitoring test above implied that annealing relaxes the residual stress if the morphological skin–core effect occurs during molding. To validate the stress redistribution during annealing, the residual stress was evaluated using a transverse three-point bending test, which is one of the suitable methods for measuring transverse strength of UD laminates. 17,18 In this test, the specimen fails by a transverse crack at the backside surface, and residual stress can be determined from the failure load.
CF/PPS laminates ([90]48) were molded under the three conditions of SC, MC, and FC, and annealing was carried out. For comparison, laminates not subjected to the heat treatment were also prepared. These laminates were then cut to coupon specimens having a length of 100 mm and a width of 15 mm. A universal testing machine (AG-X, Shimadzu Corporation) was utilized for the three-point bending test, and the distance of supporting points L was 80 mm. The loading speed was set to 2 mm min−1. Bending strength (σB) was calculated from the following equation
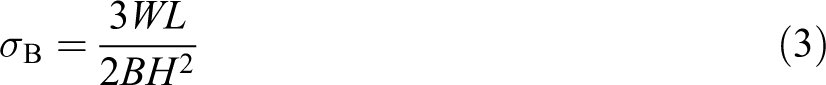
where W is the maximum load, B is the specimen width, and H is the thickness. The number of specimens for each condition was five. A t-test (p < 0.05) was used to confirm that strength deference between the different conditions was statistically significant.
Cracking occurred from the backside surface of the specimen on the opposite side of the loading, regardless of molding conditions and heat treatment. Figure 9 shows typical load–displacement curves of specimens molded under the FC condition. It was confirmed that the test piece before annealing exhibited a higher maximum load. The average values of the bending strength are shown in Figure 10. As for the bending strength before the heat treatment, the MC and FC specimens, in which the residual compressive stress was generated on the surface due to the thermal skin–core effect, had higher values than the SC specimen in which no residual stress was generated. It is interesting to note that the FC specimen had about 4 MPa lower strength than the MC specimen. Under the FC condition, the temperature distribution during molding was more significant than the MC condition (Figure 4), while the modulus of the matrix resin and the amount of crystalline shrinkage were smaller. 4,14 Therefore, the residual compressive stress generated on the surface due to the thermal skin–core effect was smaller under the FC condition than the MC condition, and as a result, the bending strength had the lower value. Meanwhile, regarding the bending strength after the heat treatment, the strength did not change significantly in the SC and MC specimens, while it decreased by about 5 MPa in the FC specimen. Preliminary DSC tests confirmed that the DOC after annealing reached 40% regardless of the molding condition and thus the three kinds of specimens had the same material strength. The result that the MC and FC specimens had the strength different from the SC specimen after annealing indicates that the residual stress did not fully relax even after the heat treatment. The fact that the bending strength of the MC specimen did not significantly change by annealing confirmed that the residual stress caused by the thermal skin–core effect was not reduced by the heat treatment, which was also implied from the strain measurement result (Figure 6(b)). Meanwhile, the strength reduction of the FC specimen after annealing indicated that the residual compressive stress on the surface relaxed due to stress redistribution during annealing, confirming the validity of the mechanism deduced from the strain monitoring (Figure 8).
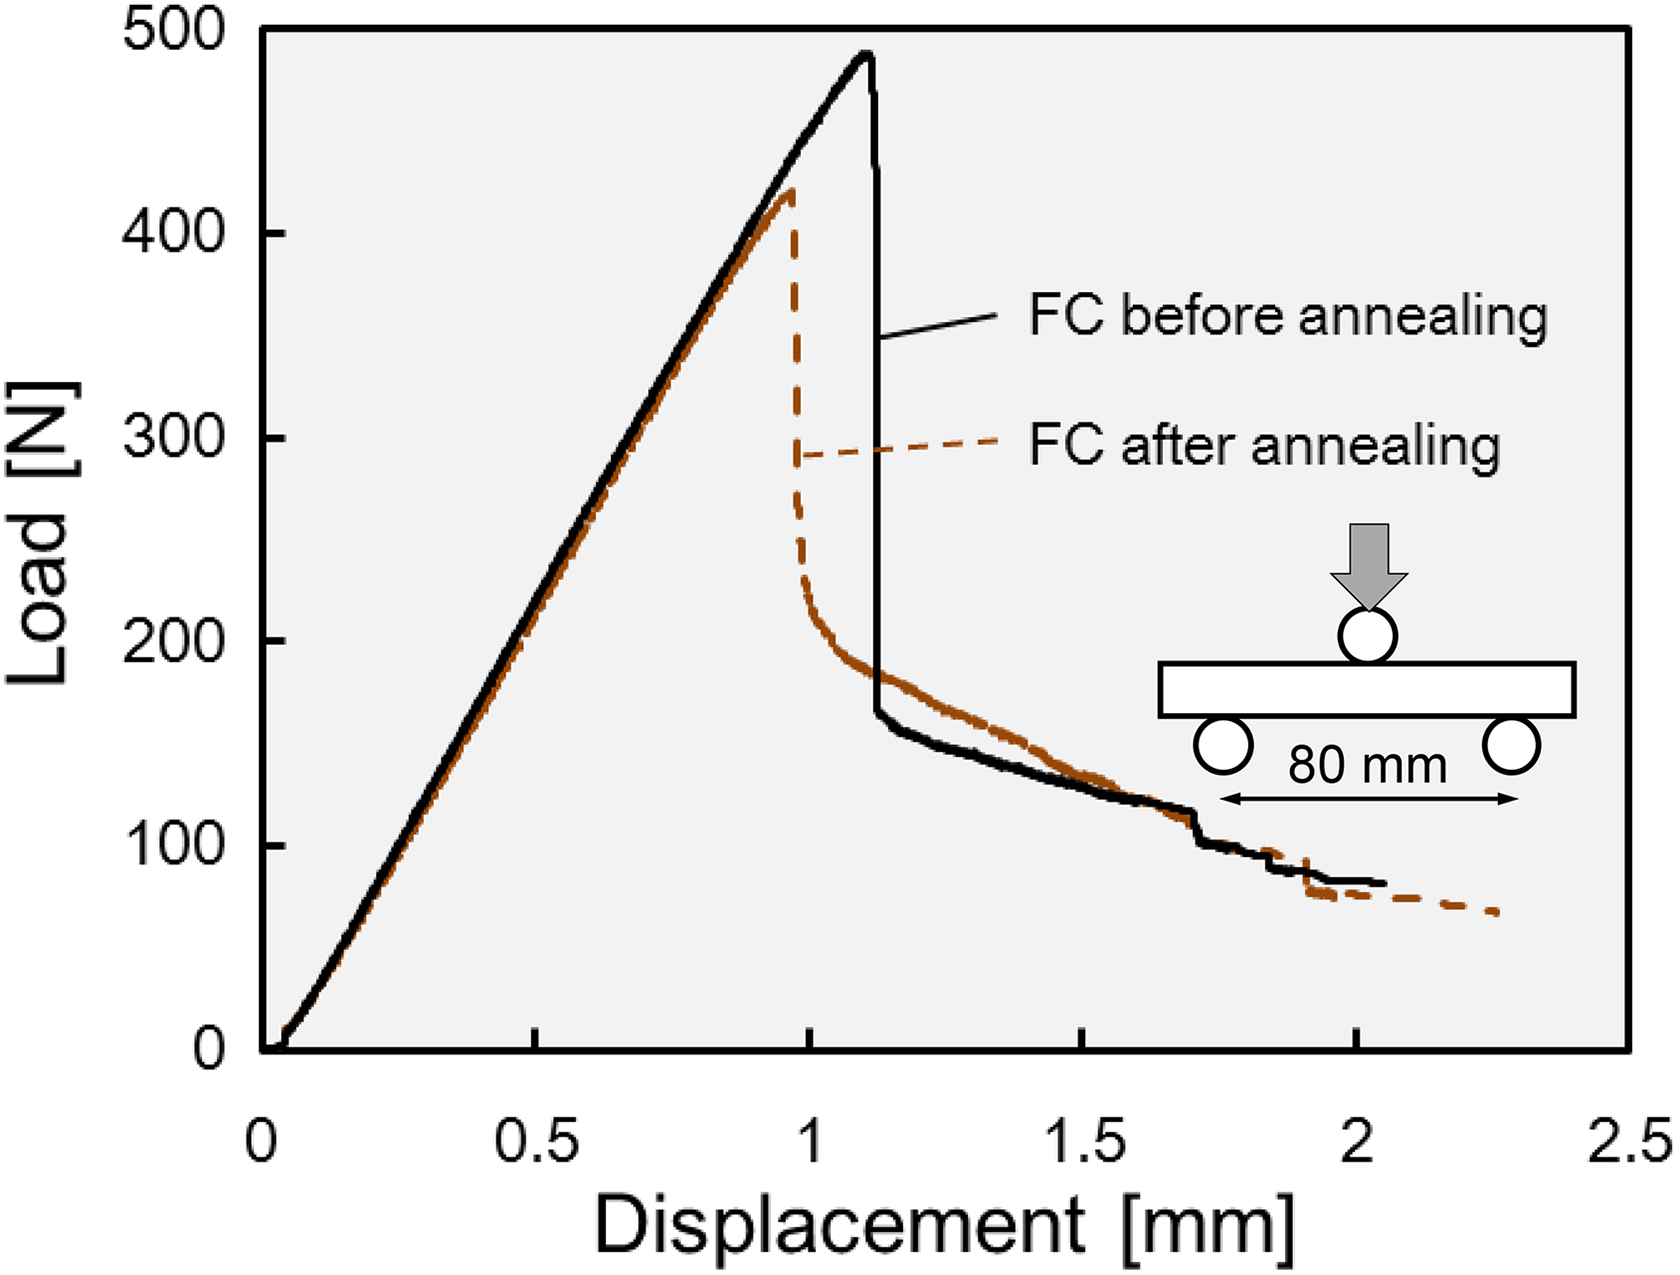
Load–displacement curves obtained by three-point bending tests using FC specimens before and after annealing.
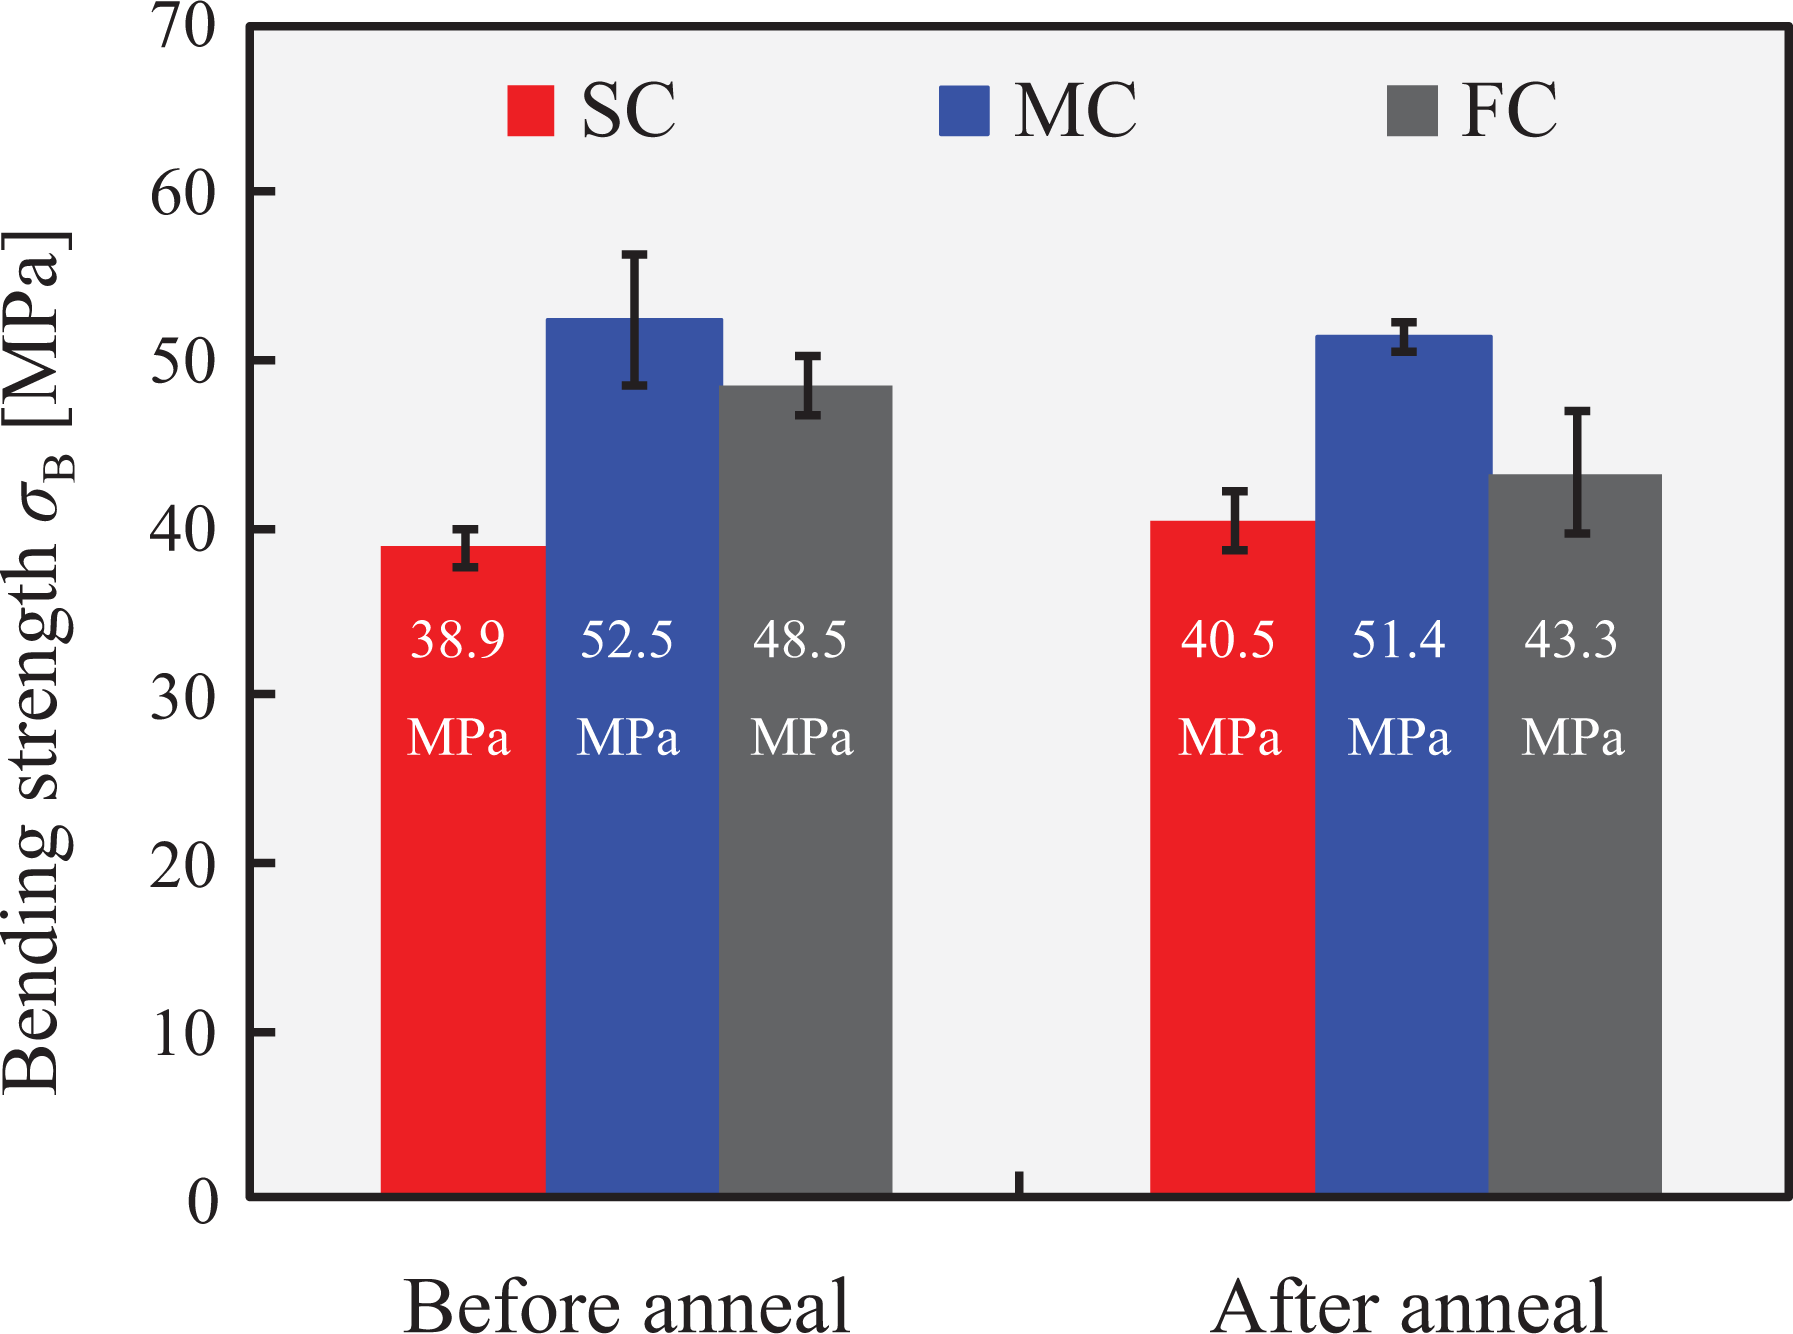
Effect of annealing on bending strength σ B. Difference of σ B between before and after annealing was caused by residual stress relaxation at surface. Error bar indicates standard deviation. T test (p value < 0.05) confirmed that strength deference of FC specimens before and after annealing was statistically significant.
Conclusions
This study clarified stress redistribution behavior of thick thermoplastic composite laminates during annealing using multiple strain sensors deployed in the thickness direction. First, molding tests were conducted using three kinds of conditions with different temperature and cooling rate distribution. Process monitoring during molding confirmed that nonuniform stress/strain distribution occurs due to the thermal skin–core effect. Next, the internal strain change during annealing was measured, and it was clarified that the strain distribution changes by the heat treatment when the morphological skin–core effect occurs during molding. The amount of cold crystalline shrinkage caused by annealing was different in the through-thickness direction, and the surface and the core constrained their deformation with each other, and as a result the residual stress reduced. It was also confirmed that the residual stress caused by the thermal skin–core effect does not relax by annealing.