
Abstract
In the present study, the effect of magnetite (Fe3O4) nanoparticles on the structural and dielectric properties of poly(vinylidene fluoride) (PVDF) matrix was investigated. Distribution of Fe3O4 nanoparticles in the polymer matrix has been studied by scanning electron microscopy (JEOL JSM-7600 F). The structure of the nanocomposite samples was investigated by the X-ray diffraction and Fourier-transform infrared spectroscopy. It was shown that the dielectric permittivity of PVDF + Fe3O4 nanocomposite samples was gradually increased up to 7 wt% of Fe3O4 content. Further increase in the concentration of the filler leads to decrease in the dielectric permittivity. The subsequent decrease in dielectric permittivity at higher Fe3O4 content can be explained by the increase in defects in the structure of the nanocomposite. The comparison of experimental data and the results of theoretical calculations show that the reduction in the empirical value of dielectric permittivity of the nanocomposite is obviously linked with the threshold value of filler. While calculating the theoretical value of the dielectric permittivity for the higher content of the filler, defects in the nanocomposite structure should be considered.
Keywords
Introduction
Polymer-based nanocomposites are one of the most important materials in electronic packaging technology and much attention has been paid to its dielectric and energy storage behaviors in recent years. 1 The properties of the polymer-based nanocomposites are quite different from the constituent components due to the interphase interaction. The interface, which is an important factor in changing the dielectric parameters of the nanocomposite, lies between the polymer and the particle. 2
One of the most attractive features of these filled nanocomposites is that their dielectric properties can be widely changed by choice of shape, size, and the conductivity of filled constituents in the polymeric matrix. 3 The study of the electrical properties of these materials will allow us to evaluate the physicochemical processes taking place in these systems and clarify the prospects for their application. The physicochemical properties of the nanocomposite can be influenced by various factors: interparticle distance, interphase interaction, the nature of the molecular structure of the polymer, the way the nanocomposite is formed, and so on. The study of dielectric constant and dielectric loss, as a function of temperature and frequency, is one of the most convenient and sensitive methods of studying the relationships between structure and properties of the polymer-based nanocomposites. 4
The aim of the present article is to report a qualitative and quantitative study on the relation of structure and electrophysical properties of polymer nanocomposites. To the best of our knowledge, this is the first time the relationship between structures and dielectric properties of the polymeric nanocomposites was experimentally and theoretically studied in detail. In this work, the dependence of the dielectric permittivity of the poly(vinylidene fluoride) (PVDF) + magnetite (Fe3O4) nanocomposite on the filler concentration was theoretically and experimentally investigated. The discrepancy between the theoretical and experimental result was explained.
Experimental
Materials
The polar polymer PVDF has the density of 1.78 g/cm3 at 25°C and the melting point is 177°C.
Used Fe3O4 nanoparticles were synthesized by coprecipitation technique in an alkaline medium. 5 The particle size is about 7–15 nm.
Methods
Scanning electron microscopy
The distribution of Fe3O4 nanoparticles in the polymer matrix has been studied by scanning electron microscopy (SEM, JEOL JSM-7600 F). Scanning was carried out in LEI mode with an accelerating voltage of 15 kV and a working distance of 15.5 mm.
X-ray diffraction
X-ray diffraction (XRD) analysis of the prepared samples was carried out on a Rigaku Mini Flex 600 XRD diffractometer at room temperature. In all the cases, CuK(α) radiation from a Cu X-ray tube (run at 15 mA and 30 kV) was used. Diffraction patterns were obtained in the range of Bragg’s angle 2θ = 10–80°.
Fourier-transform infrared spectroscopy
The structure of nanocomposite was studied at room temperature by Fourier-transform infrared (FTIR) spectroscopy (spectrometer Varian 3600 FTIR) at 4000–400 cm−1.
Method for measuring dielectric properties
The frequency dependences of the dielectric permittivity and dielectric losses tangent were measured at a temperature T = 298 K in the frequency range f = 102–106 Hz using the dielectric spectroscopy (MNIPIE7-20).
Synthesis of nanocomposites
Before starting the synthesis of nanocomposite, the PVDF was dissolved in dimethylformamide (DMF) solvent, at room temperature. Fe3O4 nanoparticles were added to the polymer solution at different weight contents (1 wt%, 5 wt%, 7 wt%, 10 wt%) and stirred for 2 h in order to prepare a homogeneous mixture. The mixture is dried in the vacuum oven. The samples of nanocomposite were obtained by hot pressing method at PVDF melting point under 15 MPa pressure for 4 min with further cooling to room temperature. 6
Results and discussion
Figure 1(a) and (b) shows the SEM images of PVDF + Fe3O4 nanocomposites with 5 wt% and 10 wt% of Fe3O4 nanoparticles, respectively. As seen in the figures, the size of Fe3O4 nanoparticles in the polymer matrix is 13–21 nm for PVDF + 5 wt% Fe3O4 nanocomposites. With increasing content of Fe3O4 nanoparticles in the polymer matrix, the size of nanoparticles also increases. The average size of Fe3O4 nanoparticles in the PVDF matrix for its 10 wt% content is approximately 40 nm.
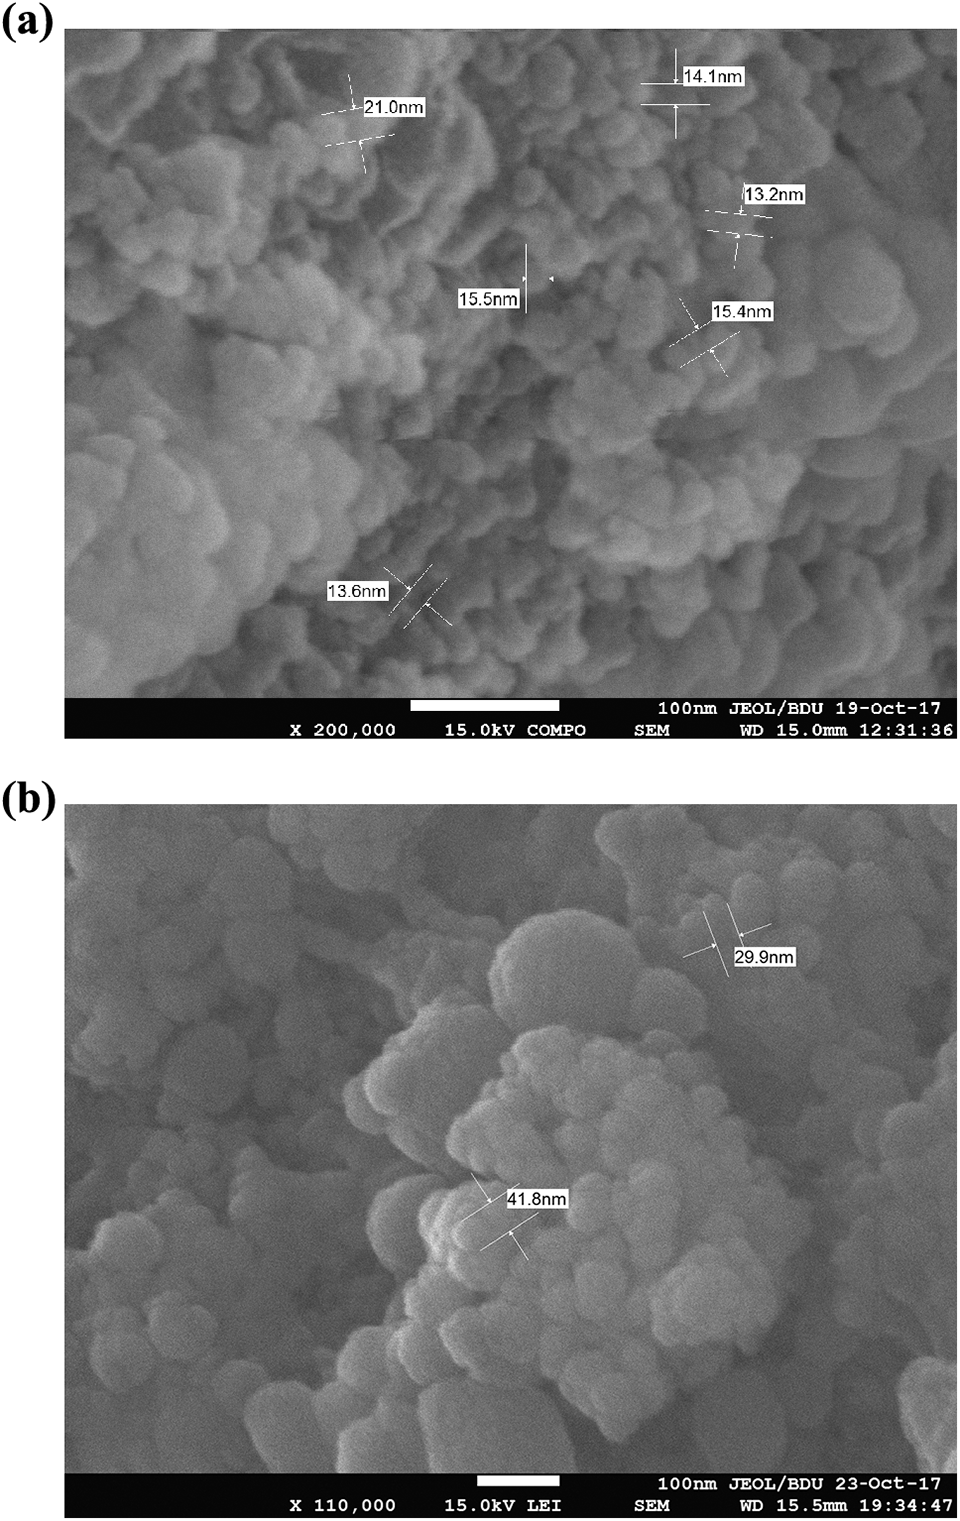
SEM images of the PVDF + Fe3O4 nanocomposites: (a) PVDF + 5wt% Fe3O4 and (b) PVDF + 10wt% Fe3O4.
The EDS analysis data for the nanocomposites are provided in Figure 2. From the EDS spectrum, it can be seen that the nanocomposite contains carbon (C), fluorine (F), oxygen (O), and iron (Fe) elements. The presence of platinum in the EDS spectrum is associated with its deposition on the surface of the nanocomposite in order to eliminate the charging of dielectric nanocomposite films.
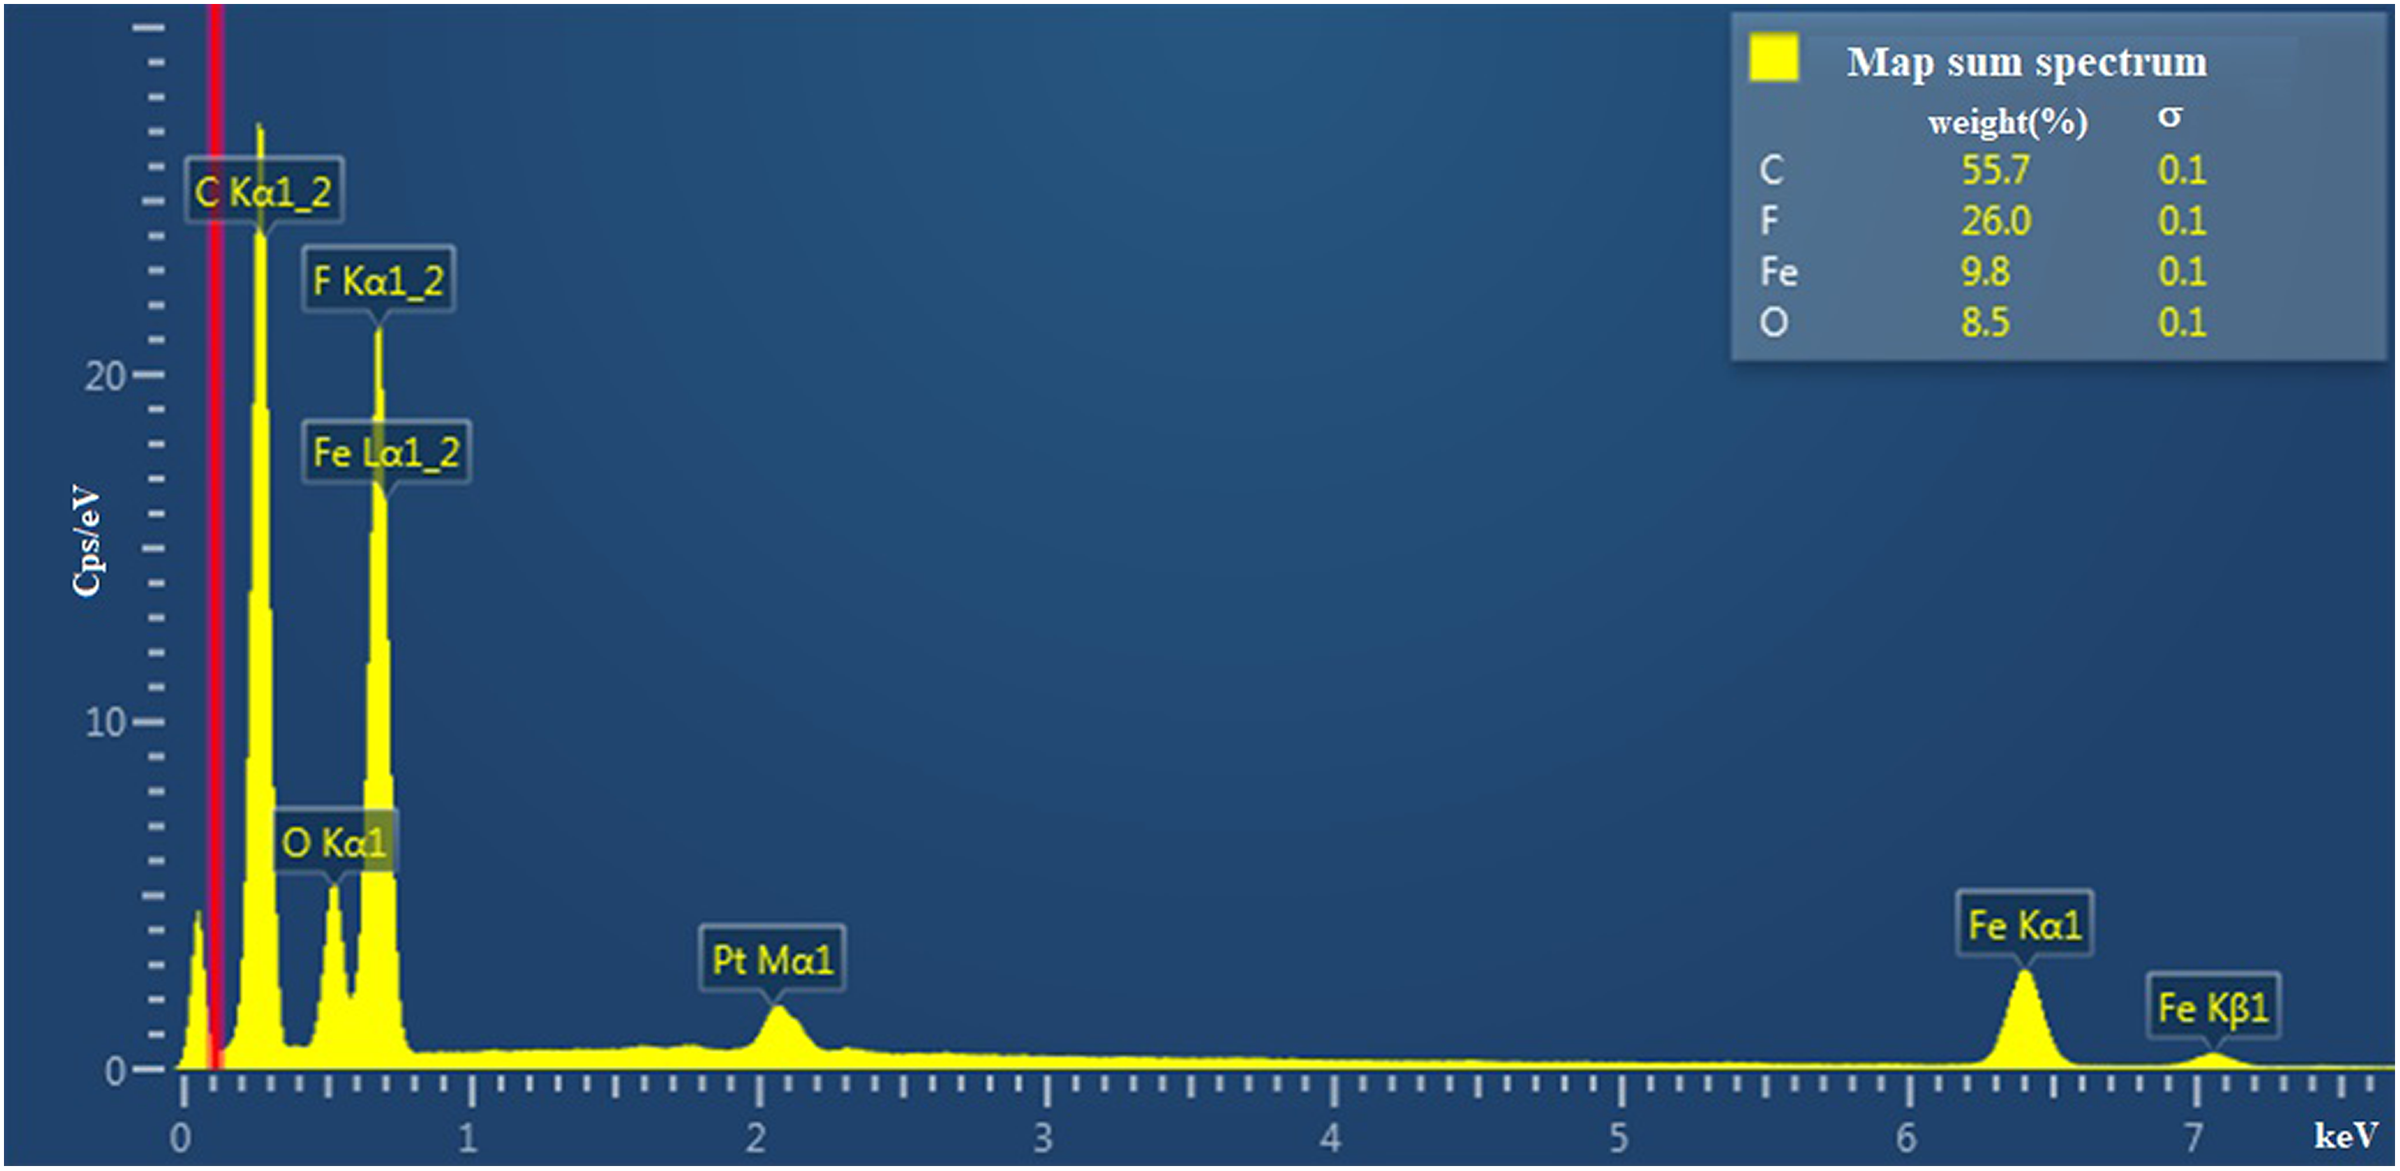
EDS spectra of the PVDF + Fe3O4 nanocomposites.
Figure 3 shows the elemental mapping of PVDF + Fe3O4 nanocomposites. Elemental maps reveal that carbon (C), oxygen (O), iron (Fe) and fluorine (F) are the constituent elements of the nanocomposite material.
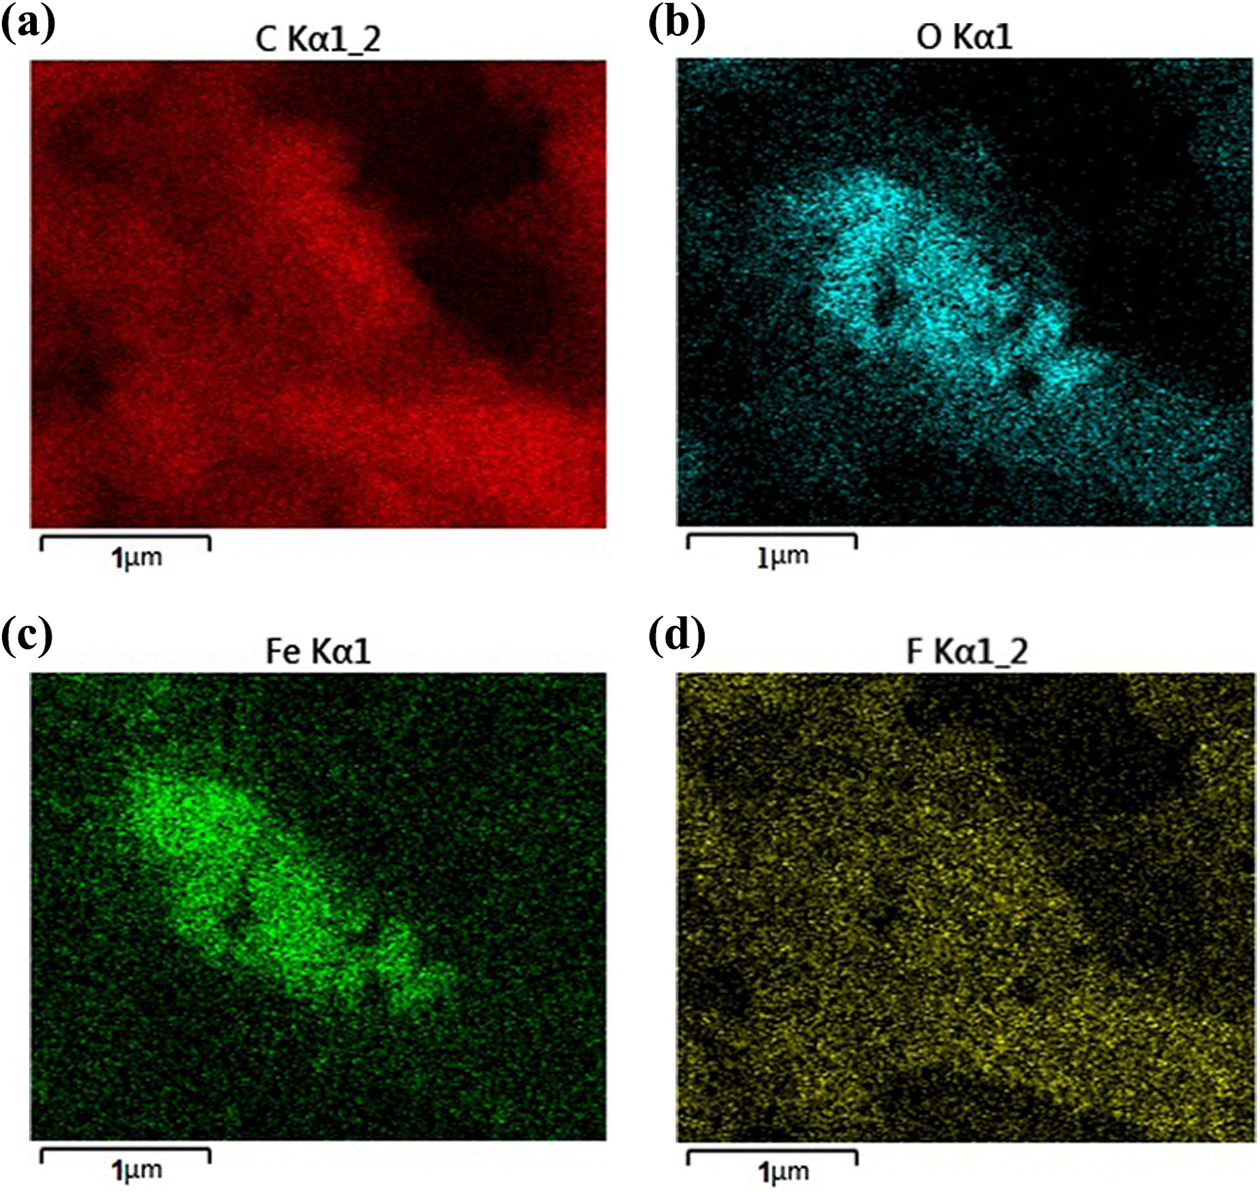
Elemental mapping of PVDF + Fe3O4 nanocomposites.
XRD analysis of the samples was performed at room temperature. Figure 4 shows X-ray diffractograms of pristine PVDF and PVDF + Fe3O4 nanocomposites with 5 and 10 wt% content of Fe3O4. From the patterns of PVDF + Fe3O4 nanocomposites, a series of characteristic peaks (220), (311), (400), (511), and (440), which are in well accordance with the inverse cubic spinel phase of Fe3O4 2θ = 30.2°, 35.5°, 43.2°, 53.5°, and 62.9°), were observed (ICDD DB card number 01-073-9877). As seen from the figure, with increasing the content of nanoparticles in the polymer matrix, the intensity of characteristic line of Fe3O4 also increases. The well-known diffraction peaks of monoclinic α phase of PVDF appearing at 2θ = 18.4°, 35.7°, and 41.1° are assigned to the lattice planes of (020), (200), and (111), respectively. A very strong diffraction peak as present at 2θ = 20.8° in pristine PVDF, correspond to the (110) planes of the orthorhombic β phase. With the incorporation of Fe3O4 nanoparticles into the PVDF polymer matrix, the intensity of the line at 20.8° corresponding to β phase of PVDF increases and the characteristic line of α phase at 18.4° completely disappears. These findings suggest that the presence of Fe3O4 induces the formation of β phase. The addition of Fe3O4 nanoparticles leads to rotation of the pendant groups which as a result form β phase that is more electroactive. 7
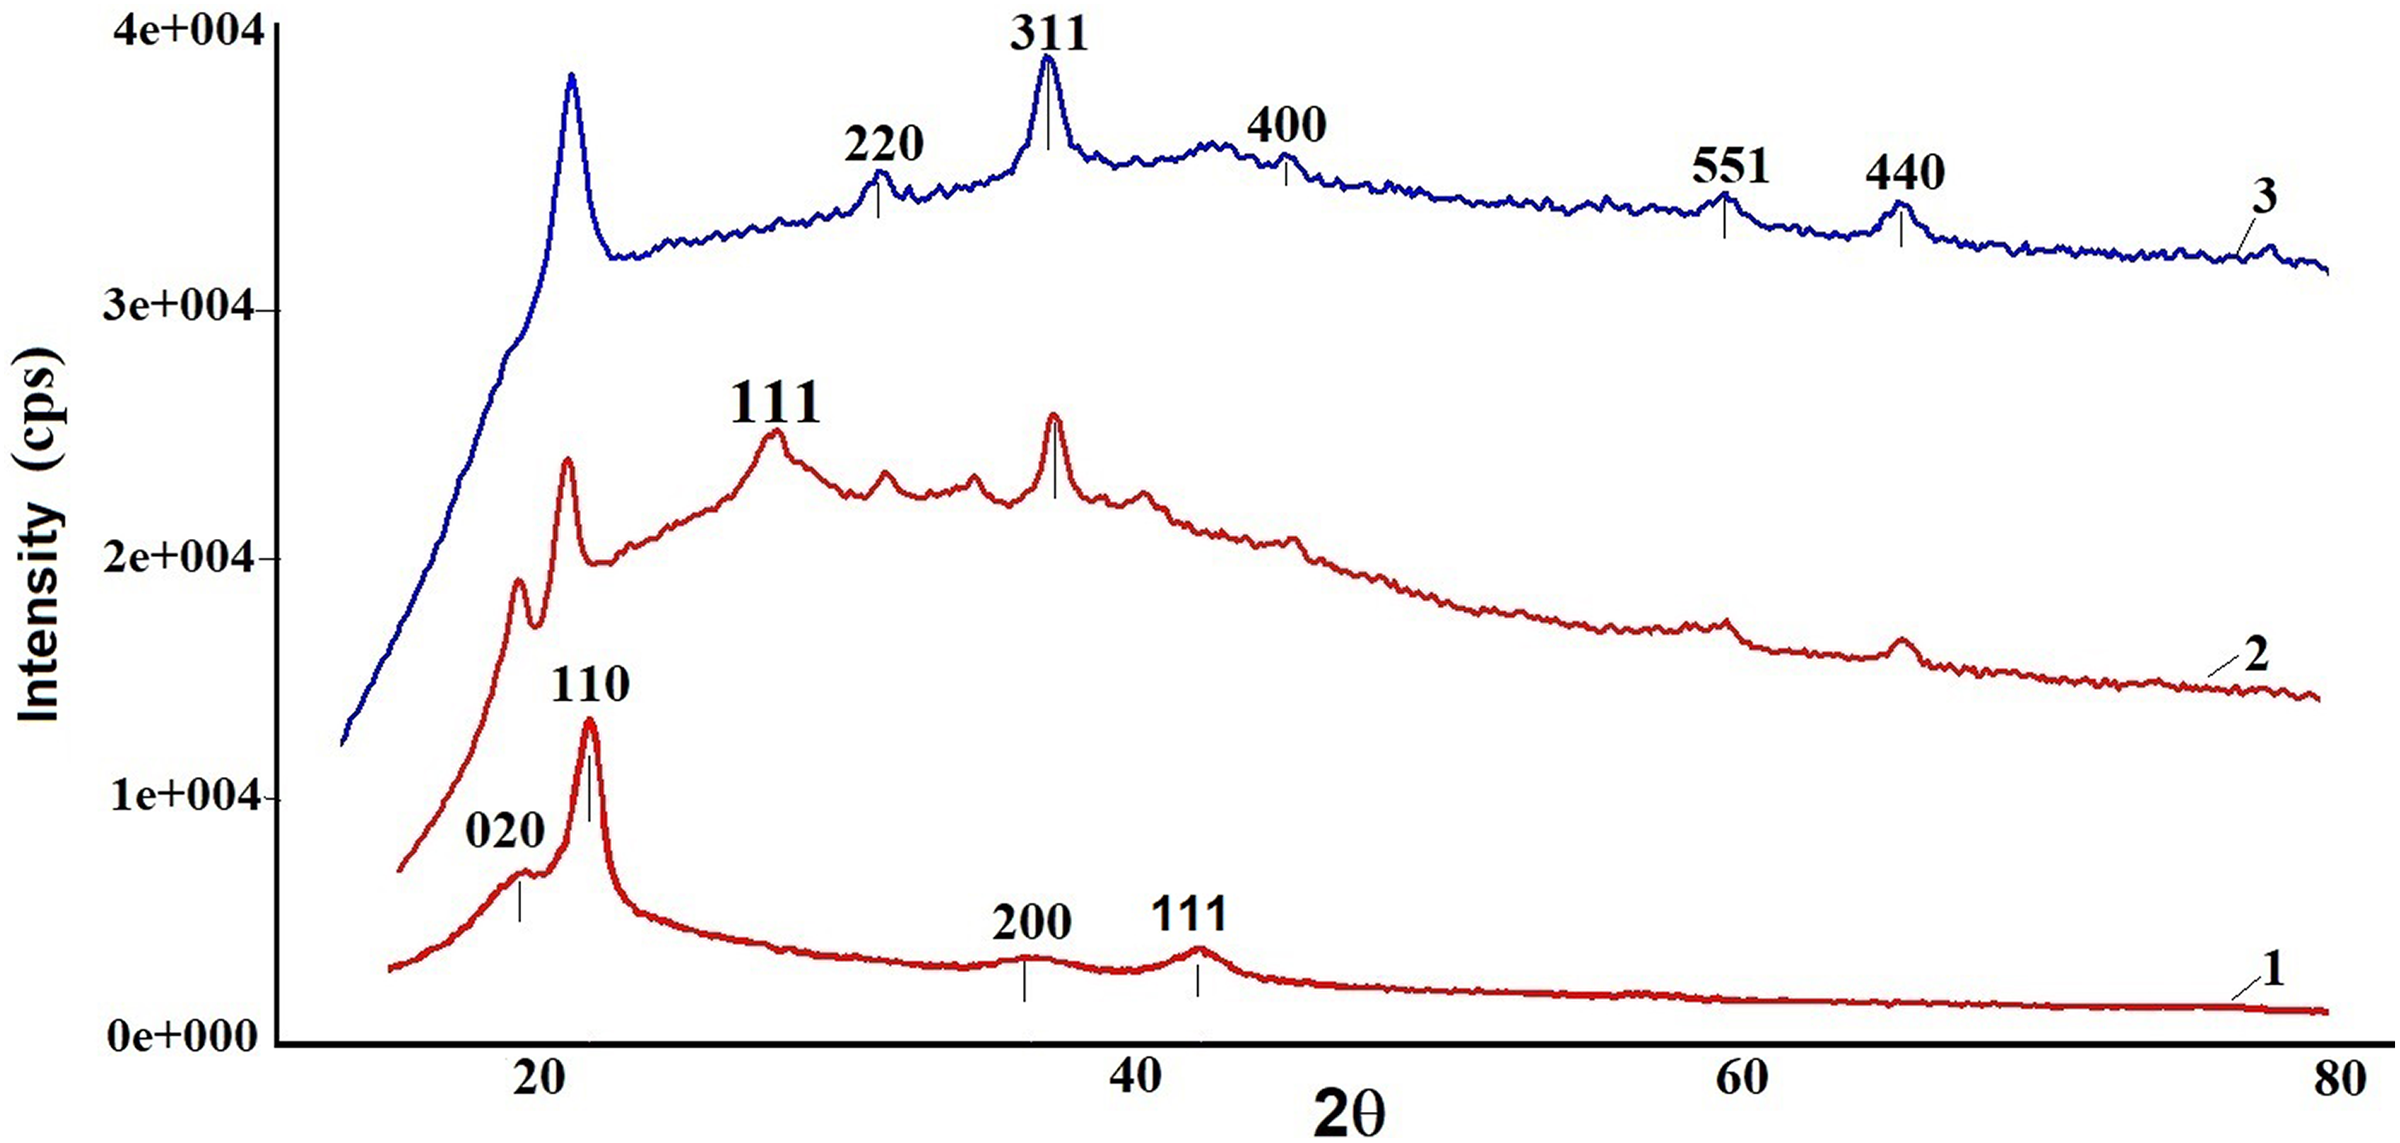
Comparative XRD patterns of pristine PVDF film and PVDF + Fe3O4 nanocomposite films: (1) Pure PVDF, (2) PVDF + 5wt% Fe3O4, and (3) PVDF + 10 wt% Fe3O4.
The FTIR spectra of the pure PVDF and PVDF + Fe3O4 nanocomposite were indicated in Figure 5. The bands at 614, 762, 796, and 948 cm–1 are associated with the α phase of PVDF. 8 Vibration bands at 840 cm−1 (CH2 rocking) correspond to β phase of PVDF. The IR spectroscopy study of the PVDF samples indicated the existence of two crystalline forms of the polymer: α and β. The asymmetric and symmetric vibrations of the CH2 bonds of PVDF correspond to 3016 and 2977 cm−1 bands. The organic solvent of PVDF-DMF is also the source of the occurrence of the stretching vibration of C=O amide groups at 1675 cm−1. 9 The incorporation of Fe3O4 nanoparticles on the polymer resulted in the sharp peak around 500–700 cm−1 that could be attributed to the existence of Fe–O vibration. 10 With the addition of Fe3O4 nanoparticles into the polymer matrix up to 5 wt%, “doublet” band pair shifted to the red part of the spectrum (3016 cm−1 shifted to 3024 cm−1 and 2977 cm−1 shifted to 2984 cm−1, respectively). With further increasing of concentration, the absorption bands shift back to initial position. FTIR measurements show that there is no chemical bonding between the filler (Fe3O4) nanoparticles and the polymer matrix (PVDF). Fe3O4 nanoparticles are just distributed in the volume of the polymer.
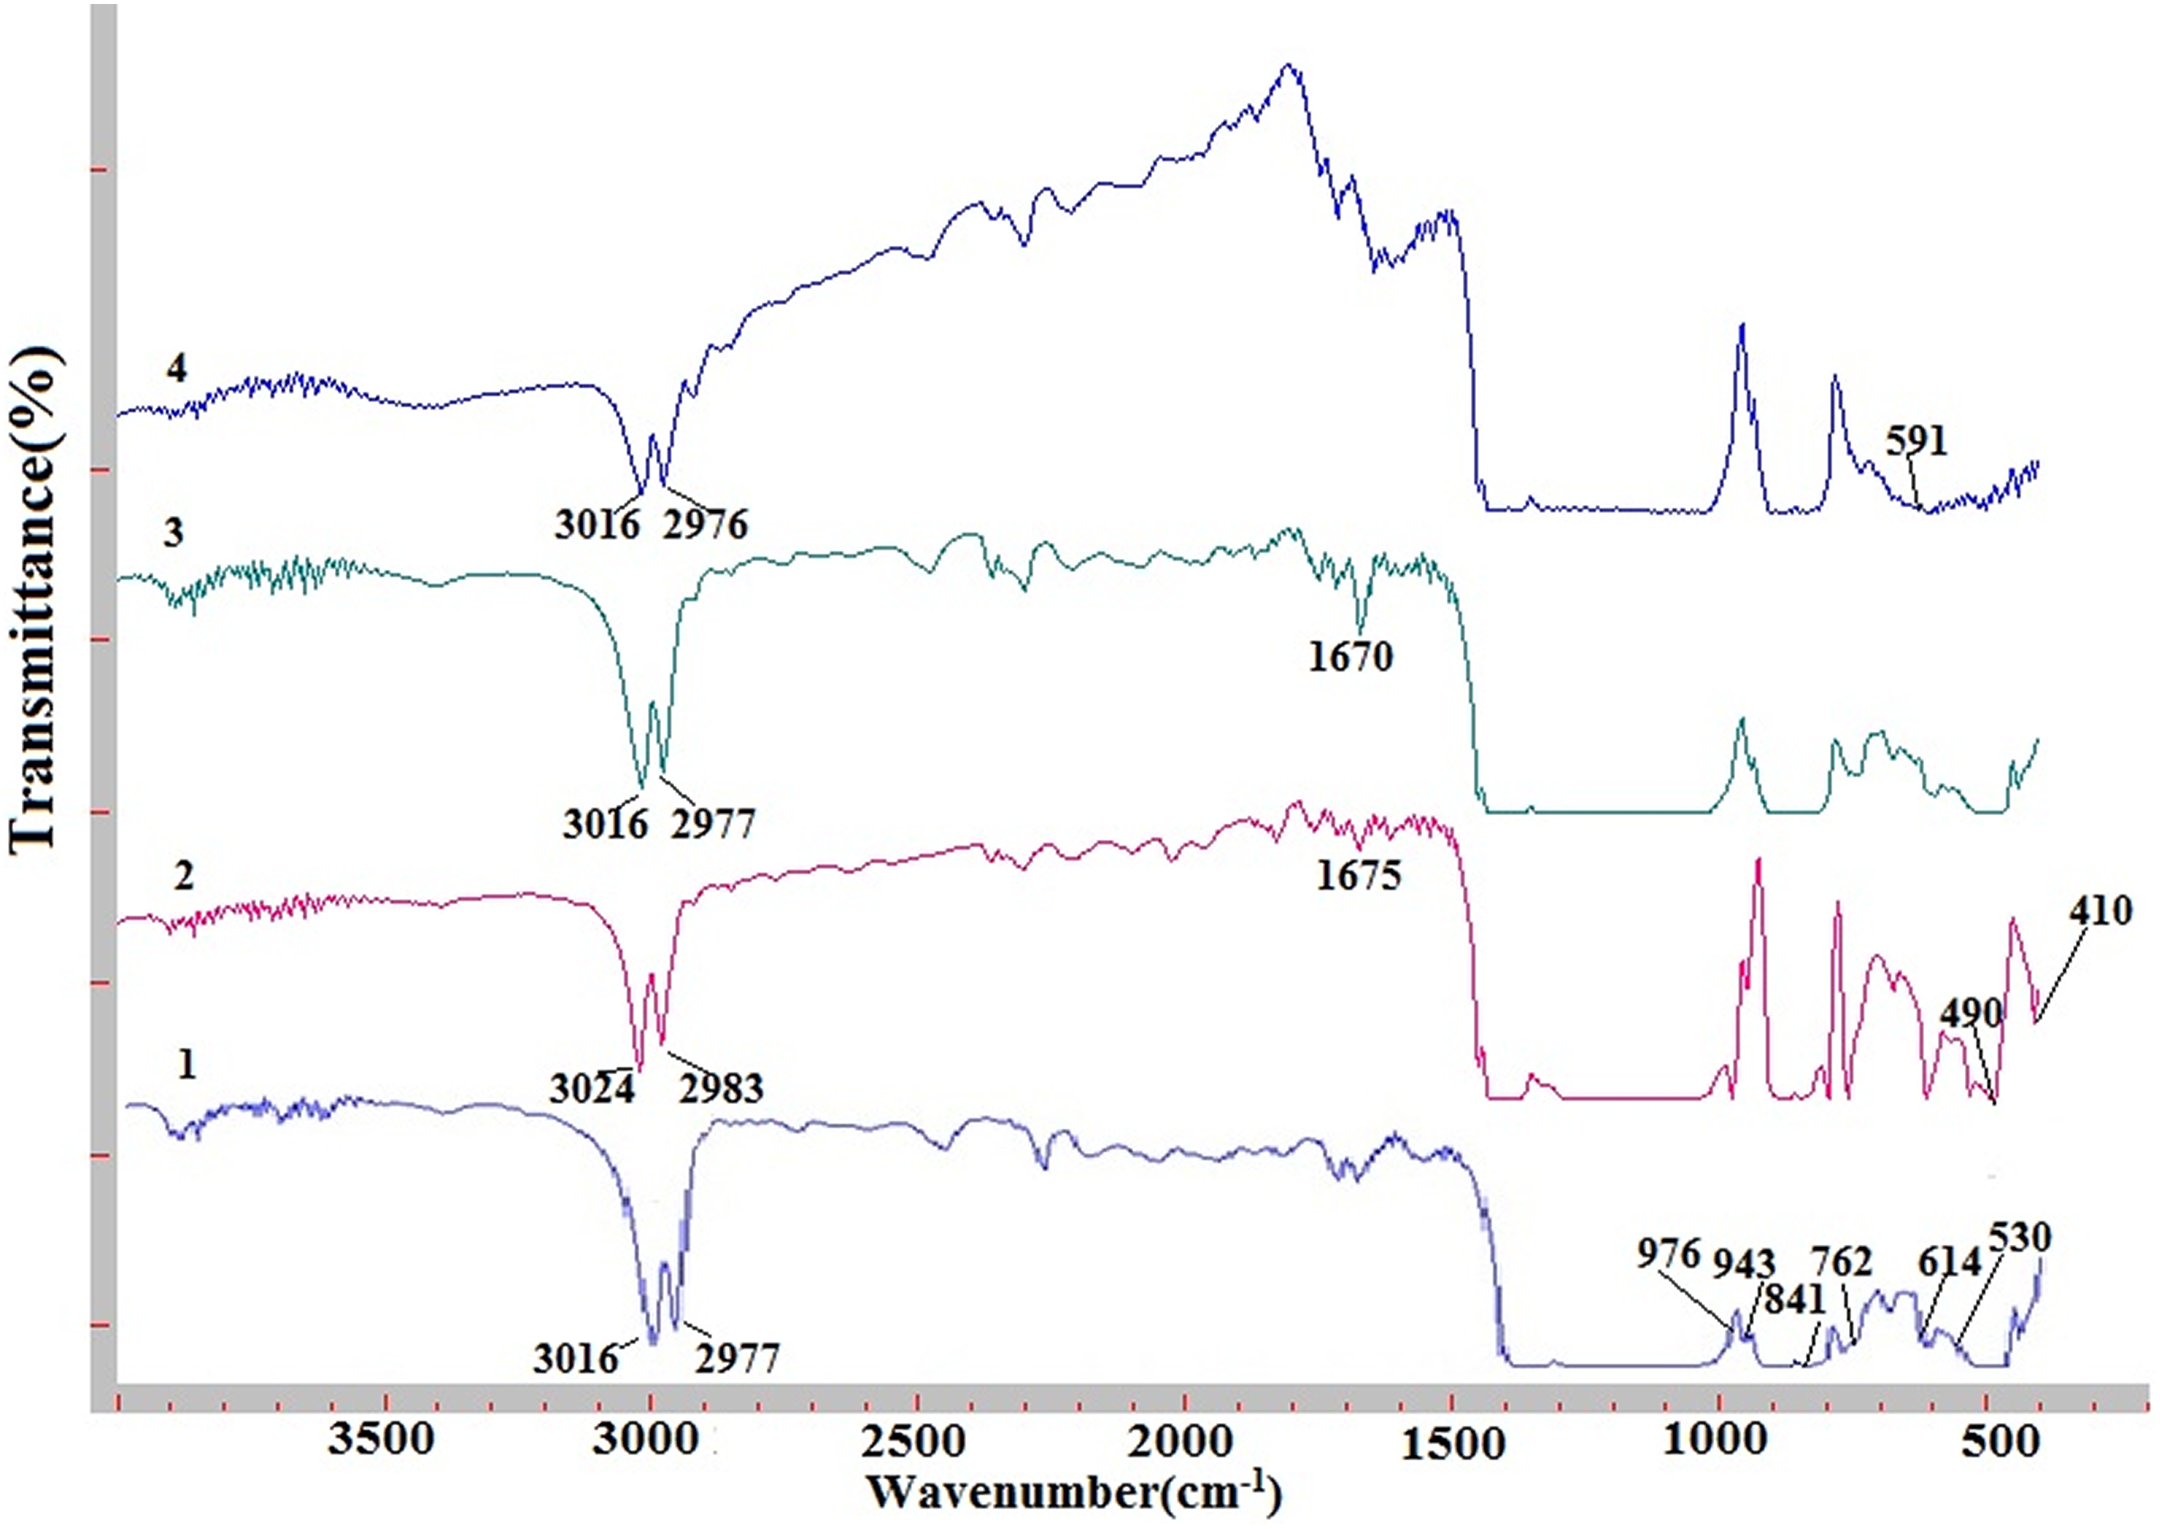
FTIR spectra of nanocomposites PVDF + Fe3O4: (1) Pure PVDF, (2) PVDF + 5 wt% Fe3O4, (3) PVDF + 10 wt% Fe3O4, and (4) PVDF + 20% Fe3O4.
Figure 6 shows the frequency dependences of the dielectric permittivity (ε) of the pure PVDF and PVDF + Fe3O4 nanocomposite. It can be seen in Figure 5 that the incorporation of Fe3O4 nanoparticle in the PVDF matrix leads to the rise of the dielectric permittivity of the nanocomposite up to 7 wt% of Fe3O4 content. The decrease in the dielectric permittivity at higher Fe3O4 contents is associated with an increase in defects of the composite structure. As can be seen from Figure 6, the dielectric permittivity of the nanocomposite decreases with increasing frequency. This reduction is due to the complication of polarization process in nanocomposites.
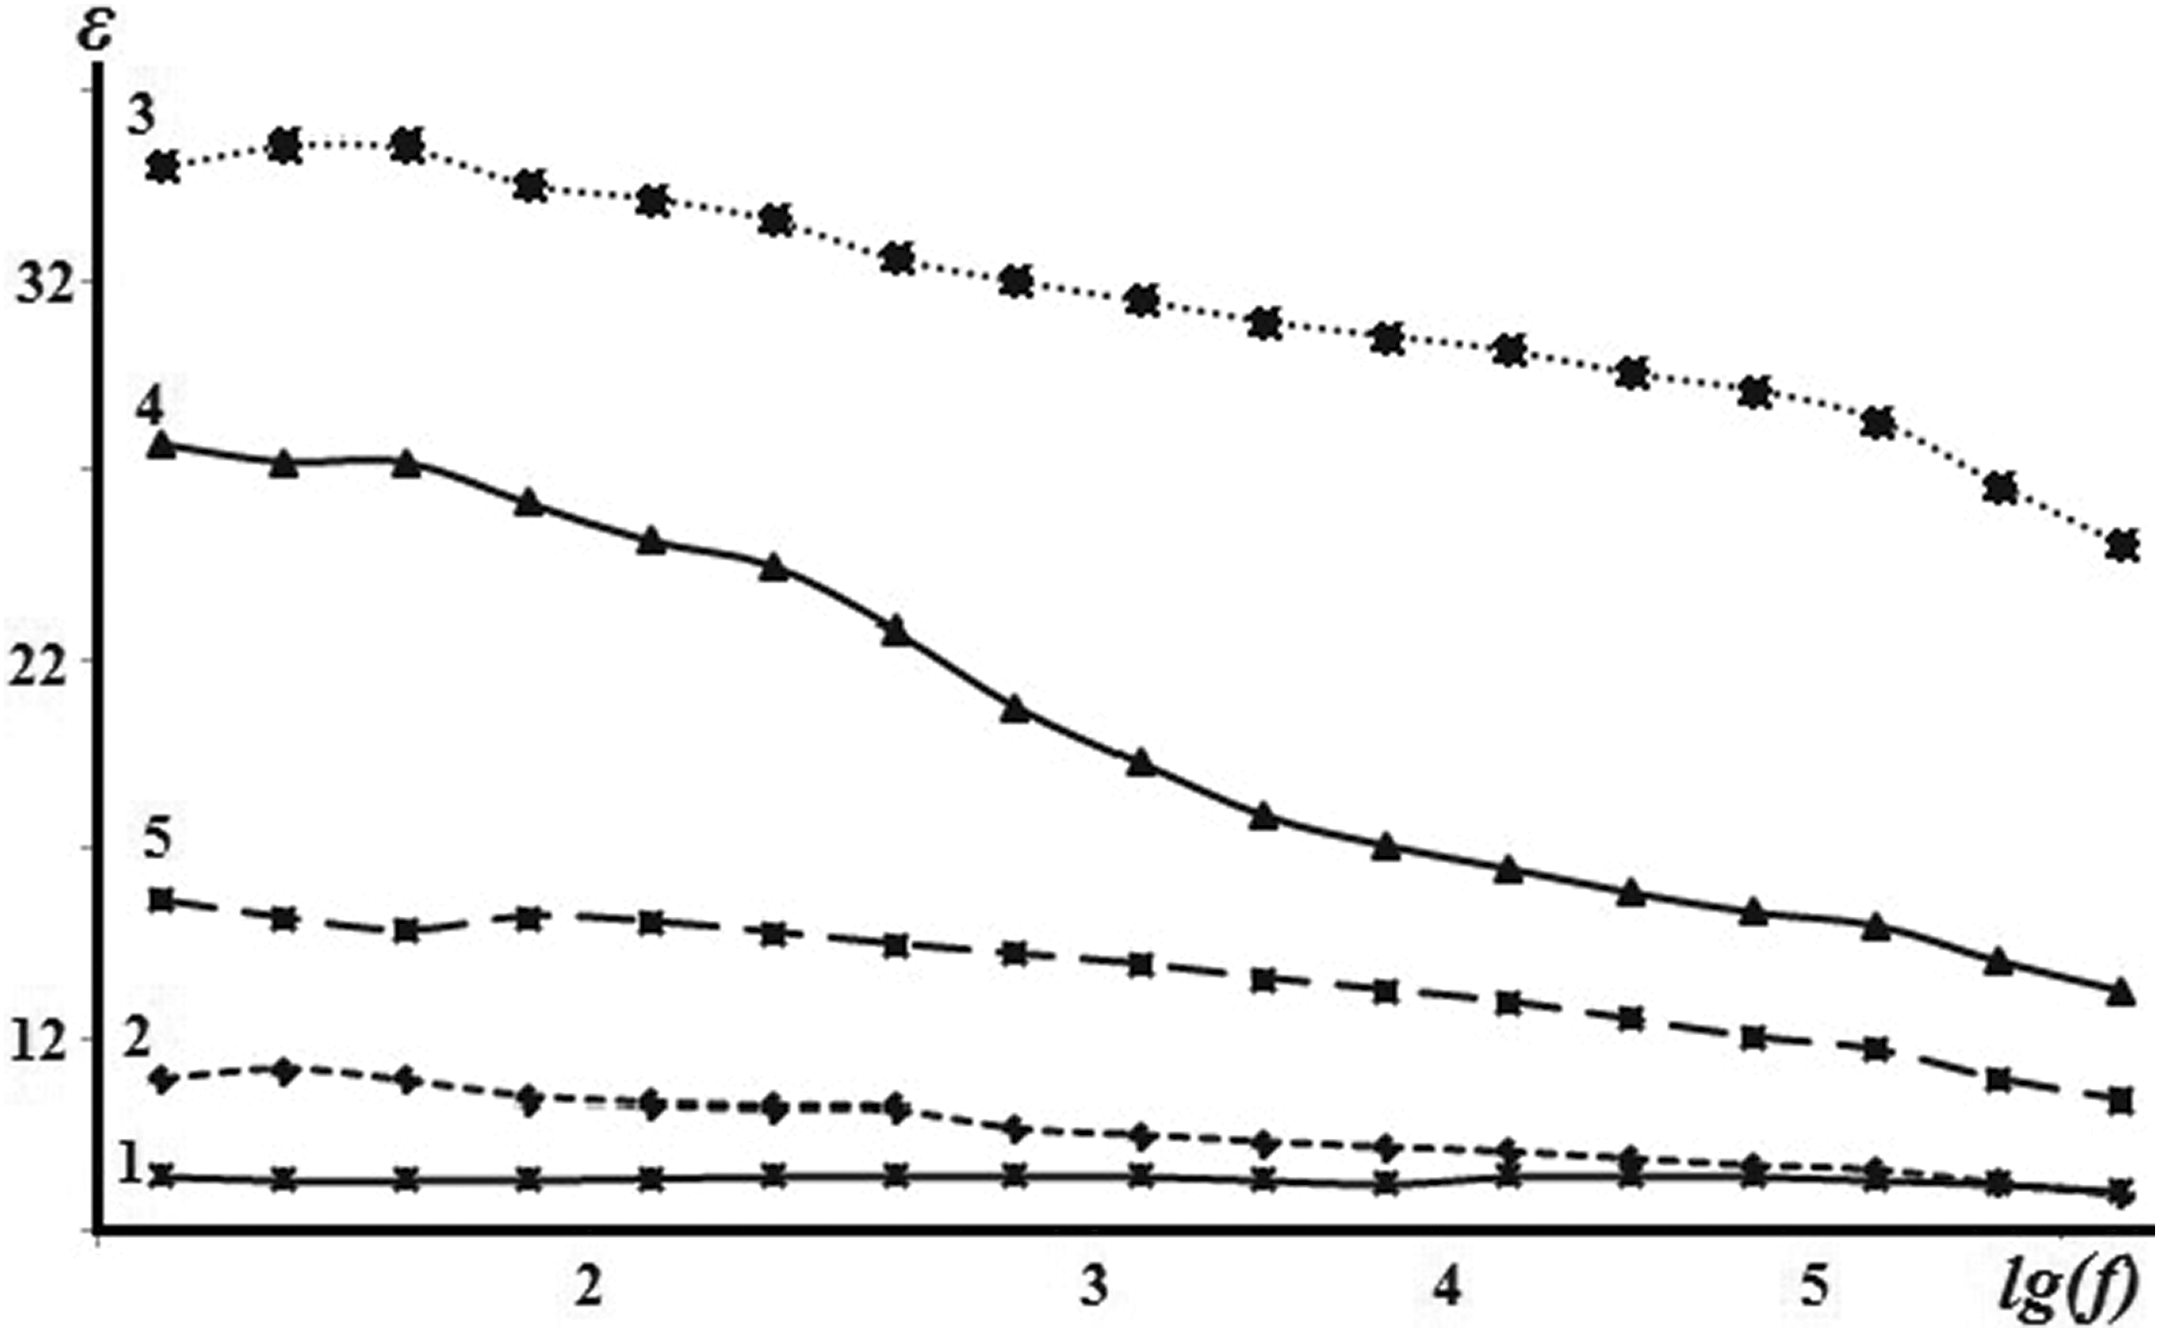
Addiction of dielectric constant of pure PVDF and composites PVDF + Fe3O4 on frequency: (1) pure PVDF, (2) PVDF + 3 wt% Fe3O4, (3) PVDF + 7 wt% Fe3O4, (4) PVDF + 10 wt% Fe3O4, and (5) PVDF + 20 wt% Fe3O4.
Frequency dependence of dielectric loss tangent of the PVDF + Fe3O4 nanocomposites is shown in Figure 7. As can be seen from the figure, with the increasing frequency, the value of tan (δ) of the PVDF + Fe3O4 nanocomposite increases. The sharp increase in the dielectric loss with increasing of frequency is due to high frequency energy losses.
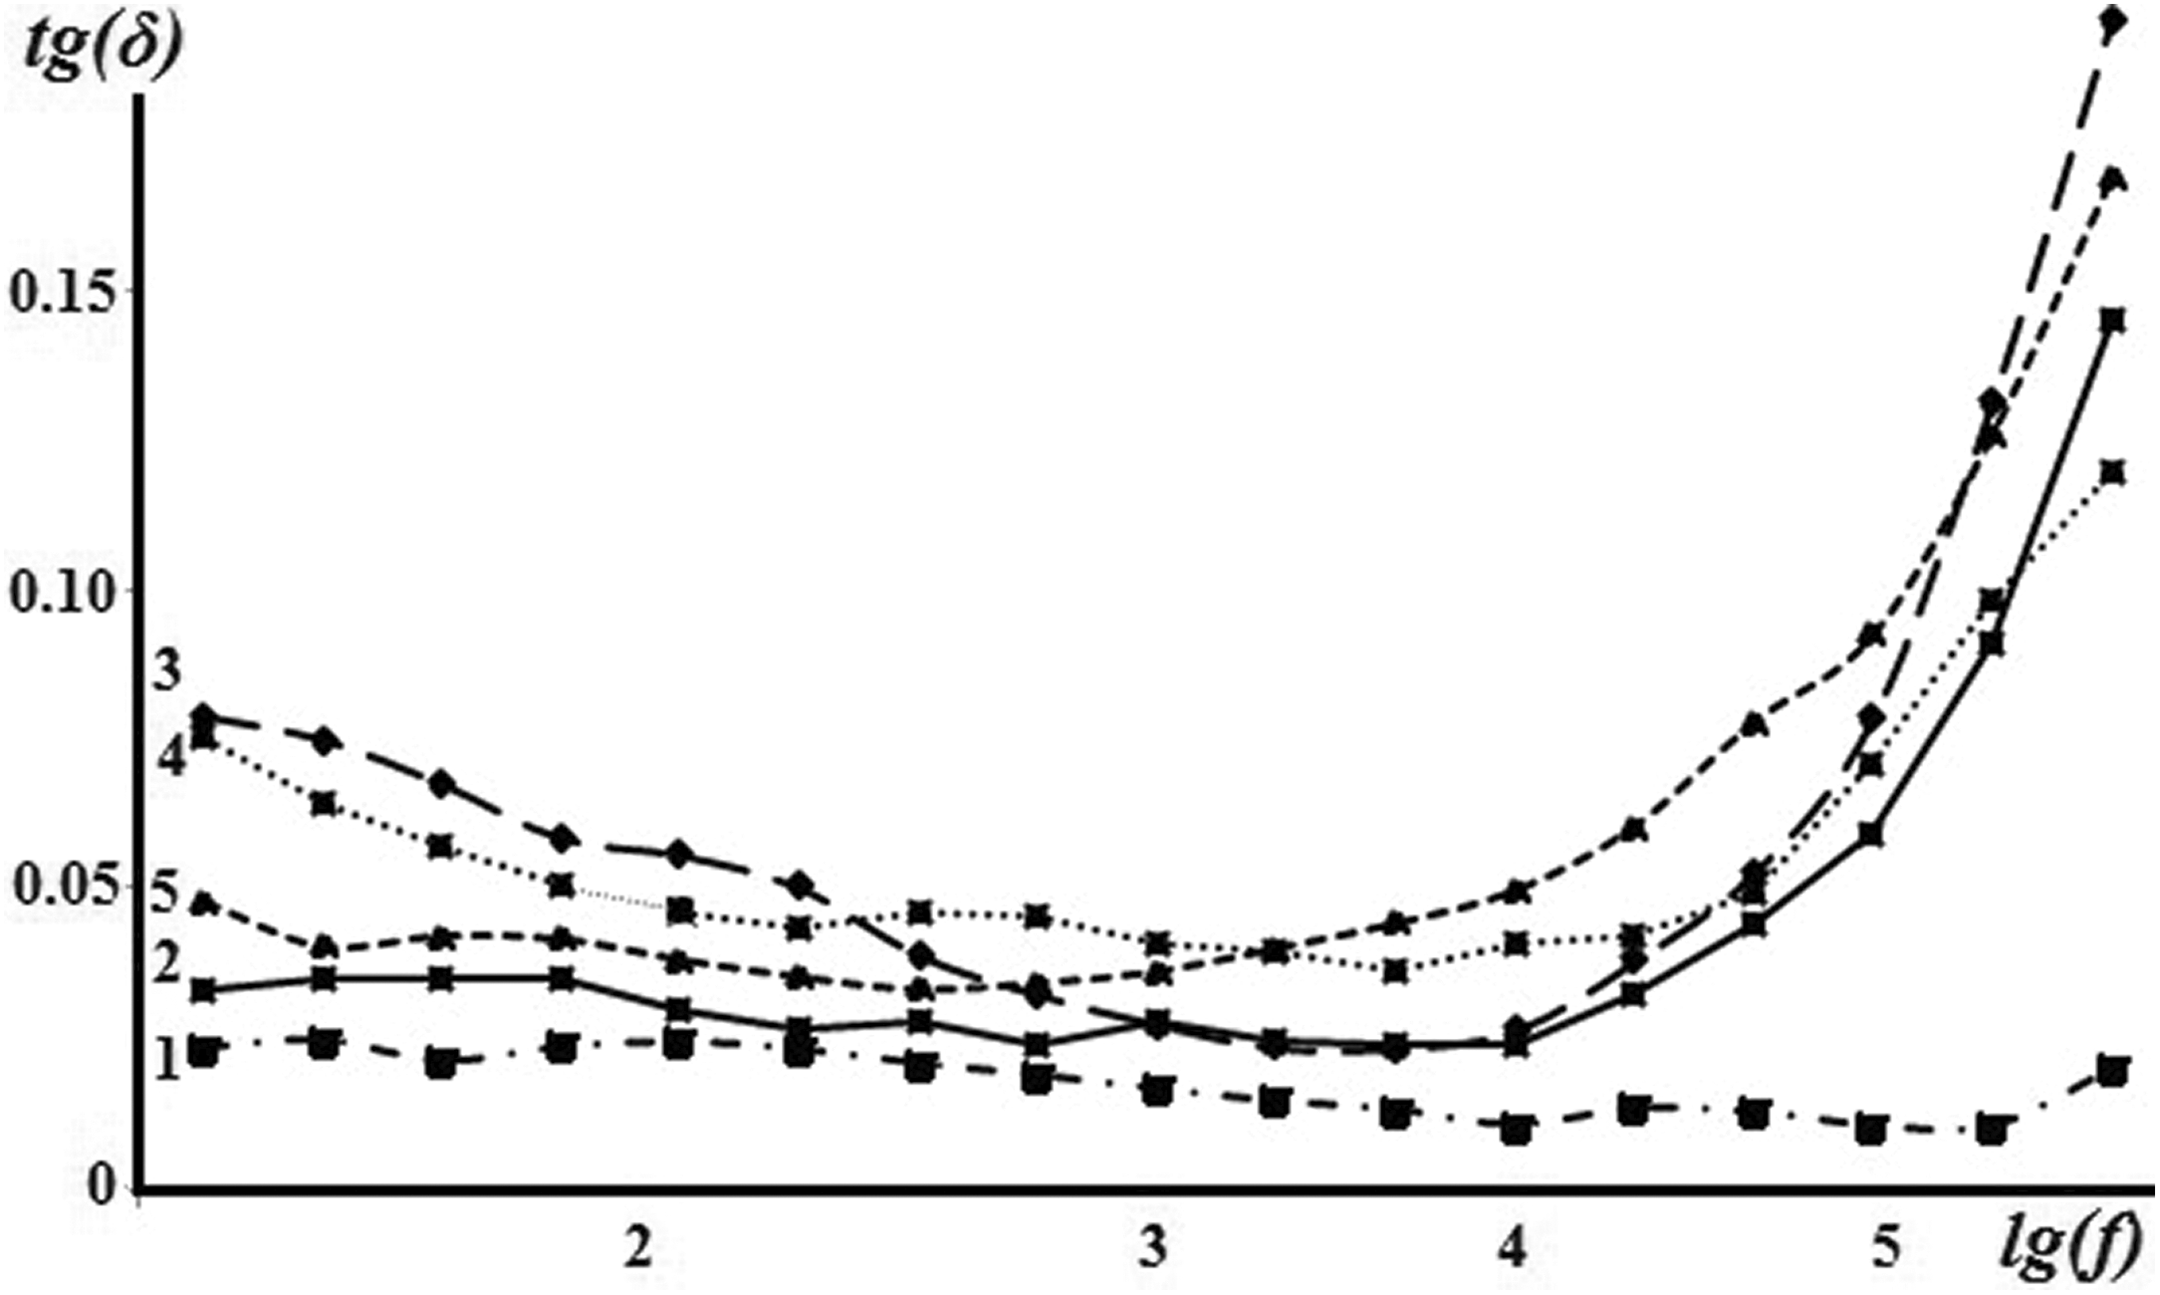
Frequency dependence of the dielectric loss tangent of pure PVDF and PVDF + Fe3O4 nanocomposites: (1) Pure PVDF, (2) PVDF + 3 wt% Fe3O4, (3) PVDF + 7 wt% Fe3O4, (4) PVDF + 10 wt% Fe3O4, and (5) PVDF + 20 wt% Fe3O4.
Figure 8 shows the temperature dependence of the dielectric permittivity of the PVDF + Fe3O4 nanocomposites measured at a frequency of 1 kHz. It is shown that the value of the dielectric permittivity varies slightly with increasing temperature.
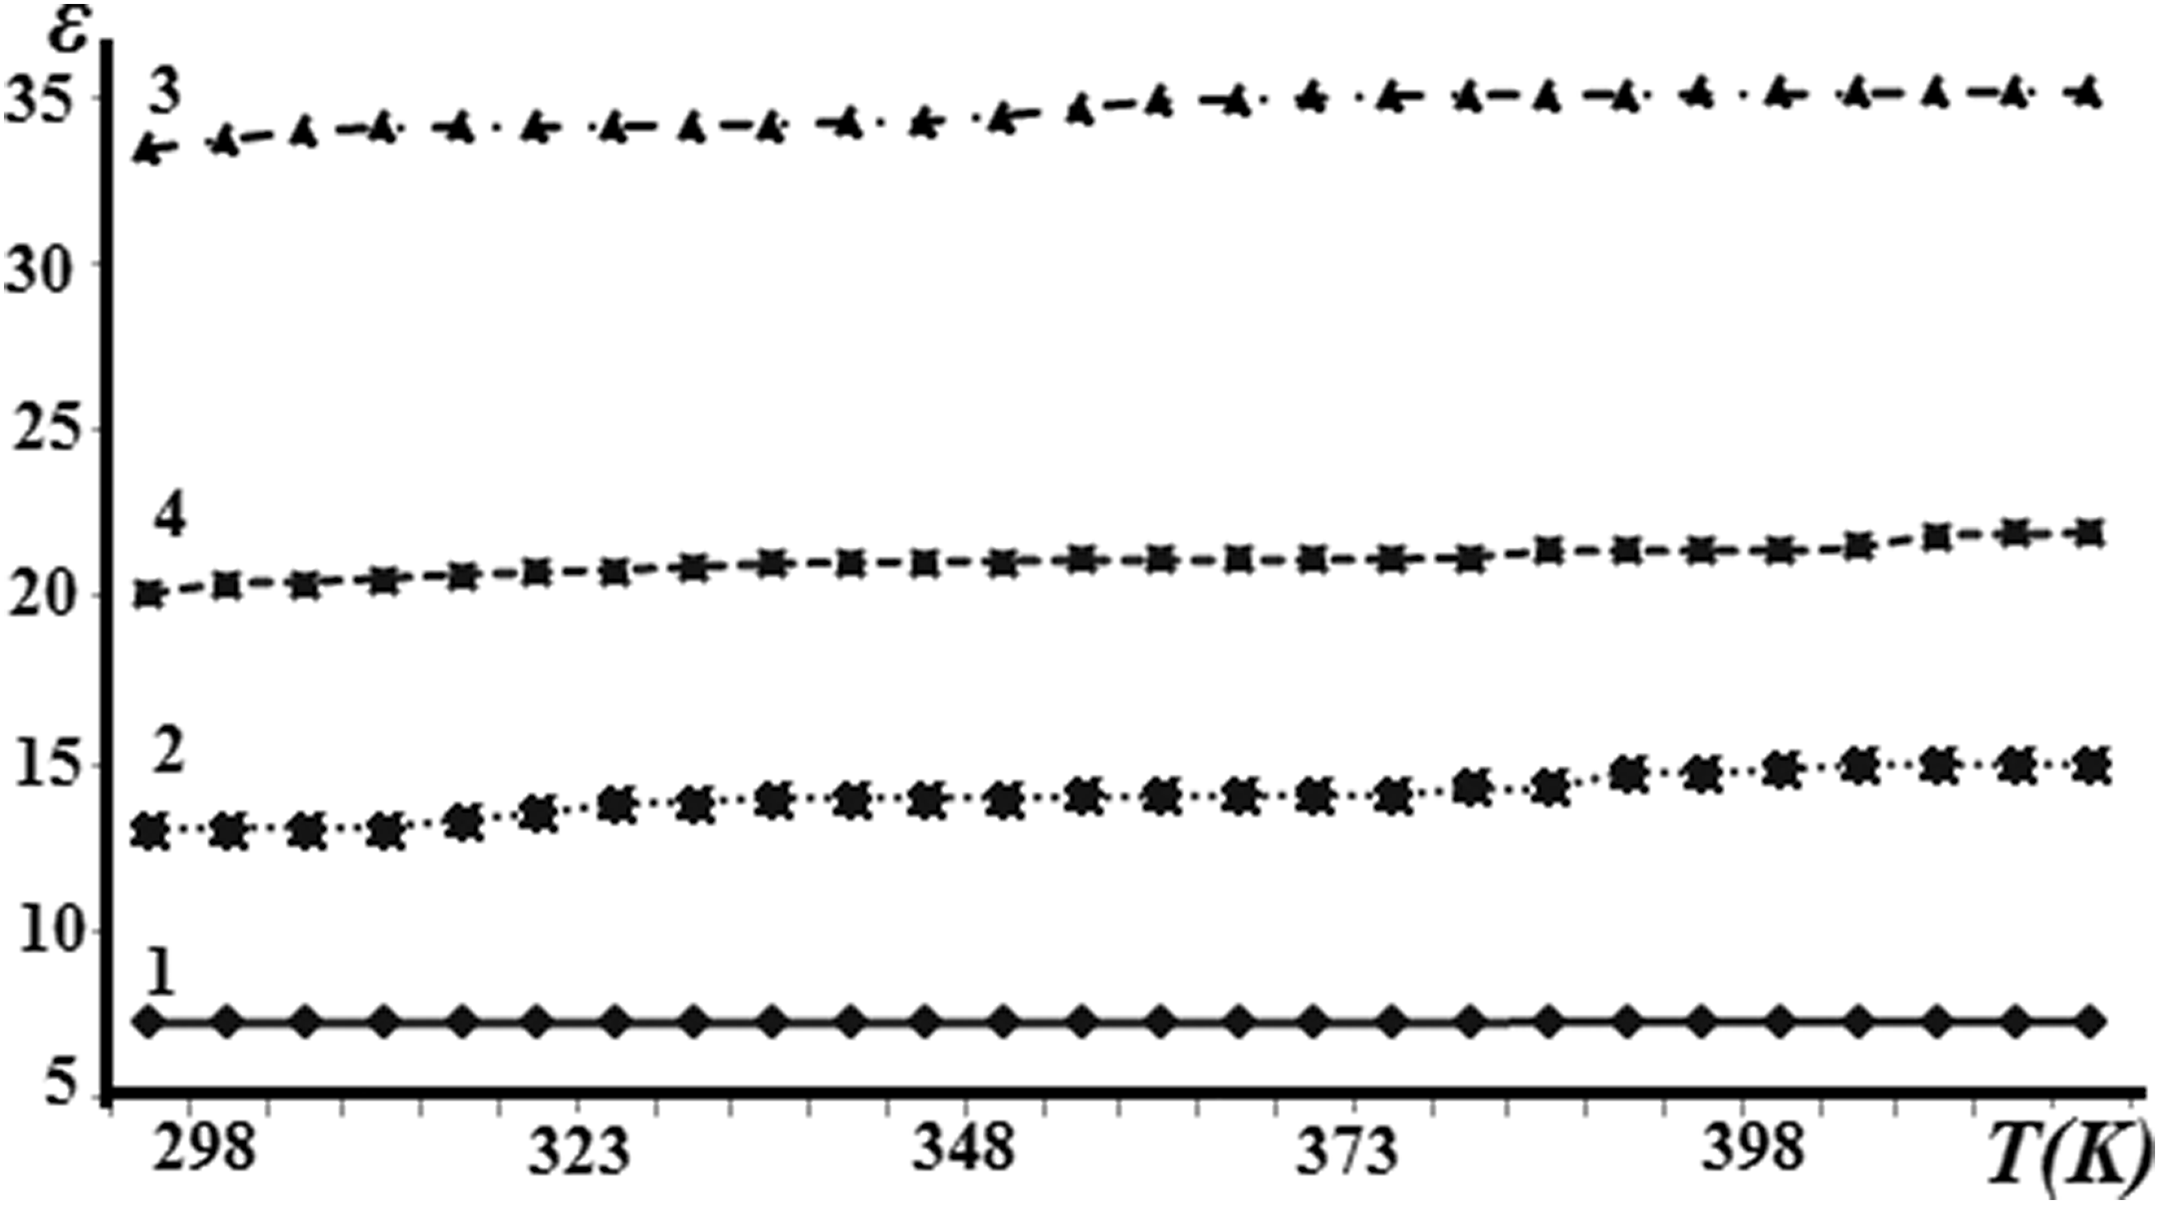
Dependence of dielectric permittivity of composites PVDF + Fe3O4 on temperature: (1) pure PVDF, (2) PVDF + 3 wt% Fe3O4, (3) PVDF + 7 wt% Fe3O4, and (4) PVDF + 10 wt% Fe3O4.
Furthermore, the filler concentration dependence of the experimental and theoretical dielectric permittivity values of the PVDF + Fe3O4 nanocomposite is demonstrated in Figure 9. The dielectric permittivity is a measure of the ability of a material to be polarized by an electric field. It can be seen from Figure 9(a) that the dielectric permittivity of the PVDF + Fe3O4 nanocomposite was gradually increased up to 7 wt% Fe3O4 content. Further increase in the filler concentration leads to decrease in the dielectric permittivity. At low contents, Fe3O4 nanoparticles play an essential role in the adjusting of the structure. Nanoparticles create a relatively ordered structure in nanocomposite as a center of the formation. 4 According to the Maxwell–Wagner effect, charges can be accumulated at the interface between two dielectric materials with different relaxation times when current flows across the interface. Therefore, it is supposed that the high dielectric permittivity of nanocomposites at 7 wt% Fe3O4 content is associated with the charge accumulation at interfacial PVDF layers wrapping individual Fe3O4 in the vicinity of electrical percolation threshold. 11 The subsequent decrease in dielectric permittivity at higher Fe3O4 content can be explained by the increase in defects in the structure of the nanocomposite.
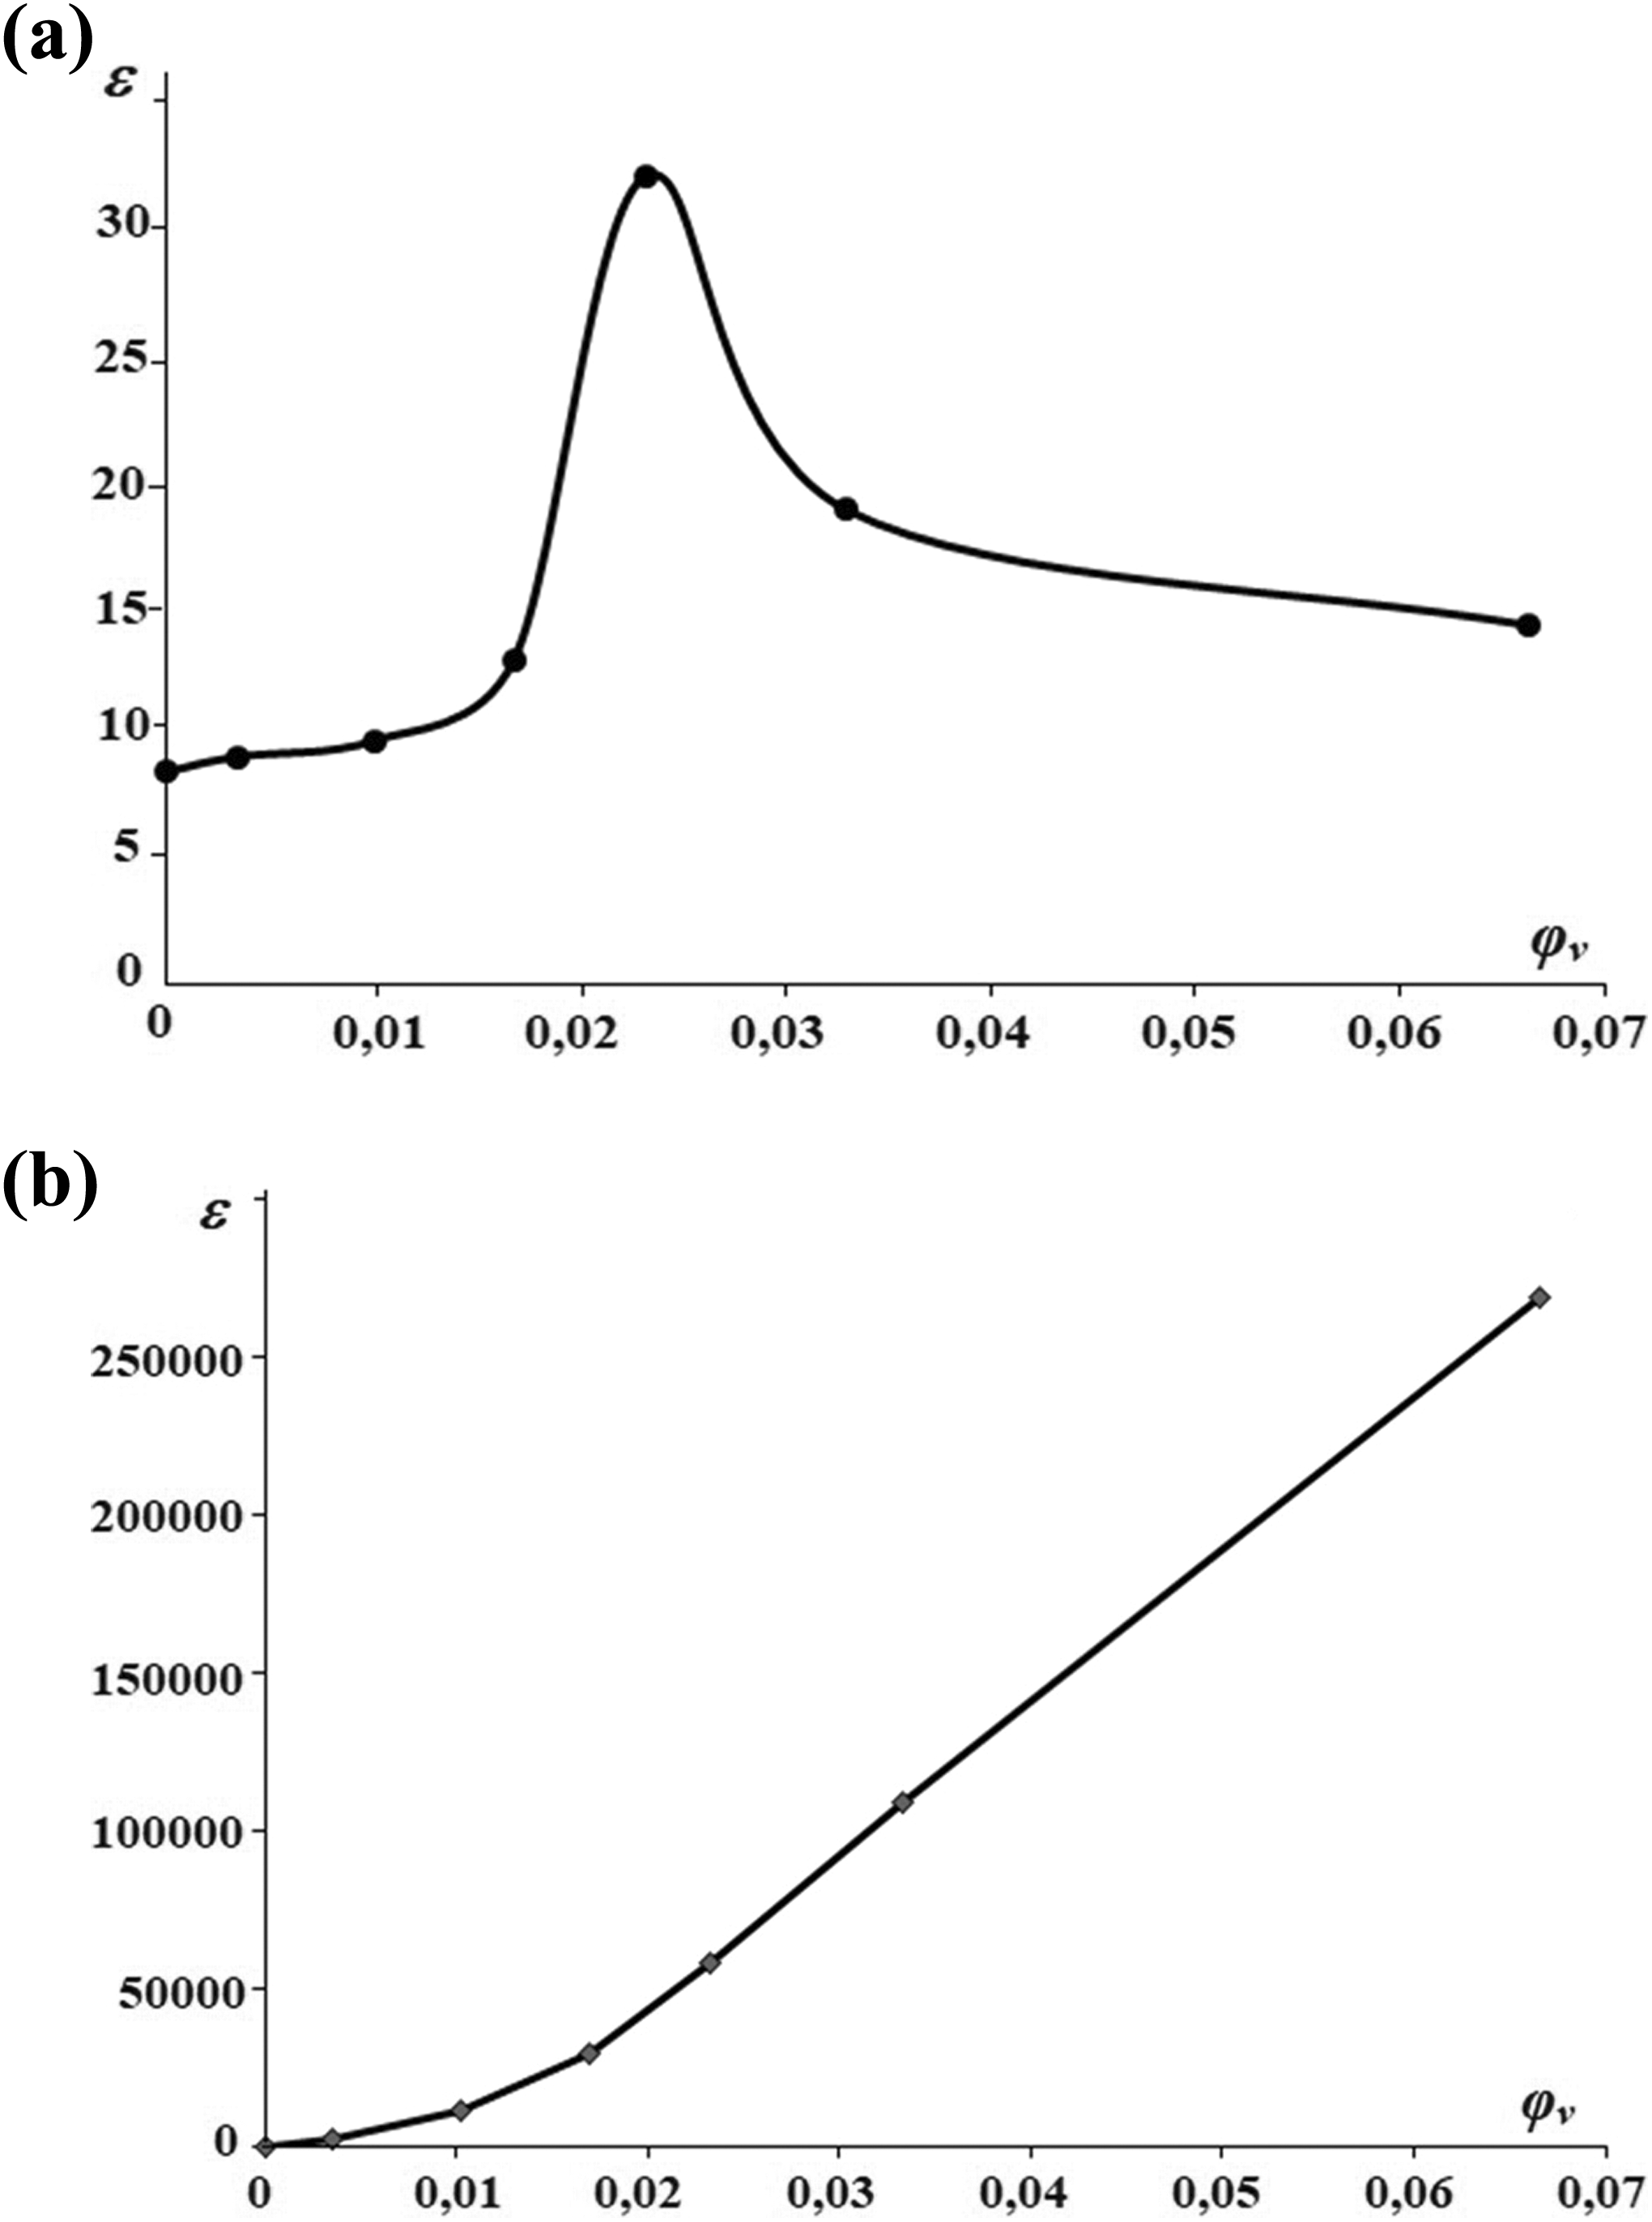
Dependence of permittivity of the PVDF + Fe3O4 nanocomposite on concentration: (a) experimental and (b) theoretical.
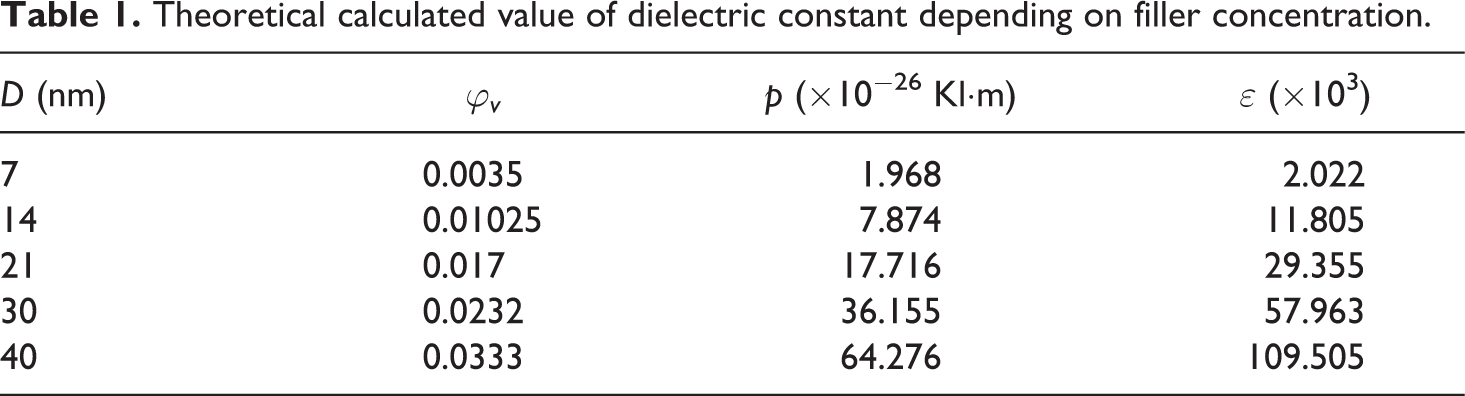
The concentration dependence of the theoretical value of the dielectric permittivity of the nanocomposite is given in Figure 9(b). A phenomenological formula 12 has been proposed to describe the dielectric permittivity at the low volume content of the Fe3O4 nanoparticles in the polymer matrix
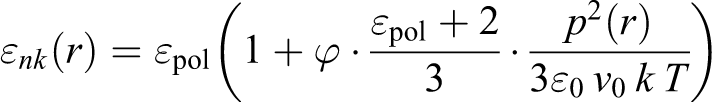
where p is the maximum value of dipole momentum, v
0 is the free volume around nanoparticles
Theoretical calculated value of dielectric constant depending on filler concentration.
Conversion from mass concentration (ϕ ms) to volume concentration (ϕv ) was carried out as below
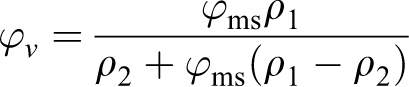
where ρ 1 and ρ 2 are the densities of polymer (PVDF-ρ 1 = 1.78 q/sm3) and filler (Fe3O4-ρ 2 = 5.24 q/sm3), respectively. The starting point has coordinates (0; 8,4) and shown in Figure 8(b).
Comparison of the results of theoretical calculations with experimental measurements show that the reduction in the empirical value of dielectric permittivity of the nanocomposite is obviously linked with the threshold value of the filler. 13 While calculating the theoretical value of the dielectric permittivity for the higher content of the filler, defects in the nanocomposite structure should be taken into consideration. That is why the theoretical and empirical values of the dielectric permittivity as a function of concentration vary in different ways as mentioned above.
Conclusion
In the present study, the effect of Fe3O4 nanoparticles on the structural and dielectric properties of PVDF matrix has been investigated. The SEM analysis demonstrated that at low content of the filler, the size of the Fe3O4 nanoparticles in the matrix is 13–21 nm. The structure of the nanocomposite has been investigated by XRD and IR spectroscopy. The introduction of Fe3O4 nanoparticles into the polymer matrix changed the supramolecular structure of the polymer. Also, the incorporation of Fe3O4 nanoparticles in the PVDF matrix leads to a slight increase in dielectric permittivity of the nanocomposite up to 7 wt% of the Fe3O4 content. Further increase in the filler concentration leads to decrease in the dielectric permittivity. The subsequent decrease in dielectric permittivity at higher Fe3O4 content can be explained by the increase in defects in the structure of the nanocomposite. Comparison of the experimental data and theoretical calculations’ result show that the reduction in the empirical value of dielectric permittivity of the nanocomposite is obviously linked with the threshold value of the filler. While calculating the theoretical value of the dielectric permittivity for the higher content of the filler, defects in the nanocomposite structure should be taken into account.