
Abstract
In this study, polypropylene-based nano and hybrid composites are prepared with 20 wt% glass fiber and multiwalled carbon nanotubes (MWCNTs) ranging up to 5 wt%. The multiaxial stress fields developed during external loading of composites cause crack propagation by various fracture mechanisms. Among the nanocomposites, it is observed that the critical stress intensity factor (KI) is highest for the one prepared at 3 wt% loading of MWCNTs. The synergistic effect of multiscale fillers in hybrid composite with MWCNT content of 3 wt% results in superior fracture toughness properties as evidenced by 16.6% increase in KI with respect to neat PP. Analytical expressions that take into account the fracture mechanisms like particle debonding and matrix yielding are employed to estimate the composite crack resistance and then compared with experimentally obtained fracture toughness properties. The fracture toughness properties are found to be dependent on composition of fillers, matrix yield strain, and debonding strain of the composites.
Introduction
The fracture toughness properties of particulate-filled thermoplastic composites have been studied extensively due to its technical importance and wide applicability. 1 –5 Fracture behavior of the polymer is greatly affected with the addition of rigid fillers. Under the effect of an external load, stress concentrations are induced, which influences deformation and fracture behavior as well as the overall performance of the composites. 1 Many studies 2–3 reported that the incorporation of rigid fillers in ductile thermoplastics led to decrease in fracture toughness properties, and another report 4 shows an increment in fracture properties with filler content. Ramsaroop et al. 5 evaluated the critical stress intensity factor (KI) and strain energy release rate (G c) of PP/nanoclay composites. The improved fracture toughness properties were reported for intercalated nanoclay composites at nanoclay content of 5 wt%. It has been reported that KI and G c values increased with the incorporation of rigid microfiller like glass fiber in PP matrix. 6,7 Another study demonstrates the improvement in fracture toughness of polypropylene with the incorporation of graphite nanoplatelets. 8
The synergistic effect of short carbon fiber and short glass fiber in PP matrix contributes to higher fracture toughness for PP/carbon fiber/glass fiber hybrid composites in comparison with PP/carbon fiber and PP/glass fiber composites. 9 Hence, the combined effect of fillers has a prominent role on fracture properties of the composites. The simultaneous incorporation of micro and nanofiller in PP matrix could elevate the overall properties of PP by exploiting the potential features of the fillers. Karsli et al. 10 reported the hybrid reinforcing ability of PP/glass fiber/carbon nanotube (CNT) composites while describing the morphology and tensile properties. They reported that the simultaneous incorporation of glass fiber and nanofiller improved the tensile strength and Young’s modulus reasonably than the individual micro and nanofiller. Furthermore, they commented on the synergistic effect of glass fiber and CNT on fracture toughness properties. Many fracture mechanisms like particle debonding, matrix yielding, and plastic void growth are reported in the literature during crack propagation in composites. 9 –11
In a recent study, 11 plastic void growth was attributed as one of the dominant mechanism enabling energy absorption of the composites. Another study explained that fracture toughness at low nanofiller content is significantly increased due to pronounced plastic yielding caused by nanovoids, which is a highly dissipative mechanism. 12 The features like particle debonding, voiding, and yielding of polymer are important dissipation mechanisms that depend on the size of the fillers too. 13,14 With the inclusion of boehmite alumina nanoparticles in linear low-density polyethylene, development of large plastic deformation zone around crack tip was reported. 15 Another report presented the various models predicting the dependency of fracture properties on composition of heterogeneous polymer systems. The proposed model in that study validated plastic deformation as the major energy absorbing process. 4 Additionally, an analytical equation was used to estimate composite crack resistance for glass-sphere-filled polyethylene composites taking into account particle volume fraction of the composite, elastic properties of the components, and the local particle fraction. The composite crack resistance increases with increasing particle content and then reaches a plateau, and for higher values, it decreases. Such response was also reported in other composite systems. 4,16,17
This study investigates the microstructure development of polypropylene, glass fiber, and CNT hybrid composites. The effect of incorporation of fillers on the tensile properties is being evaluated. A detailed analysis of the fracture toughness behavior of nano, micro, and hybrid PP composites is performed. Experimentally obtained fracture toughness properties are compared with properties obtained via analytical models which form the novel part of the work.
Experiment
Materials and specimen preparation
The base matrix used for composite preparation was polypropylene of grade (Repol, H200MA, Reliance, Mumbai, India) in the form of beads with a melt flow index of 20 gm/10 min and melting temperature of 167.7°C. Carboxyl-treated multiwalled CNTs (MWCNTs; United Nanotech Innovations Pvt. Ltd, Karnataka, India) of specific surface area 210 m2/g, average length 10–20 µm, outer diameter 20–30 nm, and nanotube purity > 97% were used as nanofillers. Cylindrical glass fibers of length 3 mm and diameter 10 μm were used as microfillers. A masterbatch of MWCNT in PP was prepared using a kneading machine. PP was melt compounded with master batches and glass fibers in a counter rotating twin-screw extruder (screw diameter: 25 mm and L/D ratio: 30:1).
The feed to die zone temperatures across the barrel of the extruder were 150, 170, 190, 200, and 210°C, respectively, and a screw speed of 100 r/min was set for all runs. The composites were designated as PP, PPC1, PPC3, PPC5, PPG, PPGC0.5, PPGC1, PPGC2, PPGC3, and PPGC5 with respect to their compositions as mentioned in Table 1. The pelletized composites were then injection molded in a Ferromatik Milacron-Sigma 50T (Gujarat, India) injection molding machine to form dumbbell-shaped test specimens. The processing temperature was set between 180°C and 210°C, and the mold temperature was maintained at 50°C.
Nomenclature of PP, micro, nano, and hybrid composites.
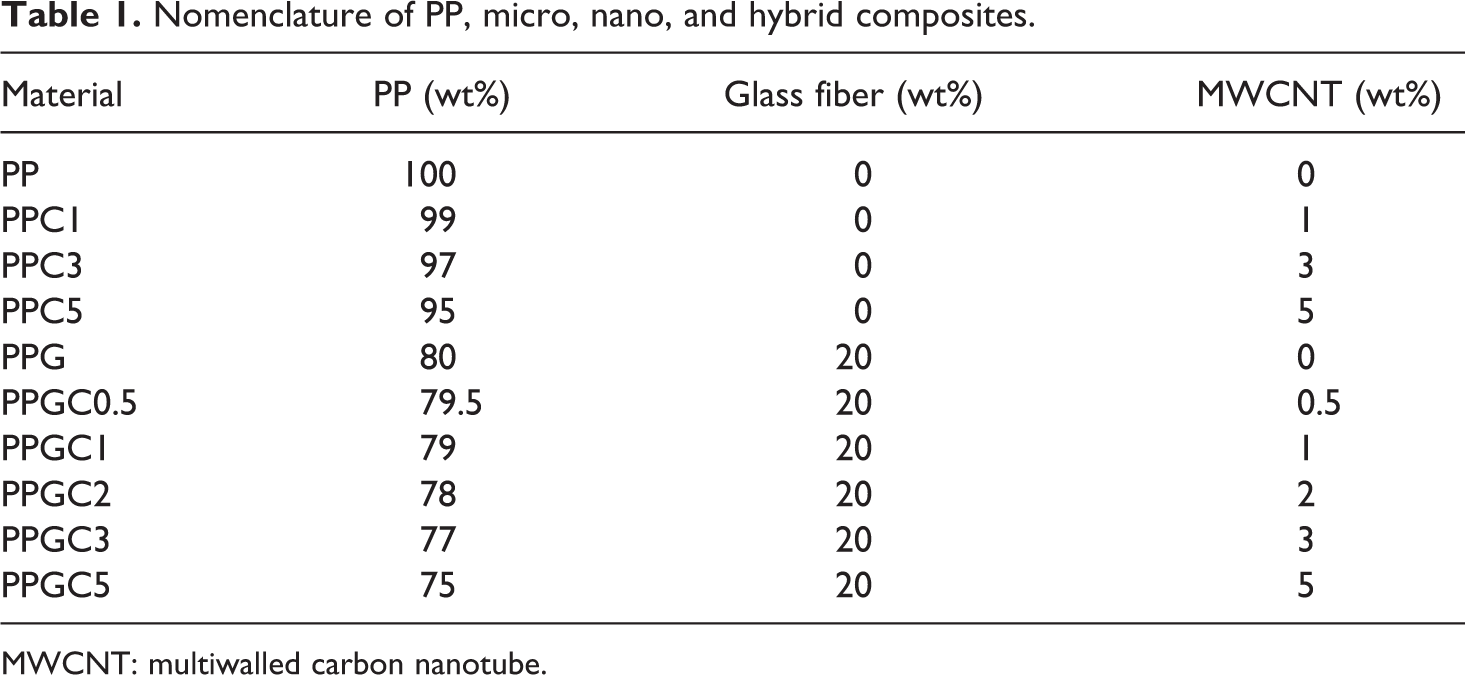
MWCNT: multiwalled carbon nanotube.
Characterization methods
The morphological structure and dispersion of CNTs in PP was characterized by JEOL/JEM 2100 (Japan) transmission electron microscopy (TEM) with an acceleration voltage of 200 kV. Ultrathin slices of injection-molded nanocomposites were placed on heated copper grid for analysis. The surface morphology of the composites was analyzed using JEOL JSM-6490LASEM (Japan). The sample surfaces were first treated with hot xylene and then well polished. The specimens were cleaned and sputtered with gold–palladium of thickness less than 3 nm. At a constant crosshead speed of 50 mm/min, using universal tensile testing machine, tensile tests were performed. The tensile properties of PP, nano, and microcomposites were measured at room temperature according to ASTM D638 using injection molded dumbbell-shaped samples. The hardness of the samples was estimated using a shore D hardness tester. The fracture toughness studies were performed using universal testing machine UT40 equipped with a load of 20 kN at a crosshead speed of 1 mm/min. Single-edge notch bending (SENB) test was employed as per ASTM D5045 test standard. The average values of five specimens of each composites were reported. The fractured surfaces were then analyzed using JEOL JSM-6490LA scanning electron microscope (SEM).
Results and discussion
Microstructure development
Transmission and scanning electron microscopy
The transmission electron micrographs of PP nanocomposites that are shown in Figure 1 reveal the relative dispersion of MWCNTs in PP matrix. It is seen that as the nanofiller percentage increased from 1 wt% to 3 wt%, PPC3 nanocomposite exhibits homogeneous dispersion of nanotubes, covering larger area in the PP matrix when compared to Figure 1(a) and (b). TEM micrographs of PPC3 seen in Figure 1(c) clearly indicate that nanotubes are dispersed uniformly in the matrix, and an individual closed-tip MWCNT possessing high aspect ratio is vivid in Figure 1(d). It is also noticed from Figure 1(e) and (f) that the MWCNTs are distributed randomly and form complex entangled interconnected assembly of tubes in the matrix. 18 Figure 1(e) shows reduced degree of dispersion of CNTs in PP, and at certain locations, clusters are visible. Figure 1(f) represents intense agglomeration of nanotubes and the applied shear of mixing may not be sufficient to fragment them. 19 –21 In our earlier work, the agglomerates of nanosilica were also noted around microscale glass fiber. 22
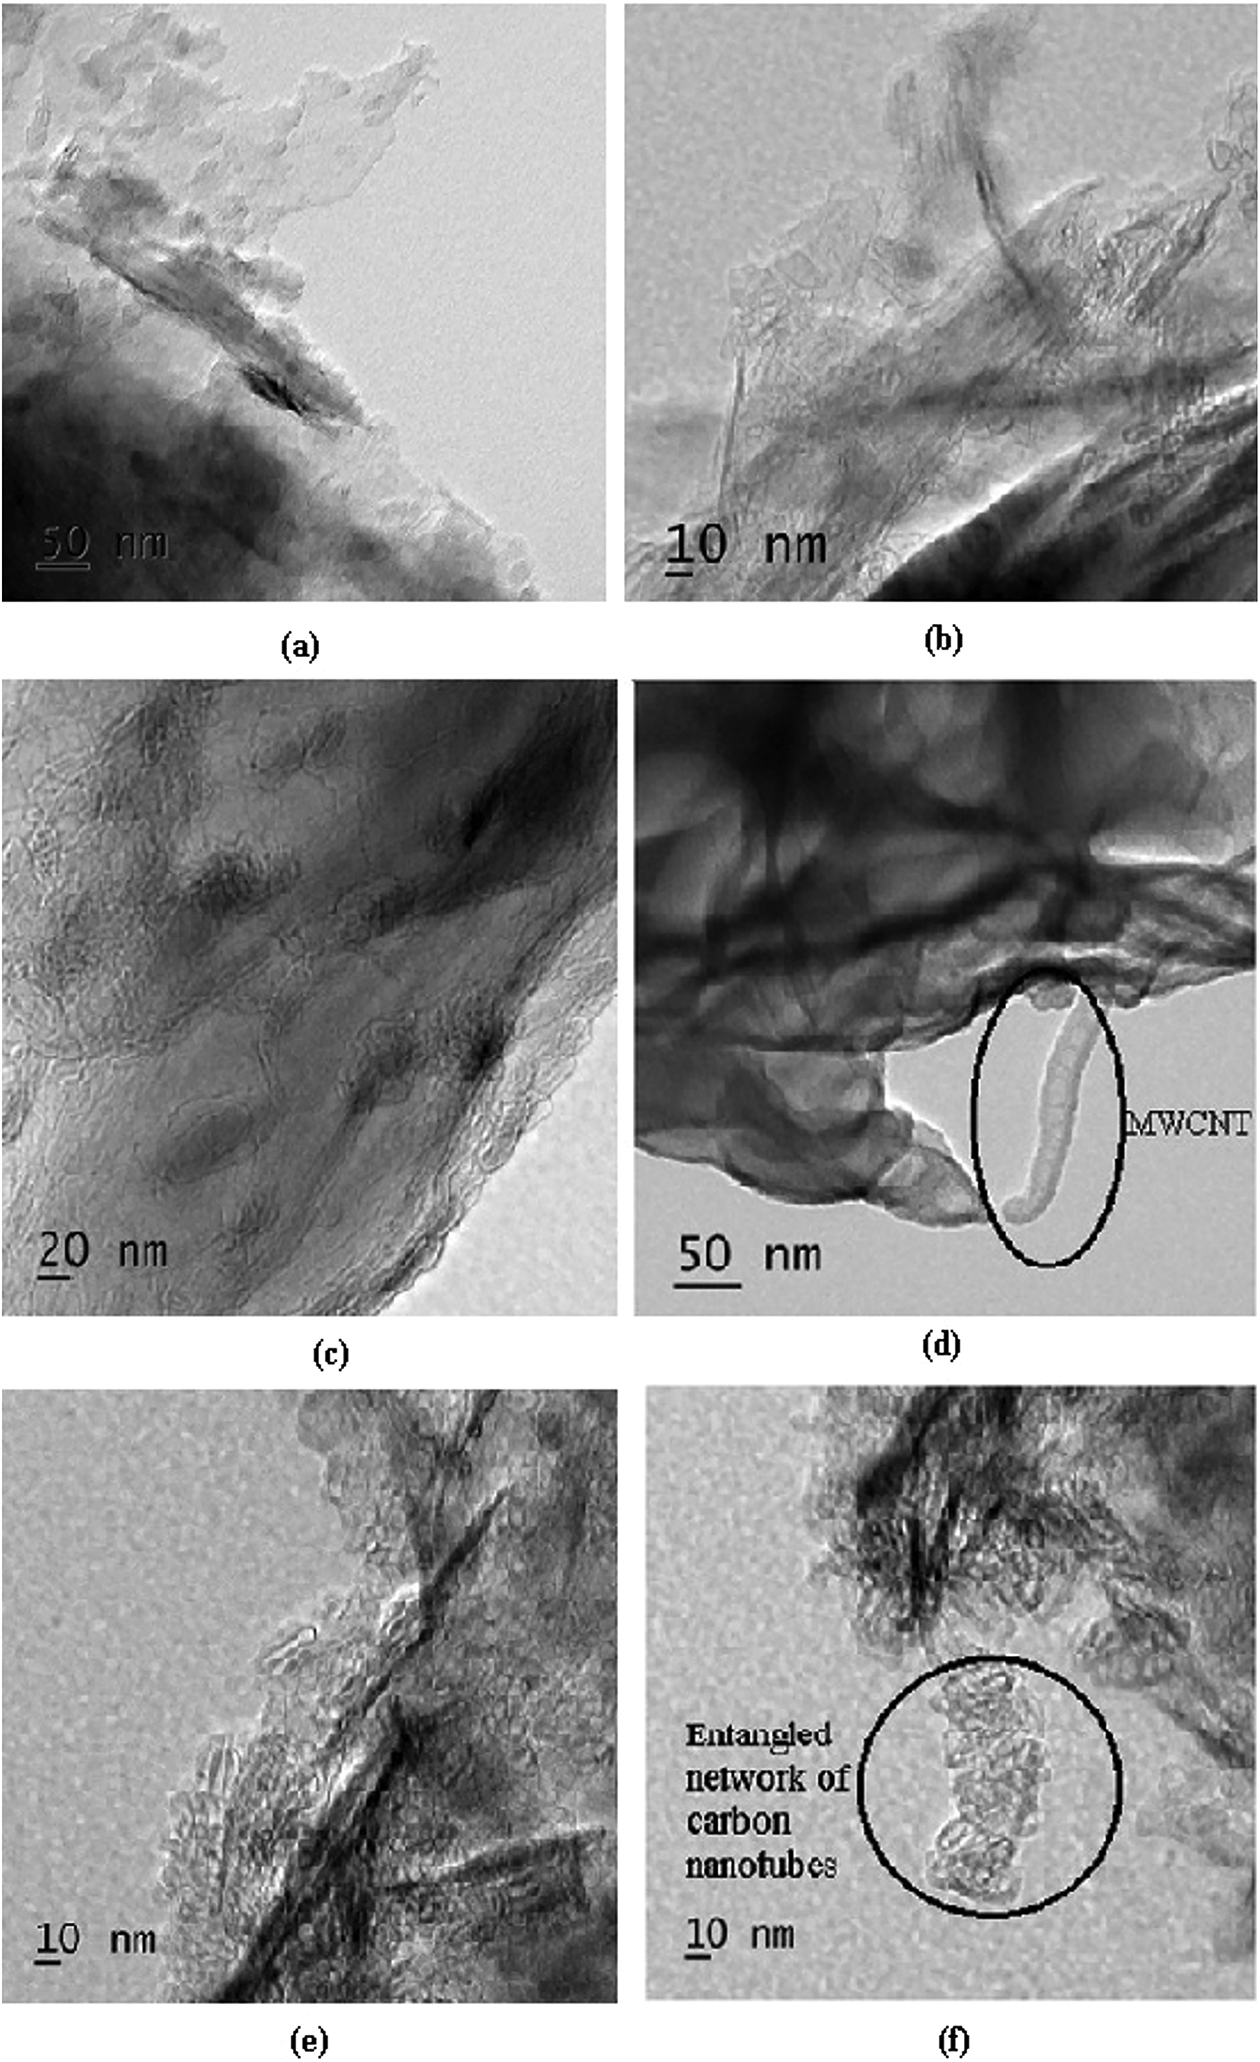
(a) and (b) TEM images of PPC1 nanocomposite, (c) and (d) TEM images of PPC3 nanocomposite, (e) and (f) TEM images of PPC5 nanocomposites. TEM: transmission electron microscopy.
It is clearly visible from SEM micrographs of PPC3 (Figure 2(a) and (b)) that nanotubes are reasonably dispersed in the base matrix that conforms to the corresponding TEM images also. The SEM image of hybrid composite (PPGC3) is depicted in Figure 2(c) and suggests the homogeneous dispersion of glass fibers in PP matrix, and Figure 2(d) represents the zoomed-in view of image of an individual glass fiber embedded in PP matrix. Also one could observe the minor agglomeration of CNTs on the surface of glass fiber as indicated.
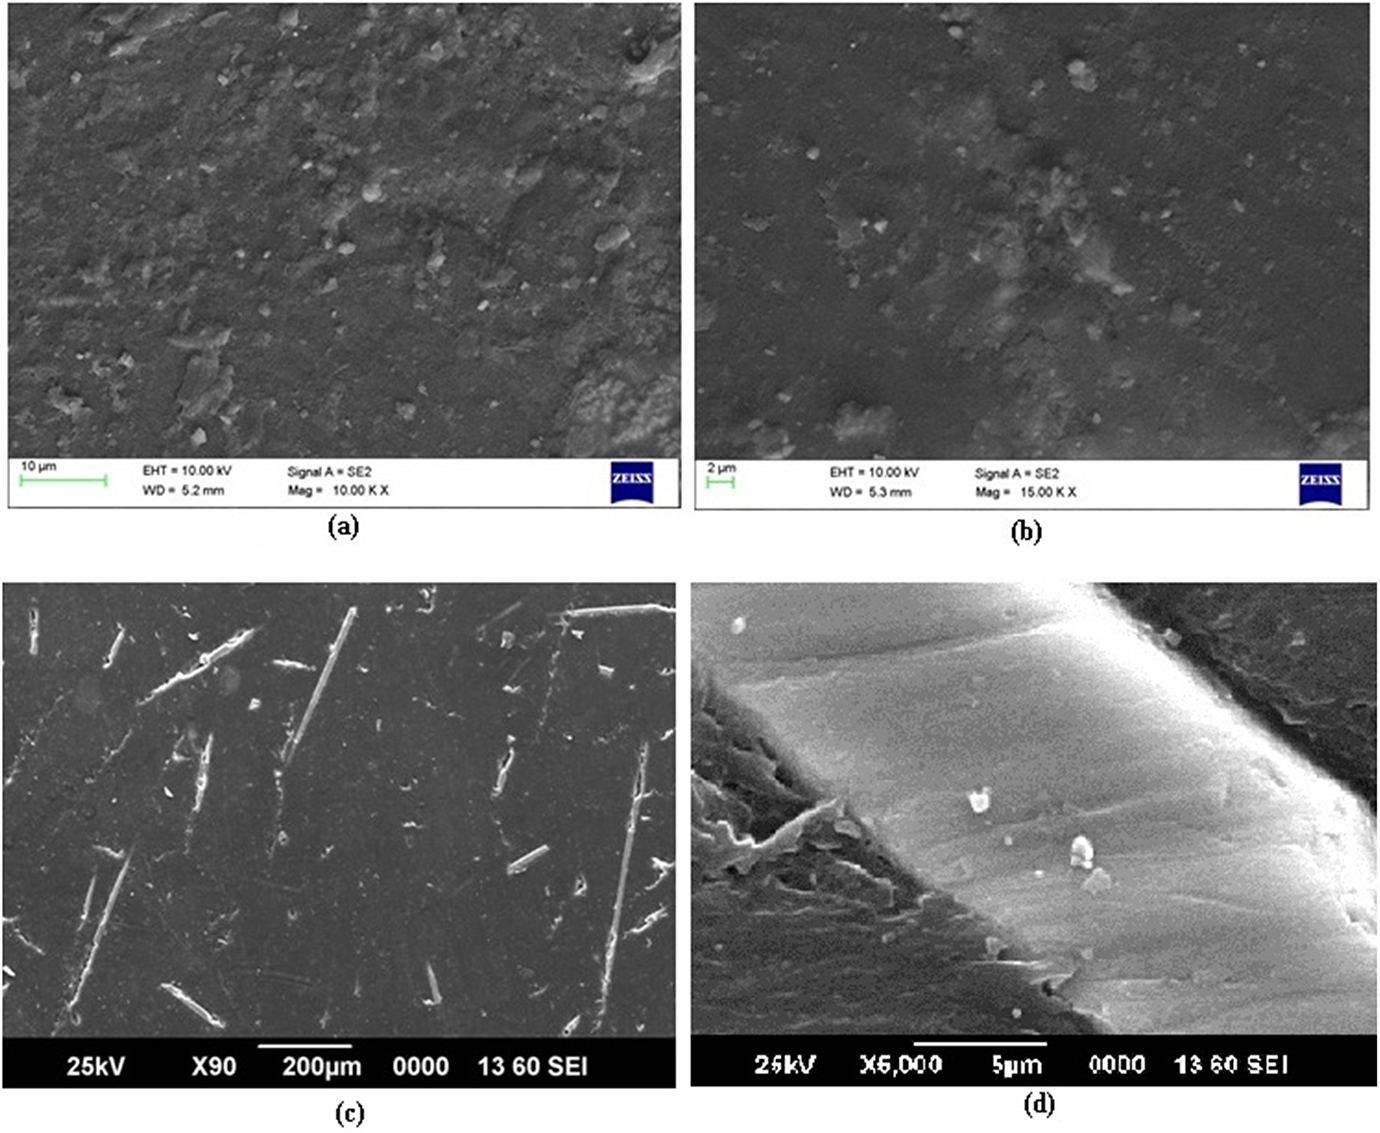
(a) and (b) SEM micrographs of PP containing 3 wt% of MWCNTs at different magnifications, (c) SEM micrograph that shows dispersion of glass fiber in matrix, and (d) zoomed-in view of image of an individual glass fiber in PP. SEM: scanning electron microscopy; MWCNT: multiwalled carbon nanotube.
Mechanical properties
The mechanical properties of neat PP, nano, micro, and hybrid CNT composites are reported in Table 2 and their tensile stress–strain plots are demonstrated in Figure 3. It is noticed that neat PP presented a tensile strength of 29 MPa and strain percentage at failure is around 20%. With the addition of nanofiller in PP matrix of varying compositions from 1 wt% to 5 wt%, it is noticed that strain percentage at break of the nanocomposite reduced from 16.2 to 7.5. The reduction in strain percentage values of MWCNT nanocomposites indicates their relatively brittle characteristics when compared to PP. It has been widely agreed that rigid fillers in the form of micro 23 and nanoinclusions 19 reduce the elongation at break of polypropylene. However, tensile strength has increased from 29.2 MPa to 36 MPa, which shows a rise of 24% with regard to virgin PP and Young’s modulus increased by 44.3%. The effective dispersion of nanofiller in PP matrix, higher aspect ratio, and transcrystallization of PP around CNT contribute to the improvement in the mechanical properties.
Mechanical properties of PP, nano, micro, and hybrid CNT composites.
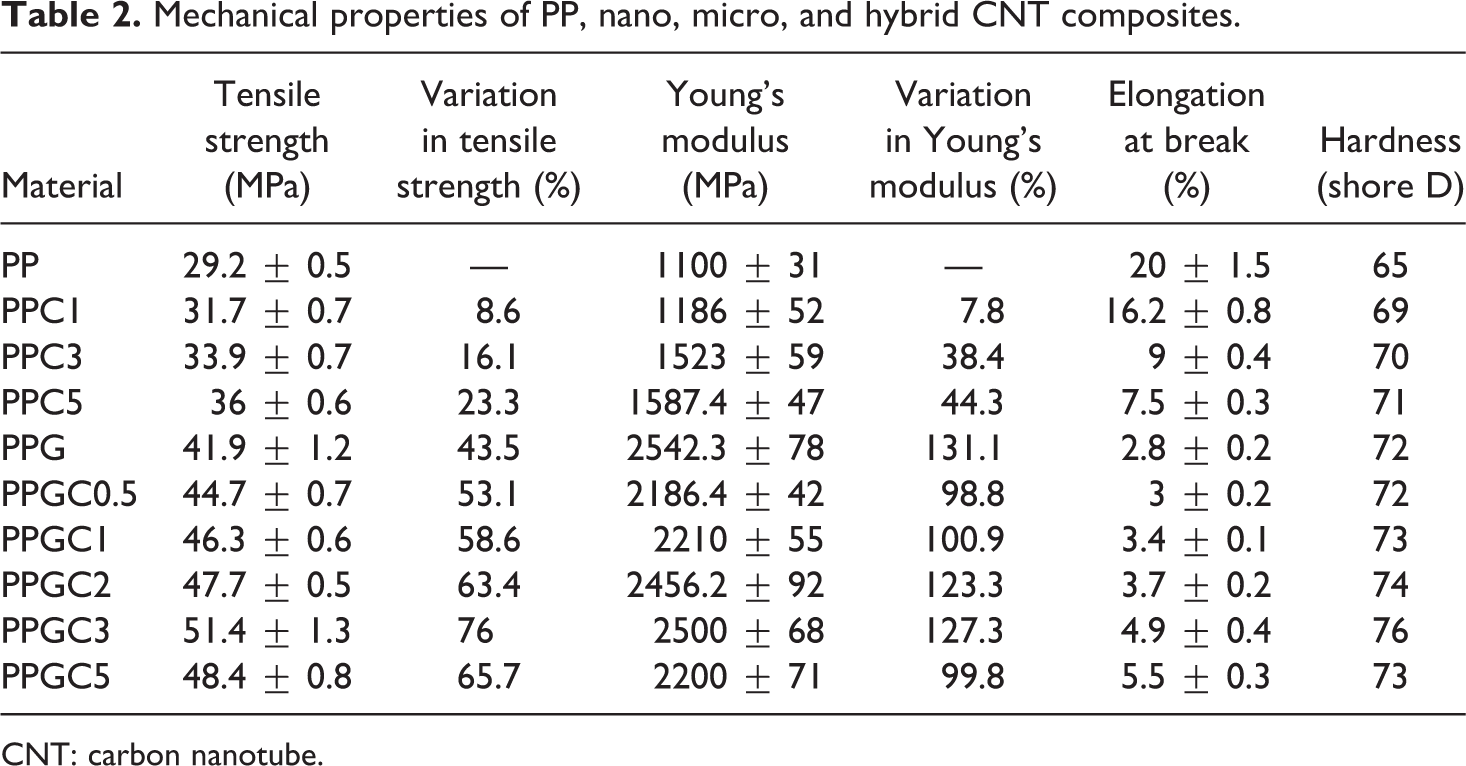
CNT: carbon nanotube.
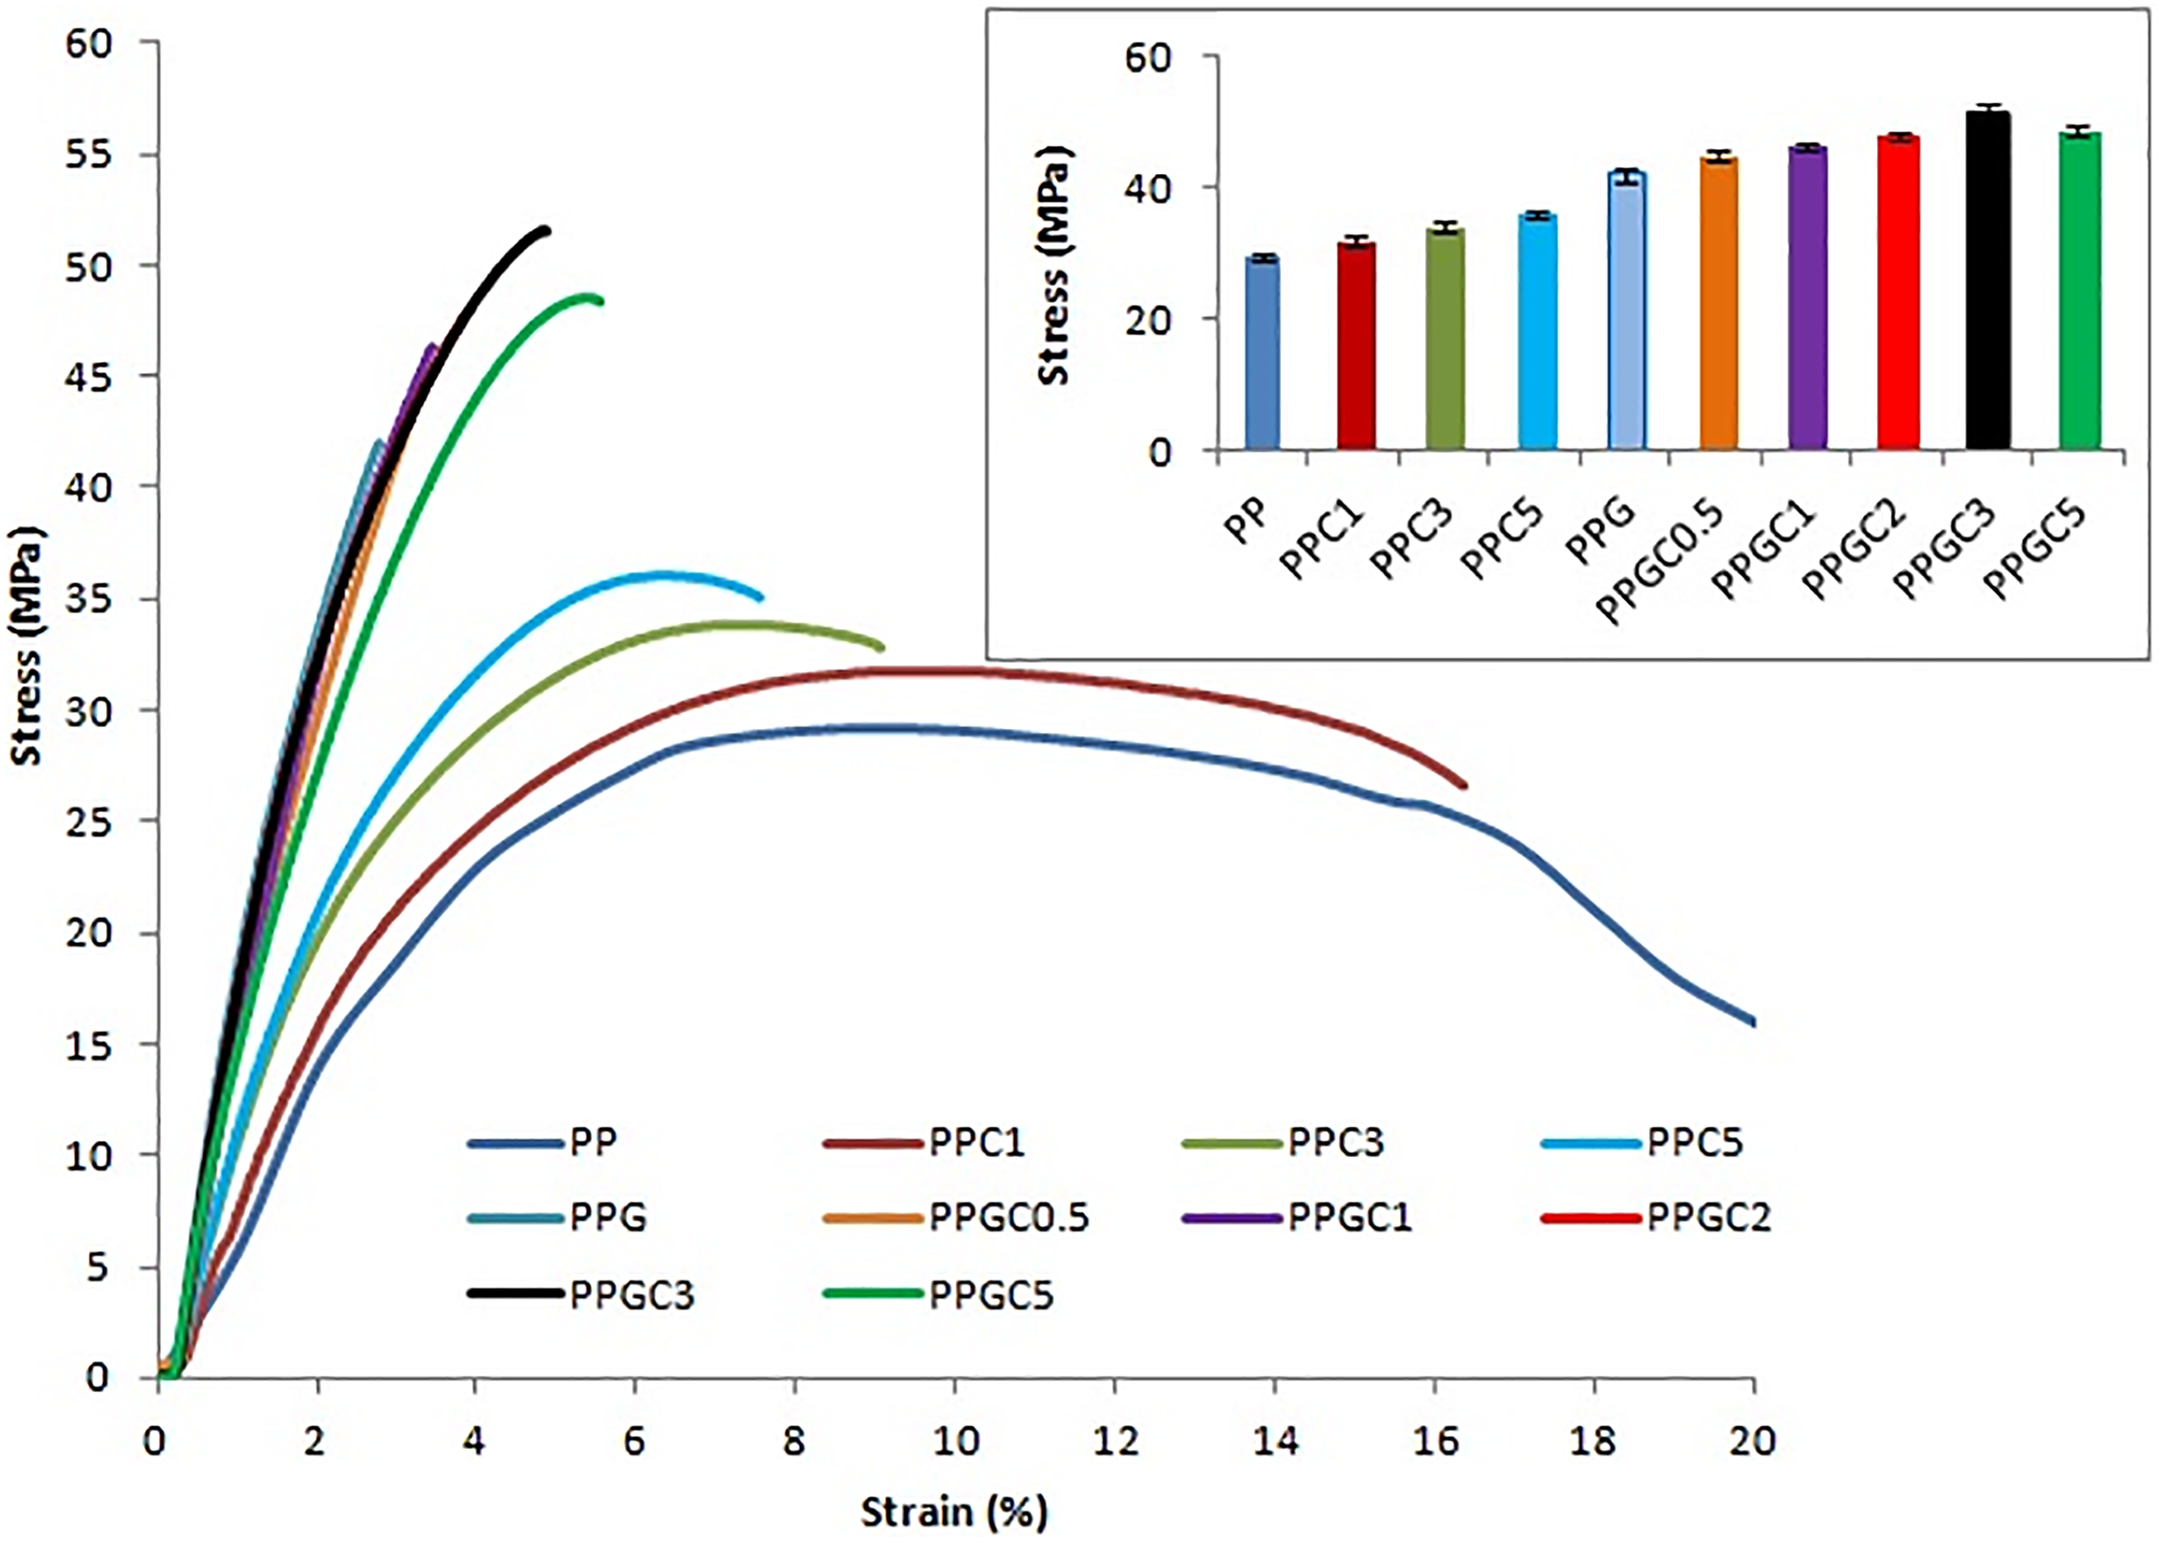
Stress–strain plot of PP, individual nano, micro, and hybrid composites.
The inclusion of 20 wt% glass fiber in PP matrix has raised the tensile strength from 29.2 MPa to 41.9 MPa and Young’s modulus from 1100 MPa to 2542 MPa. The Young’s modulus of PPG composite has increased almost twofold in comparison with neat PP. The low value of strain percentage at break indicates the brittle nature of PP/glass fiber microcomposite.
Even a low-level loading of nanofiller in the microcomposite has a significant effect on the tensile strength of the hybrid composite although a slight reduction in the stiffness is observed. But the brittle nature of the PPG composite is maintained since the glass fiber composition is high when compared to low weight fraction of CNT. As the composition of CNT increased from 0.5 wt% to 3 wt% in the hybrid composites, the tensile strength improved by 15.1%. The hybrid composites with CNTs varying from 1 wt% to 5 wt% indicated relatively ductile type of failure in comparison with PPG composite as evidenced from the improved elongation at break. This can be assigned to the plasticizing effect of CNTs beyond the yield point. The presence of MWCNTs in the PP matrix tends to create physical entanglement of PP chains with the nanofillers. The stretching of the polymer chains before breakage and anchoring on to the nanofillers is manifested as yield elongation or plastic deformation.
In the case of nanocomposites, the elongation at break is higher than that of hybrid ones. 24 The reason for this behavior is that, in PPC nanocomposites, the extremely flexible PP chains get intertwined with CNTs and the crack takes up a very difficult route to propagate. Consequently, PP chains could strain much in PPC composites which is manifested as increased elongation at break. In the case of PPGCs, the extent of entanglement of PP chains around glass fiber is less and the crack could easily propagate around microscale glass fiber and hence imparted brittle characteristics than PPCs.
It is found that shore D hardness of neat polypropylene is 65. The inclusion of 1 wt% of CNT in PP has improved the hardness of the composite by 4 units. The nanolevel reinforcements in polymer improved the yield stress as evident from tensile stress–strain plots, which is an indirect indication of the hardness of the material. As one knows, hardness manifests the resistance of the material to localized plastic deformation and the interfacial interactions may lead to a pinning/or anchoring effect that would have improved the hardness of the composite. 25 As evident from the stress–strain plots, one could infer that the nanocomposites with varying weight fraction from 1 to 5 have undergone rupture in the plastic deformation regime. This fact can be confirmed with elongation at break values of 16.2%, 9%, and 7.5% for PPC1, PPC3, and PPC5, respectively, which is far beyond their yield point.
But the inclusion of microfiller (glass fiber) in PP makes the composite more stiff and it breaks before manifesting the characteristic yield point. This shows that PP/glass fiber microcomposite resists plastic deformation, which is suggestive of higher hardness and indicative of its brittle nature. With the presence of nanofillers in polymer matrix, the rupture of hybrid composites is shifted from elastic to plastic regime (PPGC1, PPGC2, PPGC3, and PPGC5) as evident from their higher elongation at break.
Differential scanning calorimetry
The heating and cooling thermograms of neat PP and composites are presented in Figures 4 and 5, respectively. The thermal properties of PP phase in the composites like melting (T
m) temperature, peak crystallization (T
c) temperature, onset and end set temperatures of crystallization (T
o and T
e), under cooling temperature (melting and peak crystallization temperature difference,
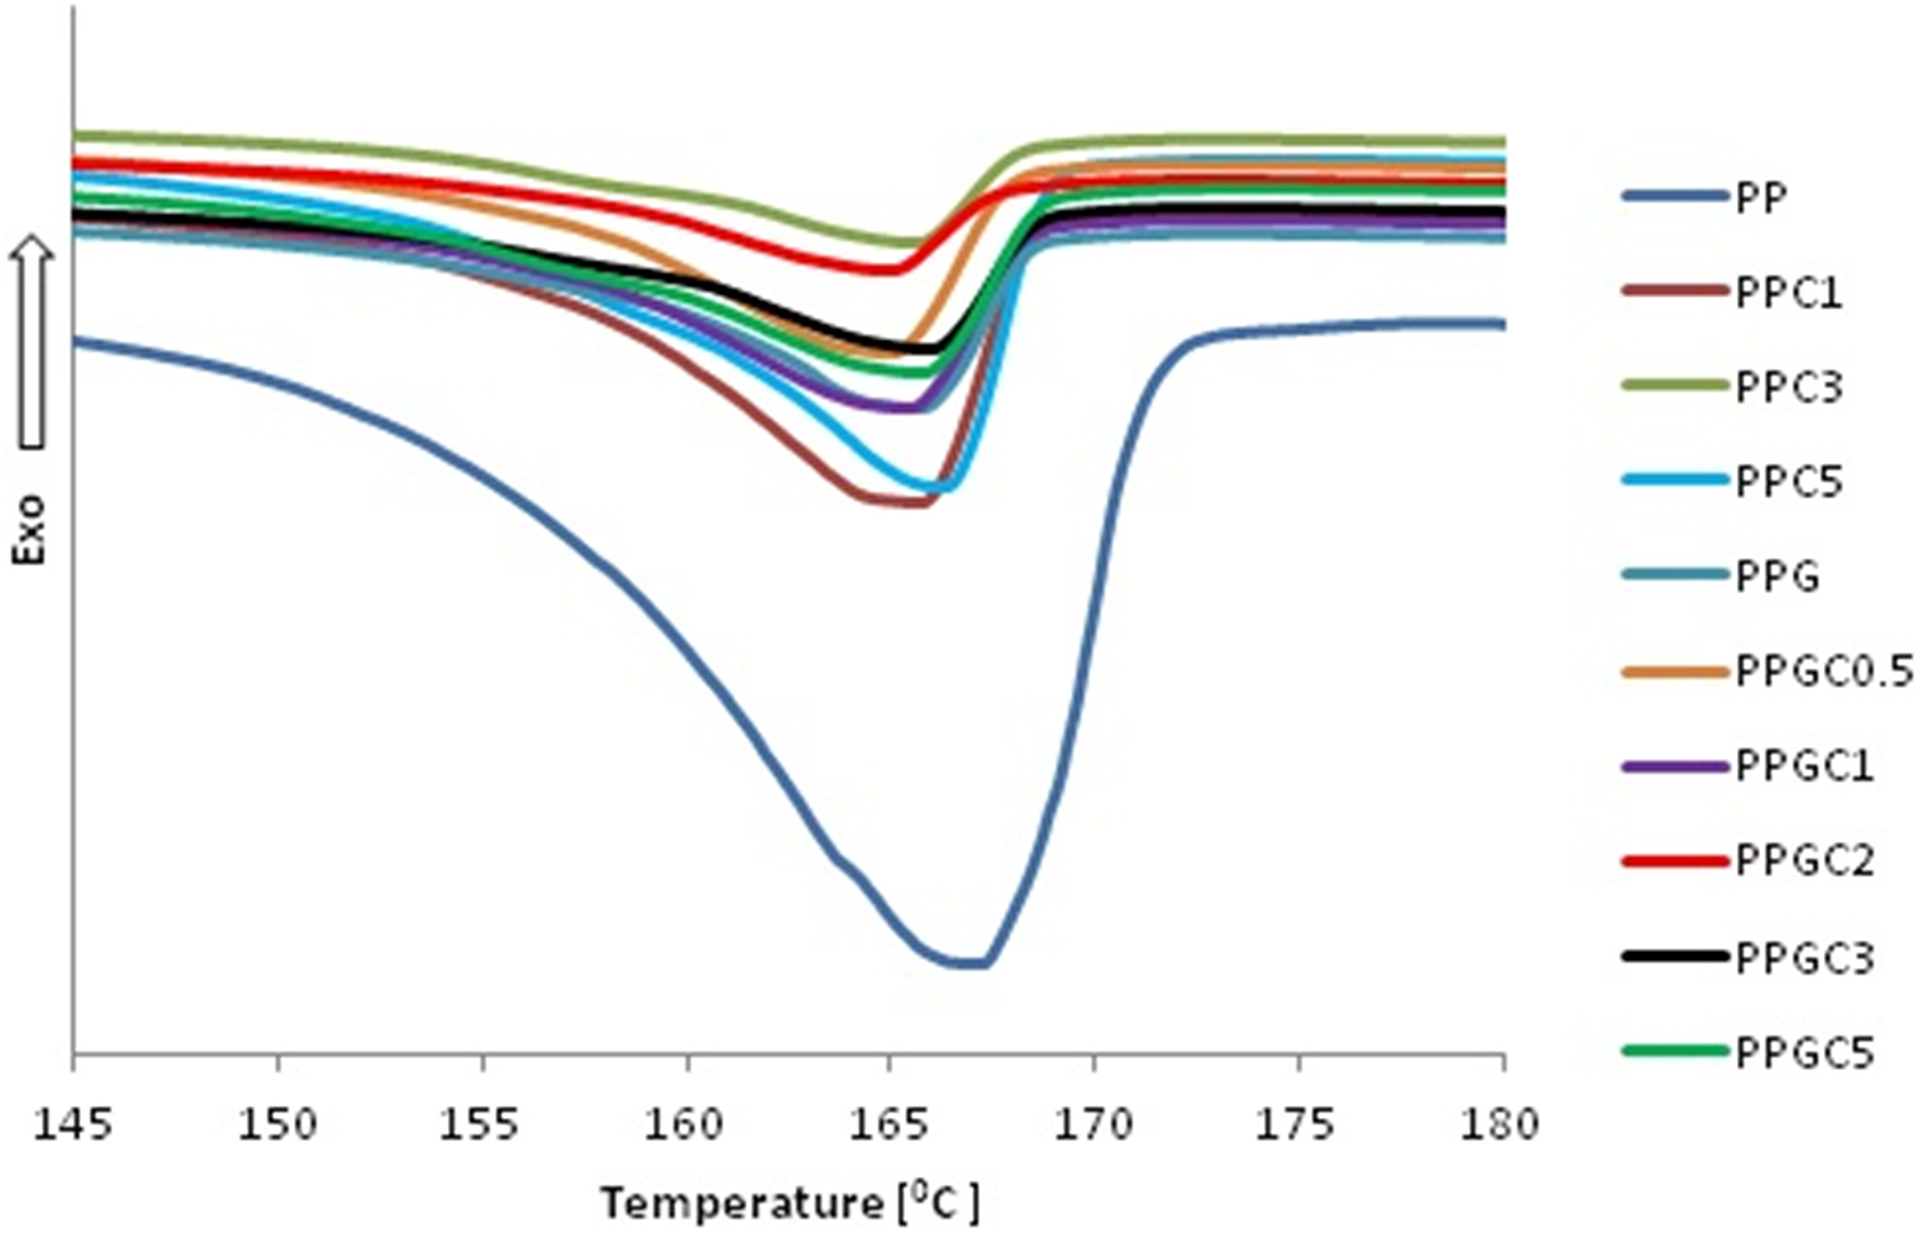
The melting thermograms of PP, nano, micro, and hybrid composites obtained from DSC analysis. DSC: differential scanning calorimetry.
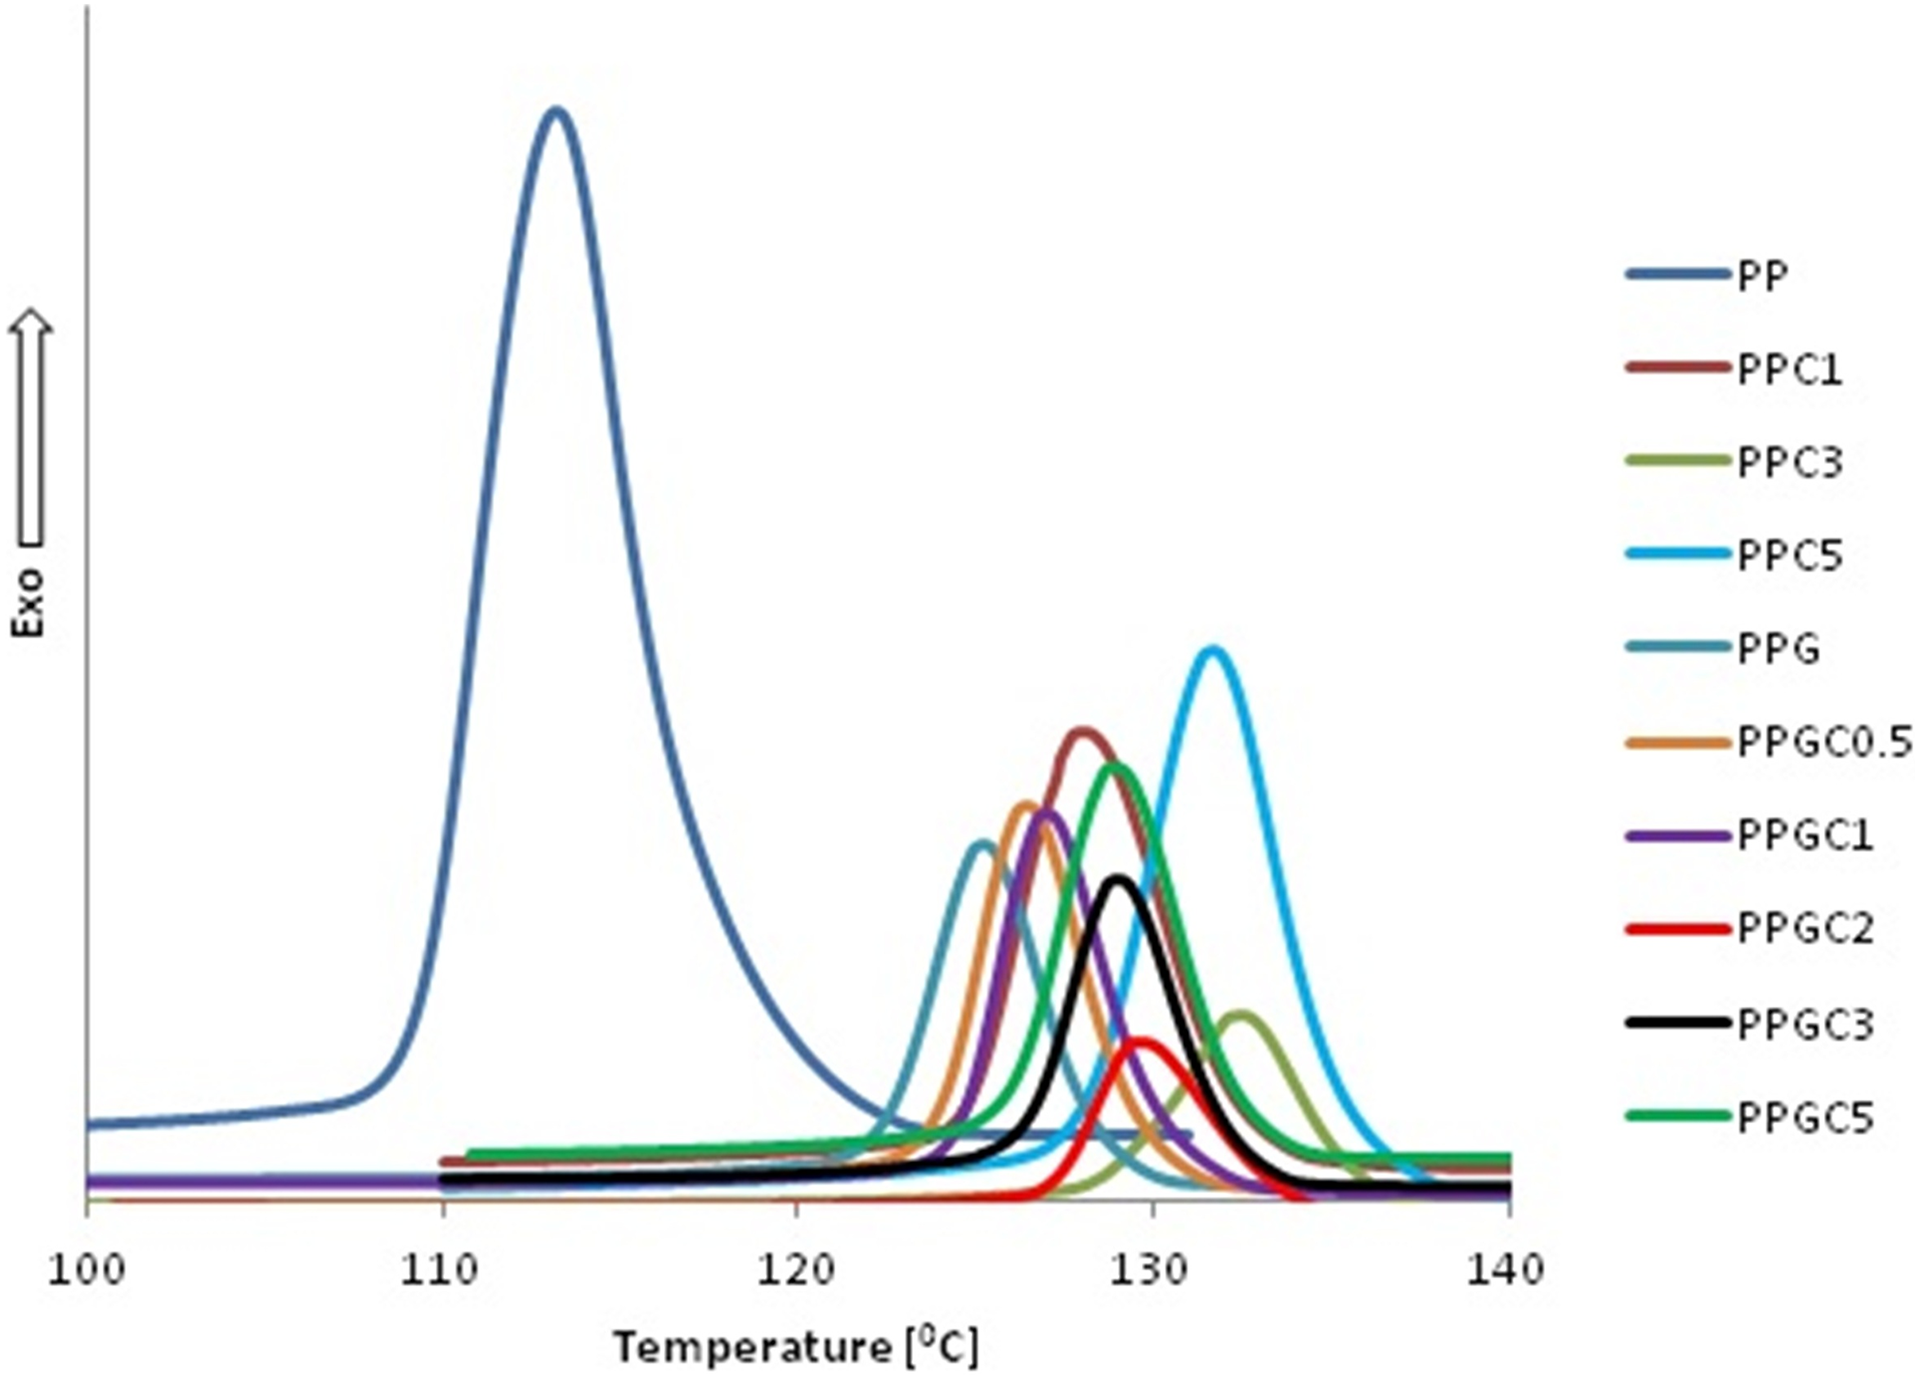
Nonisothermal crystallization thermograms of neat PP, nano, micro, and hybrid composites obtained from DSC analysis. DSC: differential scanning calorimetry.
Thermal properties of PP, nano, micro, and hybrid composites obtained from DSC analysis.
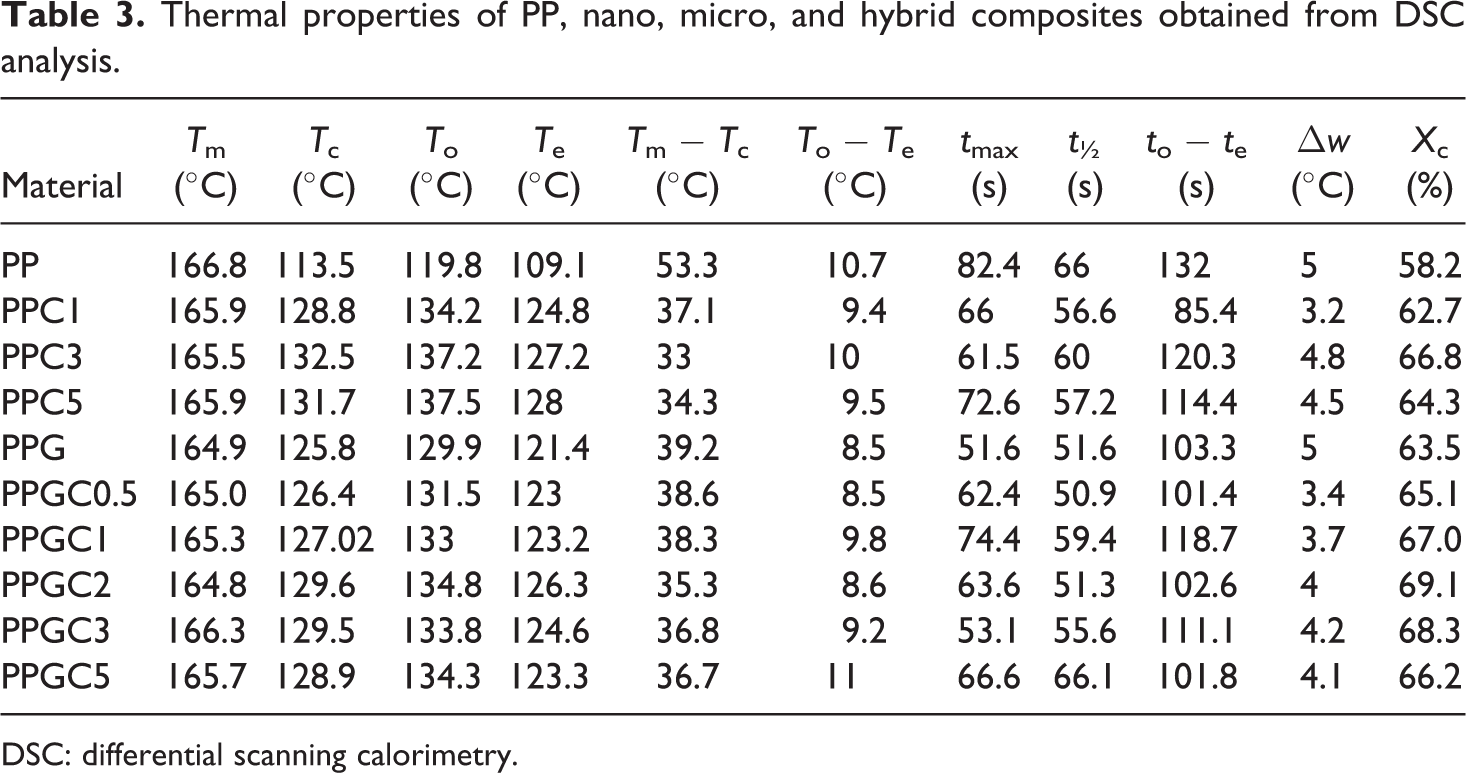
DSC: differential scanning calorimetry.
The small decrease in melting temperatures of composites is due to the disturbance caused in the crystalline regions of PP with the incorporation of nano and microfillers. The incorporation of 1 wt% of MWCNTs enhanced T c by 15.3°C and 3 wt% enhanced T c by 19°C. The prime reason is the excellent nucleating ability of MWCNTs in the matrix which causes the accelerated growth of spherulites. The drop in T c beyond 3 wt% of nanofillers is due to the generation of nanoagglomerates. In comparison with microcomposite, nanocomposites show higher T c values owing to the fact that the MWCNTs provided accelerated transcrystallization than glass fibers. Among the hybrid composites, “PPGC2” exhibits maximum T c due to the synergistic nucleation of multiscale fillers.
It could be inferred that “T o” occurred at early temperatures for hybrid composites than neat PP. The narrow span of T m − T c was exhibited by “PPC3” and “PPGC2,” which is an indication of accelerated crystallization process. The reduced “Δw” value of nano and hybrid composites implies uniform crystal size distribution. 24
Among the nanocomposites, the highest percentage crystallinity of 66.8 was exhibited by PPC3 in regard to PP, and at higher weight percentages, decline in crystallinity could be observed due to agglomerations. Furthermore, “PPGC2” exhibits enhanced crystallinity of 69.1% and beyond which it declines.
Fracture toughness
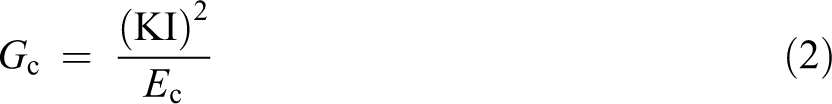
In order to analyze fracture toughness, SENB tests are conducted on virgin PP, nano, micro, and hybrid composites in three-point bending mode, and the results are reported in Table 4. The critical stress intensity factor (KI) and strain energy release rate (G c) of specimens are calculated using the following equations 6,26,27
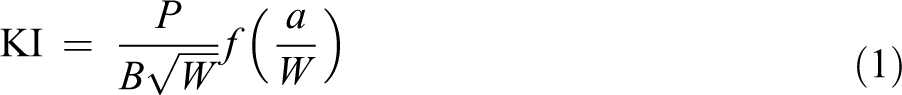
where KI is the critical stress intensity factor (MPa m1/2), P is the maximum load (N), B is the specimen breadth (m), W is the specimen width (m), a is the notch depth (m), f(a/W) is the geometry function that depends on notch depth to specimen width, and E c is the modulus of the composite (MPa).
Average failure load and KI values of neat PP, nano, micro, and hybrid composites.
It can be inferred from the results that PP when filled with 1 and 3 wt% of MWCNTs displays an increase in failure load. The high G c values of PPC1and PPC3 can also be justified with the area under the tensile stress–strain curve, which is an indirect indication of the strain energy of these composites. Concurrently, at higher nanotube concentration of 5 wt%, the values of KI and G c are reduced due to the formation of their nanoagglomerates in PP.
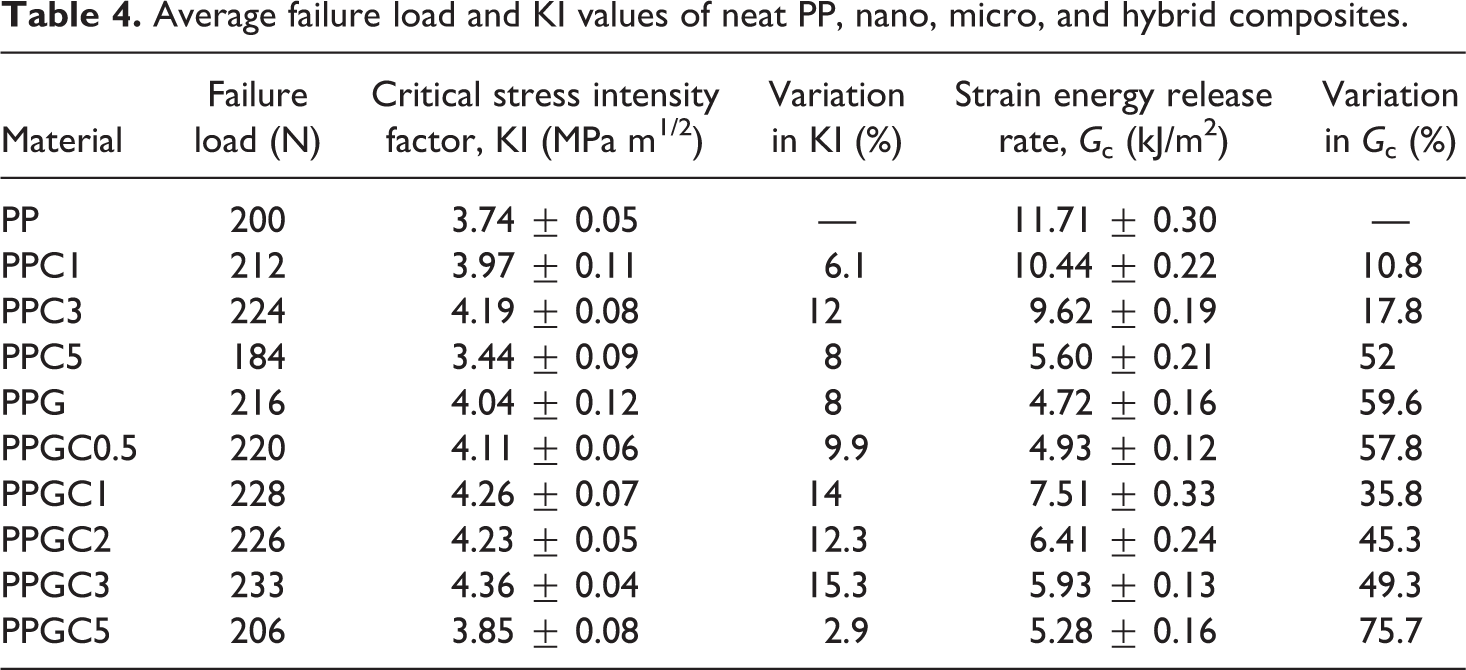
Figures 6 and 7 show the effect of MWCNT filler fraction on the fracture toughness properties (KI and G c) of nanocomposites. The mechanism that improves strain energy release rate for PPC1 and PPC3 is that the PP chains in the vicinity of nanotubes can get extended and stretched to its maximum during fracture and can form entanglements around the nanotubes. 28 This complex network of PP chains wrapped around nanotubes could obstruct the growth of crack and undergo high strain and could provide the possibility of large energy release rate. Moreover, the effective surface area to volume ratio is high for nanotubes, and hence PP chains could possibly adhere and entangle more on CNT than on microlevel glass fiber.
The effect of weight fraction of CNT on critical stress intensity factor (KI) of PP nanocomposites. CNT: carbon nanotube.
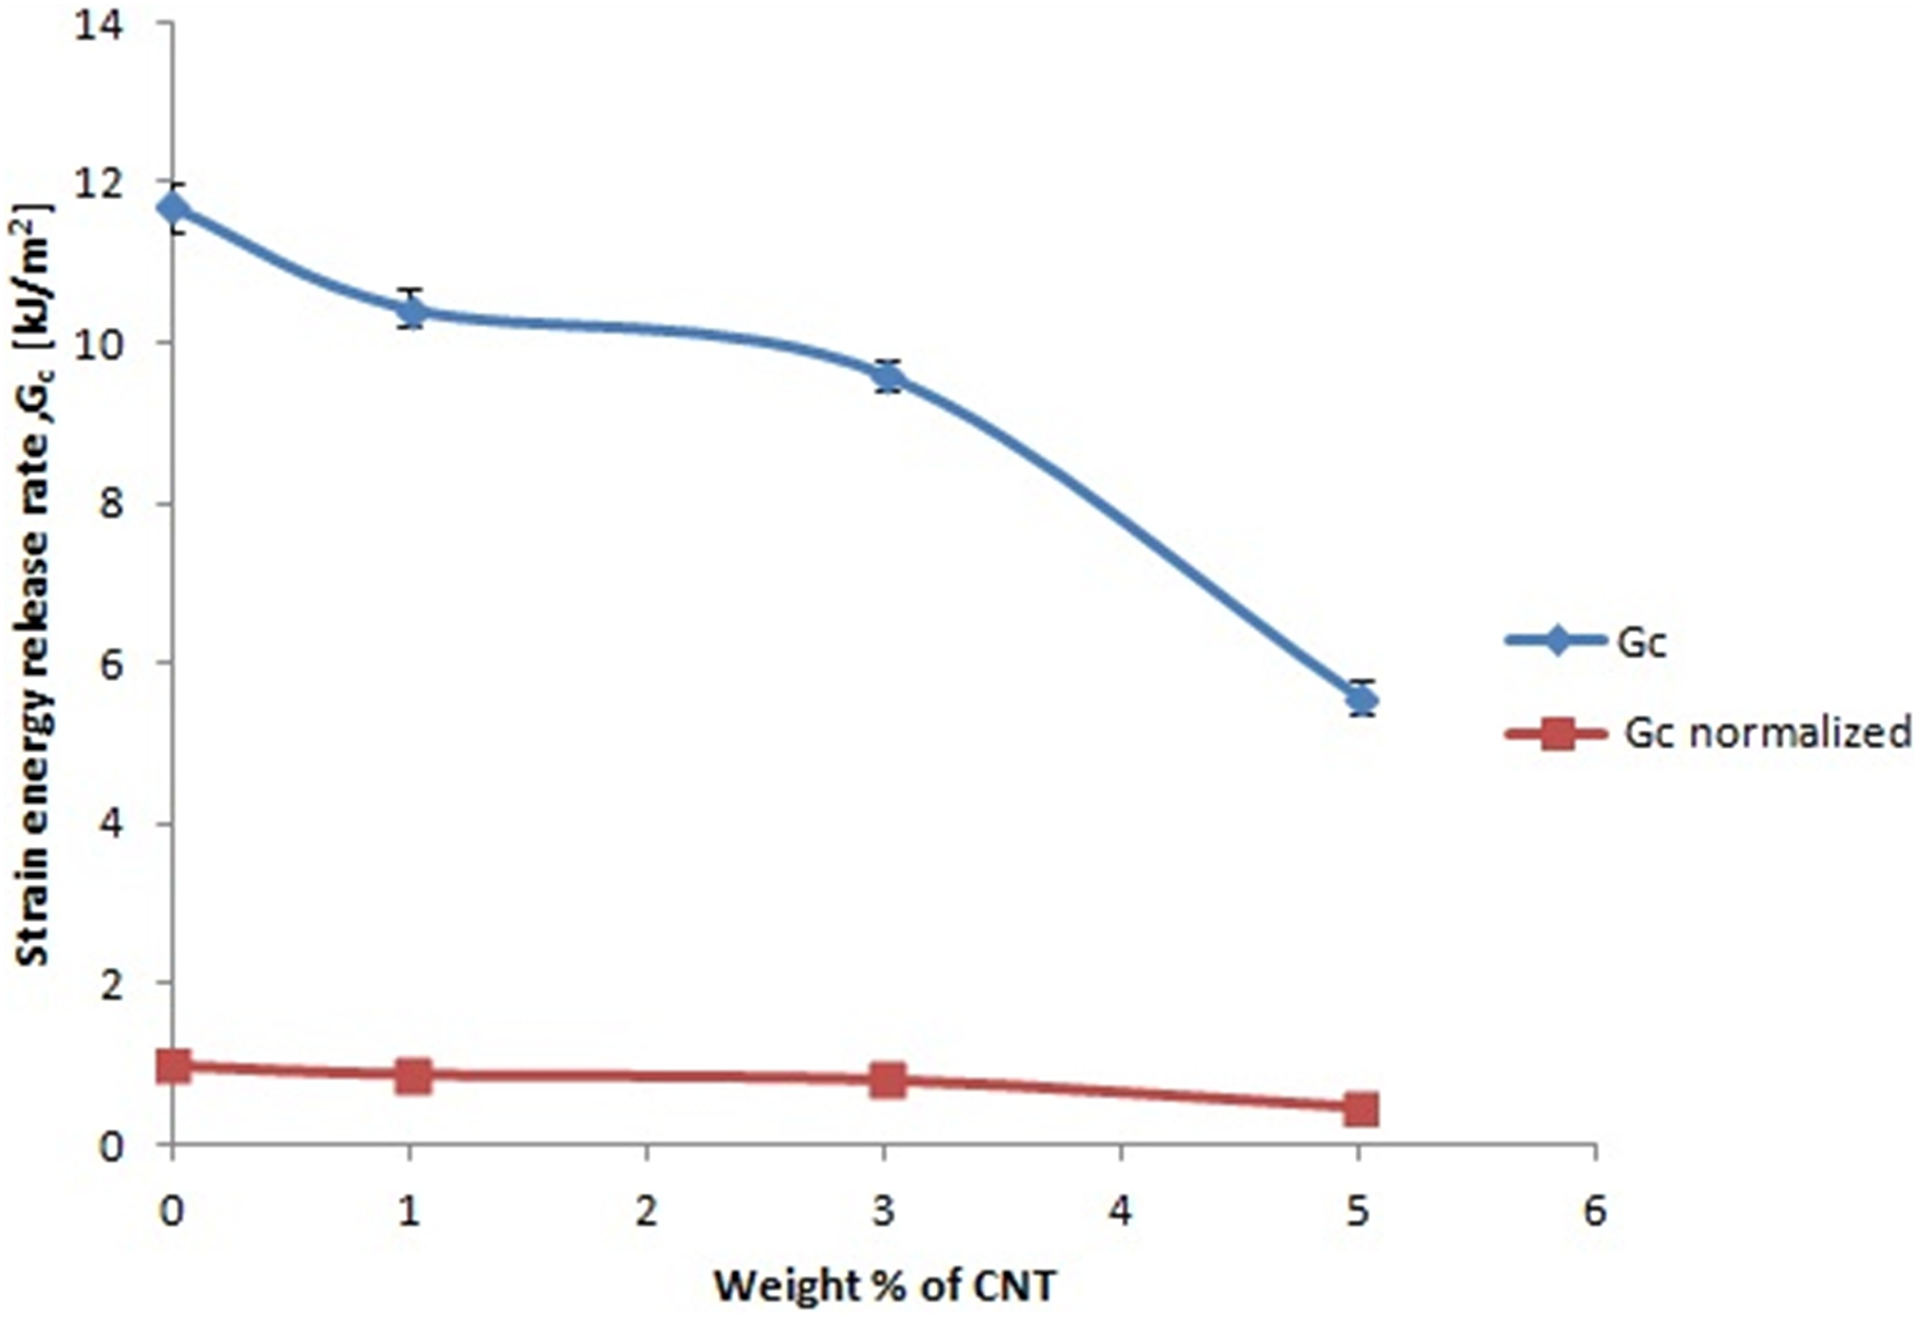
The effect of weight fraction of CNT on strain energy release rate (G c) of PP nanocomposites. CNT: carbon nanotube.
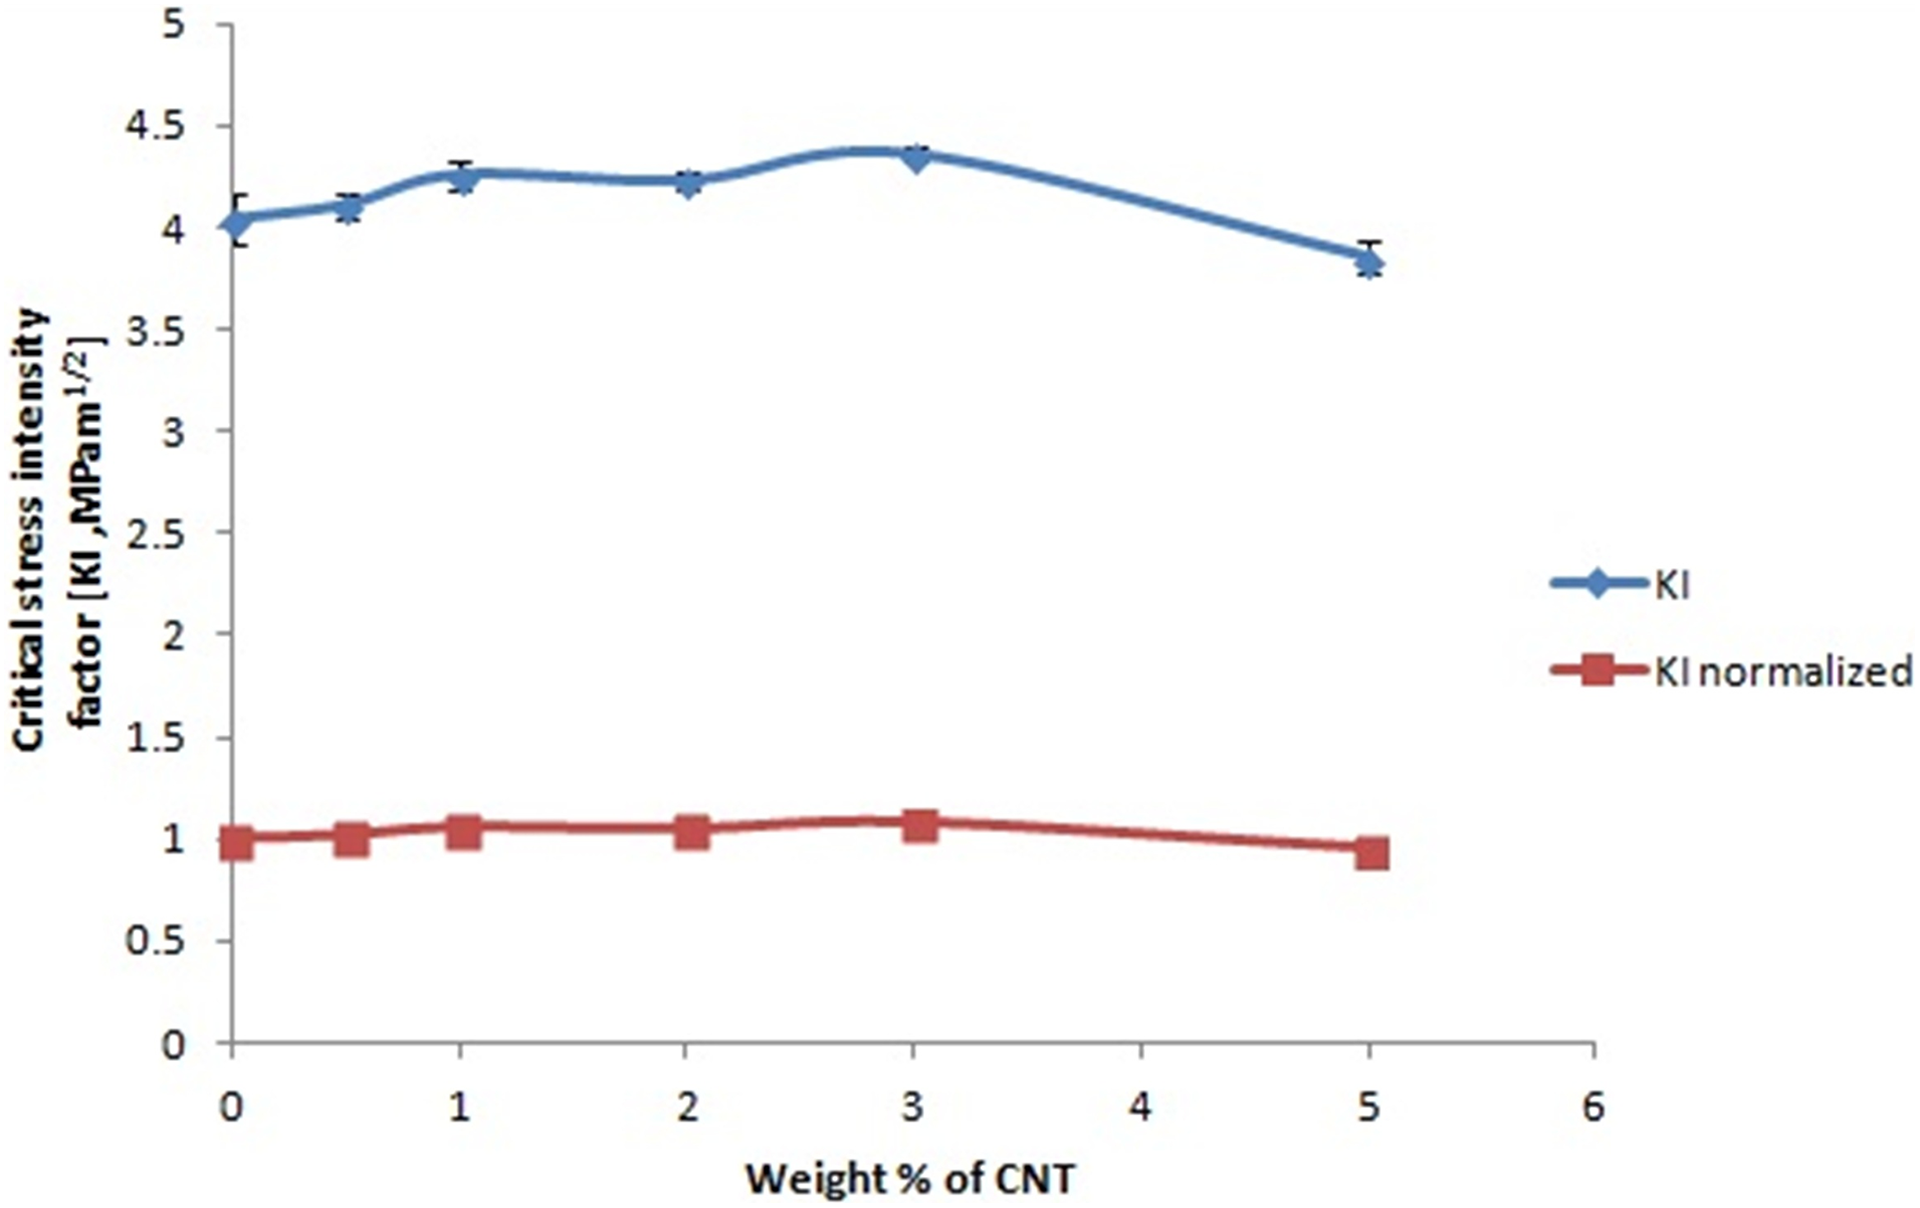
Figures 6 and 7 delineate the variation of KI and G c with CNT content in PP matrix. The normalized values of KI and G c are also presented where KI normalized is the KI of the composite/KI of the matrix, and G c normalized is the G c of the composite/G c of the matrix. Figure 6 clearly depicts that the maximum KI value is for PPC3 nanocomposite, and it could be inferred that higher filler loading need not necessarily lead to higher fracture toughness. From Figure 7, reasonably higher G c value is observed for PPC3 composite and a pronounced drop at higher weight fraction of 5 wt%. With the incorporation of 20 wt% of glass fiber in PP, KI value increased from 3.74 MPa m1/2 to 4.04 MPa m1/2. The glass fibers that are oriented across the crack plane impede the propagation of crack and hence high value of KI was obtained for PPG composite in comparison with PP. However, the KI value of microcomposite PPG in relation to PPC3 nanocomposite is low. Primarily, the superlative reinforcing potential of the nanotubes due to its high aspect ratio and the specific crystallization mechanism of PP chains around nanotubes might be a possible reason for the greater KI response of PPC3. Second, it is reported that in ductile matrix like polypropylene, infusion of micron size glass fibers increases the brittleness of the composite and could easily lead to the creation of voids around them leading to debonding during crack propagation. 29 Also, the effective area available for a given volume is less for glass fiber, and hence, the possibility of conglomeration of PP chains around them is less, which could be visualized in the SEM images of the fractured surfaces (Figure 10(e)) of the composite. As a result, the cracks formed could easily proliferate in close proximity of glass fibers. In the regions where glass fibers are scarce, a web of PP chains are generated, which could be seen in Figure 10(c) and (d) and is very vivid in Figure 10(e).
Evidently, even with higher loading fraction of 20 wt% of glass fiber, the value of KI has not increased much when compared to low-level loading of 3 wt% CNT in PP. Consequently, the G c value of PPG is relatively less (4.72 kJ/m2), which is justifiable by the lowest area under the tensile stress–strain curve possessed by the microcomposite. Among the three nanocomposites mentioned, PPC3 nanocomposite can be considered as a material that could withstand higher loads since it has high resistance to crack growth and cleavage. 28
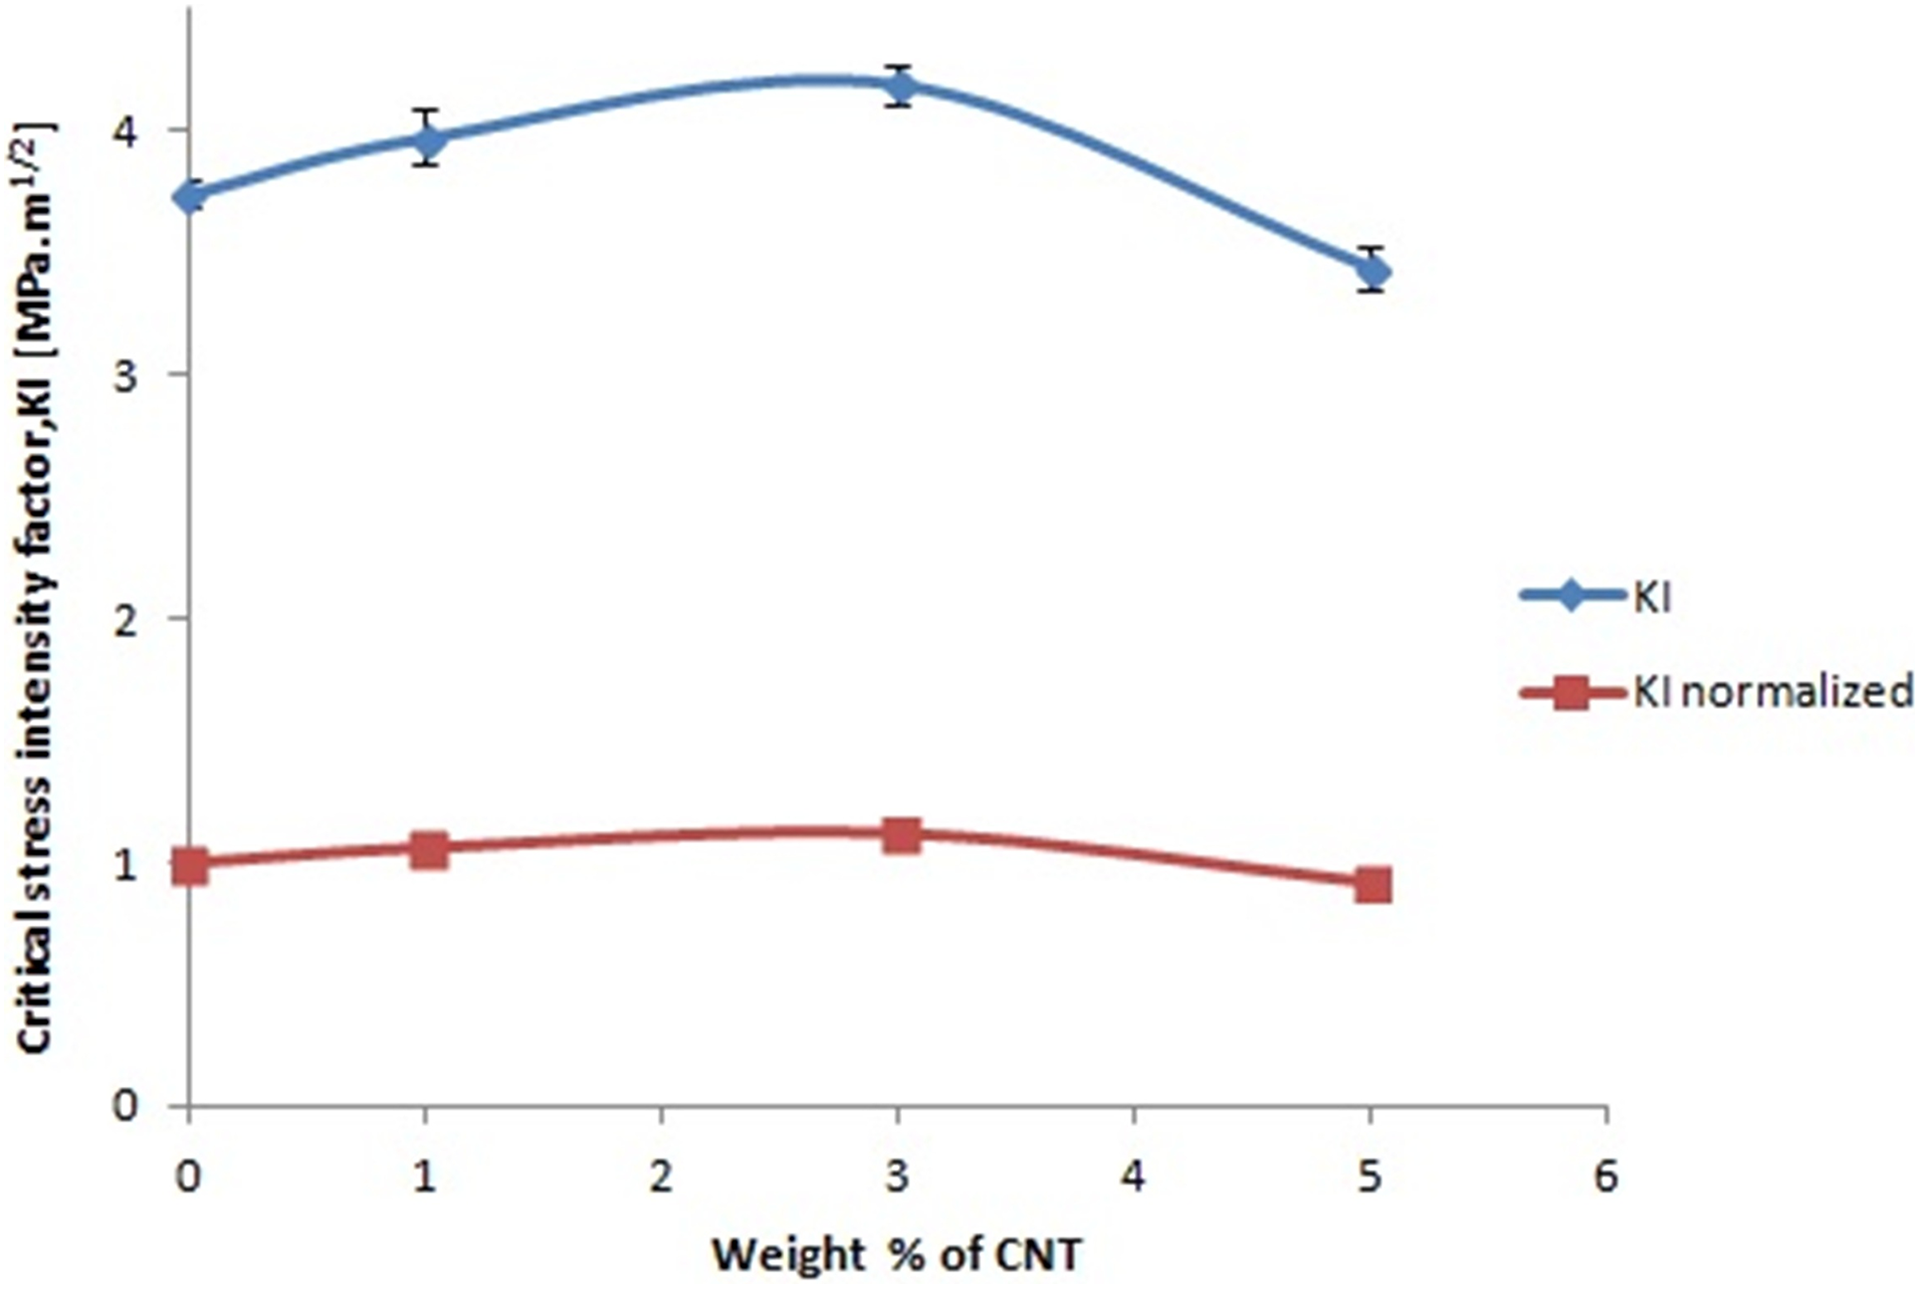
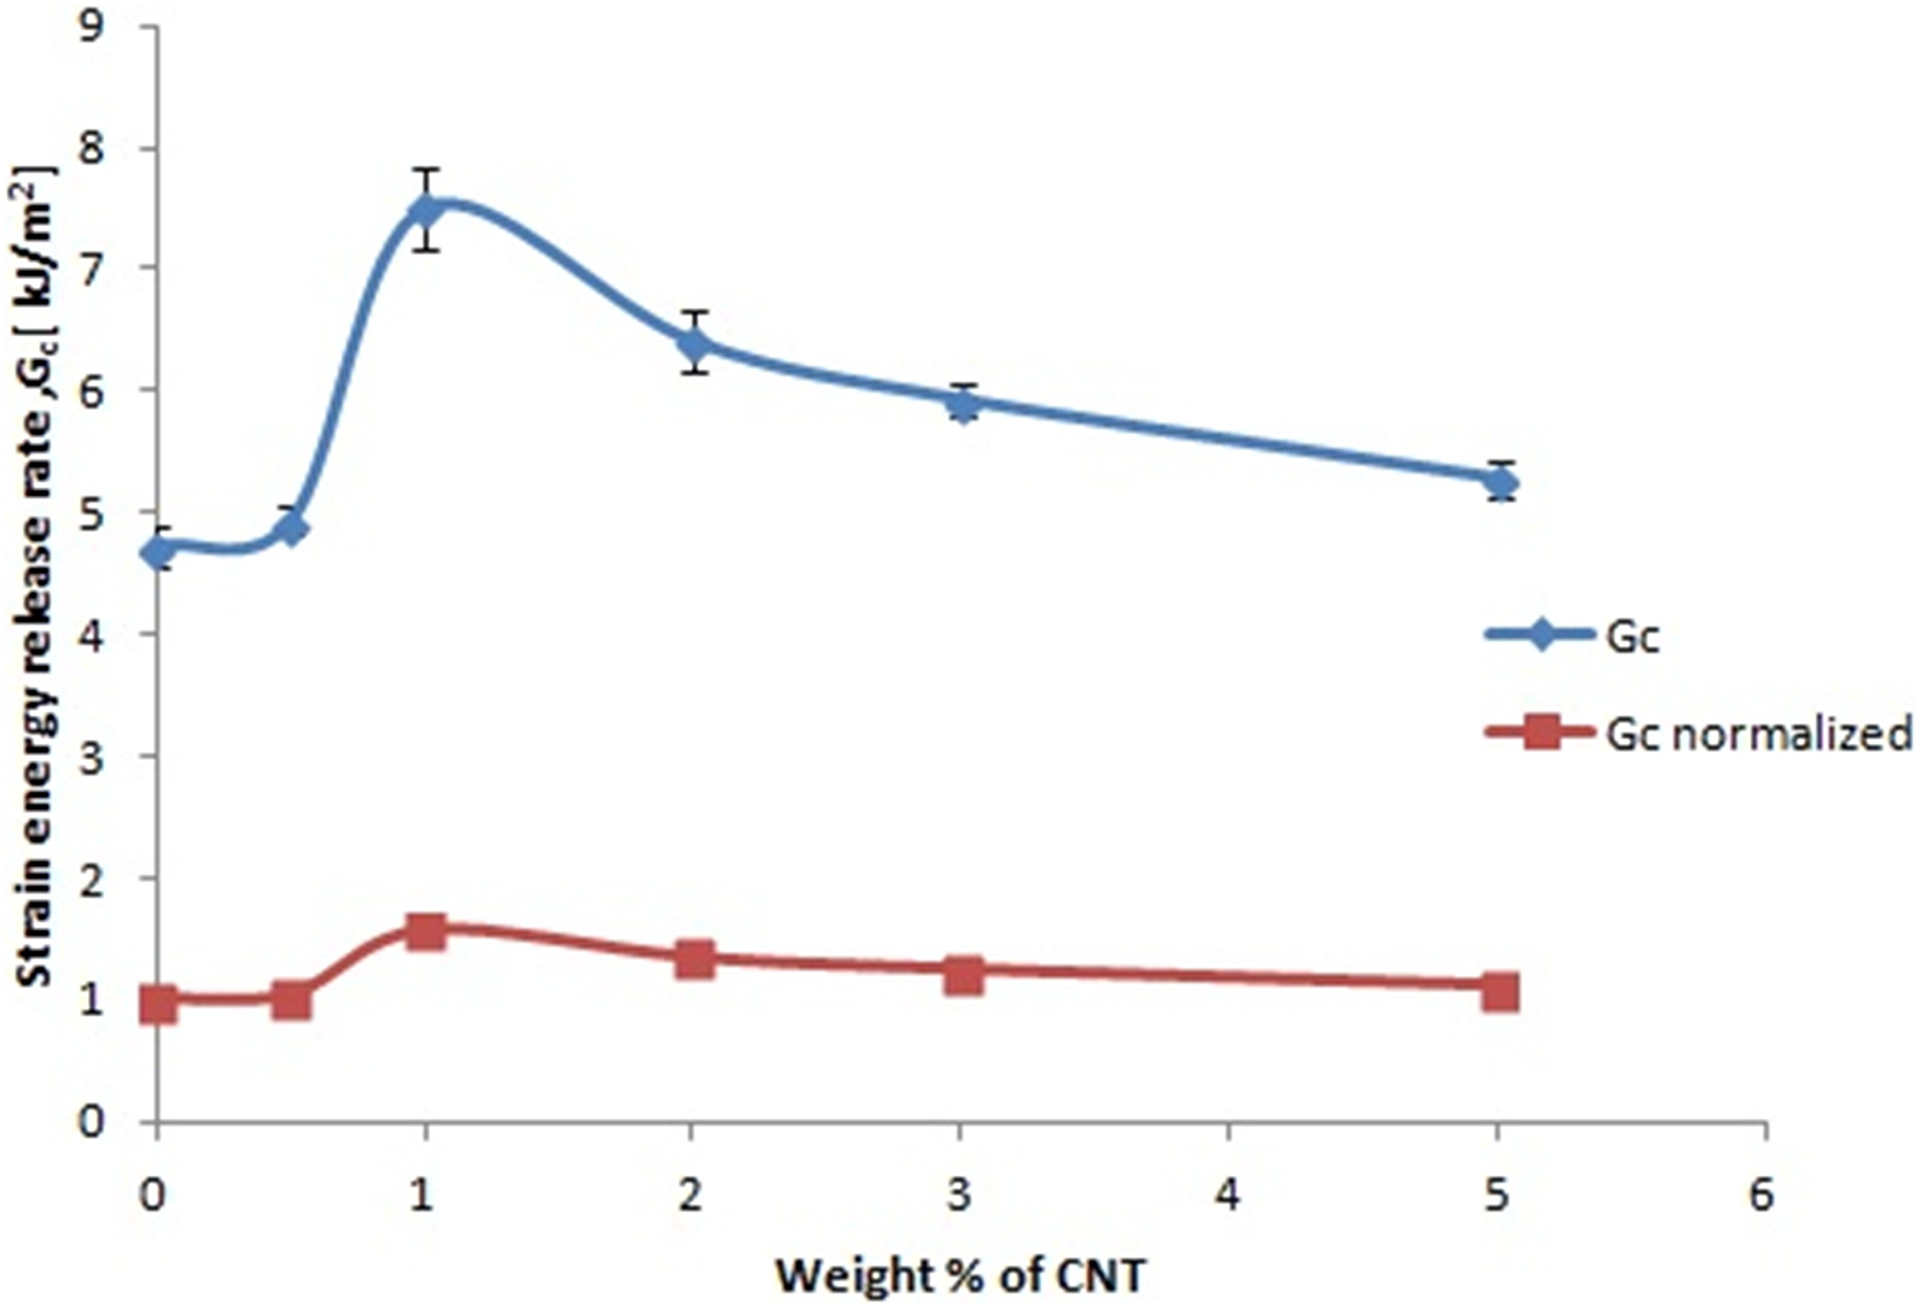
Hybrid composites with fixed weight fractions of glass fiber (20 wt%) and CNT varying from 0.5 wt% to 5 wt% display a prominent synergistic effect of fillers on fracture toughness. 30 It is noticed that, at very low fraction of 0.5 wt% of CNTs in PPG composite, failure load has increased from 216 N to 220 N, which shows an increase in KI value of 1.7%. When the weight fraction of CNT was incremented to 1 and 3 wt%, the KI value raised by 5.3% and 7.9%, respectively, as presented in Figures 8 and 9. On the other hand, higher loading of 5 wt% CNT in microcomposite decreased KI value by 4.7%. This failure characteristic is attributed to the structural changes in the composite due to the formation of clusters of CNT and interfacial adhesion failure which in turn accelerates cleavage. Hence, the fracture mechanism evinced by PPGC3 composite is superior ascribable to the presence of multiscale fillers, their geometry, and better interfacial adhesion. The hybrid effect of CNT and glass fiber in PP deduced reasonable values of G c for hybrid composites in comparison with PPG composites. From Figure 9, it could be seen that PPGC1 exhibits maximum G c among the hybrid composites. This might be due to the better dispersion of nanofiller fraction of 1 wt% in PP matrix due to high shear of mixing in twin-screw extruder.
The effect of weight fraction of CNT on critical stress intensity factor (KI) of PP hybrid composites. CNT: carbon nanotube.
The effect of weight fraction of CNT on strain energy release rate (G c) of PP hybrid composites. CNT: carbon nanotube.
SEM analysis of fracture surface
The SEM micrographs of fractured surfaces of PPGC3 composites are shown in Figure 10. At a lower magnification of 500× (see Figure 10(a) and (b)), one could observe a large number of glass fibers dispersed in polymer matrix. It is also clear that many glass fibers are aligned in a direction perpendicular to the fracture plane and some fibers are pulled out of the matrix during loading.
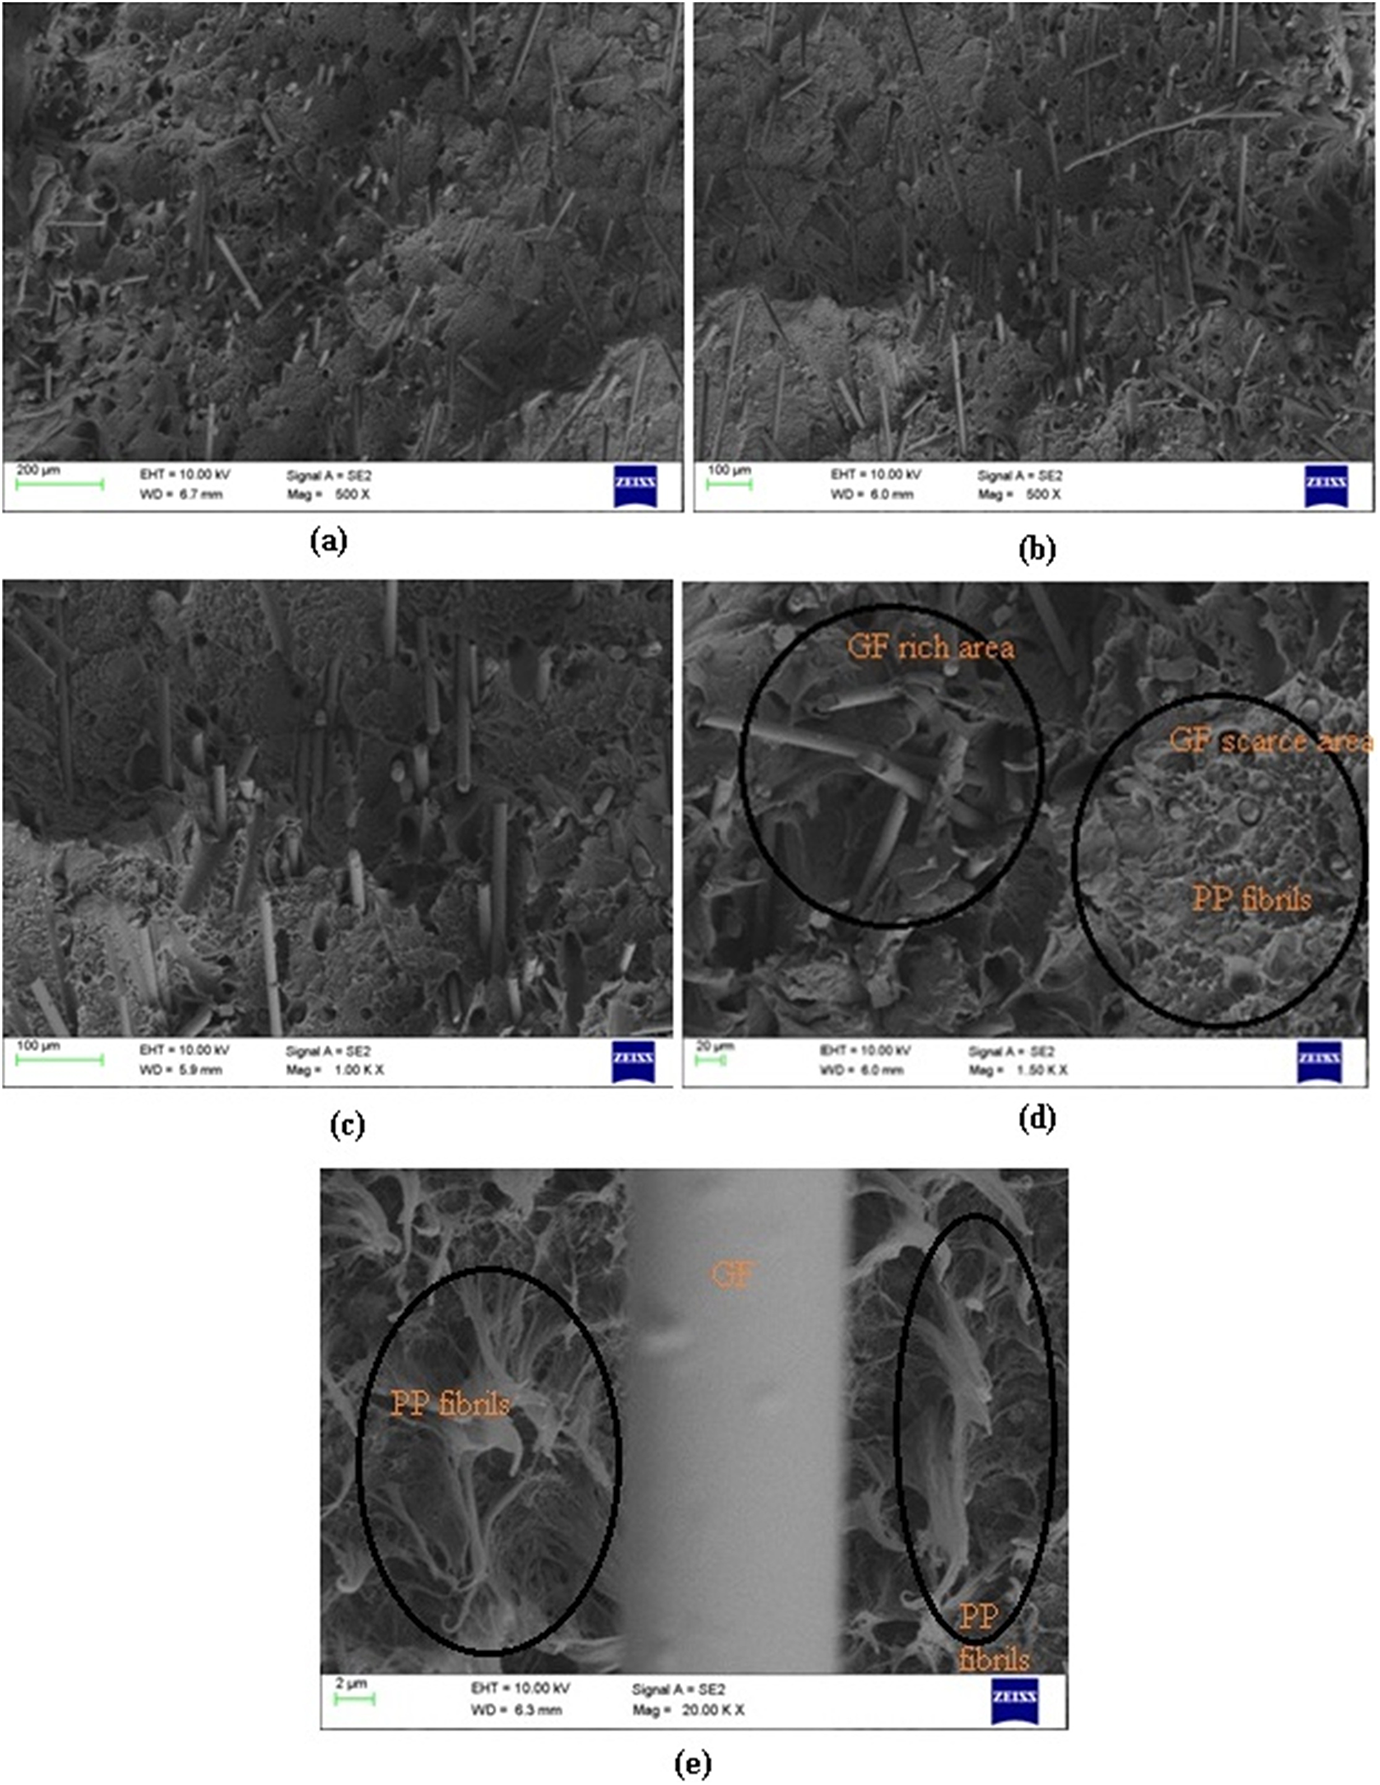
SEM micrographs of fractured surfaces of PPGC3 hybrid composite at (a) and (b) 500× magnification and (c) and (d) 1000× and 1500× magnifications. (e) Polymer yielding around an individual glass fiber in PPGC3 hybrid composite. SEM: scanning electron microscopy.
It is visible from Figure 10(c) and (d) that the presence of glass fiber together with nanotubes promoted a tortuous cleavage path for the microcracks to propagate. Similar results were reported in an earlier study involving PP, glass fiber, and nanoclay. 5 When an individual glass fiber in the fractured surface is viewed at higher magnification, a complex network of PP chains as a web is observed in its vicinity. This shows that PP chains are deformed to its maximum and retains a partly ductile behavior of the composite. Prior to failure stretching and cracking of polymer chains, PP chains could lead to recoiling or rolling around nanotubes present near the glass fiber. 28
Fracture toughness modeling and failure mechanism
The fracture toughness properties of nano, micro, and hybrid composites are analyzed by various theoretical models and are compared with the experimental results. Generally, polymer matrices with fillers of micro to nanosize display complex fracture toughness behavior during crack propagation.
The linear elastic fracture mechanics (LEFM) has been applied to assess the toughness of natural and synthetic filler-reinforced polymer composites. Even though PP exhibits inelastic behavior, the inclusion of rigid fillers in the PP matrix makes the composite brittle. The fracture mechanics helps to quantify the toughness of the material by taking into consideration the conditions at which an existing sharp crack in the material begins to grow unstably. Both force- and energy-based failure criteria (collectively known as LEFM) have been developed for materials exhibiting brittle or quasi-brittle behavior. 9,31 –33 Furthermore, literature shows that LEFM has been accepted to study the fracture behavior of polypropylene composites reinforced with nano and microfillers. The critical stress intensity factor and strain energy release rates of polypropylene matrix reinforced with glass fiber and nanoclay were reported by Ramsaroop et al. 5 However, the composites under investigation are heterogeneous and exhibit a degree of nonlinearity and could contravene LEFM assumptions. It is assumed that material is homogeneous, isotropic, and macroscopically they behaved in a linear elastic fashion. 33 Many reports have applied LEFM (K c and G c values) to explain the fracture behavior of unidirectional fiber-reinforced composite materials where the anisotropy is very high. 34 But in this work, fillers are randomly distributed and (also short glass fibers are used instead of continuous fibers) where heterogeneity and anisotropy are much less. Hence, the composites prepared could be idealized to be isotropic, elastic, and homogeneous, and LEFM is more applicable to our randomly oriented reinforced composites than uni or bidirectional composites. LEFM analysis of PP/glass beads, calcium carbonate, Al(OH)3, and talc was reported by Arencón and Velasco. 1 Additionally, LEFM mechanics was applied to glass sphere-filled polyethylene. 16 If a thermoplastic matrix is incorporated with rigid filler fraction, it embrittles the matrix and the composite behavior could be approximated to linear elastic behavior.
Although material follow nonlinear behavior, the nonlinearity is confined to a small zone called plastic zone in the proximity of crack tip which can be quantified using the equation
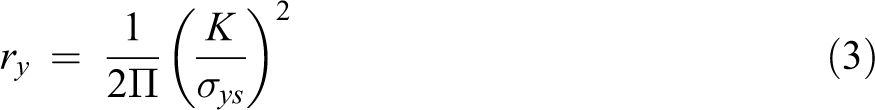
where “ry
” is the crack tip plastic zone radius, “K” is the critical stress intensity factor,
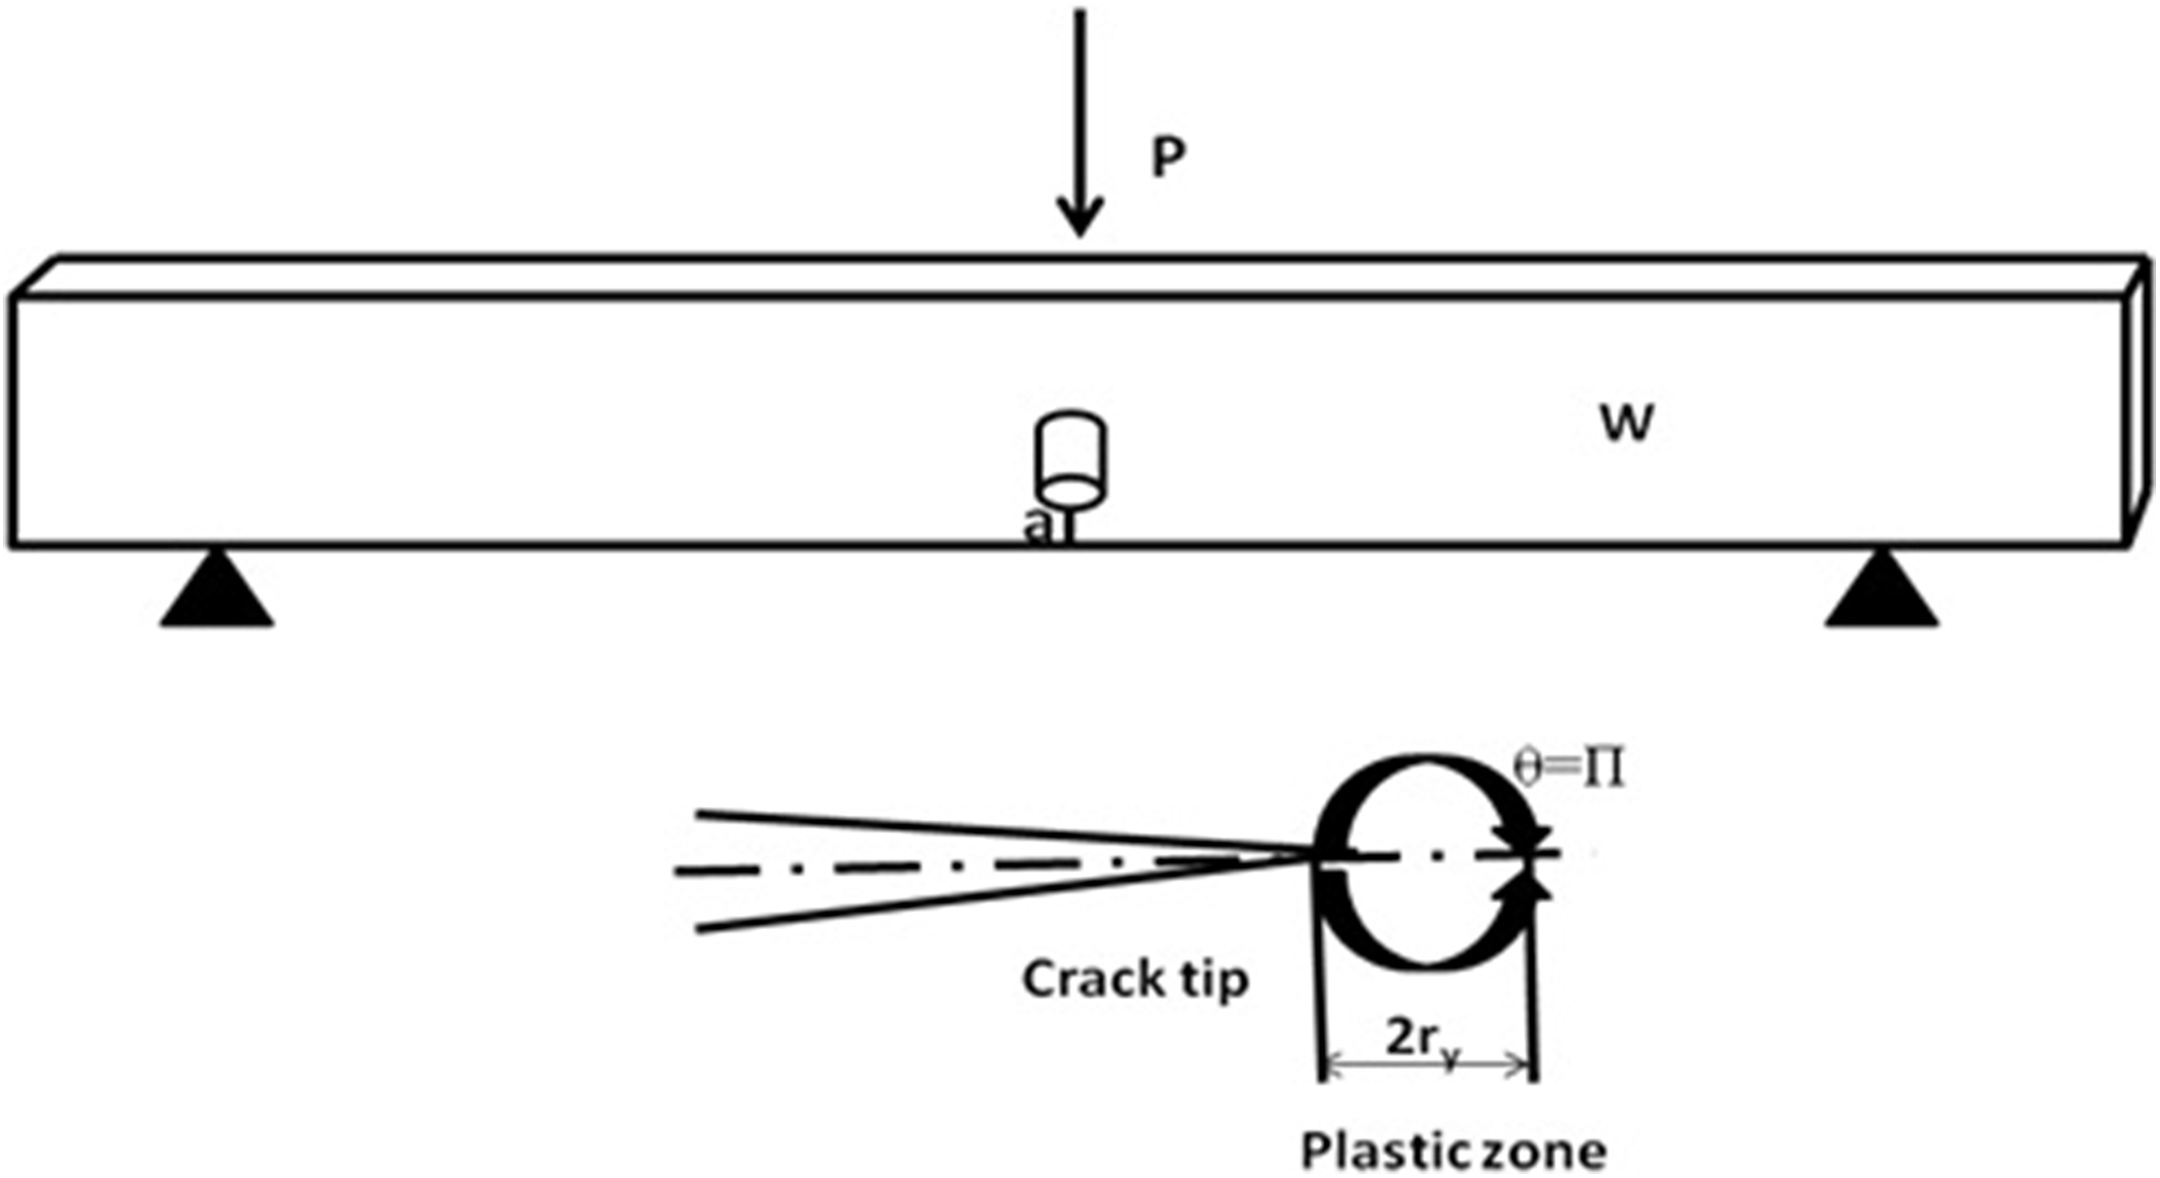
Schematic representation of plastic zone developed at the crack tip.
The radii of plastic zones obtained for the different samples are reported in Table 5. The value of ry is the highest for PP matrix and with the incorporation of nanofiller in the PP and PPG matrix “ry ” reduces. The plastic zone radii of nano, micro, and hybrid composites are reasonably small, indicating a very small region of plastic flow.
Computed crack tip plastic zone radii of PP and composites.
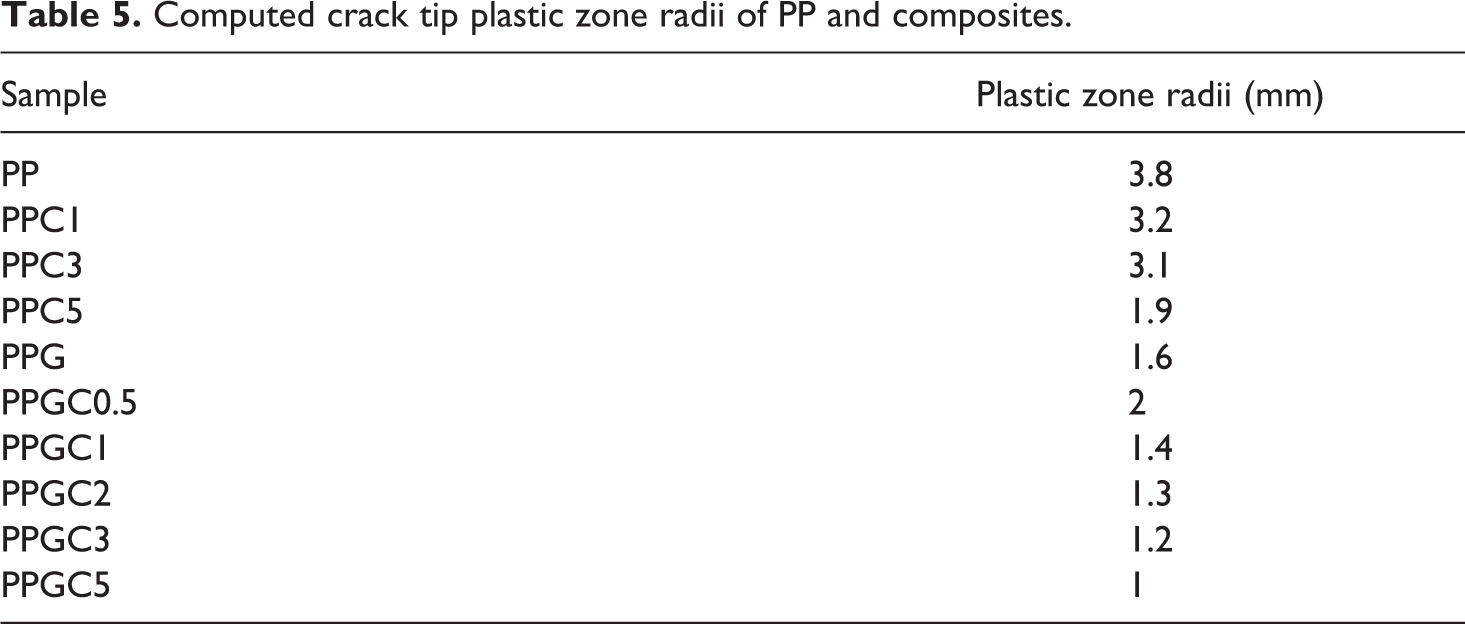
Most of the energy absorbing processes associated with toughness of the materials occur within this plastic zone, and an estimate could be drawn on the energy absorbing ability of the material based on the size of plastic zone. The crack depth was measured to a size of 1 mm and the specimen width was 13.34 mm, and the computed values of ry do not appear unreasonable.
The fracture energy (energy per unit area of the crack) obtained experimentally and using micromechanical models of each composite were calculated and are reported in Table 6.
Experimental and predicted strain energy release rate values of PP, nano, micro, and hybrid composites using various micromechanical models.
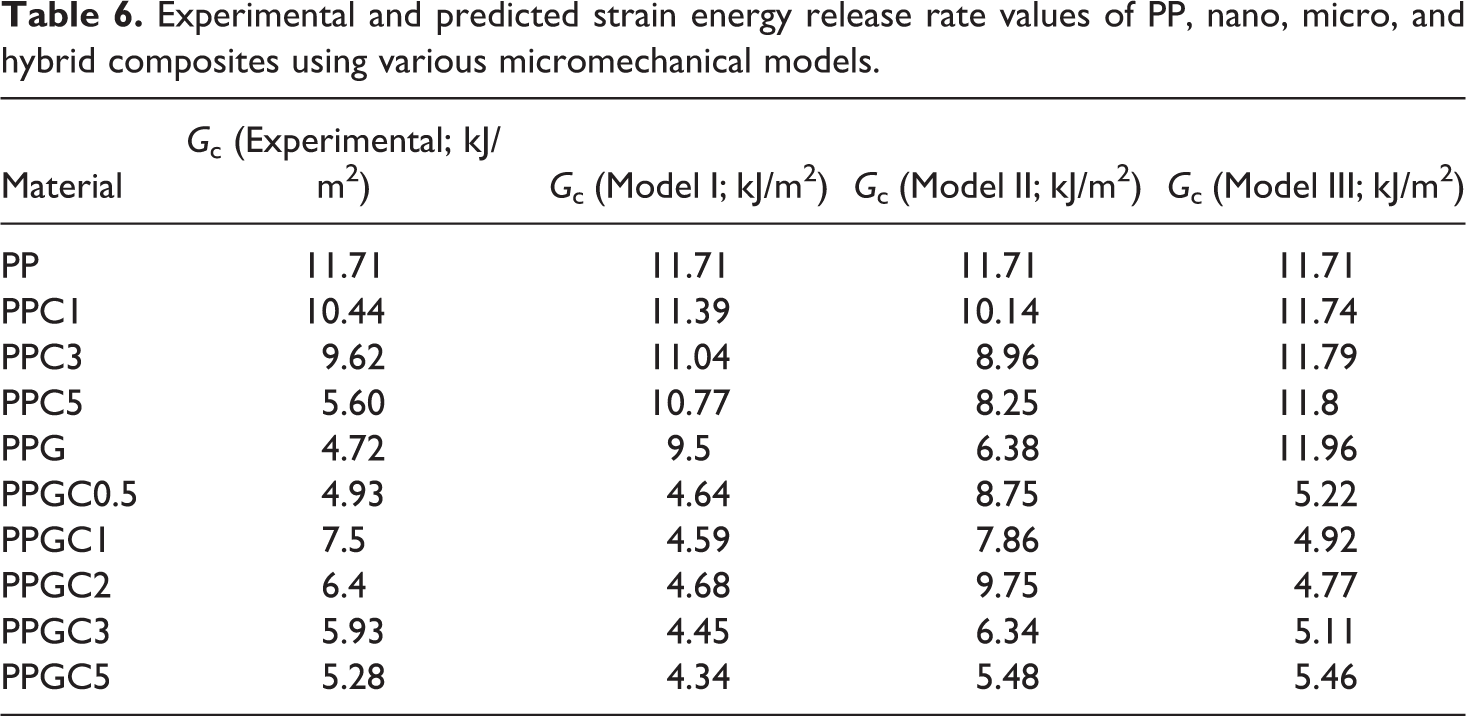
The experimental critical strain energy release rate (G c) of PP was found to be 11.71 kJ/m2. When a cracked specimen of ductile polypropylene matrix is subjected to bending, the major deformation mechanism is by shear yielding. This implies that PP chains are capable of translational movements and could possibly entangle and further deformation loads lead to fragmentation of PP lamella. 1 Apart from the size, shape, and composition of fillers, the fracture toughness is also affected by the formation of defects/dislocations developed in the composites. 35
The different types of fracture mechanisms identified are (i) breakage and pullout of fibers from matrix, (ii) development of debonding zone between filler and matrix, (iii) matrix fracture and yielding of matrix, and (iv) fracture propagation through interface of matrix and filler 1 as shown in Figure 12. The overall crack resistance can be tabulated by taking into account these fracture mechanisms.
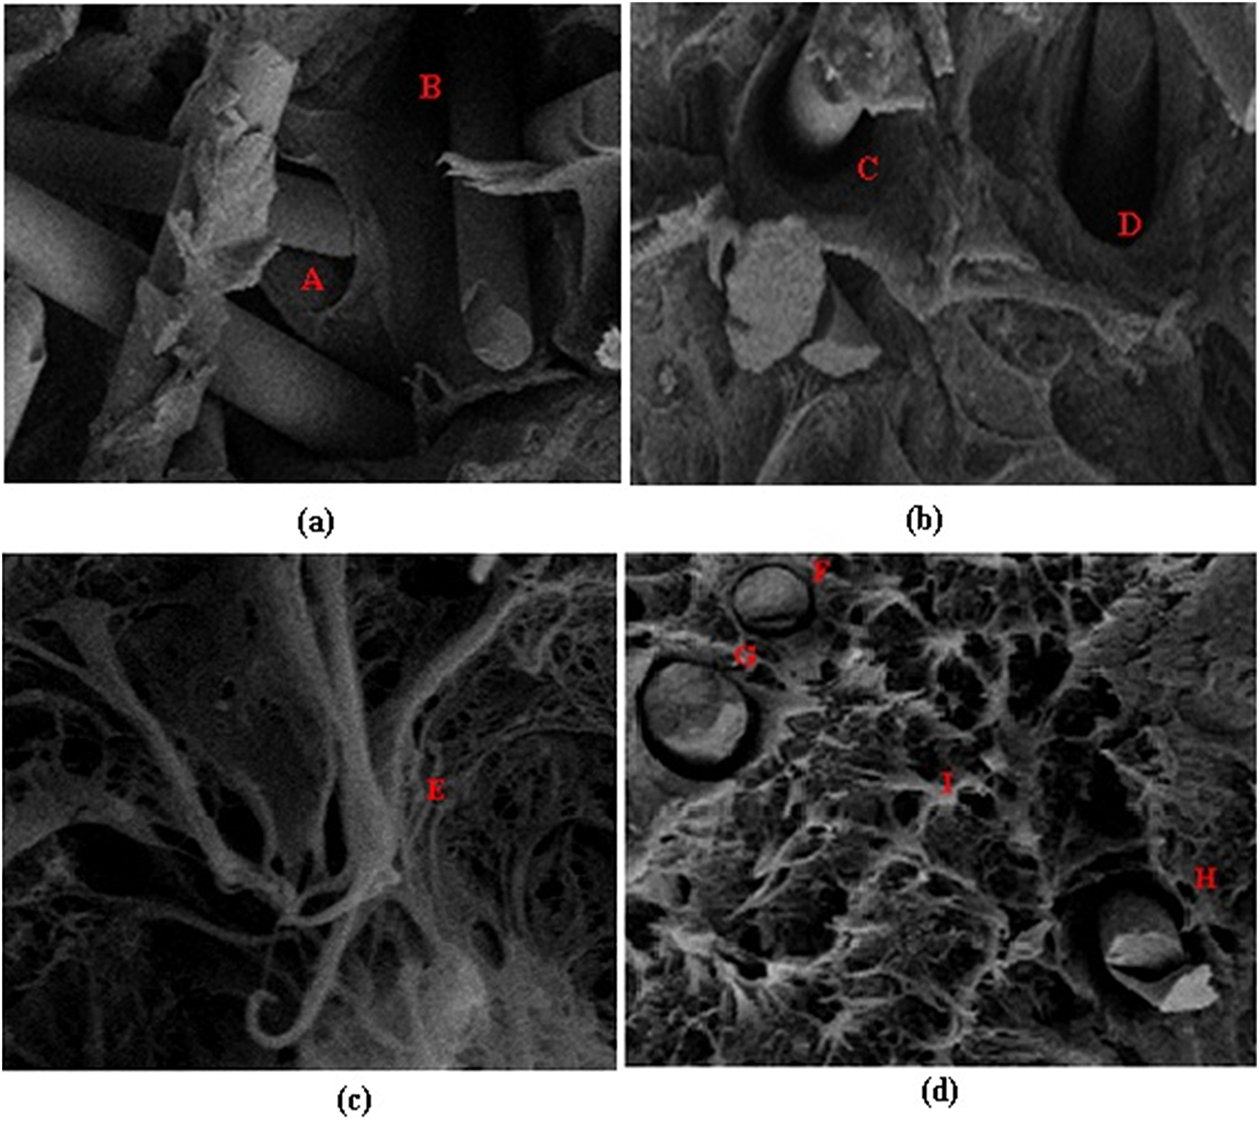
Fracture mechanisms observed in SEM images of fractured surfaces of PPGC3 hybrid composite (a) and (b) filler debonding and (c) and (d) plastic deformation and yielding of matrix. SEM: scanning electron microscopy.
From Figure 12(a) and (b), it was observed that debonding of fillers from matrix occurred easily in glass fiber rich areas. Owing to the micron size of glass fibers, PP chains could not wrap around and hold them firmly within the matrix creating a weak interface. These regions are labeled as “A,” “B,” “C,” and “D.” Figure 12(c) and (d) represents plastic deformation and yielding of matrix and labeled as “E” and “I”. The regions “F,” “G,” and “H” display strong interface generated between glass fiber and matrix. These discrete glass fibers that are present in CNT-rich area demonstrate a strong interfacial bonding with the matrix. The nanosize and high stiffness of CNTs could hold fillers firm in the matrix and hence nanocomposites displayed higher fracture toughness in comparison with hybrid composites. Figure 13 illustrates a crack bridging mechanism of CNTs in the matrix. The CNTs aligned in the direction perpendicular to the crack are capable of resisting crack propagation to a greater extent than the randomly oriented CNTs in the matrix. 36
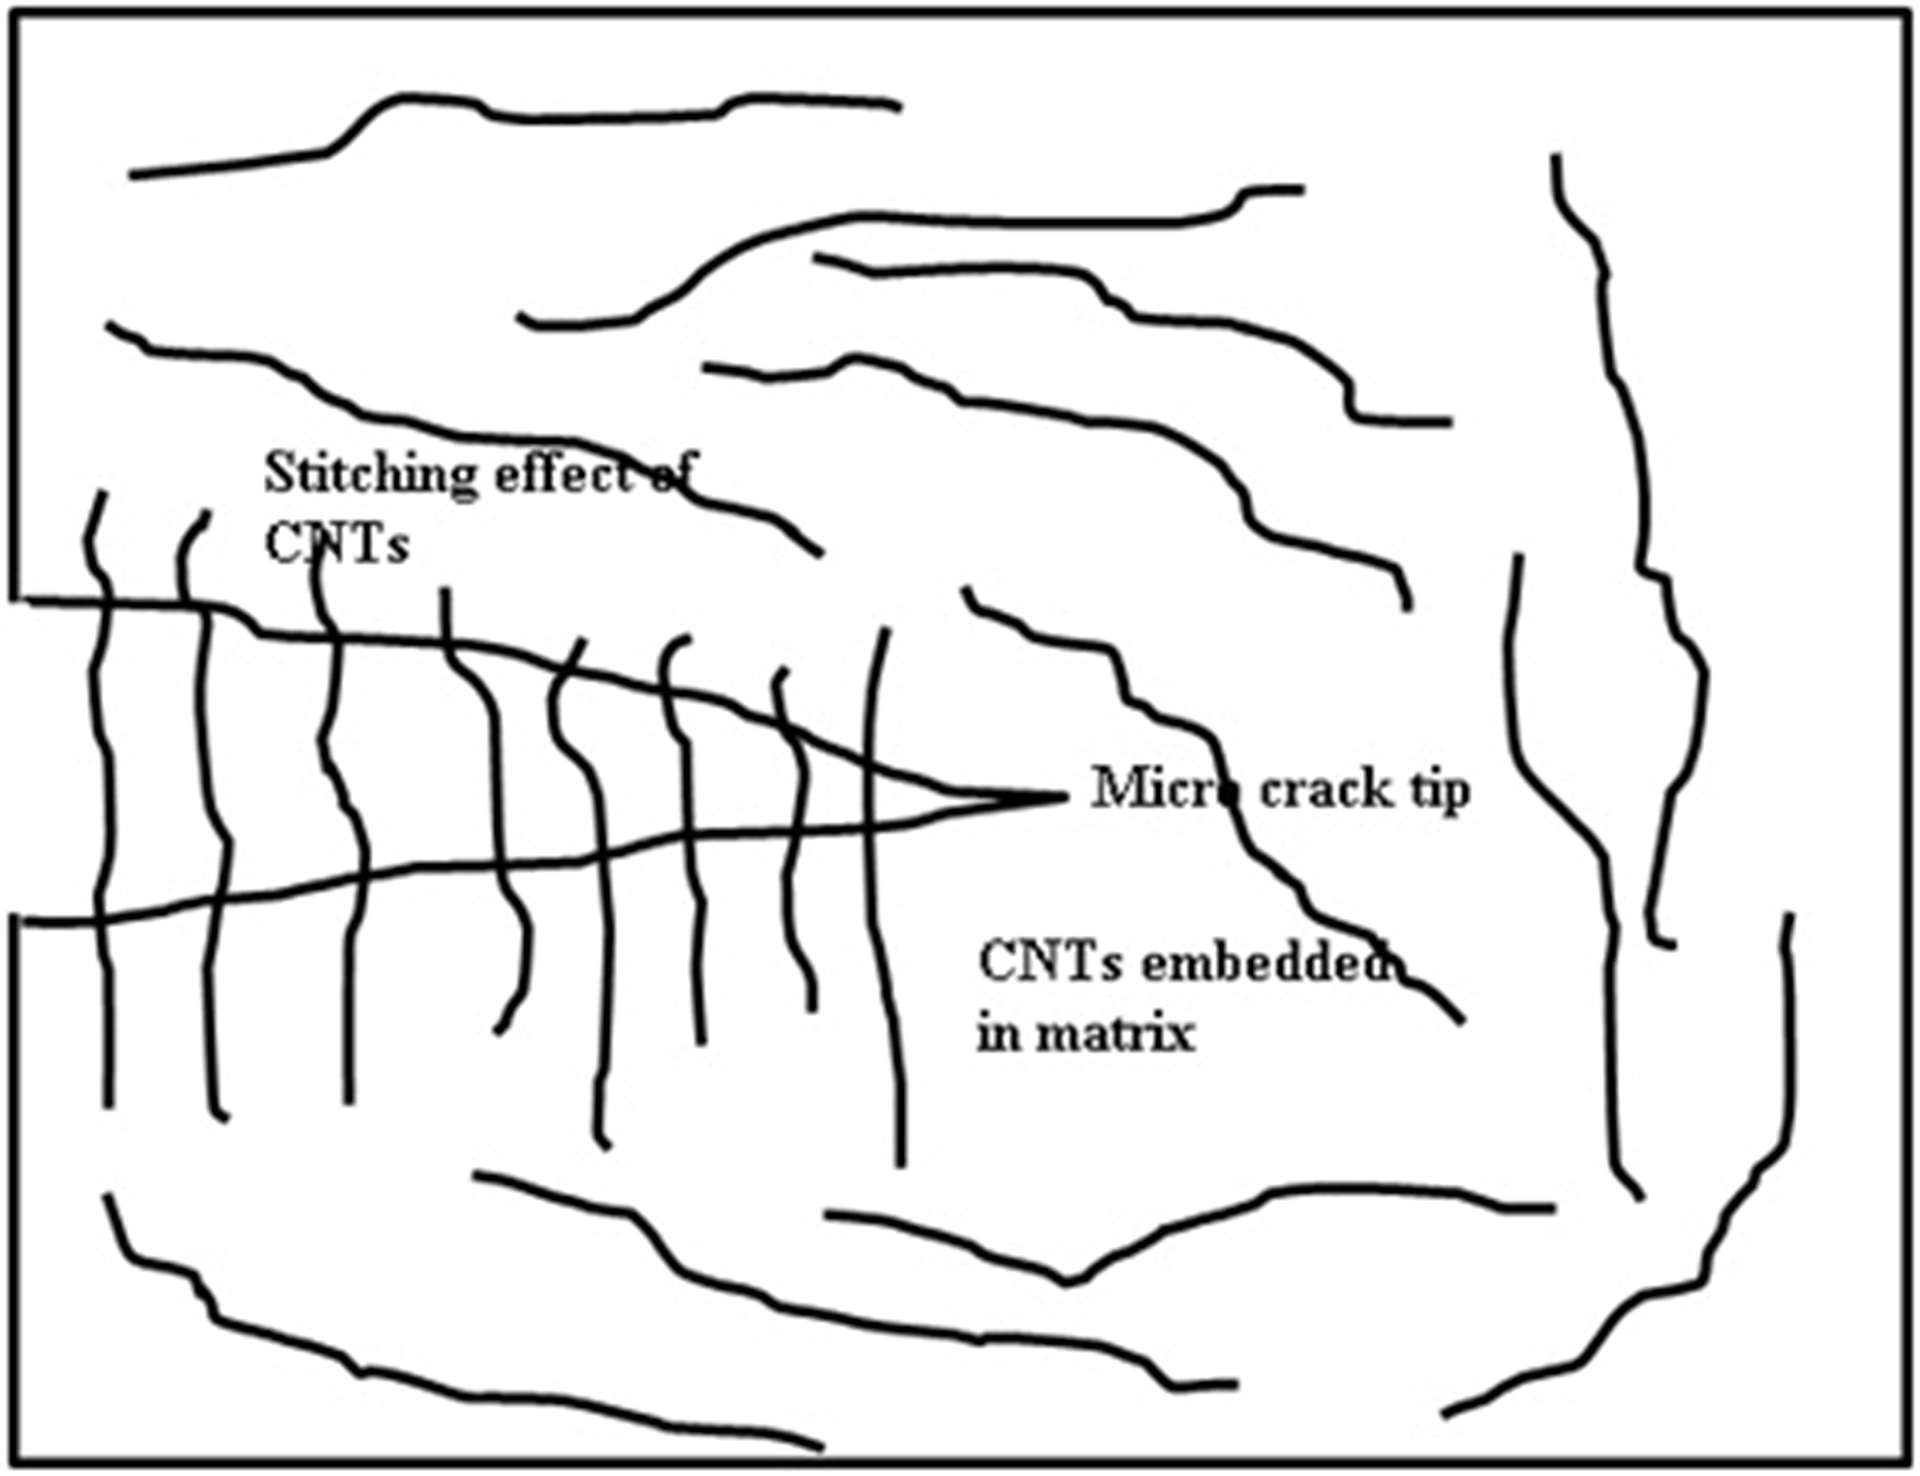
A pictorial representation of stitching effect of CNTs in nano and hybrid composites.
The micromechanical model indicated as model I in Table 6 was put forth by Pukanszki and Karger-Kocsis. 4 This model envisaged the decrement in fracture toughness with an increase in the particle content. Model I values are obtained using the following equation: 13

where G c represents the fracture energy of the composite, G m is the fracture energy of the matrix, and ϕ is the volume fraction of filler.
The fracture resistance (G c) of nano, micro, and hybrid composites calculated by model I is compared with experimental values. It could be mentioned that the experimental and predicted values exhibit similar trend though minor differences exist. Although model I proposed by equation (4) takes into account the dependence of fracture toughness properties on the composition of fillers, the model seems to be inadequate for many heterogeneous composite systems where matrix–filler interaction is crucial.
The other micromechanical models for the evaluation of fracture toughness of filled polymer matrices were presented by Lauke and Fu. 13 The failure mechanisms like filler debonding, matrix yielding, and brittle/ductile breakage of matrices arised during crack propagation are considered as dominant mechanisms in this model. These models are represented by models II and III in Table 6. The evaluation of composite fracture toughness according to these models is focused on a dissipation zone where the abovementioned fracture mechanism occurs. These models take into consideration the effect of structural properties of the material, volume fraction of fillers, matrix yield strain, and debonding strain on fracture toughness. 13
If debonding of fillers followed by matrix yielding takes place in composites, model II could be beneficial, and if matrix yielding alone occurs, model III could be chosen. Model II is represented by equation (5) and model III by equation (6), respectively
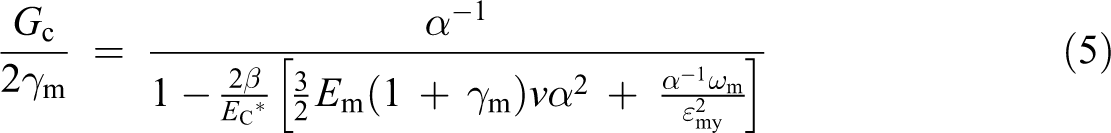
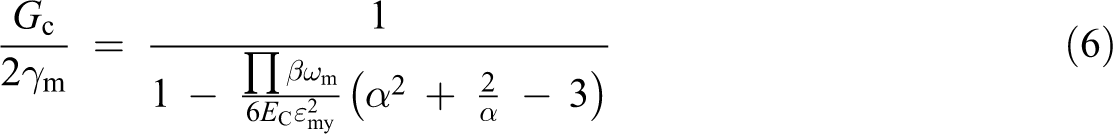
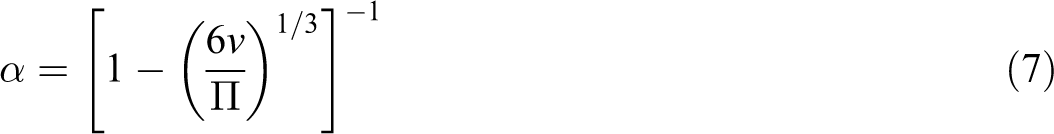

where G c is the fracture energy of the composite (energy per unit area of crack), γ m is the specific fracture surface energy of the matrix = G m/2, G m is the fracture energy of the matrix, v is the particle volume fraction, β is the shape factor of dissipation zone, E c is the composite Young’s modulus, E c* is the Young’s modulus of damaged composite, E m is the matrix modulus, ω m is the volume specific yielding energy of the matrix, and ε my is the matrix yield strain.
As model III is meant for an undamaged composite system where no debonding of fillers from matrix occurs, E c* is replaced with composite Young’s modulus E c in equation (6). The volume-specific yielding energy of the matrix corresponds to area under the stress–strain curve between the yield point and strain at break. The yield point is calculated by the proof stress method corresponding to 0.2% strain in the tensile stress–strain curve. Beyond 0.2% of plastic strain (yield point), the stress–strain plot levels off and plastic deformation of matrix happens. Matrix yield strain was approximated as strain at break due to brittle behavior of the composite. In compliance with these factors, the response portrayed by these models for nano and hybrid composites is shown in Figures 14 and 15.
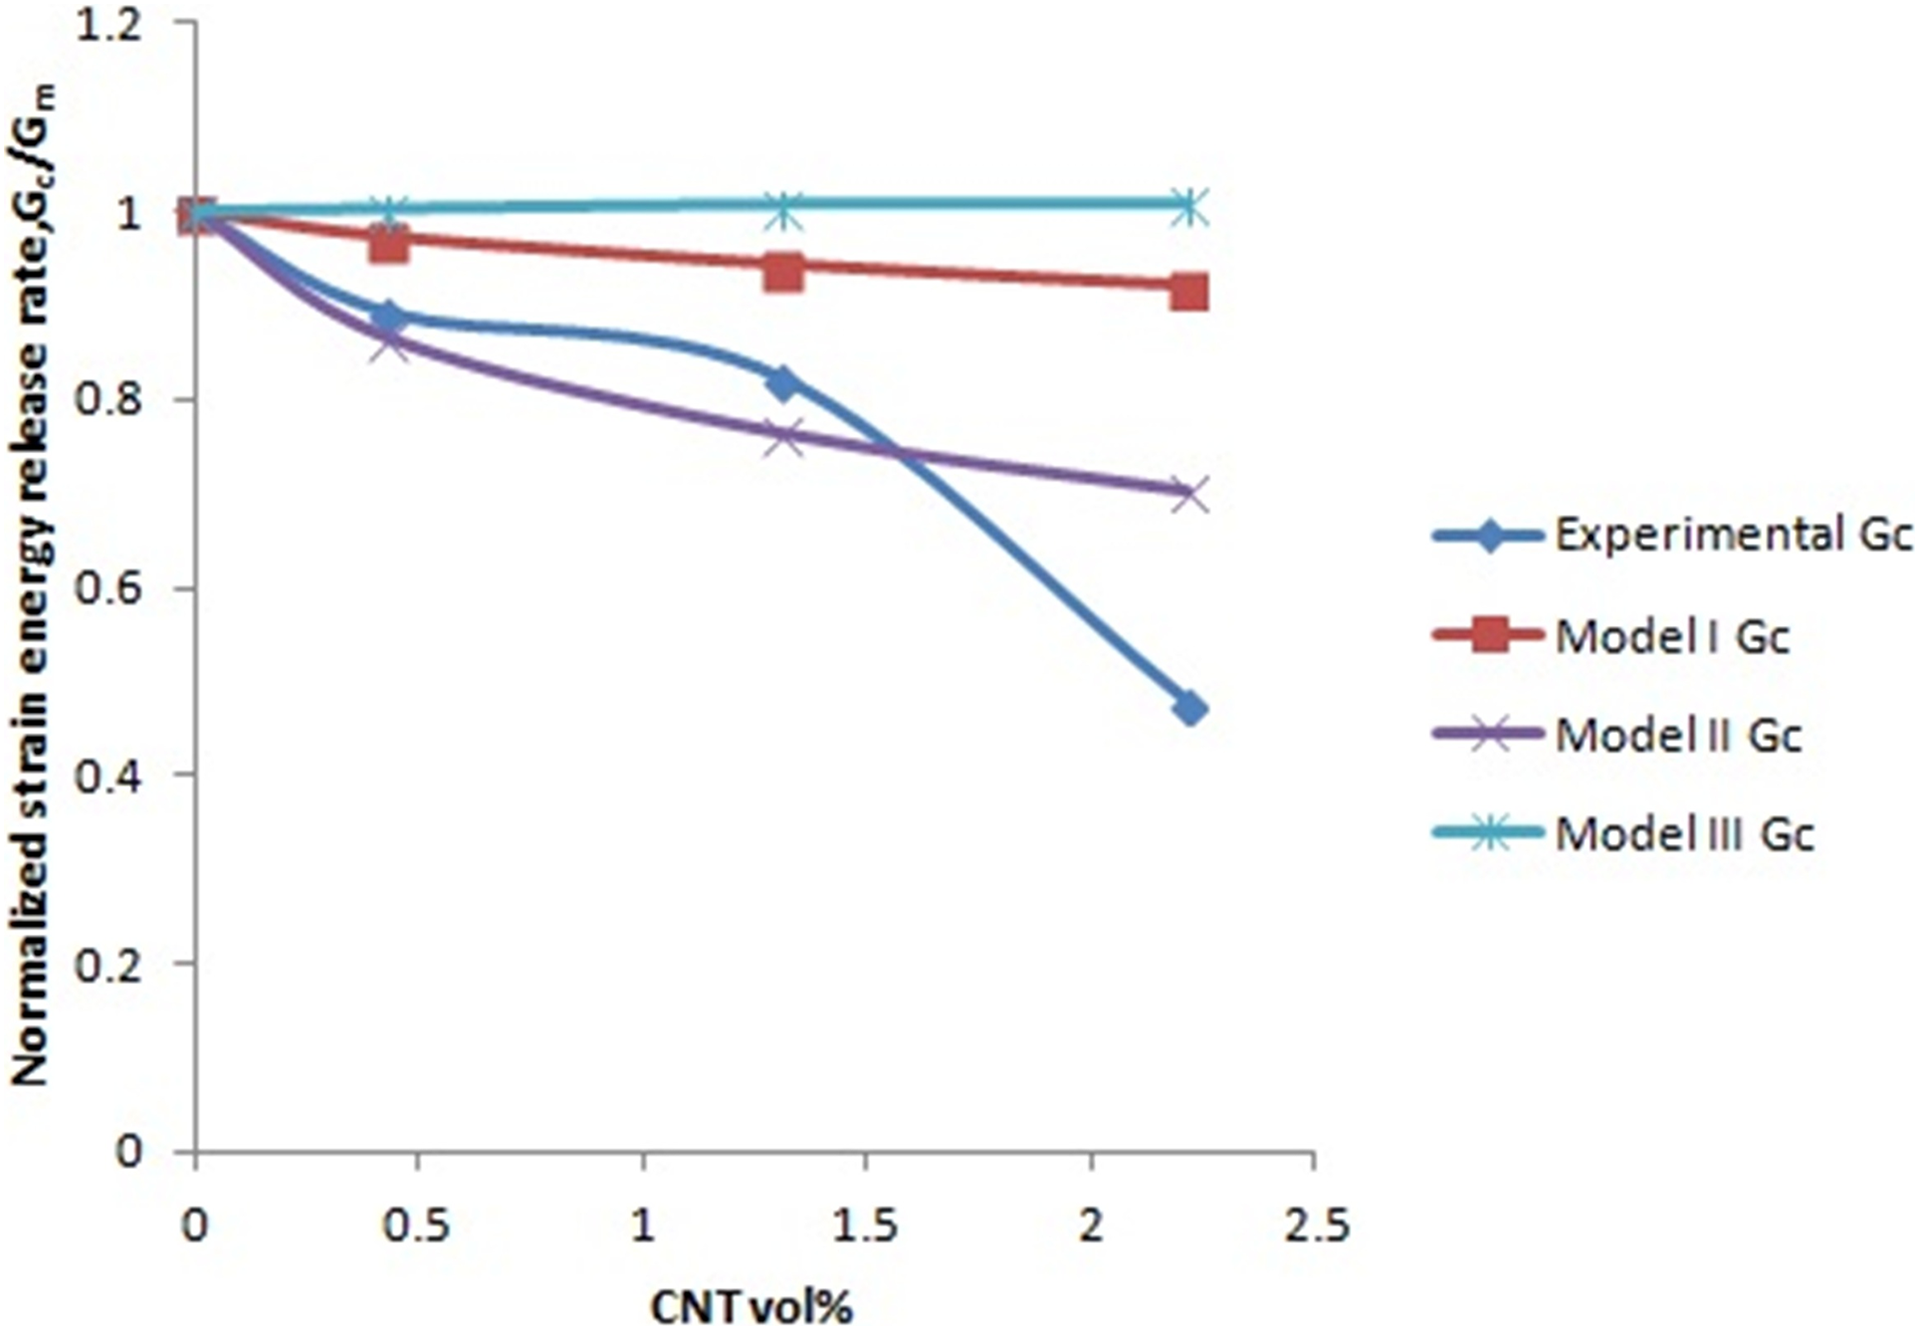
Comparison of normalized experimental G c values and theoretical model values for PP nanocomposites.
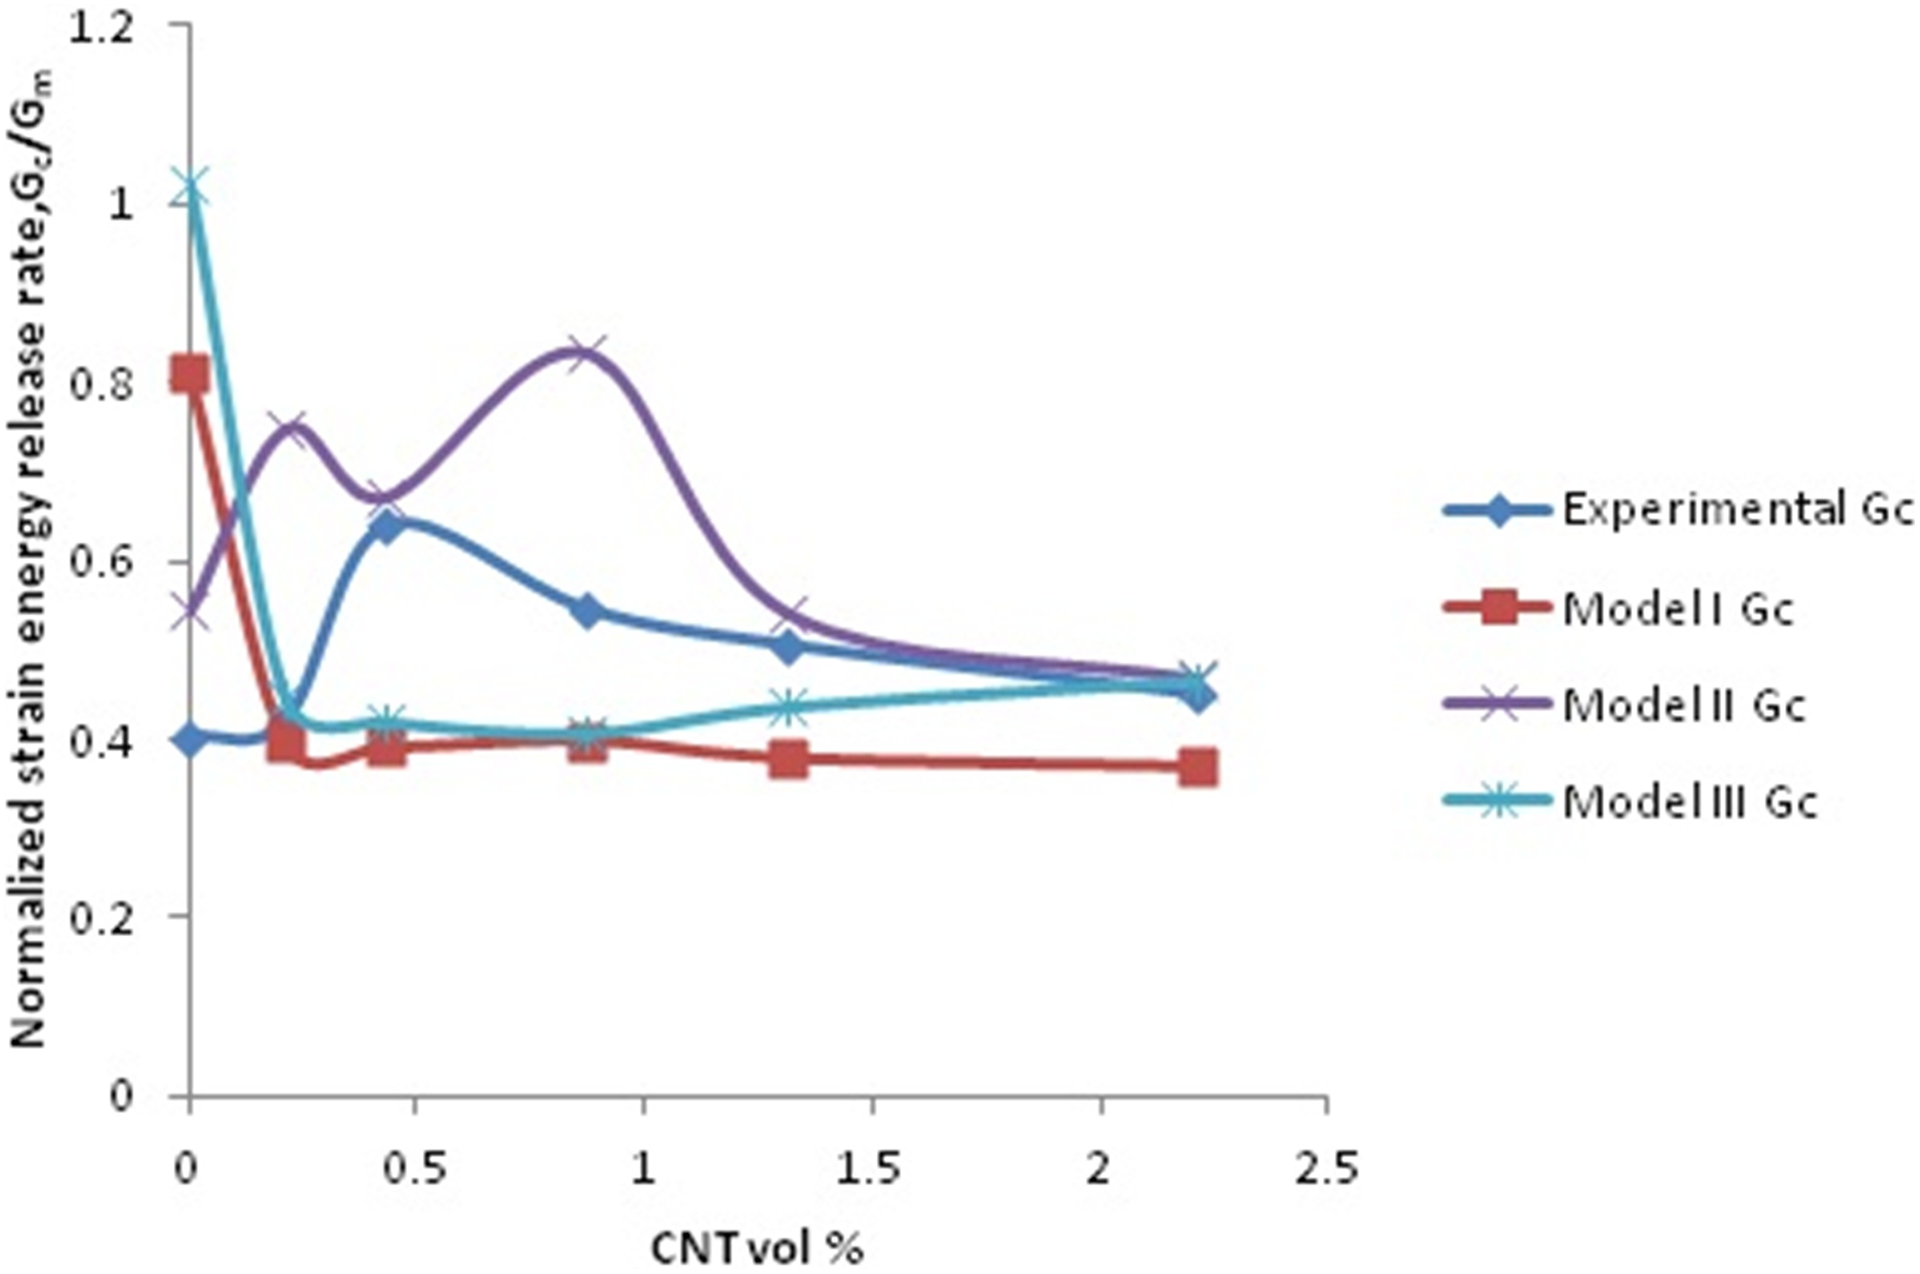
Comparison of normalized experimental G c values and theoretical model values for PP hybrid composites at a fixed glass fiber fraction of 20 wt% and varying CNT fractions. CNT: carbon nanotube.
The comparison between fracture toughness values obtained experimentally and theoretical models explains the influence of crucial parameters like filler loading, matrix/filler adhesion, filler size, and the failure mechanisms. It is well known that composite stiffness firmly depends on filler loading and its geometry. Especially, the inclusion of nanofillers in the matrix offers enormous surface area and contributes to higher modulus. The composite toughness is also dependent on matrix/filler adhesion and efficient stress transfer between filler and matrix. In the case of nanocomposites, G m is the strain energy release rate of PP matrix and accordingly for the hybrid composite G m is the strain energy release rate of PP/glass fiber microcomposite. The nano, micro, and hybrid composites under investigation exhibits semiductile (for nanocomposites) and brittle (for micro and hybrid composites) behavior in comparison with PP (ductile) matrix and considers all failure mechanisms discussed by the models. The approach implemented here is to use simplex models that could capture the main experimental trends without undue complexity. In the current work, for hybrid composites, PP/glass fiber microcomposite is considered as the base matrix instead of PP, to which the nanofiller is added. Apart from the above, for the sake of comparison of experimental and theoretical fracture properties of all the composites prepared, the same models are used.
Using Figure 14, the normalized strain energy release rate obtained experimentally and by different theoretical models could be compared. In model I, the effect of filler loading on fracture resistance is taken to consideration. The trend followed by model II conforms to the experimental results with slight deviation since it takes into account the effect of matrix characteristics, debonding, and matrix yielding. It should be mentioned that large amount of energy is absorbed due to matrix yielding around nanotubes, and this phenomenon continues until the PP chains around CNTs fracture completely and CNTs lose its reinforcing effect. Interestingly, model III deviates from the experimental results appreciably as it brings about the effect of matrix yielding and neglects the effect of debonding.
Figure 15 delineates the response of various theoretical models on the fracture toughness of hybrid composites. It is noticed that model II is in close agreement with the experimental values. Model II also follows the trend as experimental with a slight offset. Models I and III deviate significantly from the experimental results. This clearly discloses that apart from filler loading and matrix yielding of composites, all other fracture mechanisms are dominant in characterizing the fracture toughness of hybrid composites.
Conclusion
The following conclusions could be drawn from the studies on PP/MWCNT nano and PP/GF/MWCNT hybrid composites.
From the microstructure analysis of the nano and hybrid composite, it is inferred that the high shear stresses prevalent during mixing could disperse MWCNTs and glass fibers uniformly in PP matrix up to an MWCNT content of 3 wt%. The tensile strength of the hybrid composite with optimum filler content, namely, PPGC3 increased by 76% when compared to base matrix, whereas the increase in tensile modulus is found to be 127%. The brittle nature of the glass fiber composite could be modified with the inclusion of MWCNTs as evidenced from the increase in elongation at break. SEM analysis of the fracture surface of PPGC3 revealed the various failure mechanisms occurred which are correlated with the fracture toughness properties. The KI value of the nanocomposite PPC3 increased by 12% and KI value of PPG composite increased by 8% with regard to neat PP. Even with 20 wt% of glass fiber loading in PP, the increase in KI has not reached that which was achieved at low loading of 3 wt% MWCNT. In hybrid composites, at the optimum 3 wt% of MWCNTs, superior fracture resistance was attained owing to the crack bridging and interfacial bonding in the presence of multiscale fillers. The synergistic effect of MWCNTs and glass fiber in PP has improved KI of PP from 3.74 MPa m1/2 to 4.36 MPa m1/2 for PPGC3. The theoretical model II used to predict the fracture toughness behavior of hybrid composites is in close agreement with the experimental results since it considers debonding of fillers and matrix yielding in addition to the filler content.
Footnotes
Acknowledgments
The authors thank Sophisticated Testing and Instrumentation Centre (STIC), Kochi, India, and PSG College of Technology, Coimbatore, India, for TEM and SEM analyses. The authors are grateful to Center of Excellence in Advanced Materials and Green Technologies (CoE-AMGT), Amrita School of Engineering, Coimbatore, Amrita Vishwa Vidyapeetham, India for DSC analysis.
Declaration of Conflicting Interests
The author(s) declared no potential conflicts of interest with respect to the research, authorship, and/or publication of this article.
Funding
The author(s) received no financial support for the research, authorship, and/or publication of this article.