
Abstract
Mineral fillers like talc and mica are commonly used in the plastic industry because of their tendency to alter the properties of thermoplastic materials. Polypropylene (PP)-talc (PTC), PP-mica (PMC), and PP-talc/mica hybrid composites (PHC) were prepared. Results indicated that filler particle size, type, and content greatly influence the mechanical and rheological properties of the composites. Shear viscosity decreased with the increase in shear rate. At 40°C, an increase of approximately 120% in storage modulus (E′) was observed in PMC composites. C parameter increased, whereas reinforcing efficiency (r) decreased with the increase in filler loading. Percent elongation of each type of composites decreased with the increase in filler loading. Tensile modulus of PTC composite increased significantly by 103% (571 MPa) at 20% loading of talc, whereas for PHC and PMC composites, increase of 93% (543 MPa) and 81% (511 MPa) was observed. Flexural modulus also increased considerably by 88% (2413 MPa), 80% (2313 MPa), and 62% (2084 MPa) of PTC, PHC, and PMC composites at 20% filler loading.
Introduction
In the past decade, the polymer industry has witnessed increasing interest in the use of fillers. Fillers greatly enhance the compressive strength, abrasion resistance, thermal stability, dimensional stability, impact resistance, and tensile when incorporated into polymers matrix. 1 –4 Fillers extensively studied include calcium carbonate (CaCO3), 5 –7 talc, 8 –10 rice husk ash, 11 kaolin and mica, 12 –15 and organic fillers. 16,17 Talc, mica, and kaolin are used to enhance the stiffness and strength of filled plastics, whereas CaCO3-filled grades are reported to have higher impact strength.
Polypropylene (PP) is one of the most important polymers that have a wide range of applications. Presently, there has been an increase in the use of filled PP in electrical and automotive engineering. This is mainly due to the excellent stiffness property that PP exhibits and which enables it to substitute conventional materials in demanding engineering applications. 18,19 Afroze et al. 20 studied the electrical properties of PP reinforced with graphite and talc and found that graphite-filled PP composites enhanced electrical properties than talc-filled PP composites.
Thomas et al. 21 reported the effect of the incorporation of a compatibilizer on the blends of PP and thermoplastic polyurethane and the effect of mica as filler to enhance the mechanical properties. Abdul Kader and Bhowmick. 22 studied the effects of fillers on the mechanical, dynamic mechanical, and aging properties of rubber–plastic binary and ternary blends derived from acrylic rubber, fluorocarbon rubber, and multifunctional acrylate.
Several studies have been published where the effect of dual fillers on polyolefin’s matrix has been investigated. 23,24 Sreekanth et al. 25 studied the effects of fillers such as mica and fly ash, at varying concentrations, on the mechanical, thermal, electrical, rheological, and morphological properties of polyester thermoplastic elastomer. Razak et al. 26 summarize the effect of various inorganic fillers such as alumina (α-Al2O3), CaCO3, silica (SiO2), and feldspar on the flammability behavior of PP composites. Vincent et al. 27 reported the properties of two PP hybrid composites (PP-calcium carbonate/mica and PP-calcium carbonate/talc) at 40% filler loading. PP-CaCO3/mica composites showed better mechanicals and flammability than PP-CaCO3/talc composites. Huang et al. 28 investigated the effect of individual fillers (glass fibers vs. talc) and combined fillers (talc and glass fibers) on the morphological, mechanical, and thermal expansion properties of the filled high-density polyethylene composites as potential shell material for coextrude natural fiber plastic composites /wood plastic composites (NFPC/WPC) composites.
Many studies have been done on PP hybrid filler system or with single mineral. Majority of the studies were focused on studying the effect of fillers on the mechanical, morphological, flammability properties, and so on, whereas the rheological properties have not been studied in detail. In this study, we investigated the effect of talc, mica, and their blend as fillers on the rheological, morphological, and mechanical properties of PP taking in account their particle. Talc and mica were varied as 5%, 10%, and 20% by weight in PP matrix.
Experiment
Material
IndianOil Corporation Limited isotactic polypropylene (iPP), homopolymer (MFI-11g·10 min−1 at 230°C, 2.16 kg) was used for the study. Mica and talc having average particle size of 37 microns and 6 microns were used for composite preparation.
Composite preparation
Three different types of composites, PP with mica (PMC), PP with talc (PTC), and PP with talc/mica hybrid composites (PHC), were prepared as shown in Table 1. The content of the fillers (talc and mica) in the composite, that is, PMC, PTC, and PHC, was varied as 5%, 10%, and 20% by weight in iPP. Hybrid composite contained talc and mica in equal weight ratio. M/s Labtech Engineering Company Ltd, Thailand twin-screw extruder (length to diameter ratio, 40:1) was used for melt mixing of the fillers with iPP at 230°C and a screw speed of 150 r min−1 under N2 atmosphere. The extrudates were then pelletized and dried before injection molding. Various test specimens were prepared on Toshiba Aswa 60/320-310 injection molding machine at 230°C and at a mold temperature of 60°C.
TPP Talc/Mica composites: composite name, filler type and proportion.
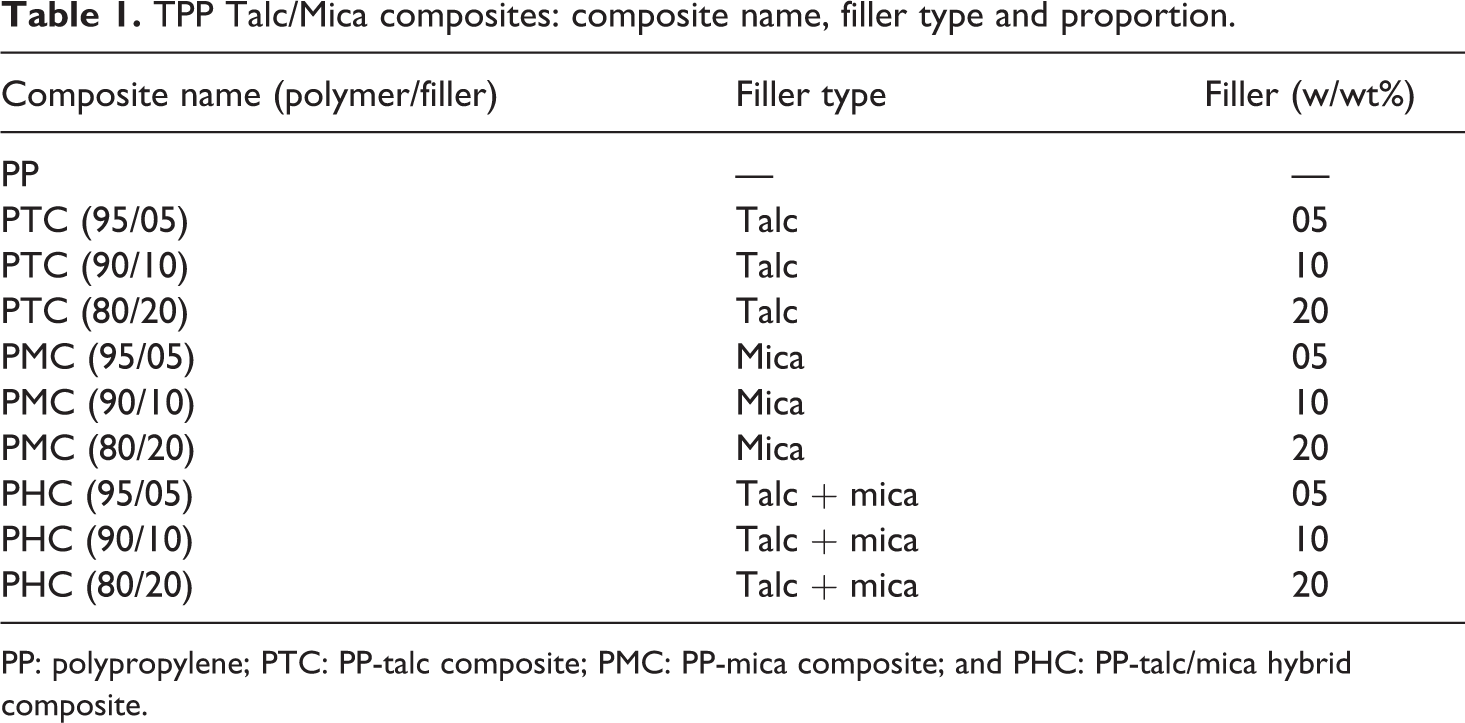
PP: polypropylene; PTC: PP-talc composite; PMC: PP-mica composite; and PHC: PP-talc/mica hybrid composite.
Characterization
Particle size distribution
Particle size distribution of talc and mica was done on Malvern Mastersizer MU-2000, UK using water as solvent for dispersion. The machine speed was 2000 r/min.
Morphological characterization
Surface topography of interface and fractured surfaces of the composites were scanned with the aid of Zeiss SUPRA55 field emission scanning electron microscope (FE-SEM), Germany. Cryo-fractured Izod impact specimens were surface-metalized by sputter coating with evaporated gold metal (4 nm in thickness) before analyzing by FE-SEM at accelerating voltage of 1 kV.
Mechanical properties
Tensile and flexural measurements (three-point bending system) of the specimens were done on Universal Testing Machine (TIRA TEST 2710, TIRA Instruments, Germany) as per ASTM D638 (type I) and D790. Crosshead speed for tensile and flexural measurements was kept as 50 mm min−1 and 1.3 mm min−1. Notched Izod impact strength test and notch preparations as per ASTM D256 were conducted using Ceast Resil impact tester and notch cutter, Italy. For tensile and flexural testing, five samples were tested for each composition, whereas for Izod impact test 10 samples for each composition were tested and the average value is reported. All the injection molded specimens were conditioned as per ASTM D618 (standard refers to conditioning of plastics samples at 23°C/50% RH/min 40 h prior to testing).
Rheological properties
Malvern make dual barrel Capillary Rheometer (RH7), UK was used to study effect of shear rate on the shear viscosity at 230°C. Shear rate during experiments was varied from 50 to 3000 (s−1). Viscoelastic properties of the composites in solid state were studied using a dynamic mechanical analyzer (DMA). DMA scans were recorded using Q 800 from TA instruments, USA in the three-point bending mode with rectangular sample (thickness 3 mm, width 11 mm, and length 30 mm) at a frequency of 1.0 Hz. The strain amplitude was 15 µm, the static force was 0.01 N, and the temperature sweep was in the range of −50°C to 120°C at a heating rate of 3°C min−1.
Results and discussions
Particle size distribution
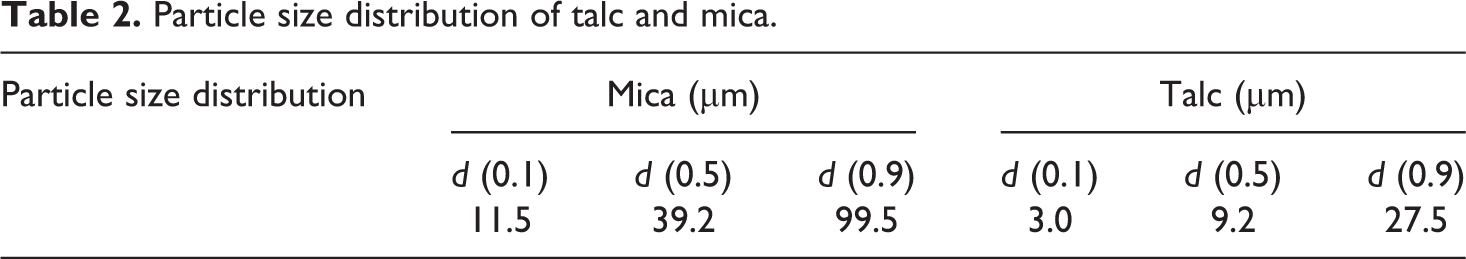
Table 2 shows the particle size distribution of mica and talc. It was found that mica has broader particle size distribution than talc. Particle size varied from 11.5 microns to 99.5 microns for mica, whereas for talc particle size varied from 3 microns to 27.5 microns. Average particle size (d (0.5)) of mica was approximately 76% bigger than talc. Different particle size and distribution yield composites with different set of properties.
Particle size distribution of talc and mica.
Morphological properties of PP composites
SEM image of mica and talc particles is shown in Figure 1(a) and (b). Large size mica particles can be observed as compared to talc particles. Layers of flaky talc sheets are clearly observed in micrograph Figure 1(b). Figure 2 shows the SEM micrographs of the PP composites. Figure 2(a) to (c) pertaining to PMC composites shows the deformed surface indicating lower adhesion and poor dispersion of mica particles in PP matrix. Coarser particle size of mica could have played pivotal role in lower dispersion and inhomogeneity in PP matrix. Better smooth surface and lower deformation was observed in SEM micrographs of PTC and PHC composites.
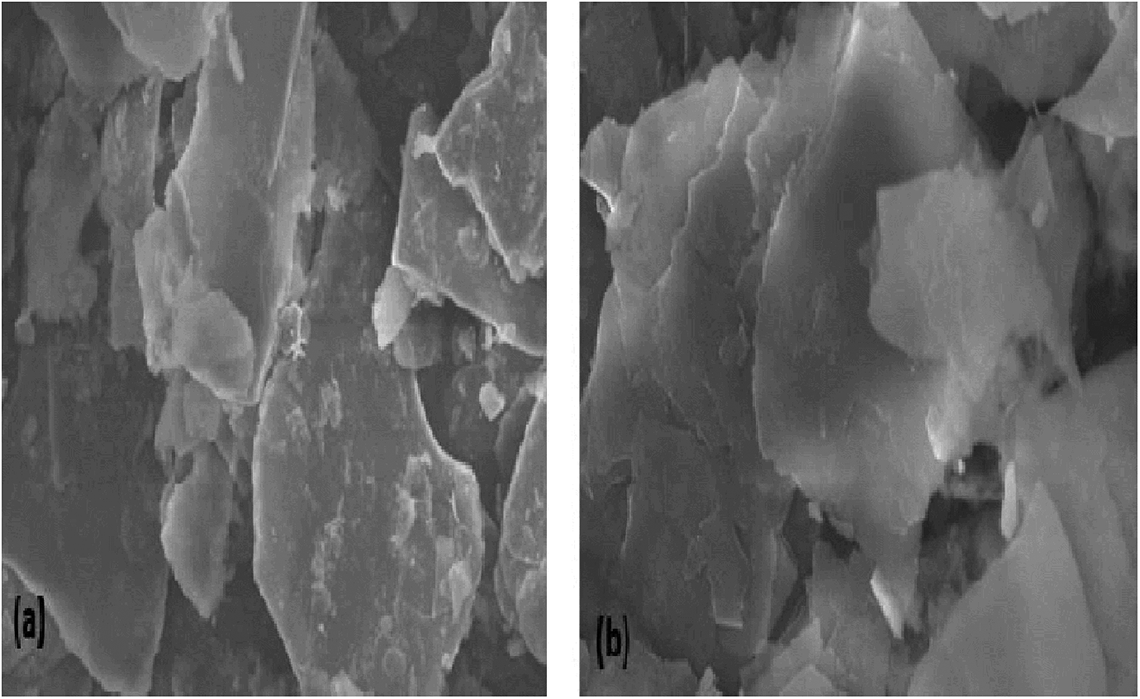
SEM micrographs of (a) mica and (b) talc. SEM: scanning electron microscope.
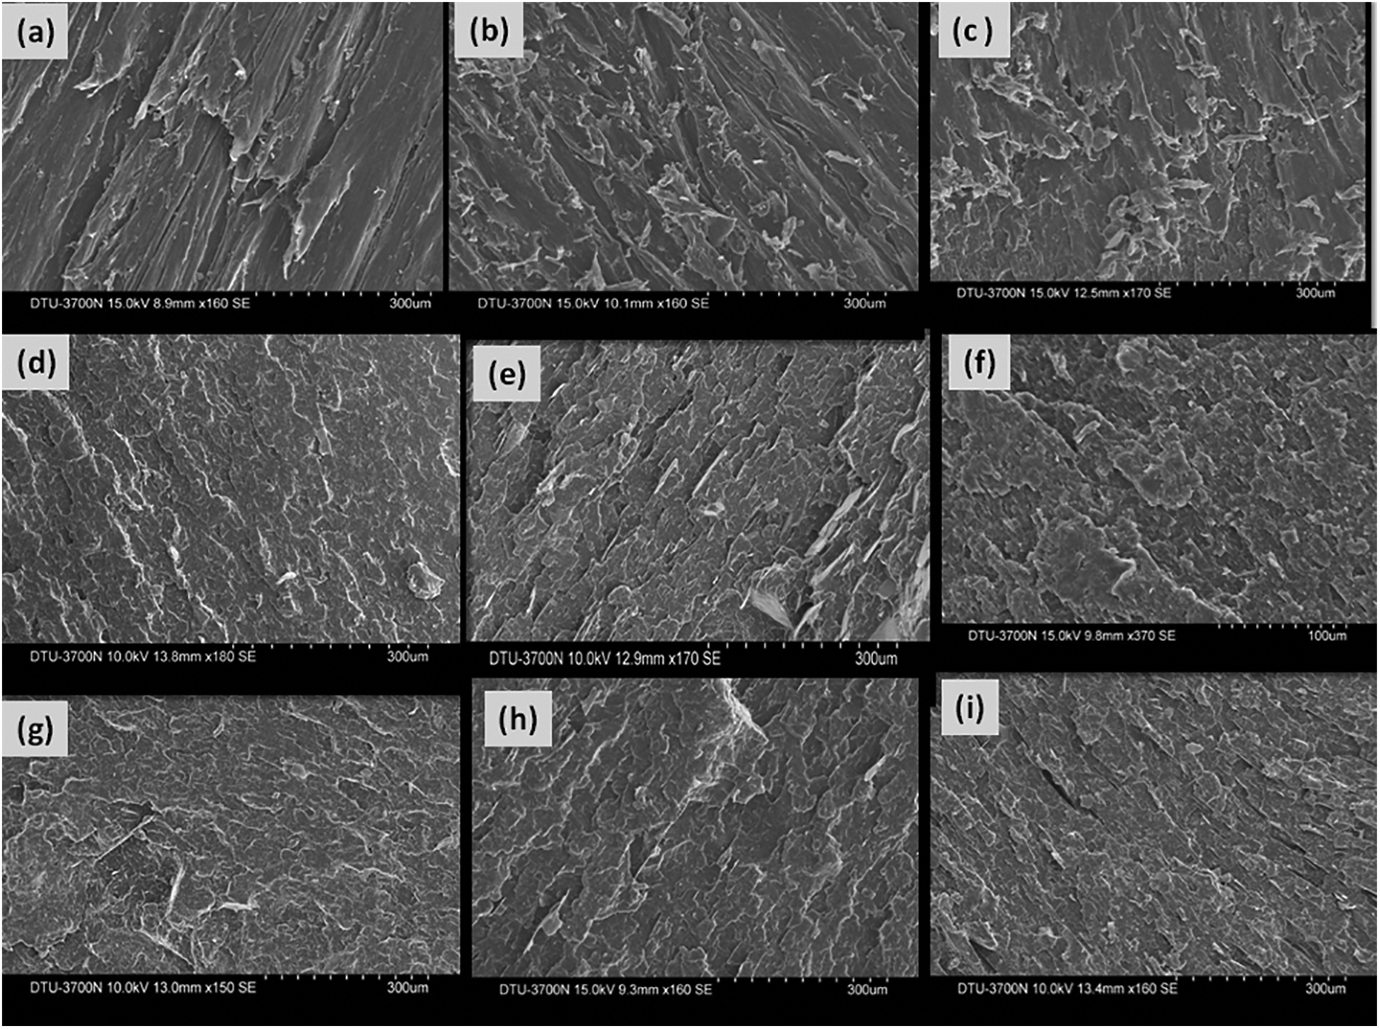
SEM micrographs of PP composites: (a) PMC-5%, (b) PMC-10%, (c) PMC-20%, (d) PTC-5%, (e) PTC-10%, (f) PTC-20%, (g) PHC-5%, (h) PHC-10%, and (i) PHC-20%. SEM: scanning electron microscope; PP: polypropylene; PTC: PP-talc composite; PMC: PP-mica composite; and PHC: PP-talc/mica hybrid composite.
Rheological—shear viscosity of PP composites
Figure 3 shows the effect of shear rate on shear viscosity of PP and PP composites. Shear viscosity of PP and PP composites decreased with the increase in shear rate; however, the viscosity of each composite remained on the higher side as compared to the viscosity of PP. This can be attributed to the substitution of PP matrix flexible chains with more rigid filler particles. 29,30 Particle size and shape play a significant role. 31,32 As the filler loading was increased, the mobility of the PP chains was significantly affected by the overloading of filler particles. Viscosity of PMC composite was observed to be higher followed by PHC and PTC composites, due to different particle structure and size of talc and mica. Talc is made up of elementary sheets that are stacked up on one another like flaky pastry, and the binding forces are weak therefore these sheets slide easily upon application of force, whereas mica structure is composed of polymerized sheets of silica and these are cross-linked firmly with each other. Higher particle size and rigid layered structure resulted in higher viscosity of PMC composites at higher loading of mica.
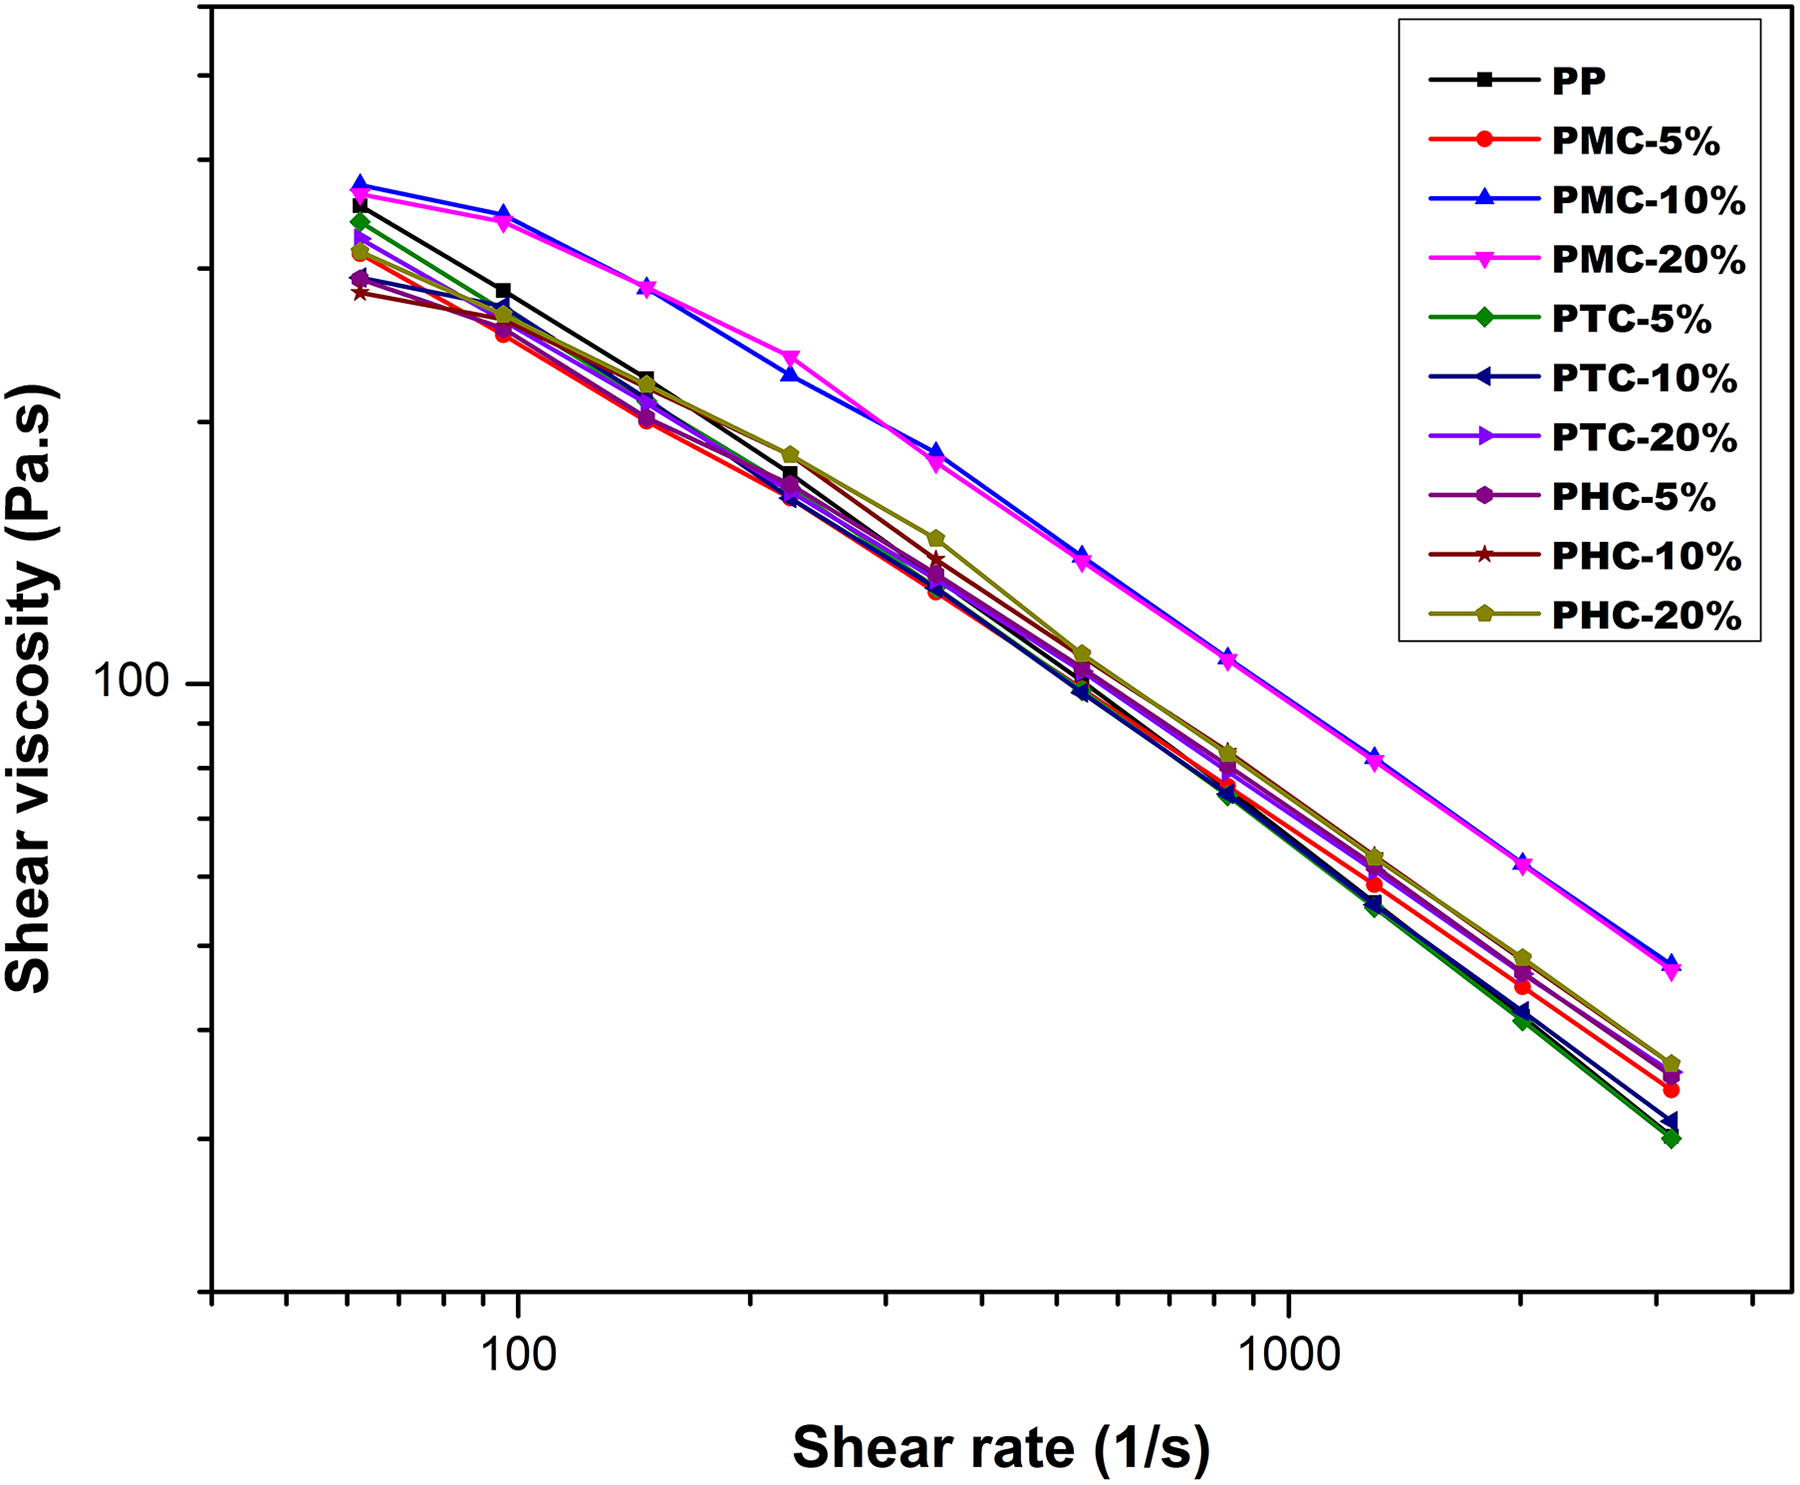
Plot of shear viscosity versus shear rate of PP and PP composites.
Rheological—viscoelastic properties of PP composites
In a general way, rheological properties of filled polymer system depend on several parameters, the size, aspect ratio, and geometry of the filler, its weight percentage, dispersion of the particles in the matrix, the adhesion between matrix and filler, and so forth.
The storage modulus (E′) was found to decrease with the increase in temperature, entire range for PP and all the PP composites which may be attributed to the increased thermal motion of side chain segments of the polymer on the increase in thermal energy. In the temperature range of 0°C to 120°C, storage modulus (E′) value of PP and all PP composites decreased sharply due to the enhanced amorphization, whereas at temperature exceeding 120°C, storage modulus (E′) value of PP and all PP composites was nearly equal, which is because at this temperature the polymer matrix is almost in the molten state.
Figure 4 shows the variation of storage modulus (E′) with temperature obtained from solid state dynamic mechanical analyzer. Storage modulus was found to increase with the incorporation of filler irrespective of their size and nature. PP hybrid and mica composites (PHC and PMC) having 20% loading of filler showed maximum increase in the storage modulus. At 40°C, E′ value for PP, PMC-20%, and PHC-20% was 1372 MPa, 3130 MPa, and 3156 MPa; increase of approximately 130% was observed, which attributes to higher stiffness in the composite.
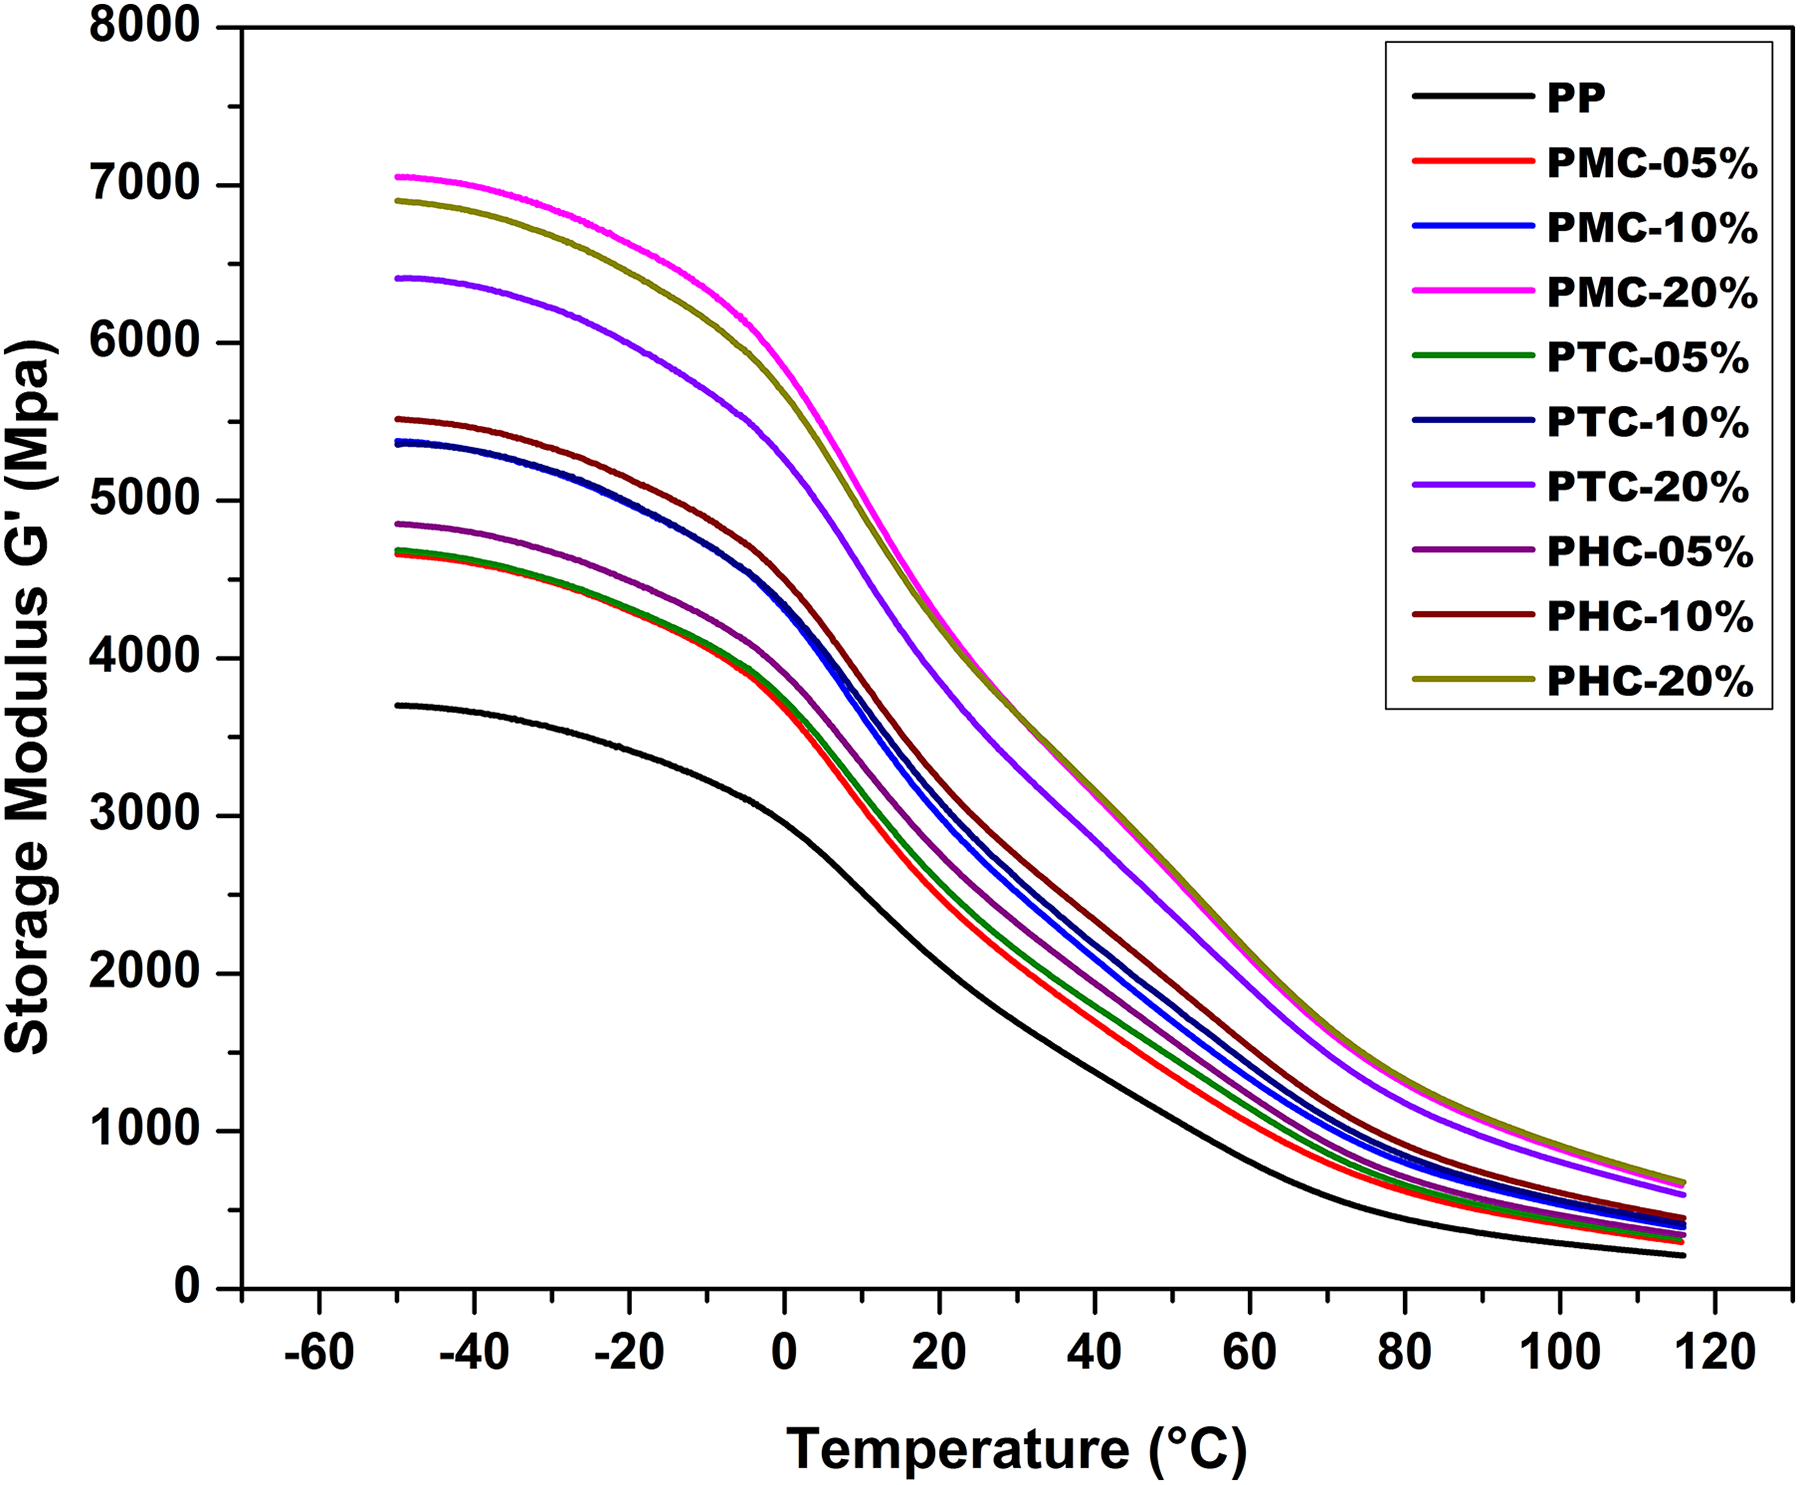
Plot of storage modulus (E′) versus temperature for PP and PP composites.
Polymer–filler adhesion governs the dynamic mechanical properties of polymer composites. Therefore the polymer–filler interactions were also evaluated by calculating different theoretical parameters like coefficient of reinforcement (C parameter) and reinforcing efficiency (r) from DMA results as reported in previous literature. 33,34
Coefficient of reinforcement (C)
The effectiveness of fillers (talc/mica) on the moduli of PP/talc, PP/mica and PP/talc/mica composites can be represented in a better way by the coefficient of reinforcement (C) in the following equation
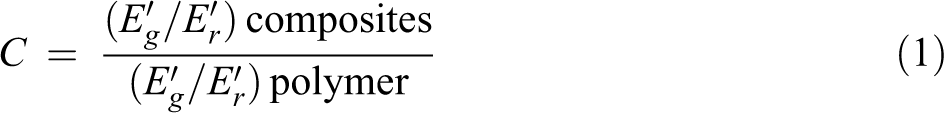
where
As reported, higher “C” value illustrates the lower effectiveness of filler. The values obtained from different content of talc and mica in PP composites is given in Table 3. It is clear from the table that the value of “C” parameter increased as the loading of fillers. Higher “C” in PP composites would be due to reinforcing effect of the fillers used in higher percentage as compared to the reported literature.
C parameter and reinforcing efficiency (r) for the PP composites studied.
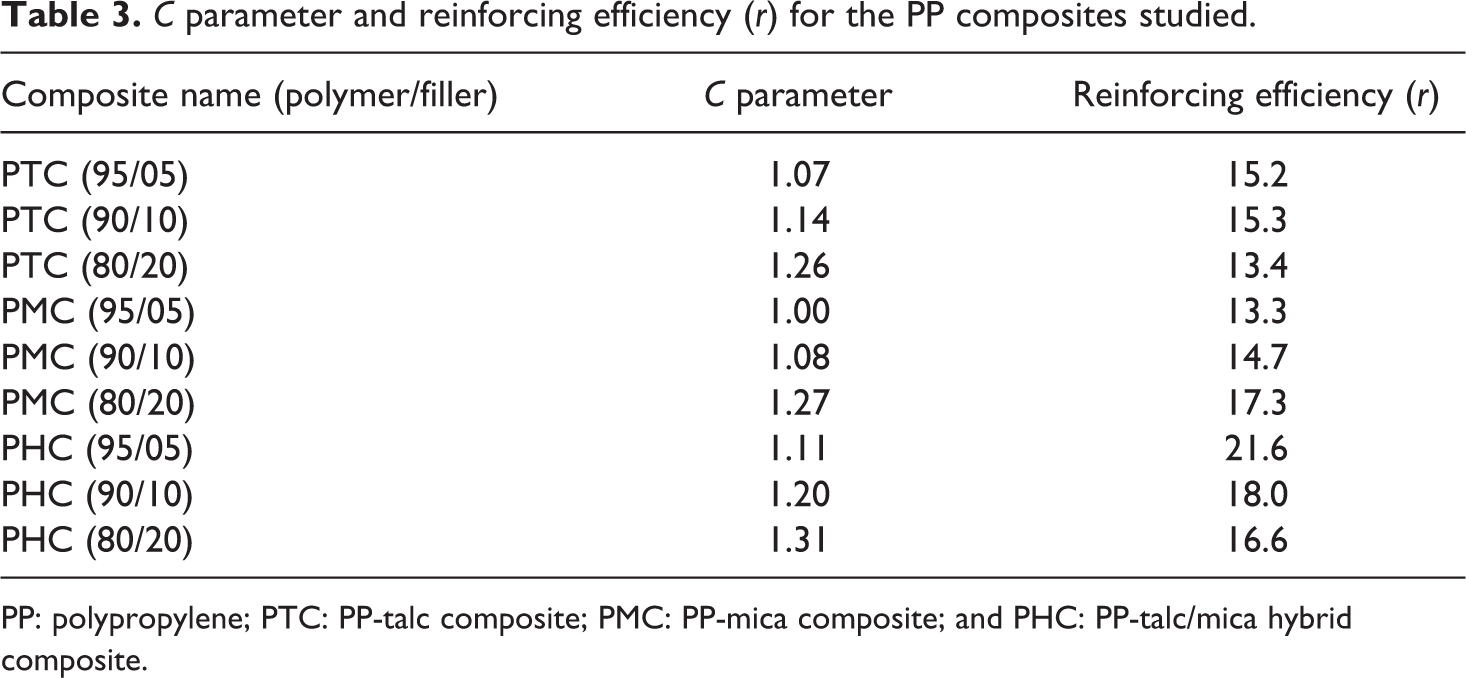
PP: polypropylene; PTC: PP-talc composite; PMC: PP-mica composite; and PHC: PP-talc/mica hybrid composite.
Reinforcement efficiency factor “r”
To further explain maximum effectiveness of filler in the polymer matrix, the reinforcement efficiency factor in composites was calculated using Einstein model (equation (2)).

where E c and E m are the storage modulus of composite and matrix, respectively. V f is the filler volume fraction and “r” is the reinforcement efficiency factor. Reinforcing efficiency depends on the volume fraction and dispersion of filler in the polymer matrix. Table 3 shows the reinforcing efficiency factor as a function of filler content (in wt%) on PMC, PTC, and PHC composites. Value of “r” was found to be maximum for PHC composites at 5% loading (21.6) followed by 18.0 at 10% loading. “r” value of PMC composite at 20% loading (17.3) was found to be close to “r” value of PHC composite at 10% loading (18.0). For PMC composites, the “r” value showed increasing trend with increase in mica loading, whereas a reverse trend was observed in “r” value of PHC composites which decreased with increase in talc/mica loading. High “r” value of 21.6 of PHC composite at 5% loading indicates good synergy between the fillers at that particular loading.
The loss modulus spectrum (E″) in temperature range between −50°C and 130°C is shown in Figure 5. The curve reveals the presence of the two following transitions: The peak at about 9°C corresponding to the glass transition temperature (Tg) of PP and PP composites. The shoulder on the curve at about 50°C, after the glass transition temperature. This shoulder is indeed related to αc
transition.
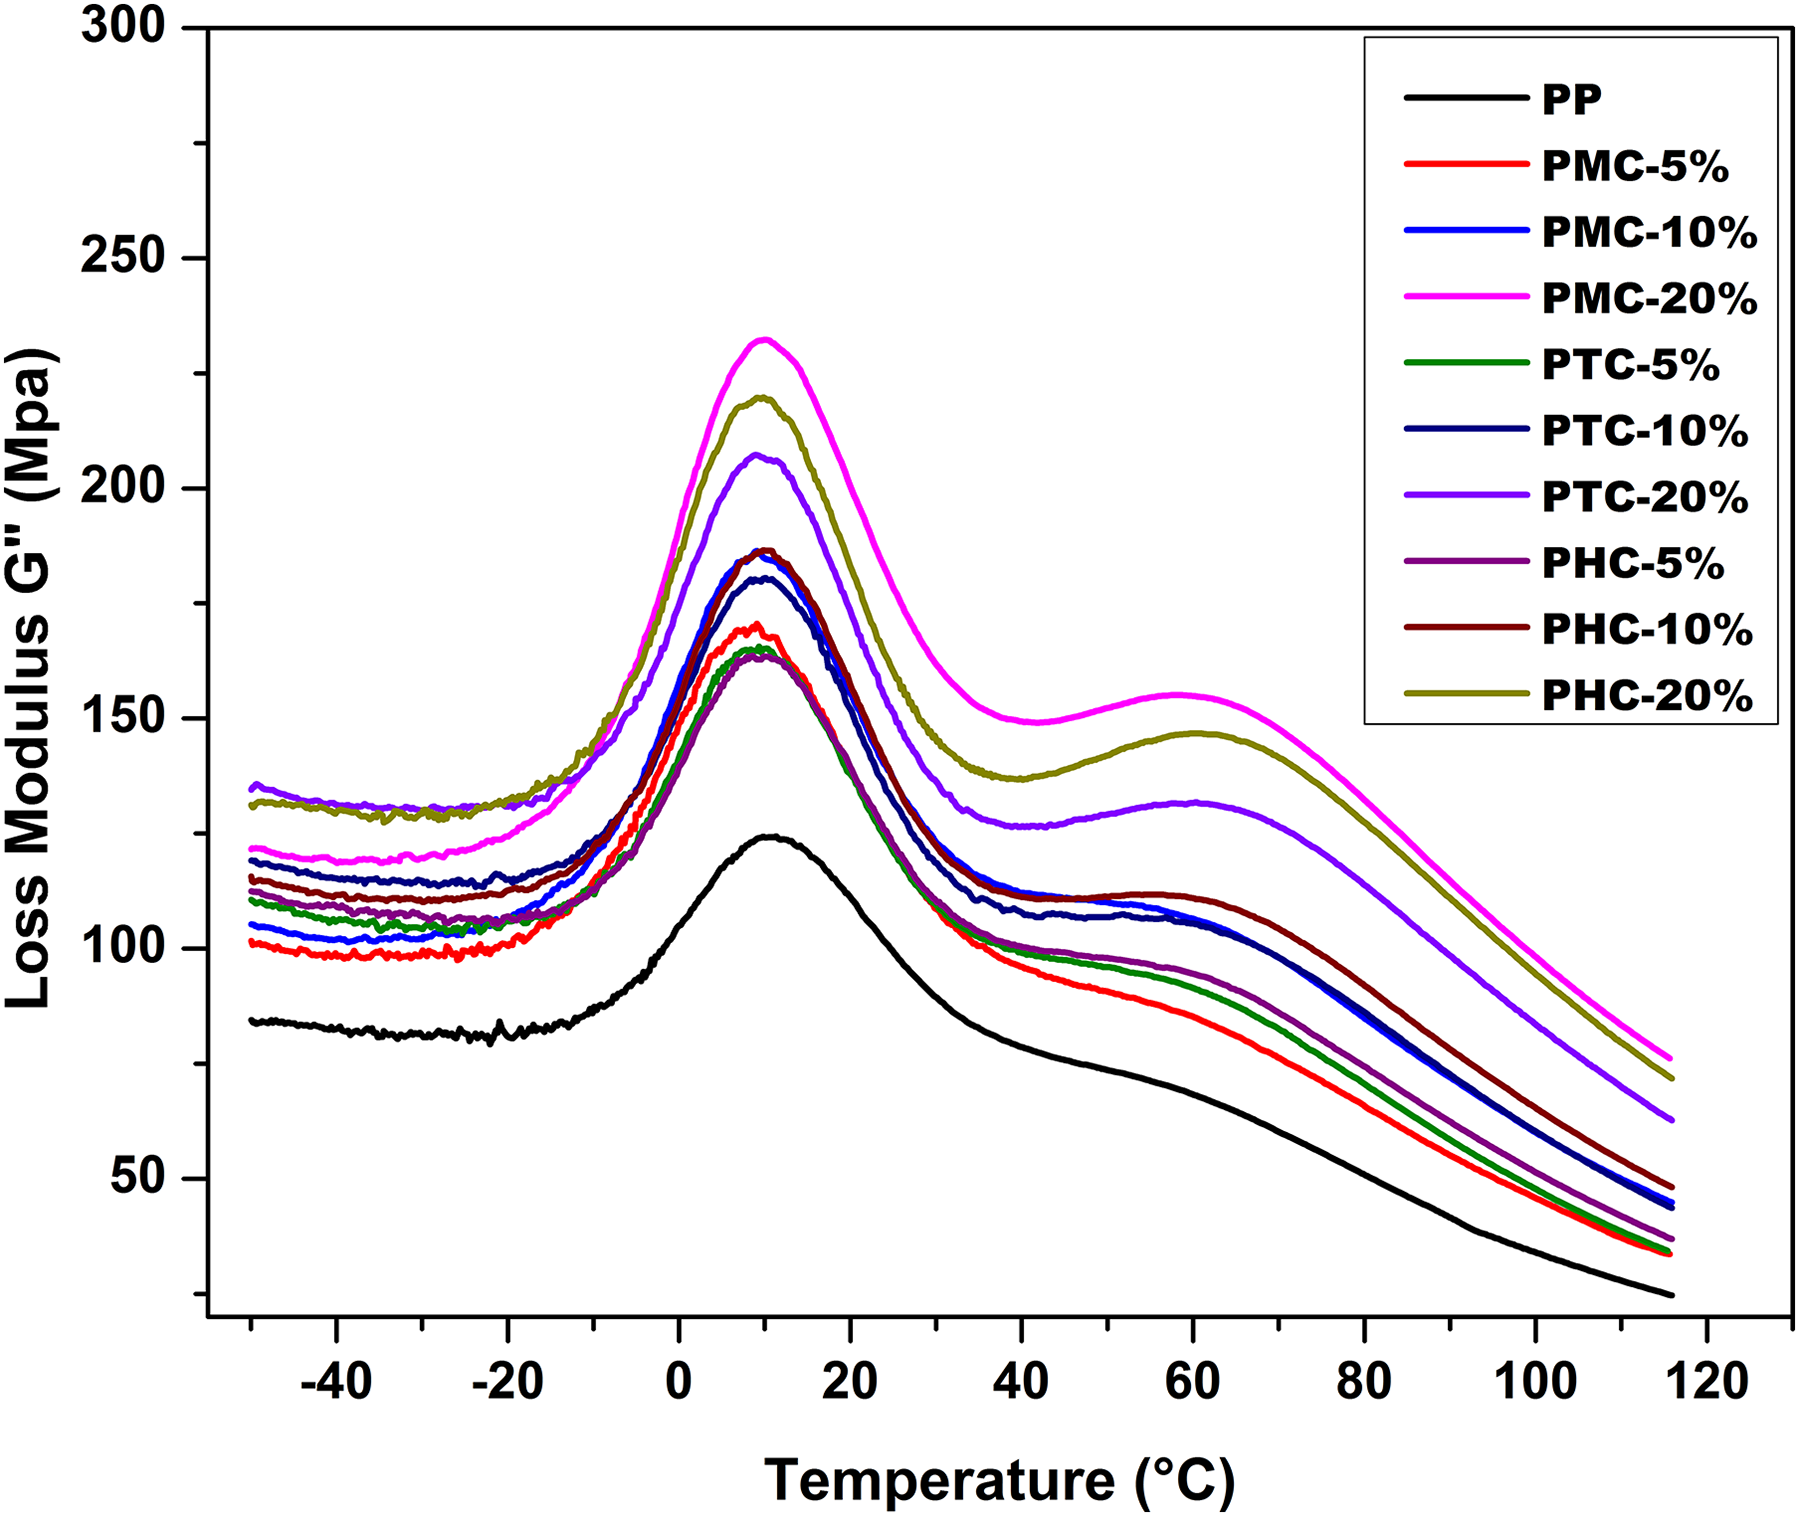
Plot of loss modules (E″) versus temperature of PP and PP composites.
There are two peaks which correspond to two different transitions as reported α and αc . α transition is generally related to glass transition temperature, which is not much affected with the addition of fillers in PP matrix. 36 It is about 10°C for all the samples. αc transition relates to the chain mobility near the crystalline surface, for unfilled PP, it was at approximately 50°C which increased to almost 60°C for filled PP. αc transition was more predominant in PHC, PTC, and PMC composites at 20% filler loading. This behavior is probably due to the high concentration of filler particles in the boundary region between the amorphous and crystalline phases. In fact during crystallization, the filler particles will be essentially pushed out of the crystalline phase. The high concentration of filler particles in the boundary region makes the chain mobility difficult. So it is necessary to supply more energy. αc , which is characteristic of this region, will be then affected, which was the reason for lower shoulder peaks for PP composites with lower filler loadings. Therefore, it seems that increase in the filler loading is the main cause of the broadening of the second transition region.
For loss modulus (E″), Figure 5, the trend of variation was similar to the E″ with maximum increase only at 20% filler loading. Maximum increase in E″ was observed with PMC-20% followed by PHC-20%, and PTC-20%. Increase in the E″ indicates the energy dissipation ability of PP composites increased with the addition of filler loading. From 40°C to 80°C, a shoulder appeared which became more pronounced with the increase in filler loading. Shoulder broadness and higher peak intensity was highest in PMC-20% composite. As discussed, this phenomenon is attributable to the αc relaxation of PP, which is associated with shearing processes between specific crystalline planes or paracrystal–crystal transitions from the smectic phase to the monoclinic system.
Damping increases with temperature. The tan δ curve of the PP, PMC, PTC, and PHC composites (Figure 6) presents two small peaks (shoulders) corresponding to α and α c. It was observed that tan Ϩ values decreased with the increase in filler loading irrespective of the filler loading. The damping phenomenon of filled polymers is very complex. It is related to filler–filler friction, filler–polymer friction, and the conformational and morphological change of the polymer in contact with the filler. 35 The glass transition temperature (T g) of PP composites decreased with the incorporation of fillers as compared to PP, which is due to disruption in the polymer chain packing (table 4). Increase in the filler content resulted in the filling up of the free volume of the polymer and more dense packing, thus resulting in decrease in the glass transition temperature (T g). Talc particles due to its molecular structure were able to fill the free volume better as compared to mica particles, therefore the glass transition temperature (T g) of PTC and PHC composites was lower than PMC composites.
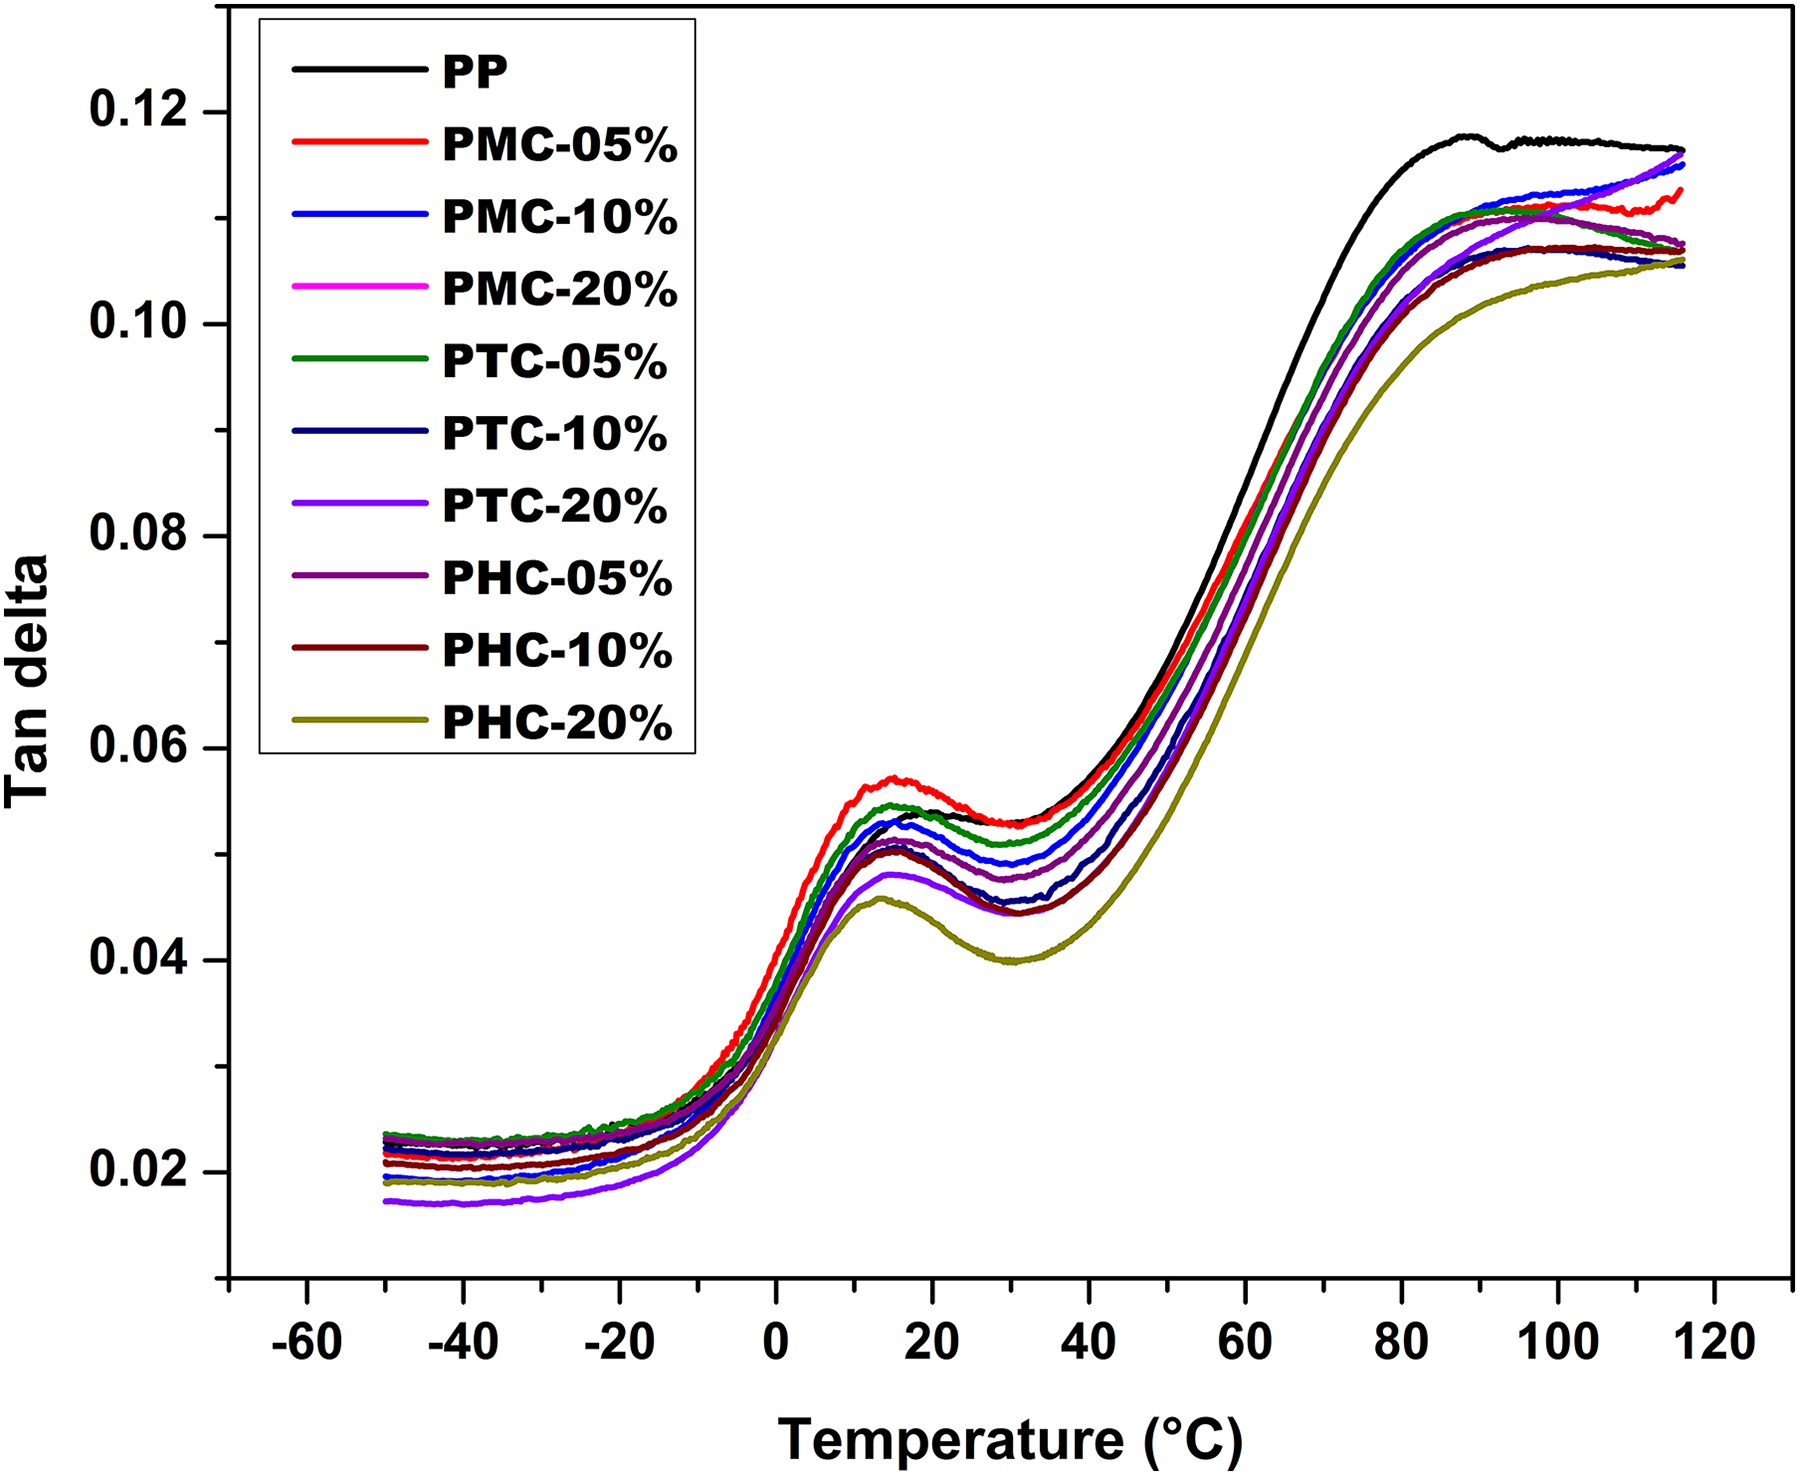
Plot of tan δ versus temperature for PP and PP composites.
T g values for the PP composites studied.
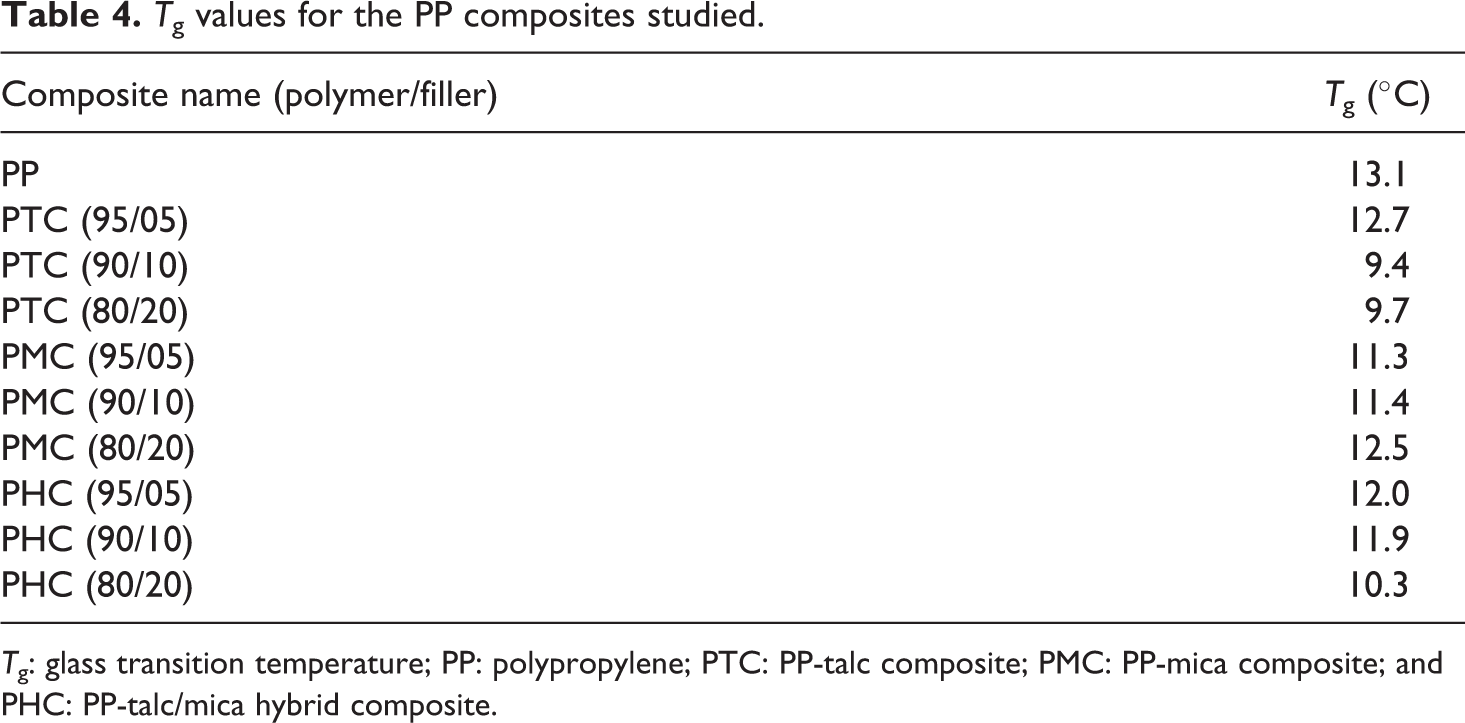
T g: glass transition temperature; PP: polypropylene; PTC: PP-talc composite; PMC: PP-mica composite; and PHC: PP-talc/mica hybrid composite.
Mechanical properties
Tensile strength of the PMC composites increased marginally initially upto 10% mica loading but reduced with further loading (Figure 7). Tensile strength of PTC and PHC composites increased to a maximum of 14% (36.8 MPa) at 10% and 20% loading of fillers, respectively. Higher tensile strength of PTC and PHC composites as compared to PMC composite indicates better filler–matrix interactions, which also helps in transferring stress from the matrix to the filler resulting in higher load bearing capacity during external loading of composite. Rigid molecular structure of mica with larger particle size as compared to lower particle size and flaky molecular structure of talc could have contributed to better stress transferring phenomena in talc-based composites.

Plot tensile strength versus filler loading of PP and PP composites.
All composites exhibited sharp decrease in elongation at break with the increase in the filler loading (Figure 8). Percent elongation decreased approximately by 28% at 5% filler loading to 50% at 20% filler loading. On comparison within the PP composite, for PTC and PHC composites, decrease in percent elongation was observed to be 30%, whereas in PMC the decrease was approximately 25%. Incorporation of filler in PP matrix decreased the ductility of the composite resulting from the decrease in mobility of the polymer chains. This reduction of mobility of chains reduces stress transfer of composite ultimately, reduces the extent of elastic response of the material, and thus percent elongation.
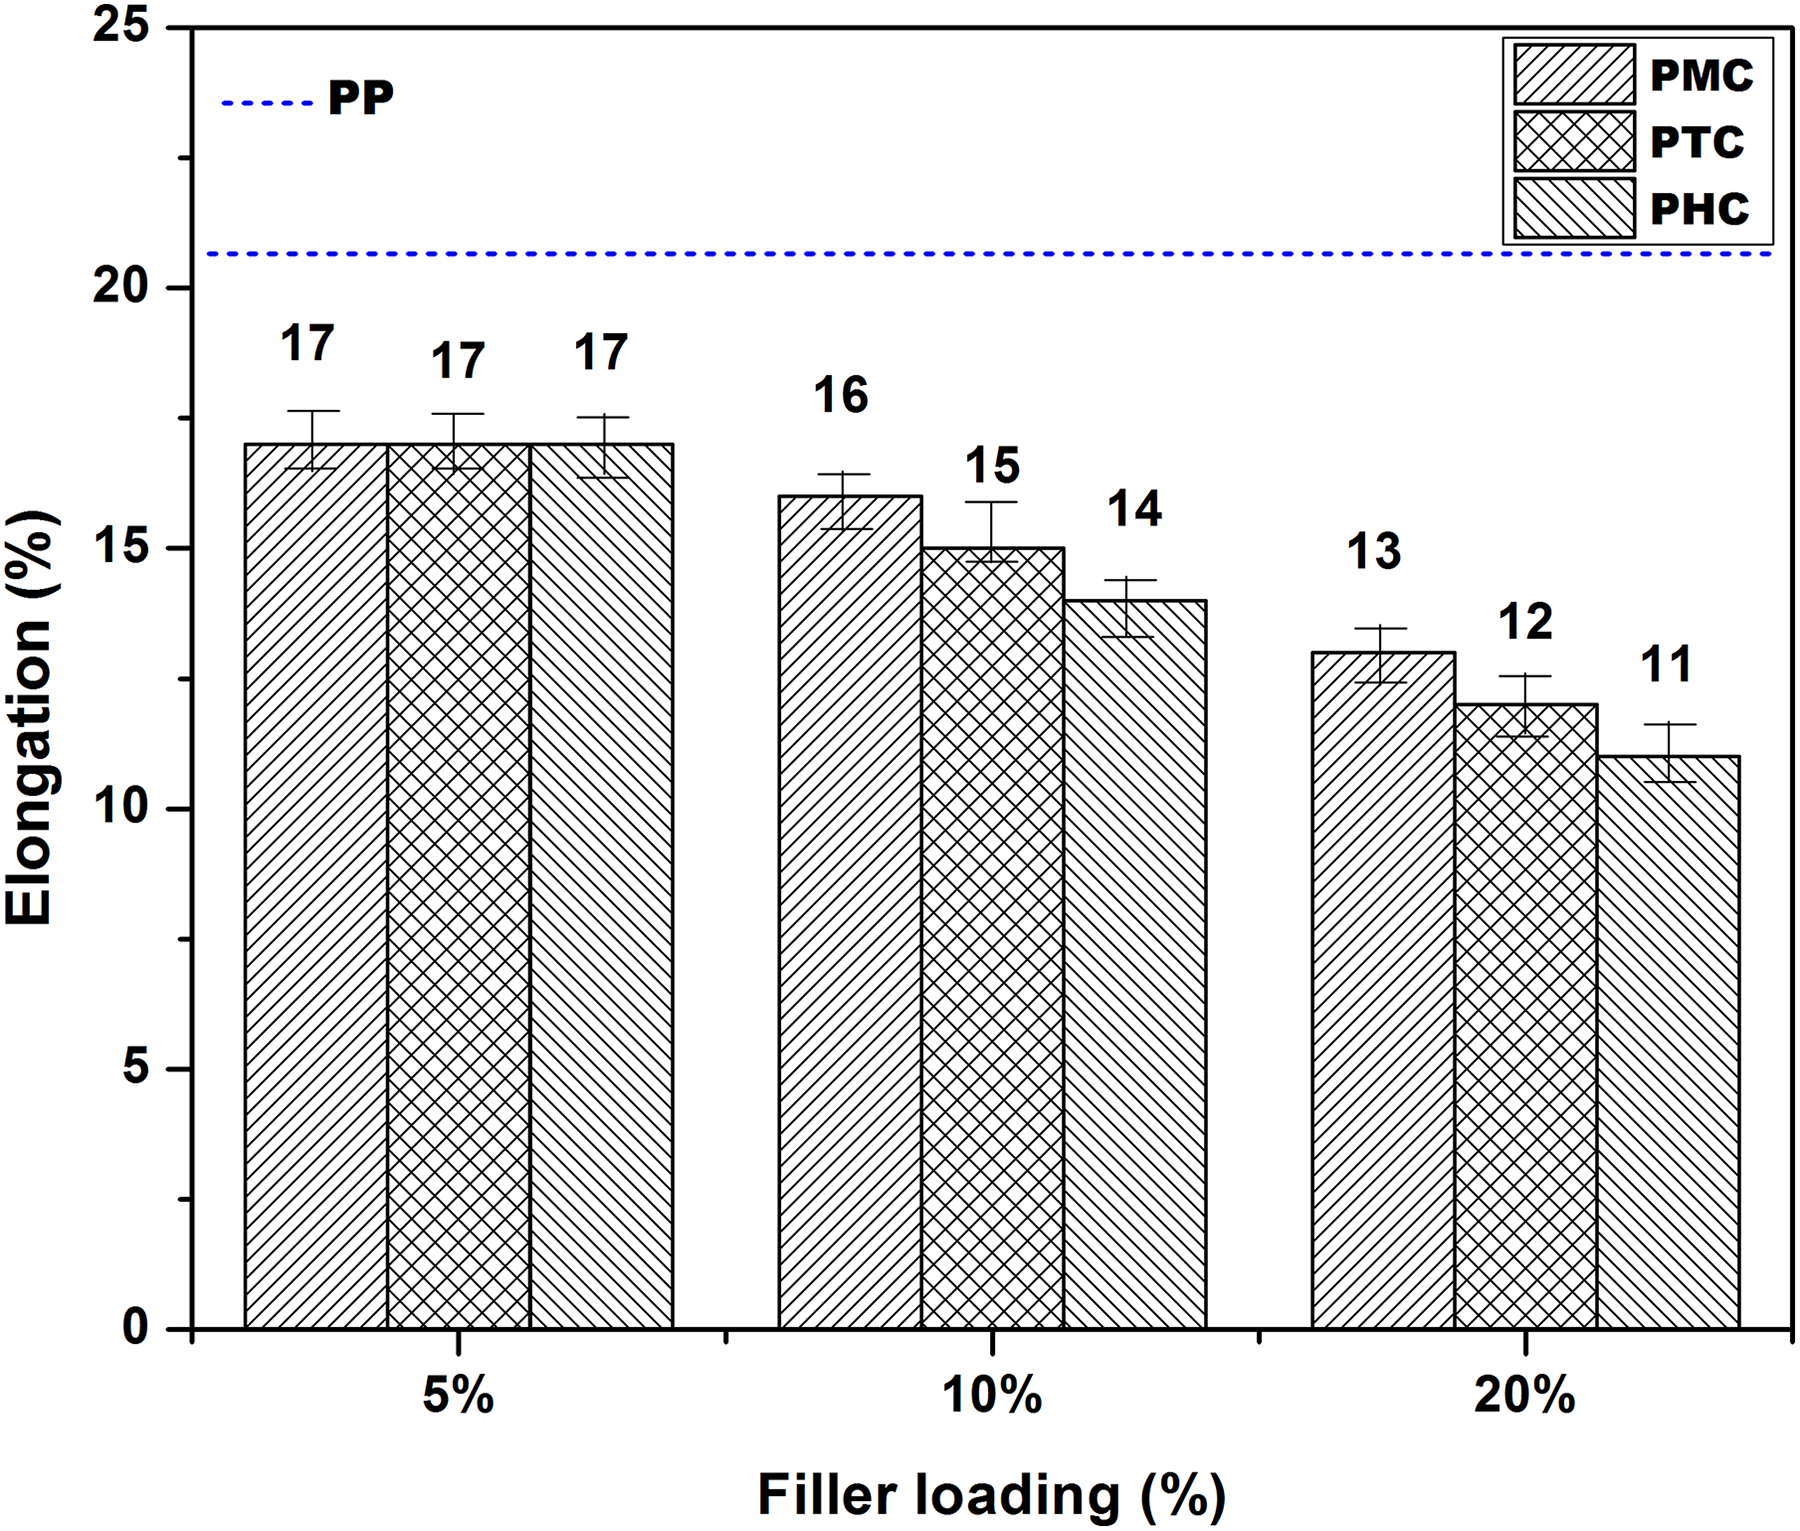
Plot of % elongation versus filler loading of PP and PP composites.
As shown in Figure 9, tensile modulus of the composites increased with the increase in the concentration of the respective fillers. The increase in modulus can be explained by the filler presence in PP that limits mobility and deformability of the matrix through the introduction of mechanical restraint in the composites system. Modulus of PTC composite increased by 103% (571 MPa) at 20% loading of fillers, 93% (543 MPa) in PHC composite at 20% loading, and 81% (511MPa) at 20% loading of mica in the PMC composite. Increase in tensile modulus can be attributed to the restrictions imposed by the filler particles on the mobility of the polymer chains, thus contributing to the increase in rigidity and stiffness of homo polymer matrix. Better dispersion and compatibility of talc in PP matrix due to smaller particle size may be the reasons behind higher modulus value of PTC composite than PHC and PMC composites.
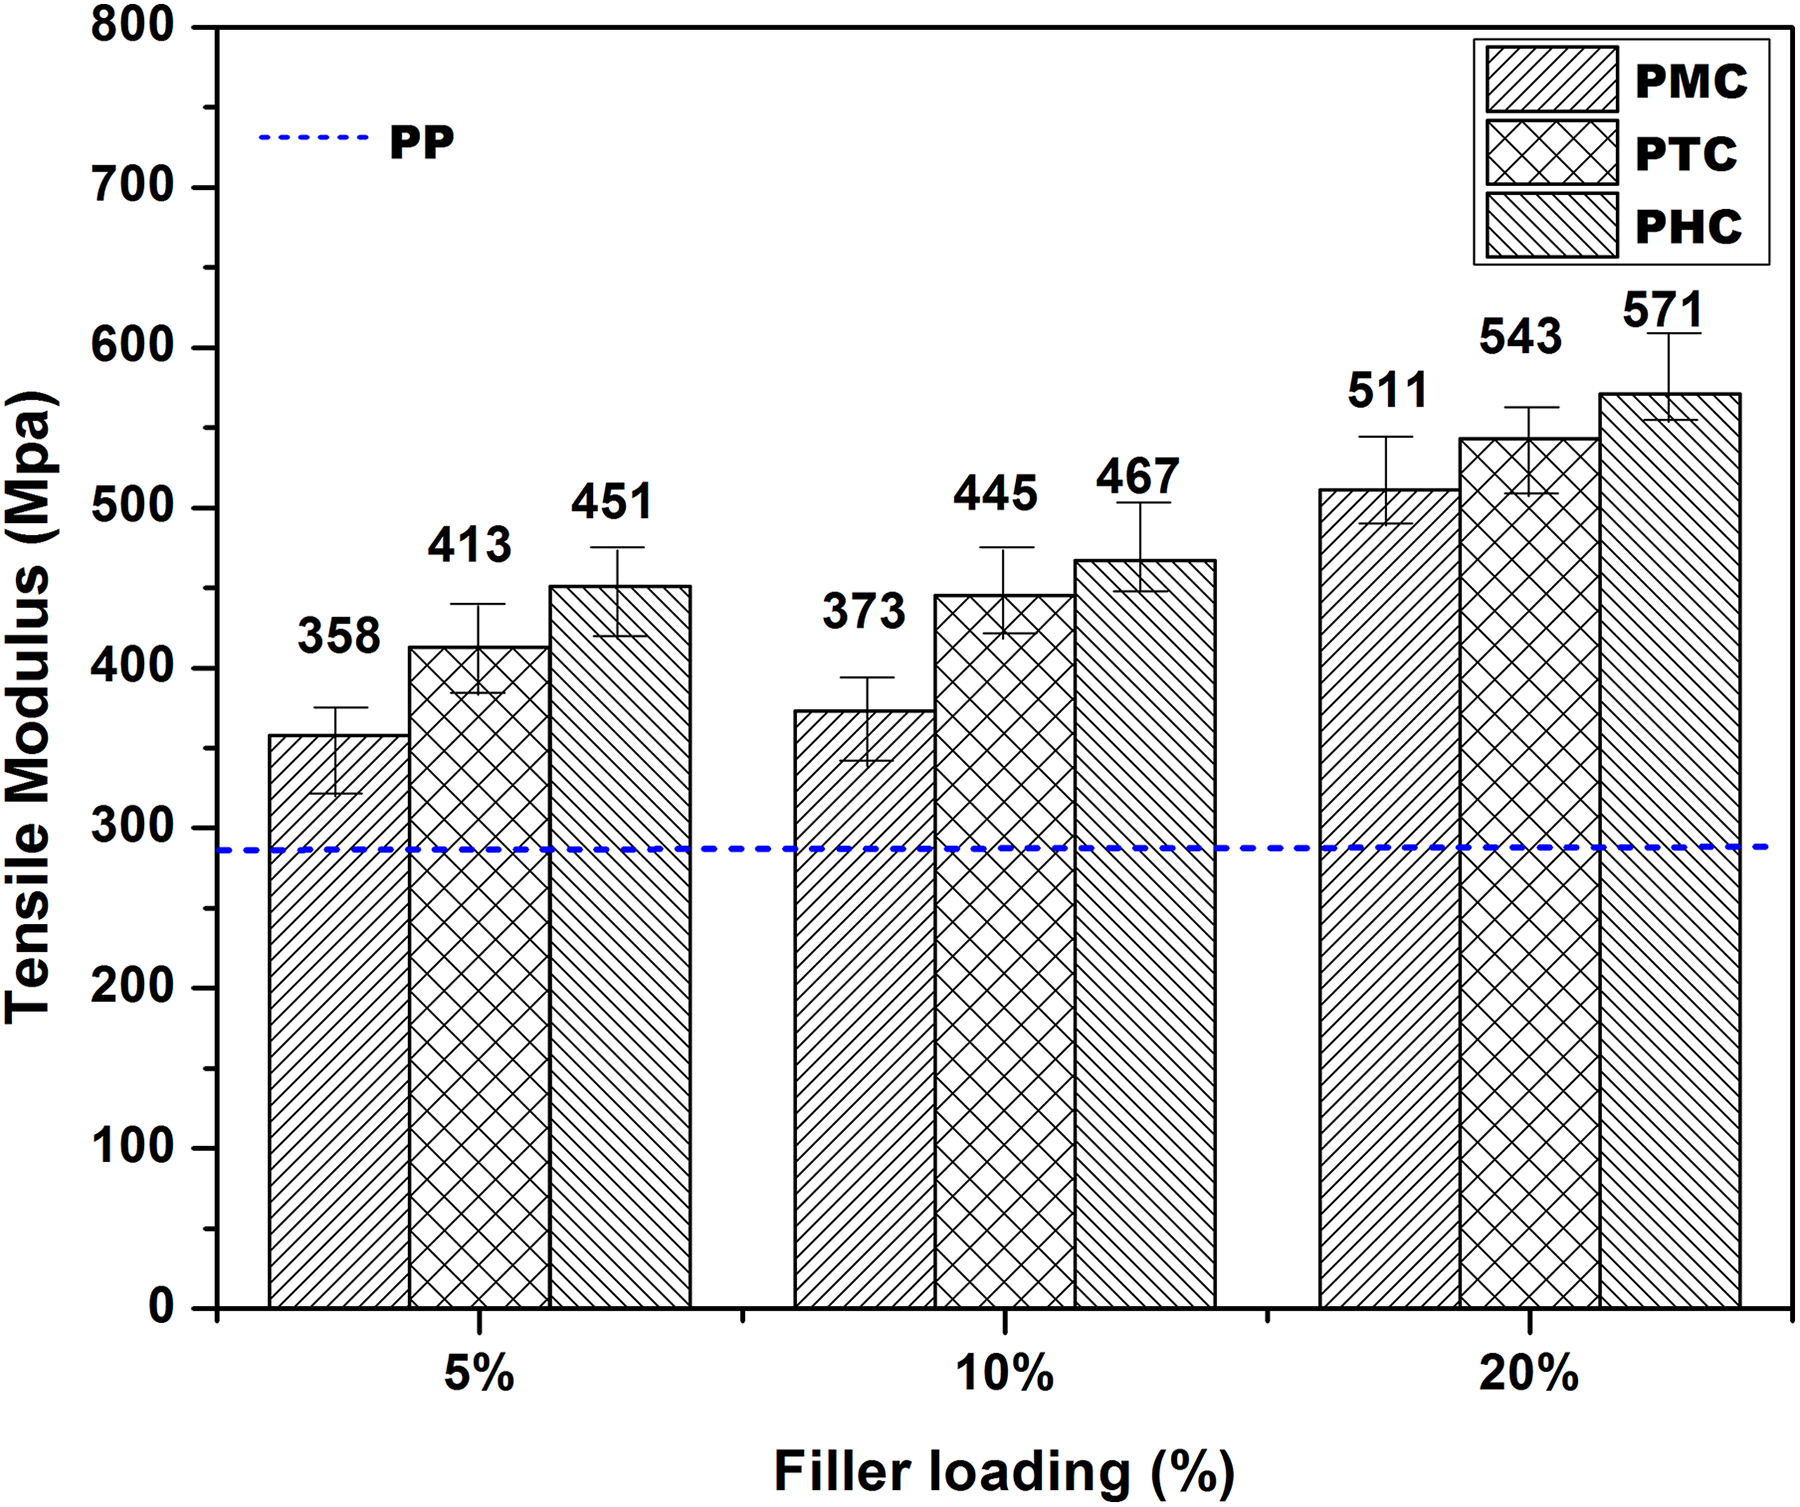
Plot of tensile modulus versus filler loading of PP and PP composites.
As can be observed from Figure 10, flexural modulus of PP composites increased considerably upon increasing the filler content. Increase in modulus of PTC composite was the highest with 88% (2413 MPa) due to the high aspect ratio of the plate-like structure of talc leading to better dispersion followed by the PHC composite with 80% (2313 MPa at 20% loading). An increase in flexural modulus by a maximum of 62% (2084 MPa at 30% loading) was observed in PMC composites. Finer particle size of talc had positive effect over larger particle size of mica and it is in line with the SEM findings.
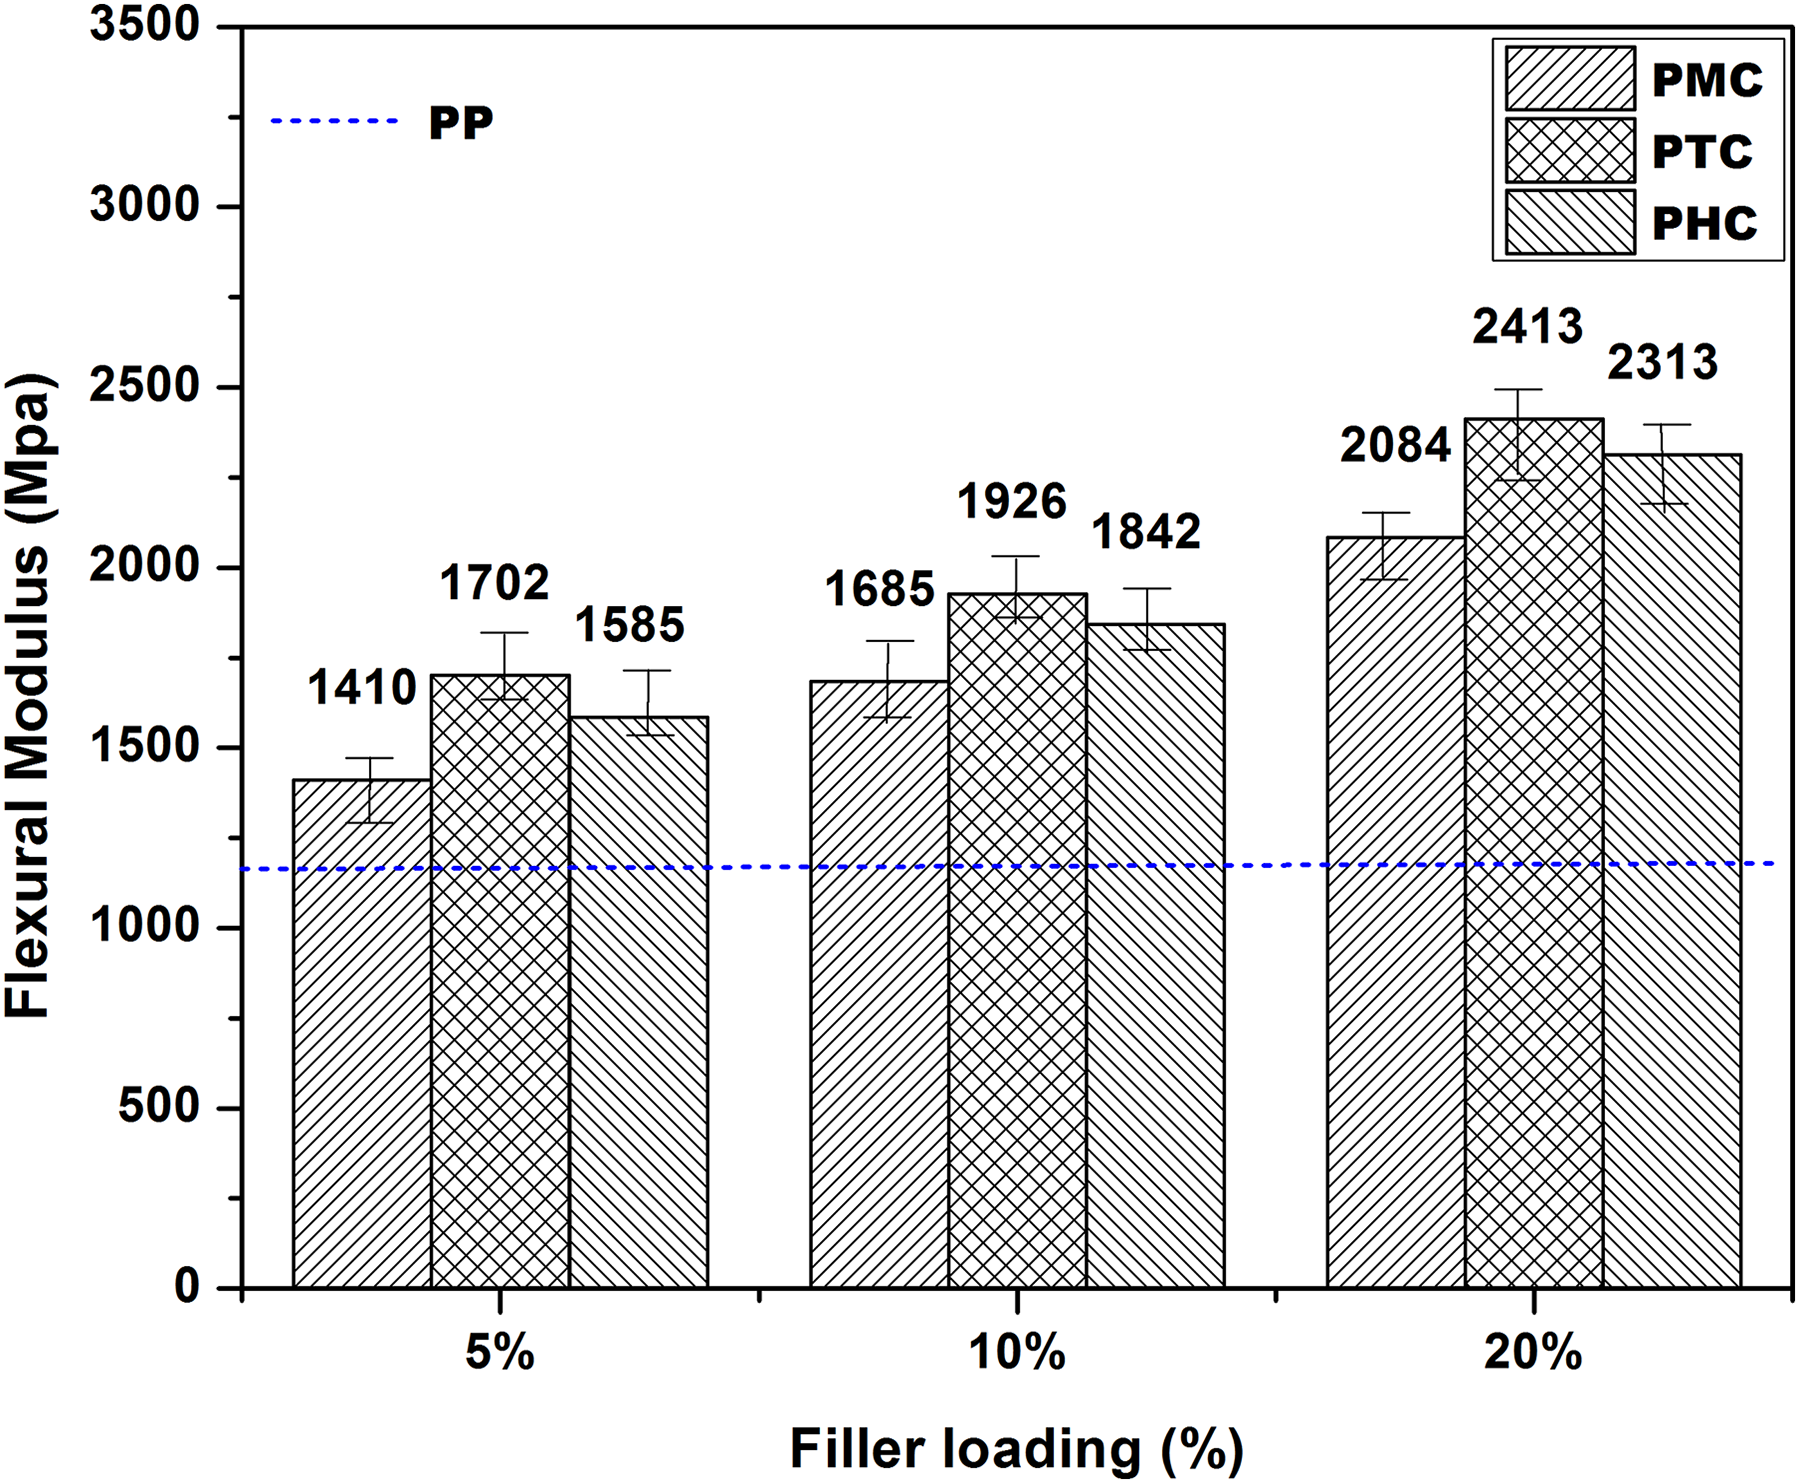
Plot of flexural modulus versus filler loading of PP and PP composites.
Increasing trend in impact strength with filler loading was observed in all the composites (Figure 11). Impact strength for the PTC, PHC, and PMC composites increased by a maximum of 23%, 27%, and 21%, respectively. Though both talc and mica are layered silicate minerals, in which mica forms planar thin platelets with very high aspect ratio, with biaxially oriented plates having high surface area compared to thickness. Thus mica results in stronger reinforcement of the matrix making it more rigid and stiff, thereby causing more restriction on the effective stress transfer during impact.
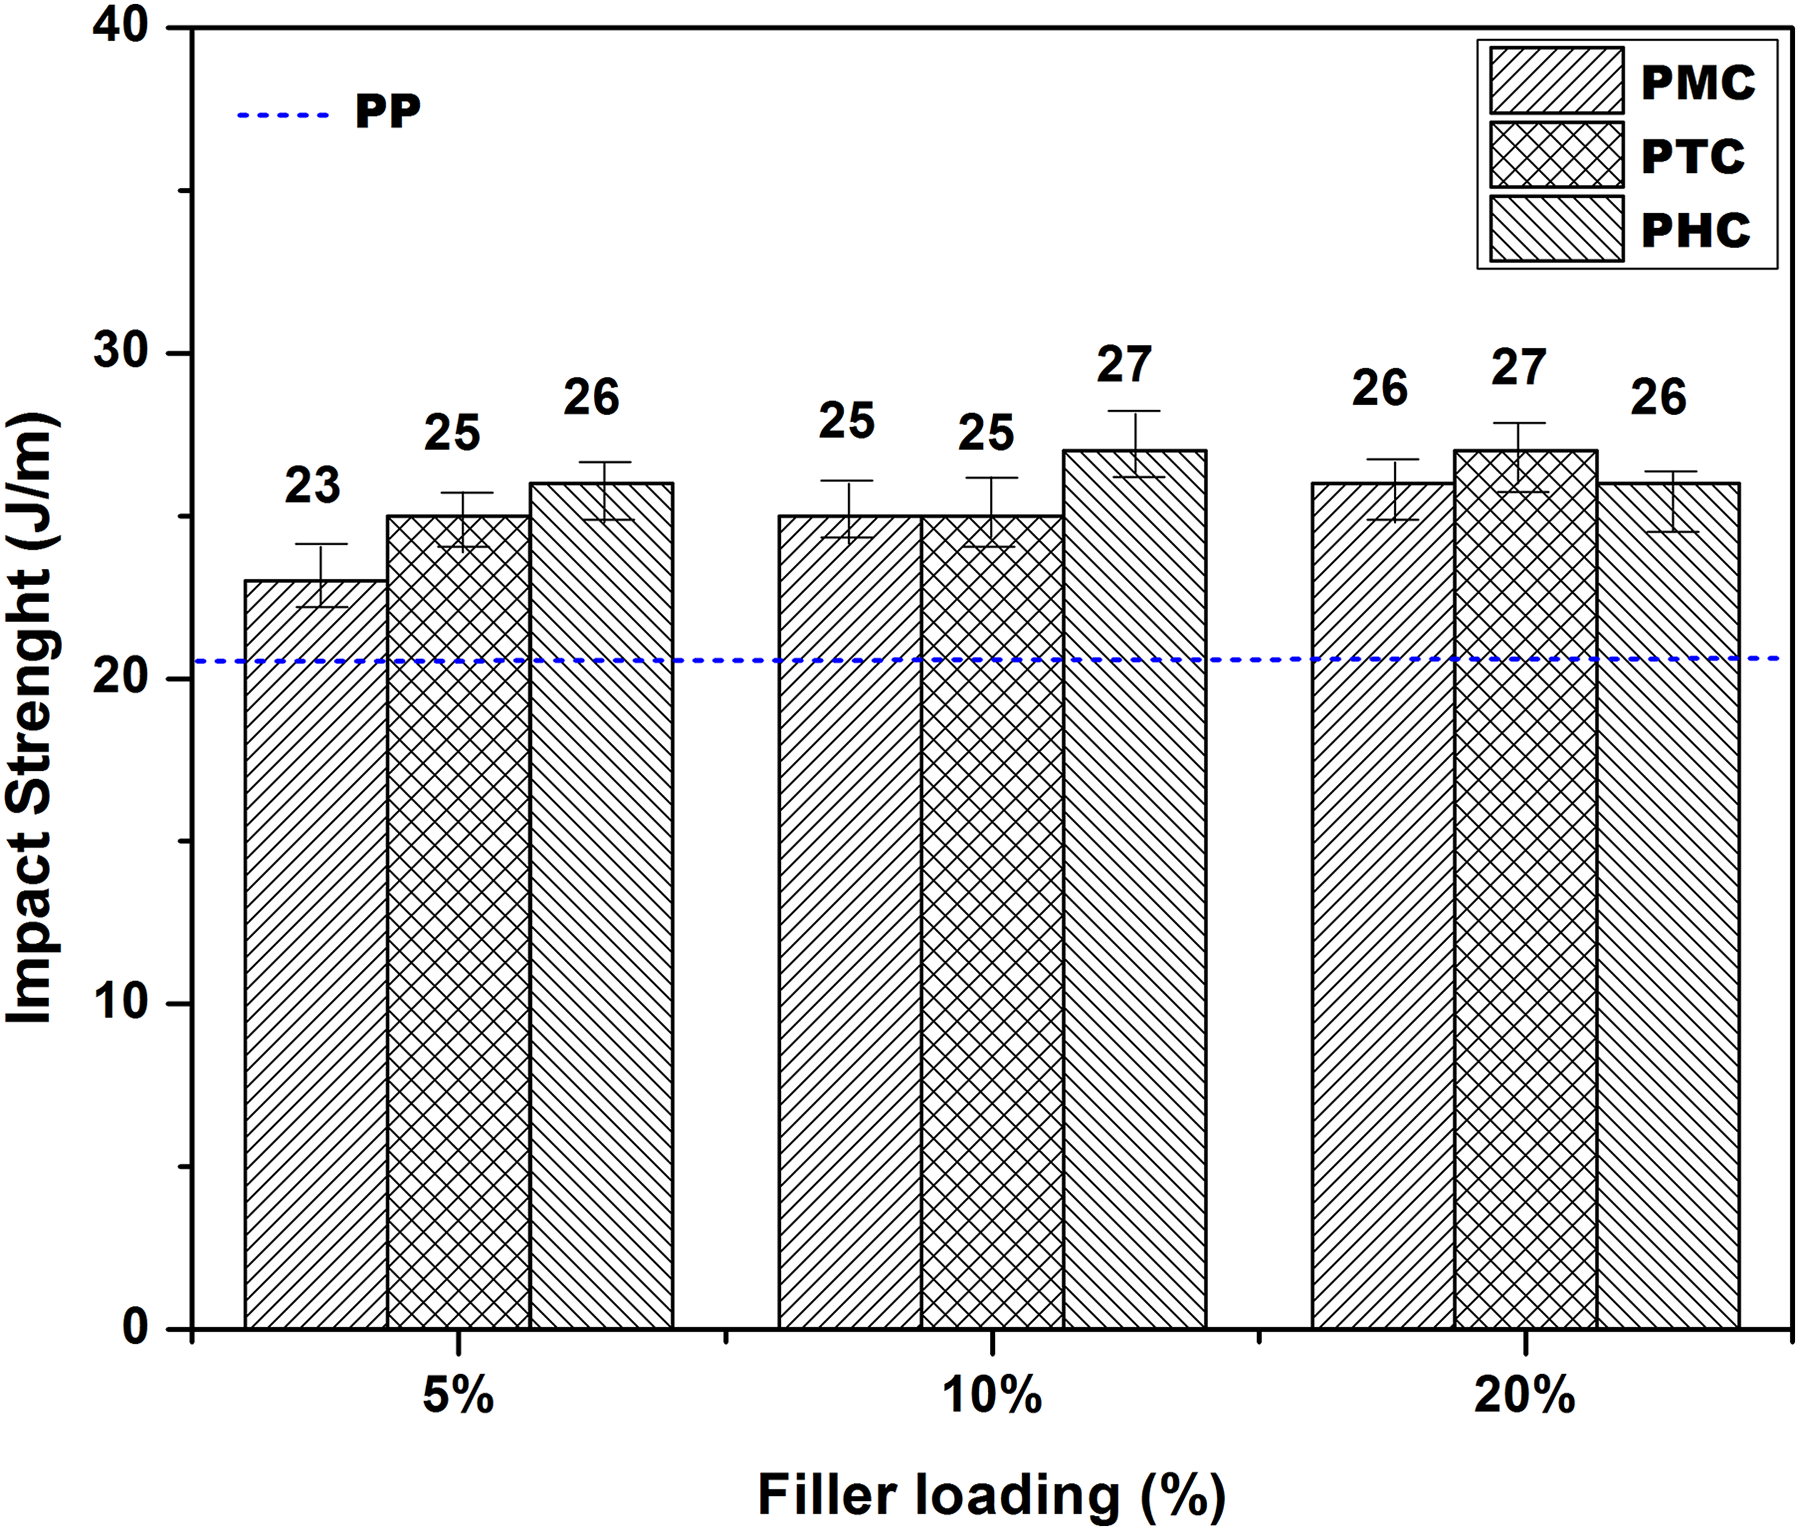
Plot of impact strength versus filler loading of PP and PP composites.
Conclusion
The effect of individual and blend of mica and talc as fillers on the rheological, morphological, and mechanical properties of filled PP composites was studied. Morphological characterization by SEM results revealed that lower particle size and narrower particle size distribution of talc lead better dispersion in PP matrix. Thermomechanical properties of composites got modified due to the presence of talc and mica particles. Shear viscosity, storage modulus (E′) and loss modulus (E″) was higher for PMC composites than PTC and PHC composites. An increase of approximately 130% was observed in storage modulus (E′) at 40°C for PMC and PHC composites at 20% loading. C parameter was found to increase, whereas reinforcing efficiency (r) decreased with the increase in filler loading. PTC composites show enhanced modulus with 60–103% increase in tensile modulus, 32–88% increase in flexural modulus, and better impact strength than PMC and PHC composites. Inferior mechanicals of PHC composite than PTC composite indicate lower compatibility of talc and mica as a blend in the PP matrix. Particle size and shape played significant role in properties of composites.
Footnotes
Declaration of Conflicting Interests
The author(s) declared no potential conflicts of interest with respect to the research, authorship, and/or publication of this article.
Funding
The author(s) received no financial support for the research, authorship, and/or publication of this article.