
Abstract
The purpose of this study was to compare the performance of polylactide (PLA)-based materials shaped by the traditional injection molding technique versus three-dimensional (3D)-printing additive manufacturing. Comparisons were performed not only for neat PLA but also for its thermoplastic polyurethane elastomer (TPU) blend and for its E-glass fiber (GF)-reinforced composites. Performance comparison of the injection-molded and 3D-printed specimens was especially conducted to compare their mechanical properties (strength–modulus–toughness) by tensile, flexural, and fracture toughness tests. Other comparisons such as their macro-level appearances, fracture surface morphology, and thermal behavior were also performed by photographic images, scanning electron microscopy, differential scanning calorimetry, and thermogravimetric analysis. It can be concluded that the use of 3D-printing in the shaping of neat PLA and PLA/TPU blend was generally very beneficial; on the other hand, due to the differences in the orientation of the GF reinforcements, there could be certain reductions in the mechanical performance of PLA/GF and PLA/TPU/GF composite specimens.
Introduction
It is known that for the fabrication of thermoplastic parts, the most advantageous production technique is injection molding. This technique consists of basically three steps, namely, “filling,” “packing,” and “cooling,” where the melted polymer is injected into a cold, closed mold cavity by the action of pressure leading to solidification of the polymer melt into a rigid solid plastic component. Due to its rather low labor cost, high design flexibility, and high product quality with tight dimensional control, injection molding is still one of the most preferred production routes in the polymer industry.
On the other hand, shaping of polymer parts with injection molding requires high initial cost of tooling and machinery. Therefore, for the small batch size production, the overall manufacturing cost could be very high. Moreover, the molds should withstand so many different types of loads and pressures to provide high reproducibility of the component. Thus, mold design features, mold making processes, molding equipment, and part design are all very critical to assure quality and reproductivity of the polymer parts, which result in significant increase in the cost for small batch size production.
In this respect, shaping by three-dimensional (3D)-printing today appears to be an alternative. 3D-printing technology, also called “additive manufacturing” or “rapid prototyping,” uses the 3D CAD model of a component to produce it layer-by-layer. In the fused deposition modeling (FDM) technique, 3D-printers generally use thermoplastic filaments that can easily melt and then solidify to fabricate the model. Contrary to traditional subtractive manufacturing techniques, 3D-printing is not only faster and cheaper but also there is no loss of material.
Today, 3D-printing techniques are especially used in the production of health care and medical devices, while their use is rapidly emerging in other sectors. According to the analysts Shanler and Basiliere 1 from the American research company Gartner, additive manufacturing techniques will reach a peak in 5–10 years in both automotive and aerospace industries. Similarly, analyst Cotteleer 2 from Deloitte LLP reported that by 2030–2050, end product production by 3D-printing technologies will amplify in all industries.
Consequently, academic research on the use of various thermoplastic polymers in 3D-printing techniques is also emerging. On the other hand, a literature survey indicated that, apart from the biomedical field, the number of 3D-printing studies about polylactide (PLA)-based materials was limited. These studies 3 –10 especially investigate the effects of the process parameters of 3D-printing on the mechanical and other properties of PLA blends and composites.
If 3D-printing methods would be considered as an alternative shaping technique, then properties of the samples shaped by 3D-printing and conventional injection molding technique should be compared. However, the literature survey revealed that there seem to be limited studies 11 –14 comparing the behavior of certain thermoplastic(not PLA-based) specimens shaped by 3D-printing and injection molding.
In the first one, Franchetti and Kress 11 performed a comparative cost analysis of 3D-printing and injection molding for various batch sizes. They determined “break-even points” of batch sizes above which injection molding would be cost-effective. It was concluded that 3D-printing-type additive manufacturing was only cost-effective for the small batch size productions.
Huber et al. 12 investigating the magnetic hysteresis behavior of 3D-printed and injection-molded polyamide 11 (PA11) samples filled with isotropic NdFeB powder revealed that the layered structure of 3D-printed samples has no adverse effect in terms of the magnetic hysteresis isotropy.
In the study of Miller et al., 13 thermoplastic polycarbonate urethane (PCU) specimens were shaped by both injection molding and 3D-printing to compare their mechanical properties. They indicated that due to proper printing parameters and high toughness of PCU, tensile, compressive, shear, and fatigue strength of the 3D-printed samples were matched with the injection-molded samples.
Weng et al. 14 compared the tensile mechanical properties of neat acrylonitrile butadiene styrene (ABS) and its 1, 3, 5 wt% montmorillonite (MMT) nanocomposite specimens shaped by 3D-printing and injection molding. They indicated that tensile strength and modulus of the 3D-printed samples were all lower than the injection-molded ones. For example, tensile strength of the 3D-printed ABS samples was 45% lower, while 3D-printed ABS/5 wt% MMT nanocomposite was 39% lower. Possible reasons of these reductions were also discussed in the manuscript.
Since biopolymer PLA is considered as a significant alternative for the petroleum-based thermoplastics not only for biomedical applications but also for structural engineering applications, it would be very crucial to compare the mechanical performance of PLA-based samples shaped by 3D-printing and the conventional injection molding.
However, to the best of our knowledge, there seems to be no study cited in the literature. Therefore, the aim of this study was, for the first time, to compare the mechanical performance of neat PLA, glass fiber (GF)-reinforced PLA, and thermoplastic polyurethane elastomer (TPU)-blended PLA samples shaped by fused deposition modeling–type 3D-printer and injection molding.
Experiment
Composite making and blending of PLA
In this study, PLA matrix material was commercial
As a first step, to produce the composites and blends of PLA with GF and TPU, PLA powders and TPU granules were pre-dried for 15 and 4 h, respectively, in a vacuum oven at 60°C, and then according to the formulation PLA, GF and TPU particles were premixed manually. Then, these mixtures were melt compounded via Rondol Microlab 300, England, laboratory size (D = 10 and L/D = 20) twin-screw extruder. Typical temperature profiles used from feeder to die were 115-170-180- 175-145°C, while the typical screw speed used was 75 r/min throughout the compounding stage.
As discussed in our former unpublished manuscript under review, the use of 15 wt% GF reinforcement was very effective for significant increases in the strength and elastic modulus values of PLA, while the use of 10 wt% TPU was very effective for the enormous increases in the ductility and fracture toughness values of PLA. Therefore, in this study, PLA/GF designation is used for the PLA/15 wt% GF composite, while PLA/TPU designation is used for the PLA/10 wt% TPU blend. To obtain optimum mechanical properties combination of strength–modulus–toughness, 15 wt% GF and 10 wt% TPU were also used together, and this specimen is designated as PLA/TPU/GF.
Shaping by injection molding
Before shaping the test specimens by injection molding, continuous strands coming out from the twin-screw extruder die were cut into 2–3 mm granules using a four-blade cutter. Then, these pellets were dried for 15 h in a vacuum oven at 60°C. Standard-sized specimens required for testing and analyses were melt-shaped via laboratory scale DSM Xplore Micro, Netherland, injection molder. Typical barrel and mold temperatures used were 160°C and 35°C, respectively, while the melting time in the barrel was approximately 7 min with the subsequent three-step pressure–time profile determined as 13 bar for 4 s, 13 bar for 5 s, and 12 bar for 5 s.
In order to differentiate these specimens shaped by injection molding, an italic suffix of “IM” was used, that is, PLA-IM, PLA/GF-IM, PLA/TPU-IM, and PLA/TPU/GF-IM.
Shaping by 3D-printing
Before shaping the test specimens by 3D-printing, continuous strands coming out from the twin-screw extruder die were carefully air cooled and wound on empty filament spools keeping their diameter approximately as 2 mm. Then, these filaments were used to shape test specimens via Ultimaker 2+ (Ultimaker B.V., Netherland), a FDM-type 3D-printer. It is an open-source code equipment with changeable nozzles and many process parameters. Its build chamber size is 223 × 223 × 205 mm, while the nozzle and built plate temperature ranges are 180–260°C and 50–100°C, respectively.
After drawing the standard size geometries of the test specimens by a CAD software (SolidWorks), Cura 2.3.1 slicing software of the printer was used to generate G-code of the specimen geometries. Since the printer used is an open code equipment, there are so many software parameters to be used. In this study, after several trials to get the optimum mechanical properties of the specimens, the chosen values of the most important software parameters are tabulated in Table 1.
The most important 3D-printer software parameters chosen in this study.
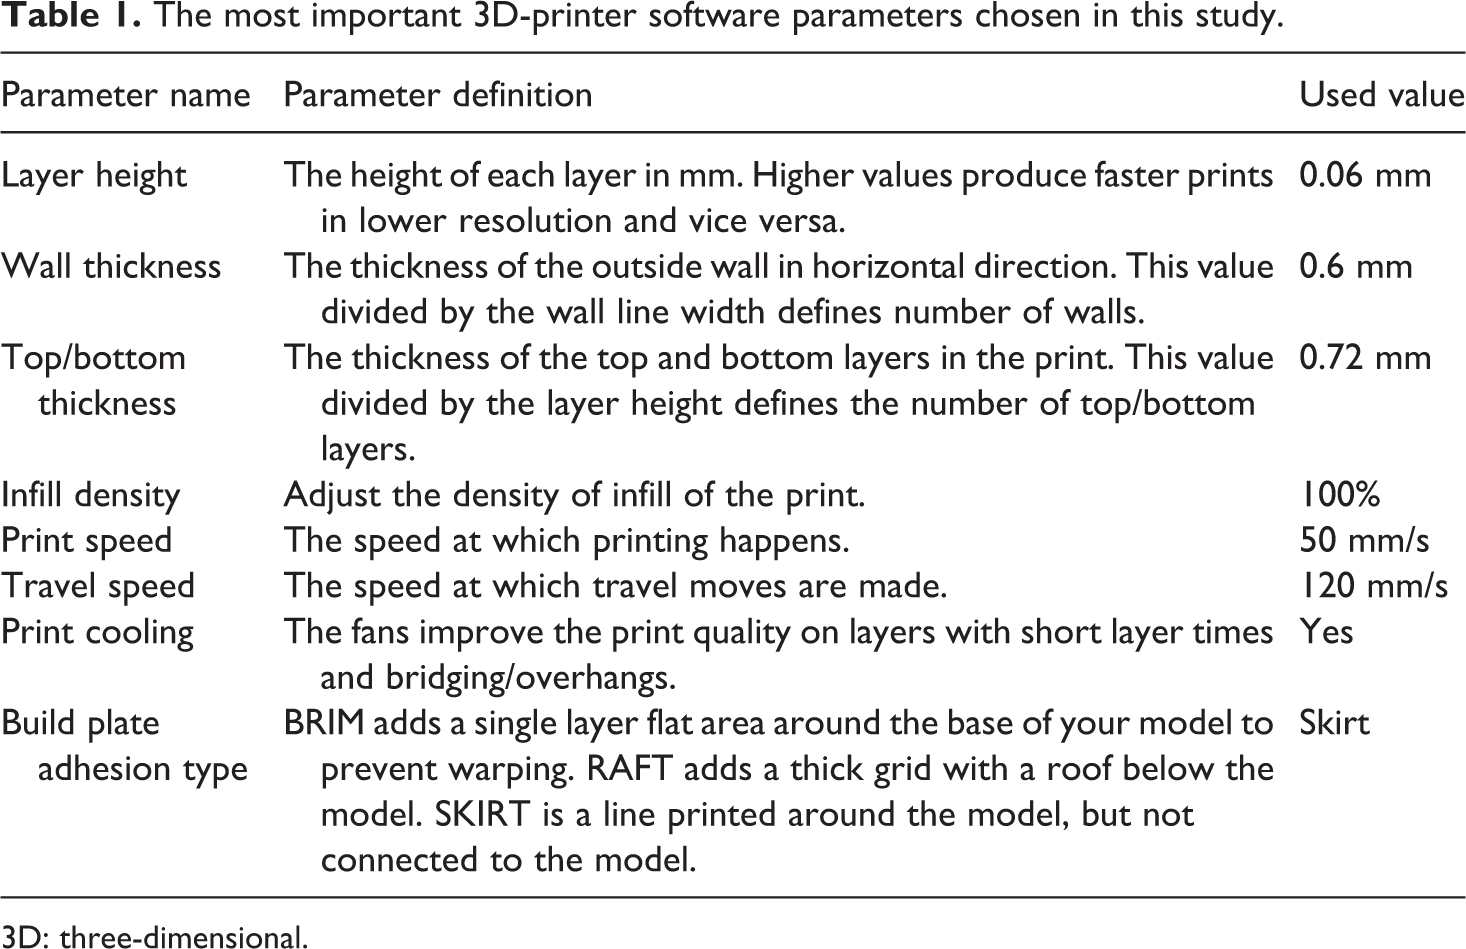
3D: three-dimensional.
On the hardware of the 3D-printer, the nozzle diameter and temperature were chosen as 4 mm and 180°C, respectively, while the built plate was set at 65°C. Specimens were printed in a “laying down fashion” with alternating ±45° printing orientation.
In order to differentiate these specimens shaped by 3D-printing, an italic suffix of “3D” was used, that is, PLA-3D, PLA/GF-3D, PLA/TPU-3D, and PLA/TPU/GF-3D.
Observation of the appearance and the fracture surface morphology of the specimens
In order to observe differences in the appearance of the specimens shaped by injection molding and 3D-printing, visual observation was carried out by photographing their images. Then, morphological analysis in terms of the distribution of structural differences and GF and TPU domains in the PLA matrix was carried out on the gold sputtered fracture surface of fracture toughness specimens under FEI Nova Nano 430, Japan, scanning electron microscope (SEM).
Observation of the mechanical performance of the specimens
In order to observe the differences in the mechanical performance of injection-molded and 3D-printed specimens, first their strength and modulus values were determined with both tension tests according to ISO 527-2 standard and flexural tests in terms of three-point bending according to ISO 178 standard. These tests were carried out under the 5 kN Instron 5565A, USA, universal testing system. Apart from tension and flexural tests, fracture toughness tests were also carried out to compare K IC and G IC fracture toughness of the specimens. These tests were conducted for single-edge-notched-bending specimens according to ISO 13586 standard under the Instron 5565A system. Notches and pre-cracks on the injection-molded specimens were created by the CEAST Notchvis, Italy, system as defined in the standard. For each specimen group, all mechanical tests were repeated five times and the properties were determined as the average values including their standard deviations.
Observation of the thermal behavior of the specimens
In order to observe the differences in the transition temperatures and enthalpies of injection-molded and 3D-printed specimens, differential scanning calorimetry (DSC) analyses were conducted. The heating profile used for the materials was −80 to 220°C with 10°C/min rate under the SII X-DSC 700 Exstar, Japan, system. In addition to DSC, for the differences in the thermal degradation temperatures of each specimen, thermogravimetric analyses (TGA) were carried out. This time, the heating profile was 30–550°C under the SII TG/DTA 7300 Exstar, Japan, system.
Results and discussion
The comparison of injection-molded and 3D-printed neat PLA and its 10 wt% TPU blend and 15 wt% GF composites alone and together was discussed in terms of their visual appearance, fracture surface morphology, mechanical properties, and thermal behaviors in the following sections.
Comparison of the appearance and the fracture surface morphology of the specimens
Comparison of the macro-level appearances of injection molded and 3D-printed specimens wasconducted by taking their photographic images. Figure 1 reveals that generally, there were no significant differences in their macro-level appearances. Contrary to the 3D-printed neat PLA, the most noticeable difference was that the injection-molded PLA appeared to be very transparent. Because it is known that PLA has very low melt crystallization rate, in which its macromolecular chains do not have enough time to crystalize due to the very high cooling rate of injection molding resulting in a highly amorphous structure.
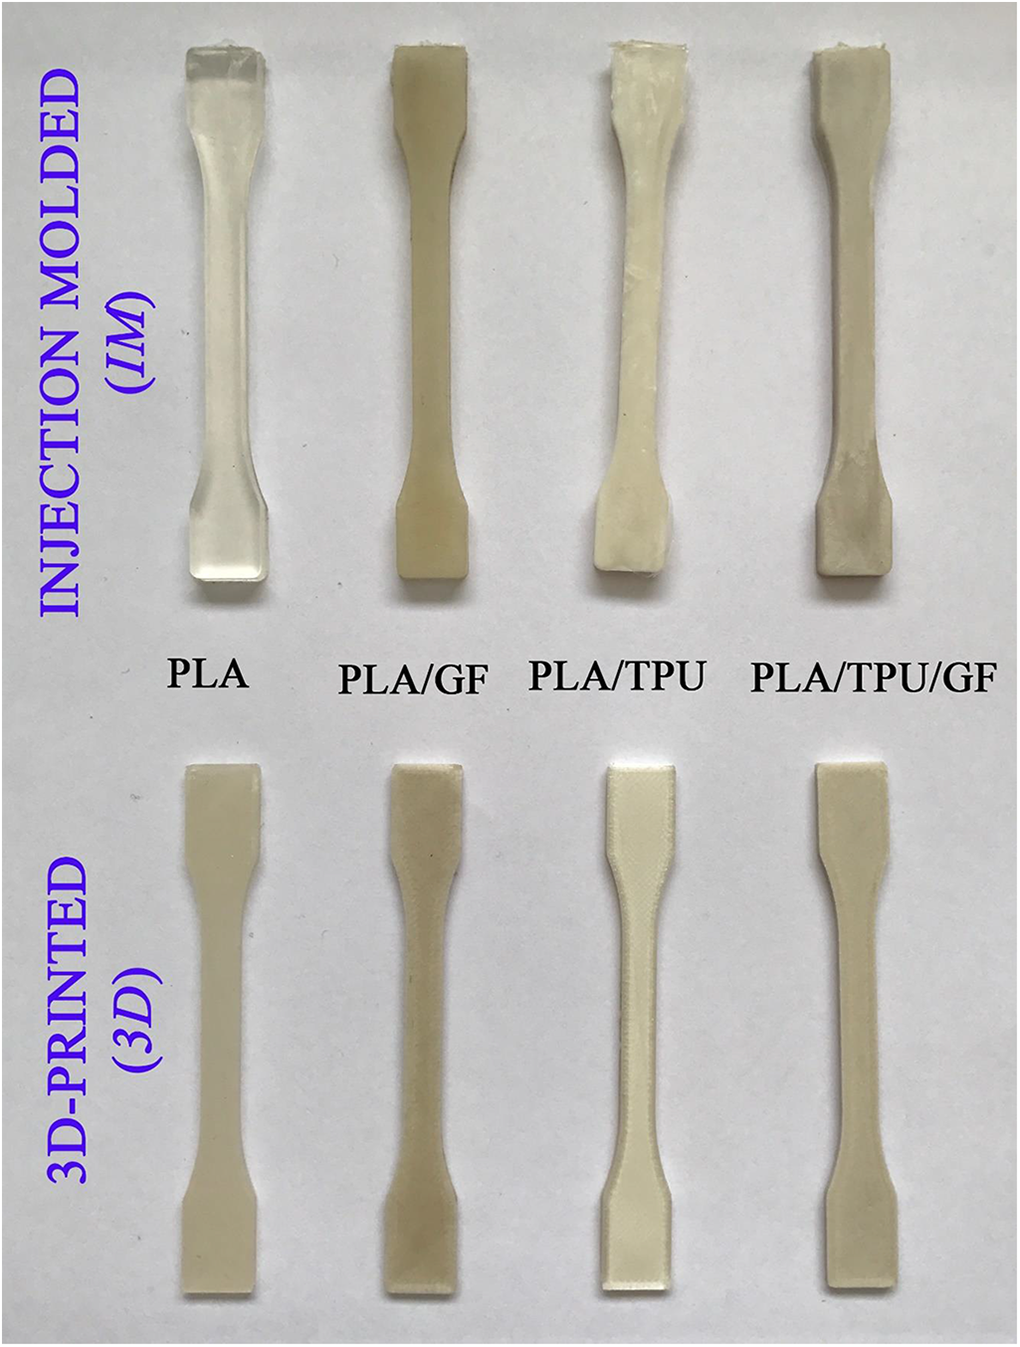
Photographic images comparing the macro-level appearances of the specimens shaped by injection molding and 3D-printing.
As will be discussed in the “Thermal behavior” section, due to the lower cooling rate during 3D-printing, the neat PLA specimen had higher level of crystallinity. Moreover, due to the ±45° printing orientation, this specimen had a kind of slightly textured structure. In fact, this slightly textured structure was sensible by a finger touch on the surfaces of all 3D-printed specimens. Therefore, because of the scattered light transmission resulted from the more crystallinity amount and textured structure, 3D-printed neat PLA specimen appeared to be opaque.
Then, the differences in fracture surface morphology of the injection-molded and 3D-printed specimens were investigated by SEM analysis as given in Figures 2 and 3. Figure 2 shows that there were no significant differences in the rather smooth fracture surfaces of the inherently brittle neat PLA specimens and the rather rough fracture surfaces of rubber toughened PLA/TPU specimens.
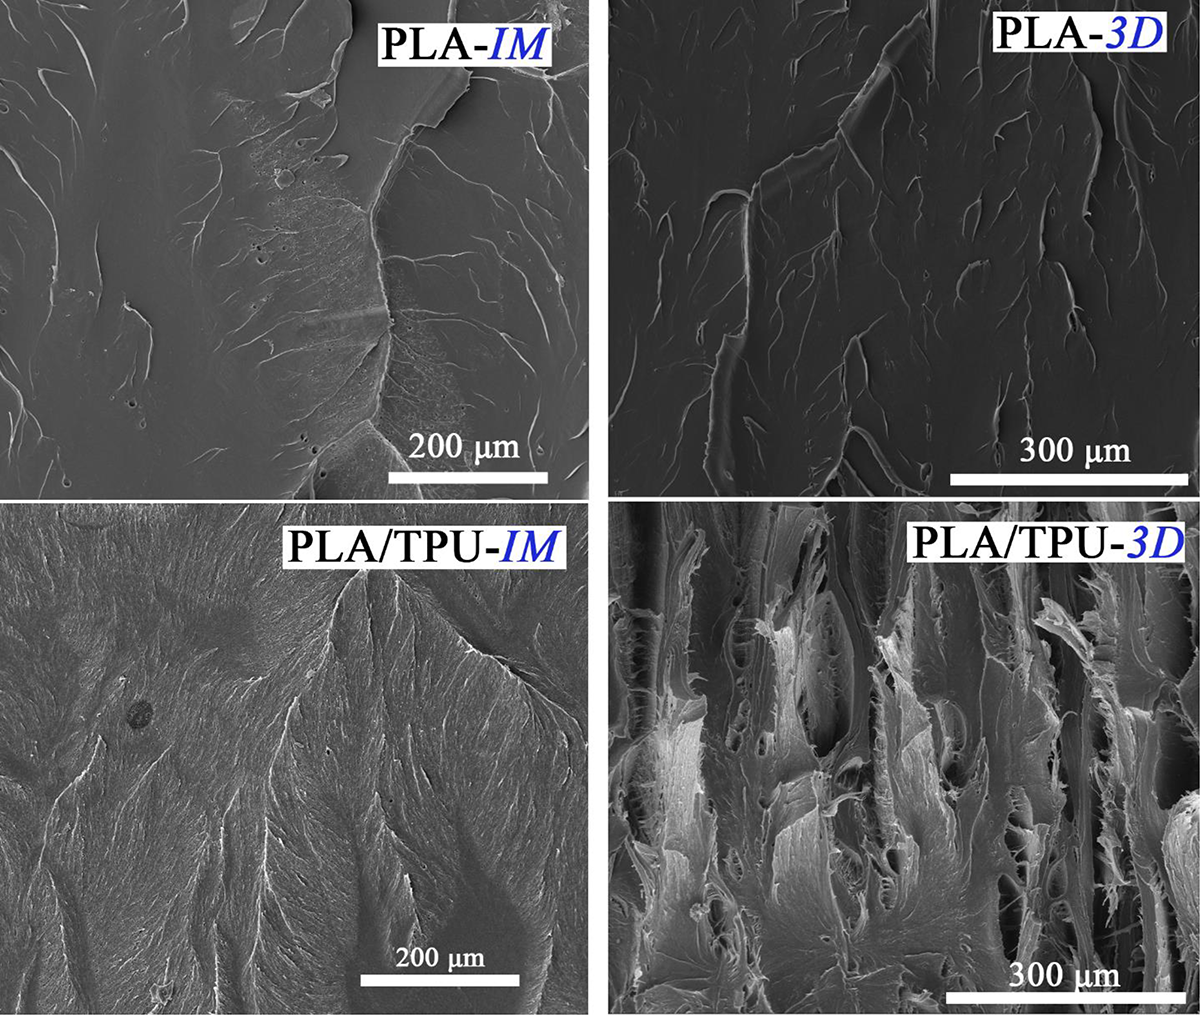
SEM images comparing the fracture surface morphology of the PLA and PLA/TPU specimens shaped by injection molding and 3D-printing. SEM: scanning electron microscope; PLA: polylactide; TPU: thermoplastic polyurethane elastomer; 3D: 3D-printed; IM: injection-molded.
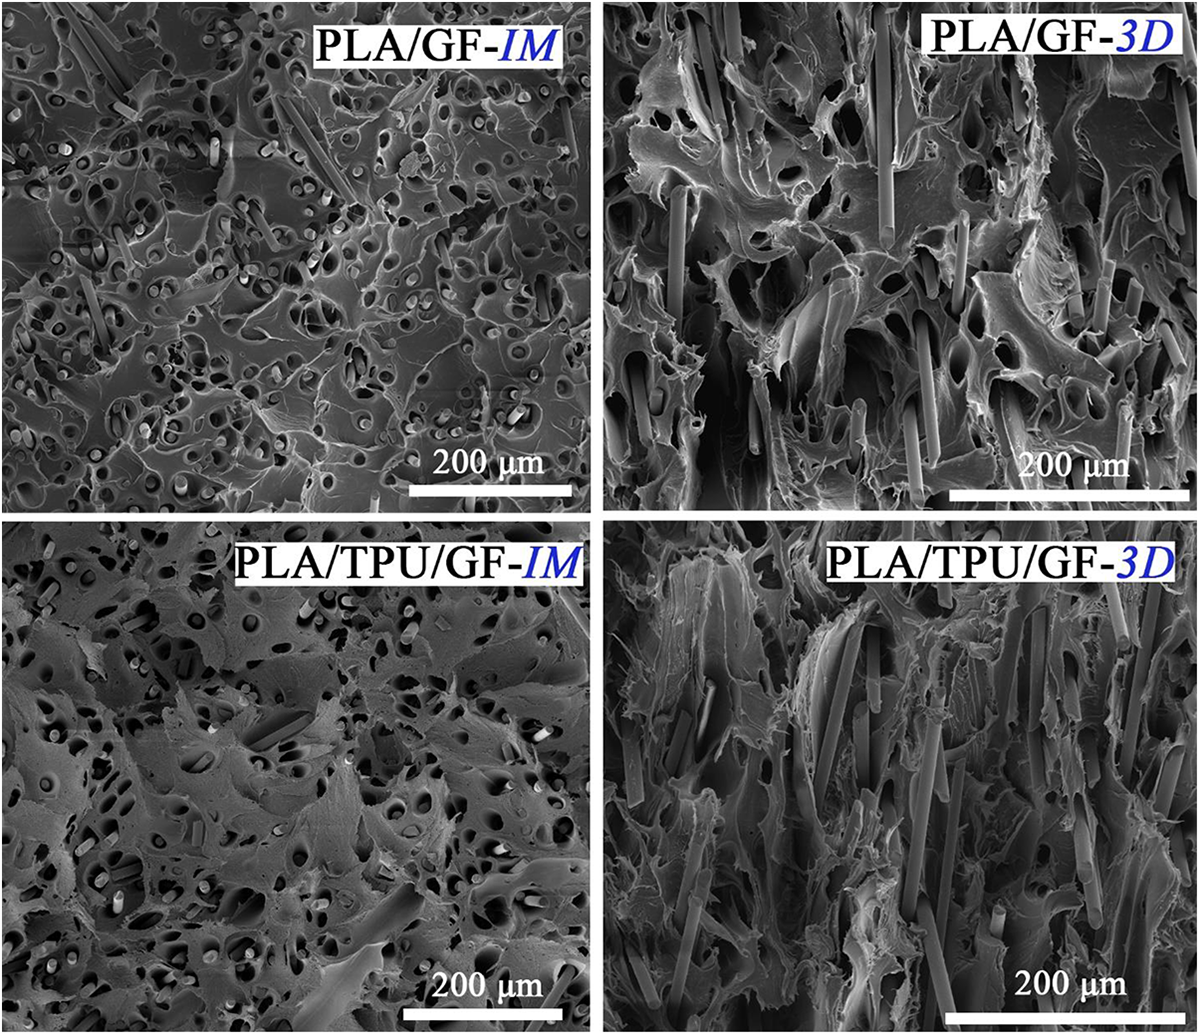
SEM images comparing the fracture surface morphology of the PLA/GF and PLA/TPU/GF specimens shaped by injection molding and 3D-printing. SEM: scanning electron microscope; PLA: polylactide; TPU: thermoplastic polyurethane elastomer; GF: glass fiber; 3D: 3D-printed; IM: injection-molded.
However, Figure 3 indicates that there were significant differences in terms of the orientation of GF reinforcements in the fracture surfaces of the injection-molded and 3D-printed specimens of both PLA/GF and PLA/TPU/GF.
It is seen that almost all GF reinforcements were aligned perpendicular to the fracture plane of injection-molded specimens, because during injection molding pressure is applied parallel to the longitudinal direction of the test specimens leading to alignment along this direction.
During 3D-printing, since the equipment scans the specimen geometry with ±45° raster angle directions, Figure 3 shows that, in the 3D-printed specimens of PLA/GF and PLA/TPU/GF, some of the GF reinforcements were oriented to the fracture plane with +45°, while some of them were oriented with −45°.
Therefore, as will be discussed in the “Comparison of the mechanical properties of the specimens” section, due to these differences in the orientation of GF reinforcements, significant changes were observed in the mechanical properties of injection-molded and 3D-printed specimens with GF reinforcements.
Comparison of the mechanical properties of the specimens
In order to compare the strength and elastic modulus values of injection-molded and 3D-printed specimens, both tension tests and three-point bending flexural tests were conducted. While “tensile stress–strain” curves and “flexural stress–strain” curves of all specimens are given in Figures 4 and 5, respectively, the values of “tensile strength (σ TS)” and “tensile modulus (E)” determined by tension tests and the values of “flexural strength (σ Flex)” and “flexural modulus (E Flex)” determined by bending tests are compared in Table 2. Moreover, the influences of the injection molding and 3D-printing shaping process on the tensile and flexural strength values were compared in Figure 6, while the tensile and flexural modulus values were compared in Figure 7.
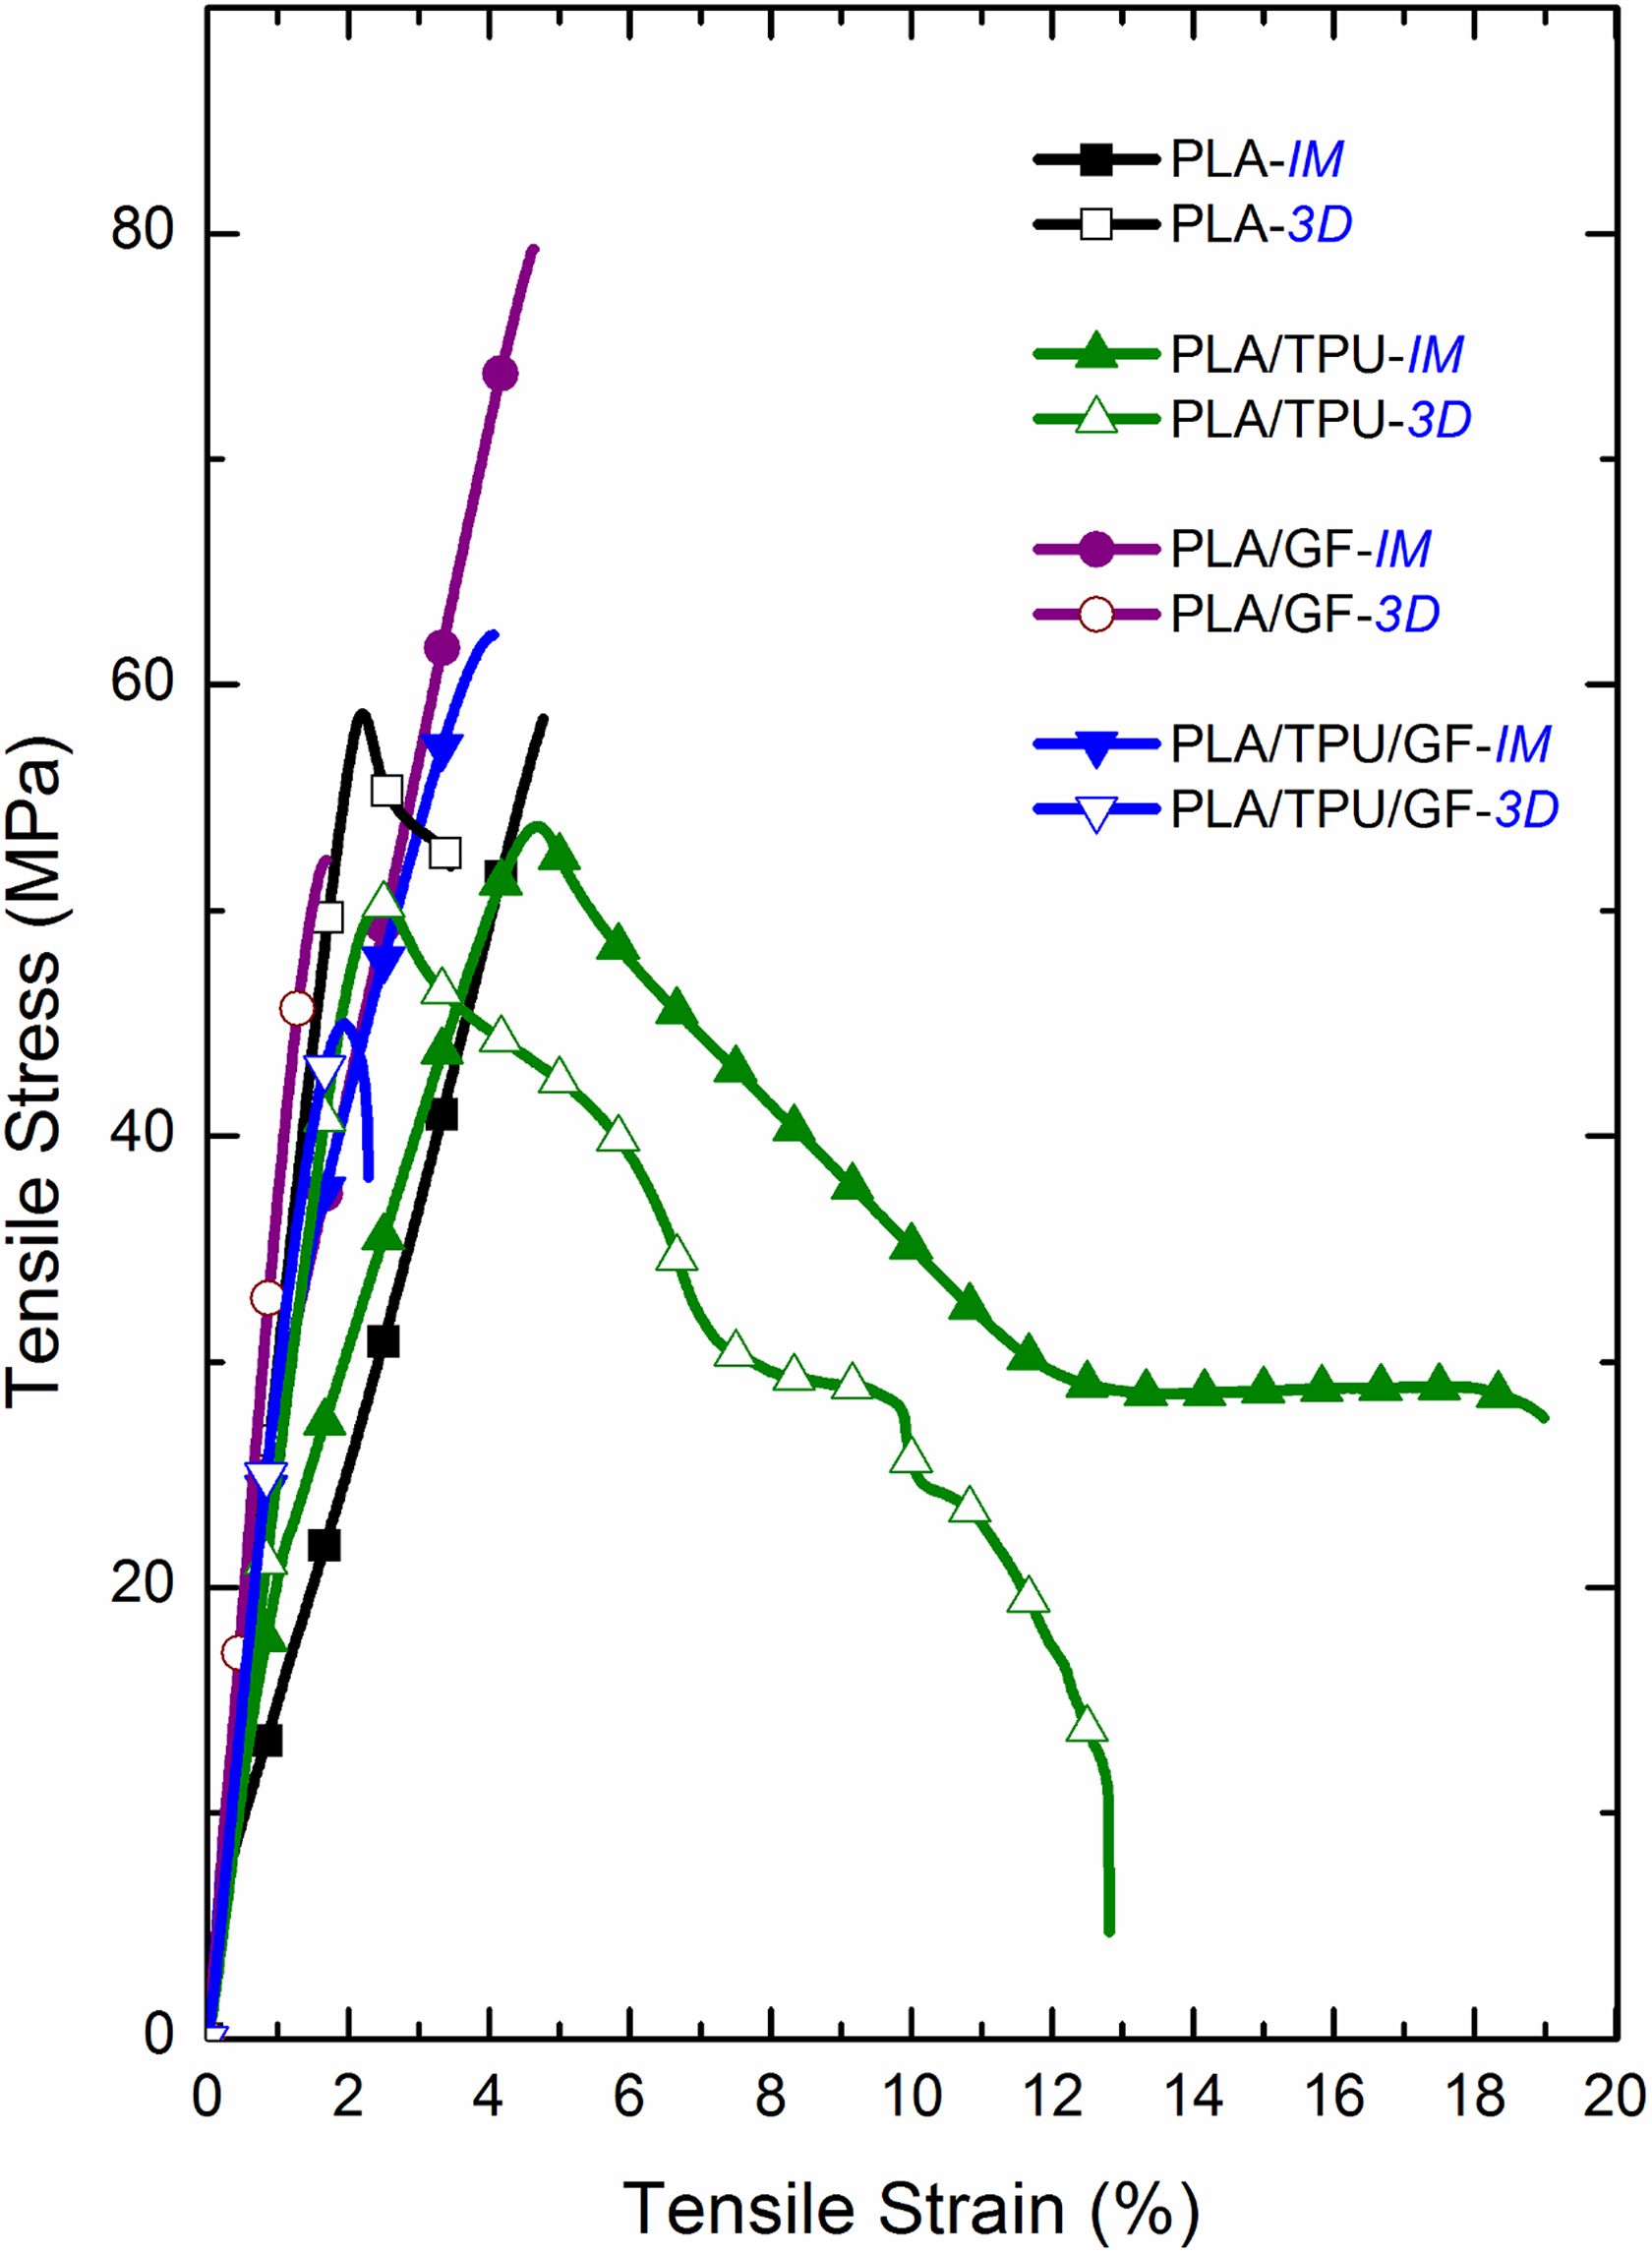
Comparison of the tensile stress–strain curves of injection-molded and 3D-printed specimens. 3D: 3D-printed; IM: injection-molded.
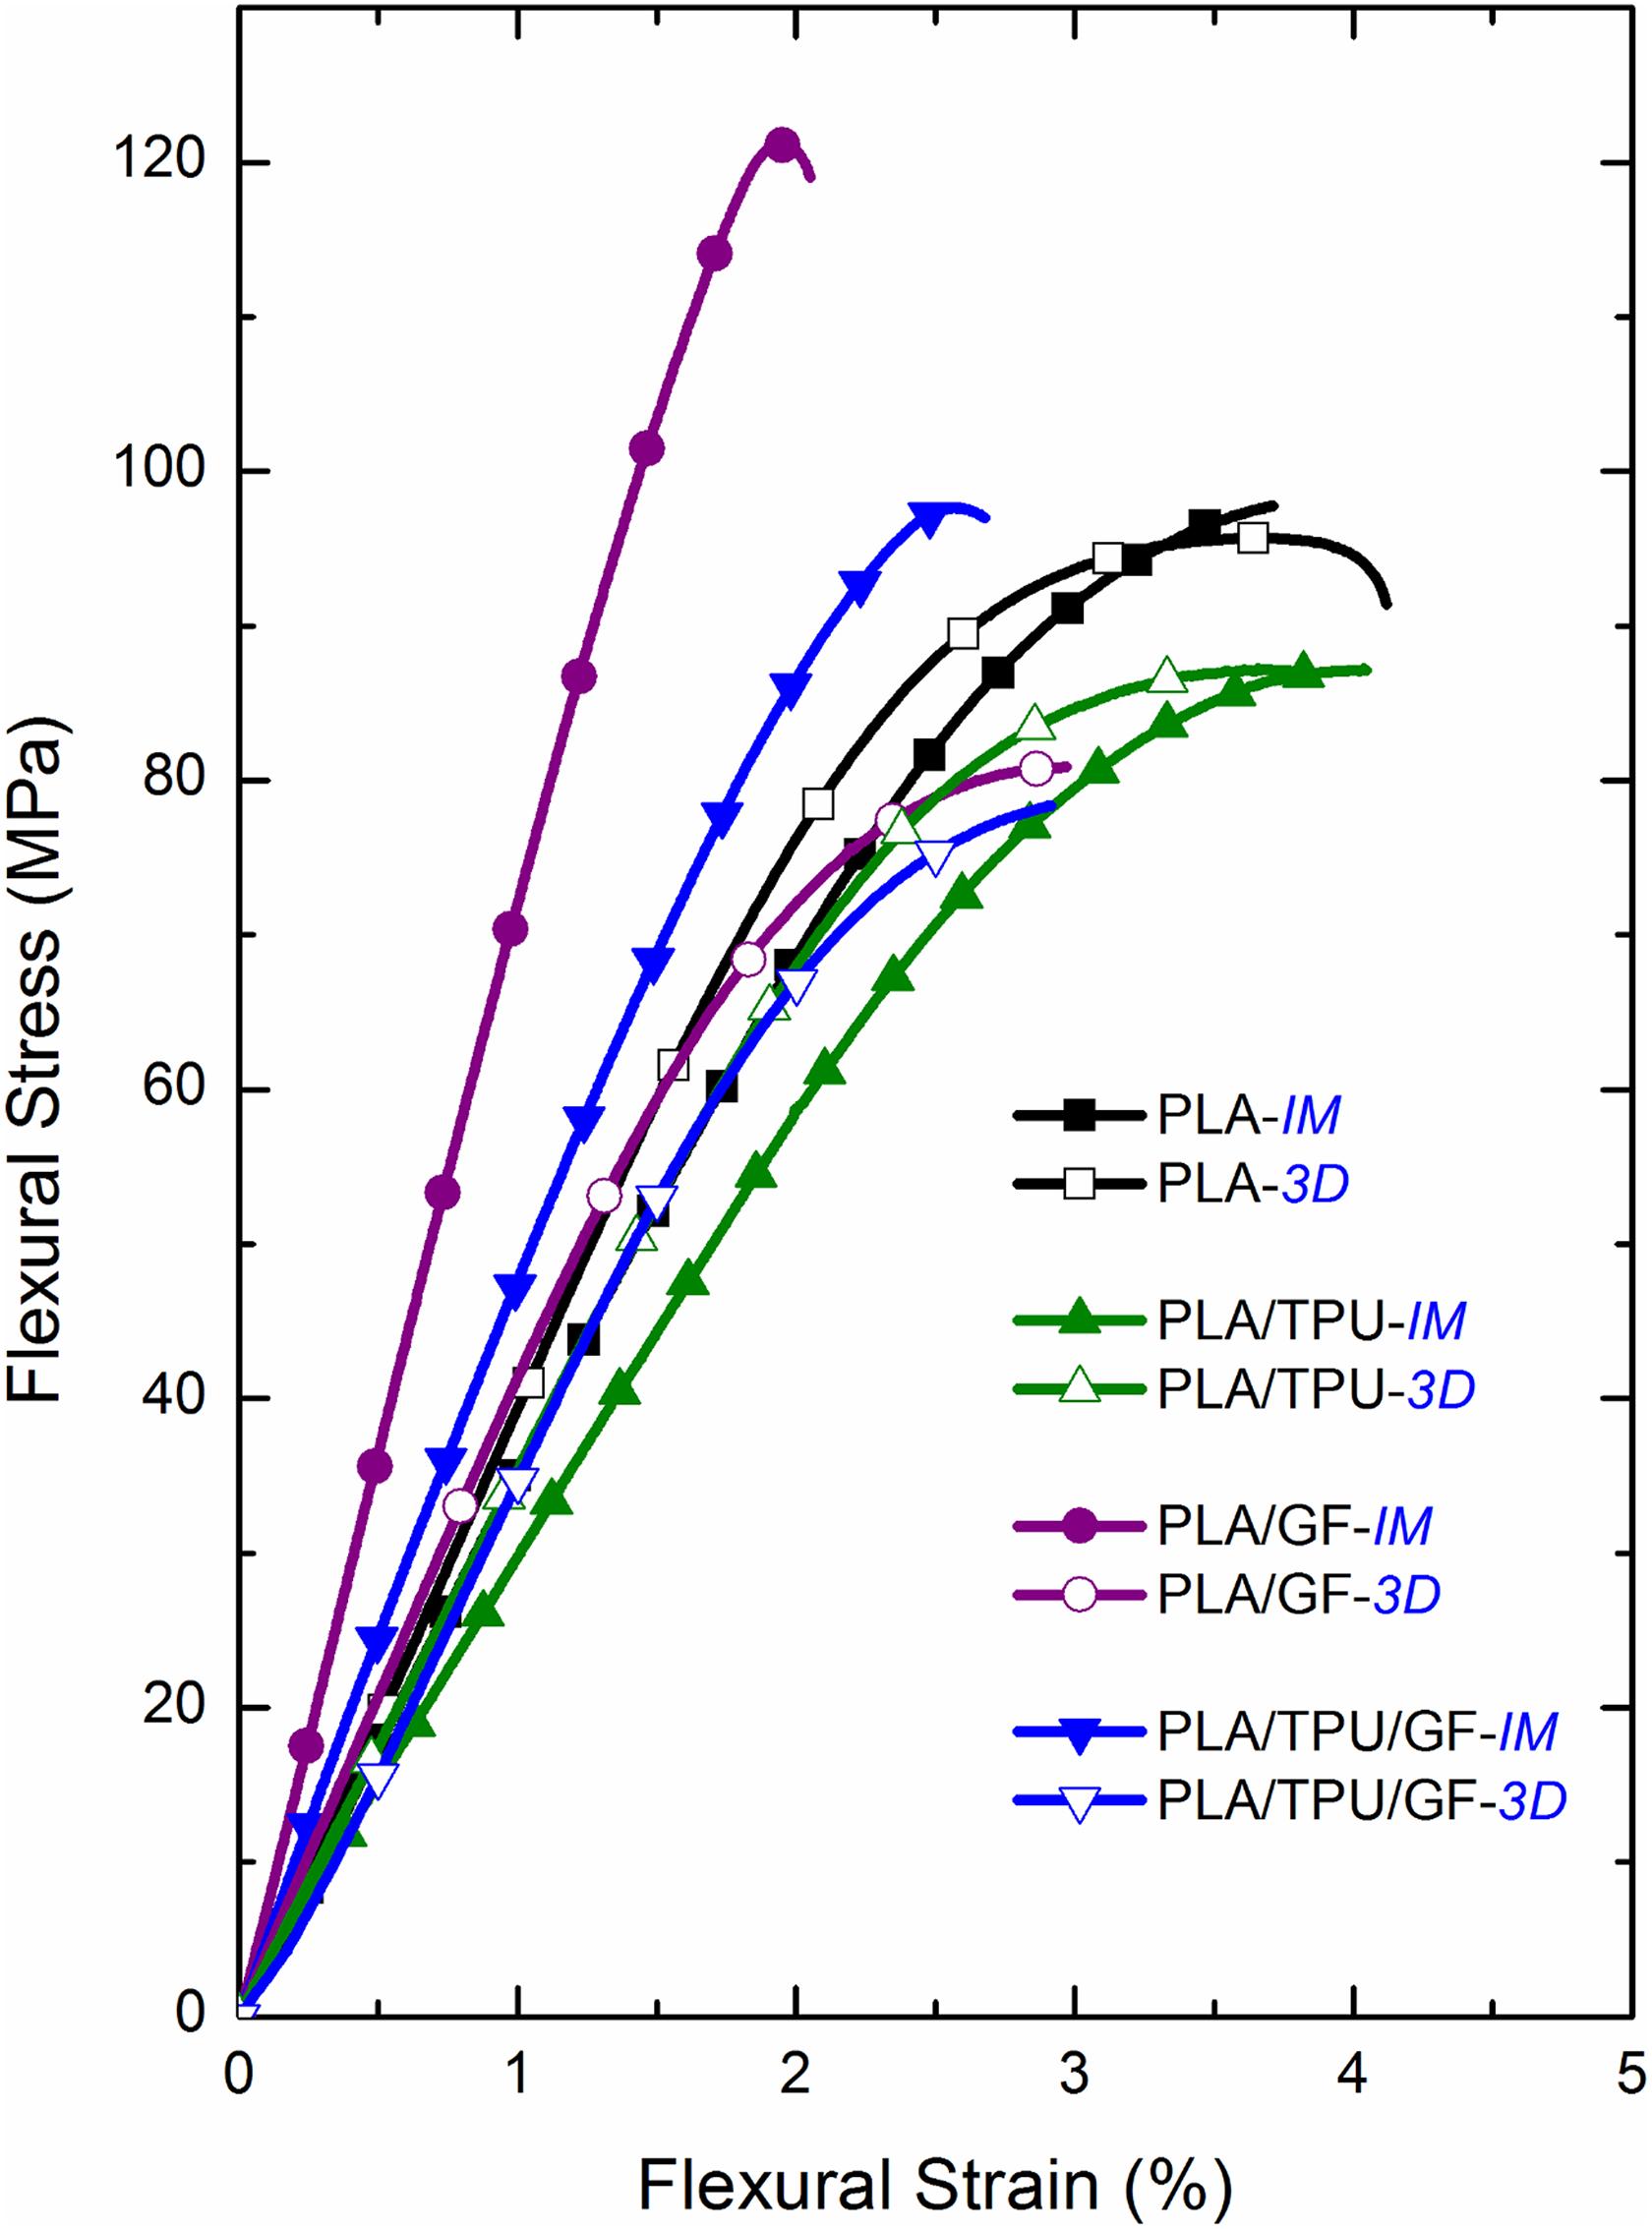
Comparison of the flexural stress–strain curves of injection-molded and 3D-printed specimens. 3D: 3D-printed; IM: injection-molded
Comparison of the tensile strength (σ TS), flexural strength (σ Flex), tensile modulus (E), flexural modulus (E Flex), and fracture toughness (K IC and G IC) of injection-molded and 3D-printed specimens.
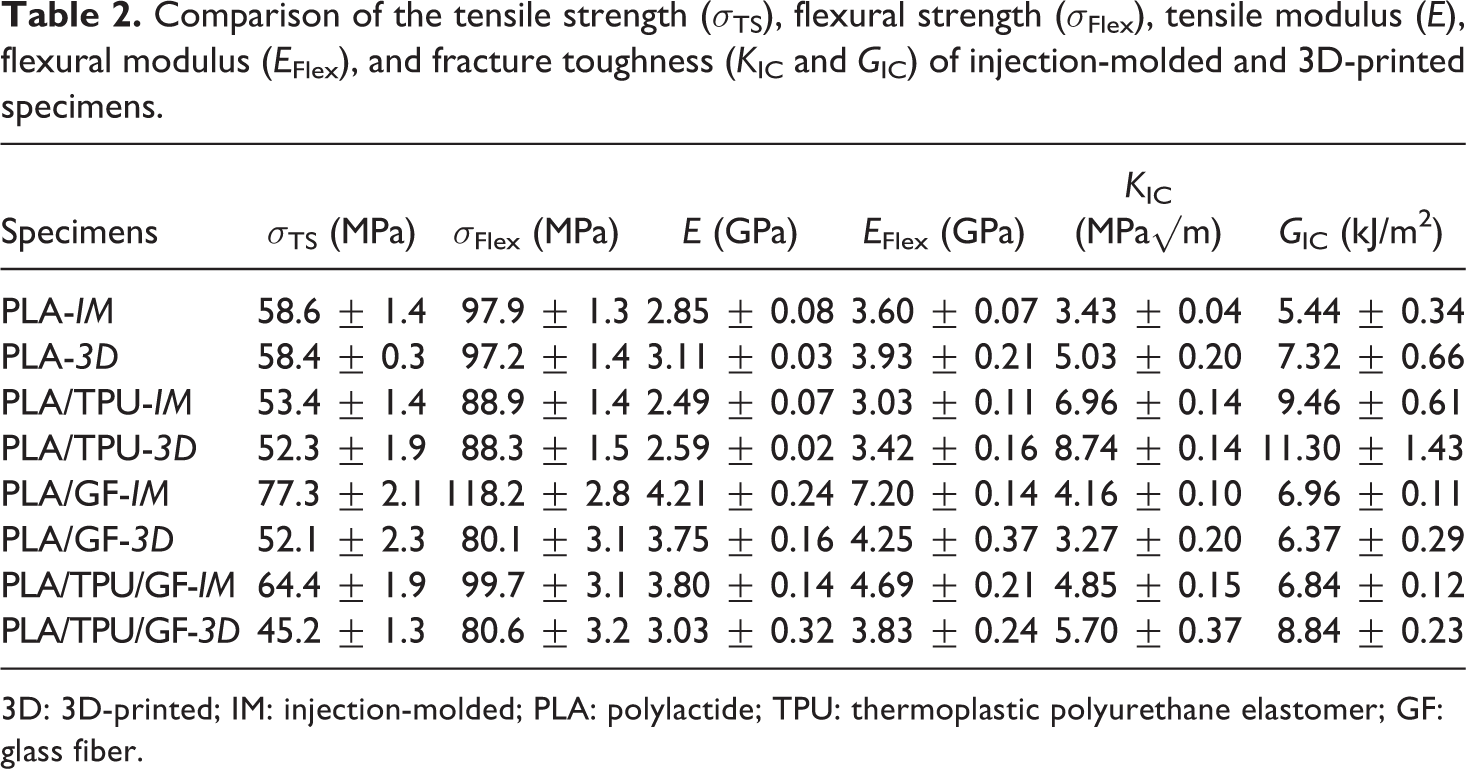
3D: 3D-printed; IM: injection-molded; PLA: polylactide; TPU: thermoplastic polyurethane elastomer; GF: glass fiber.
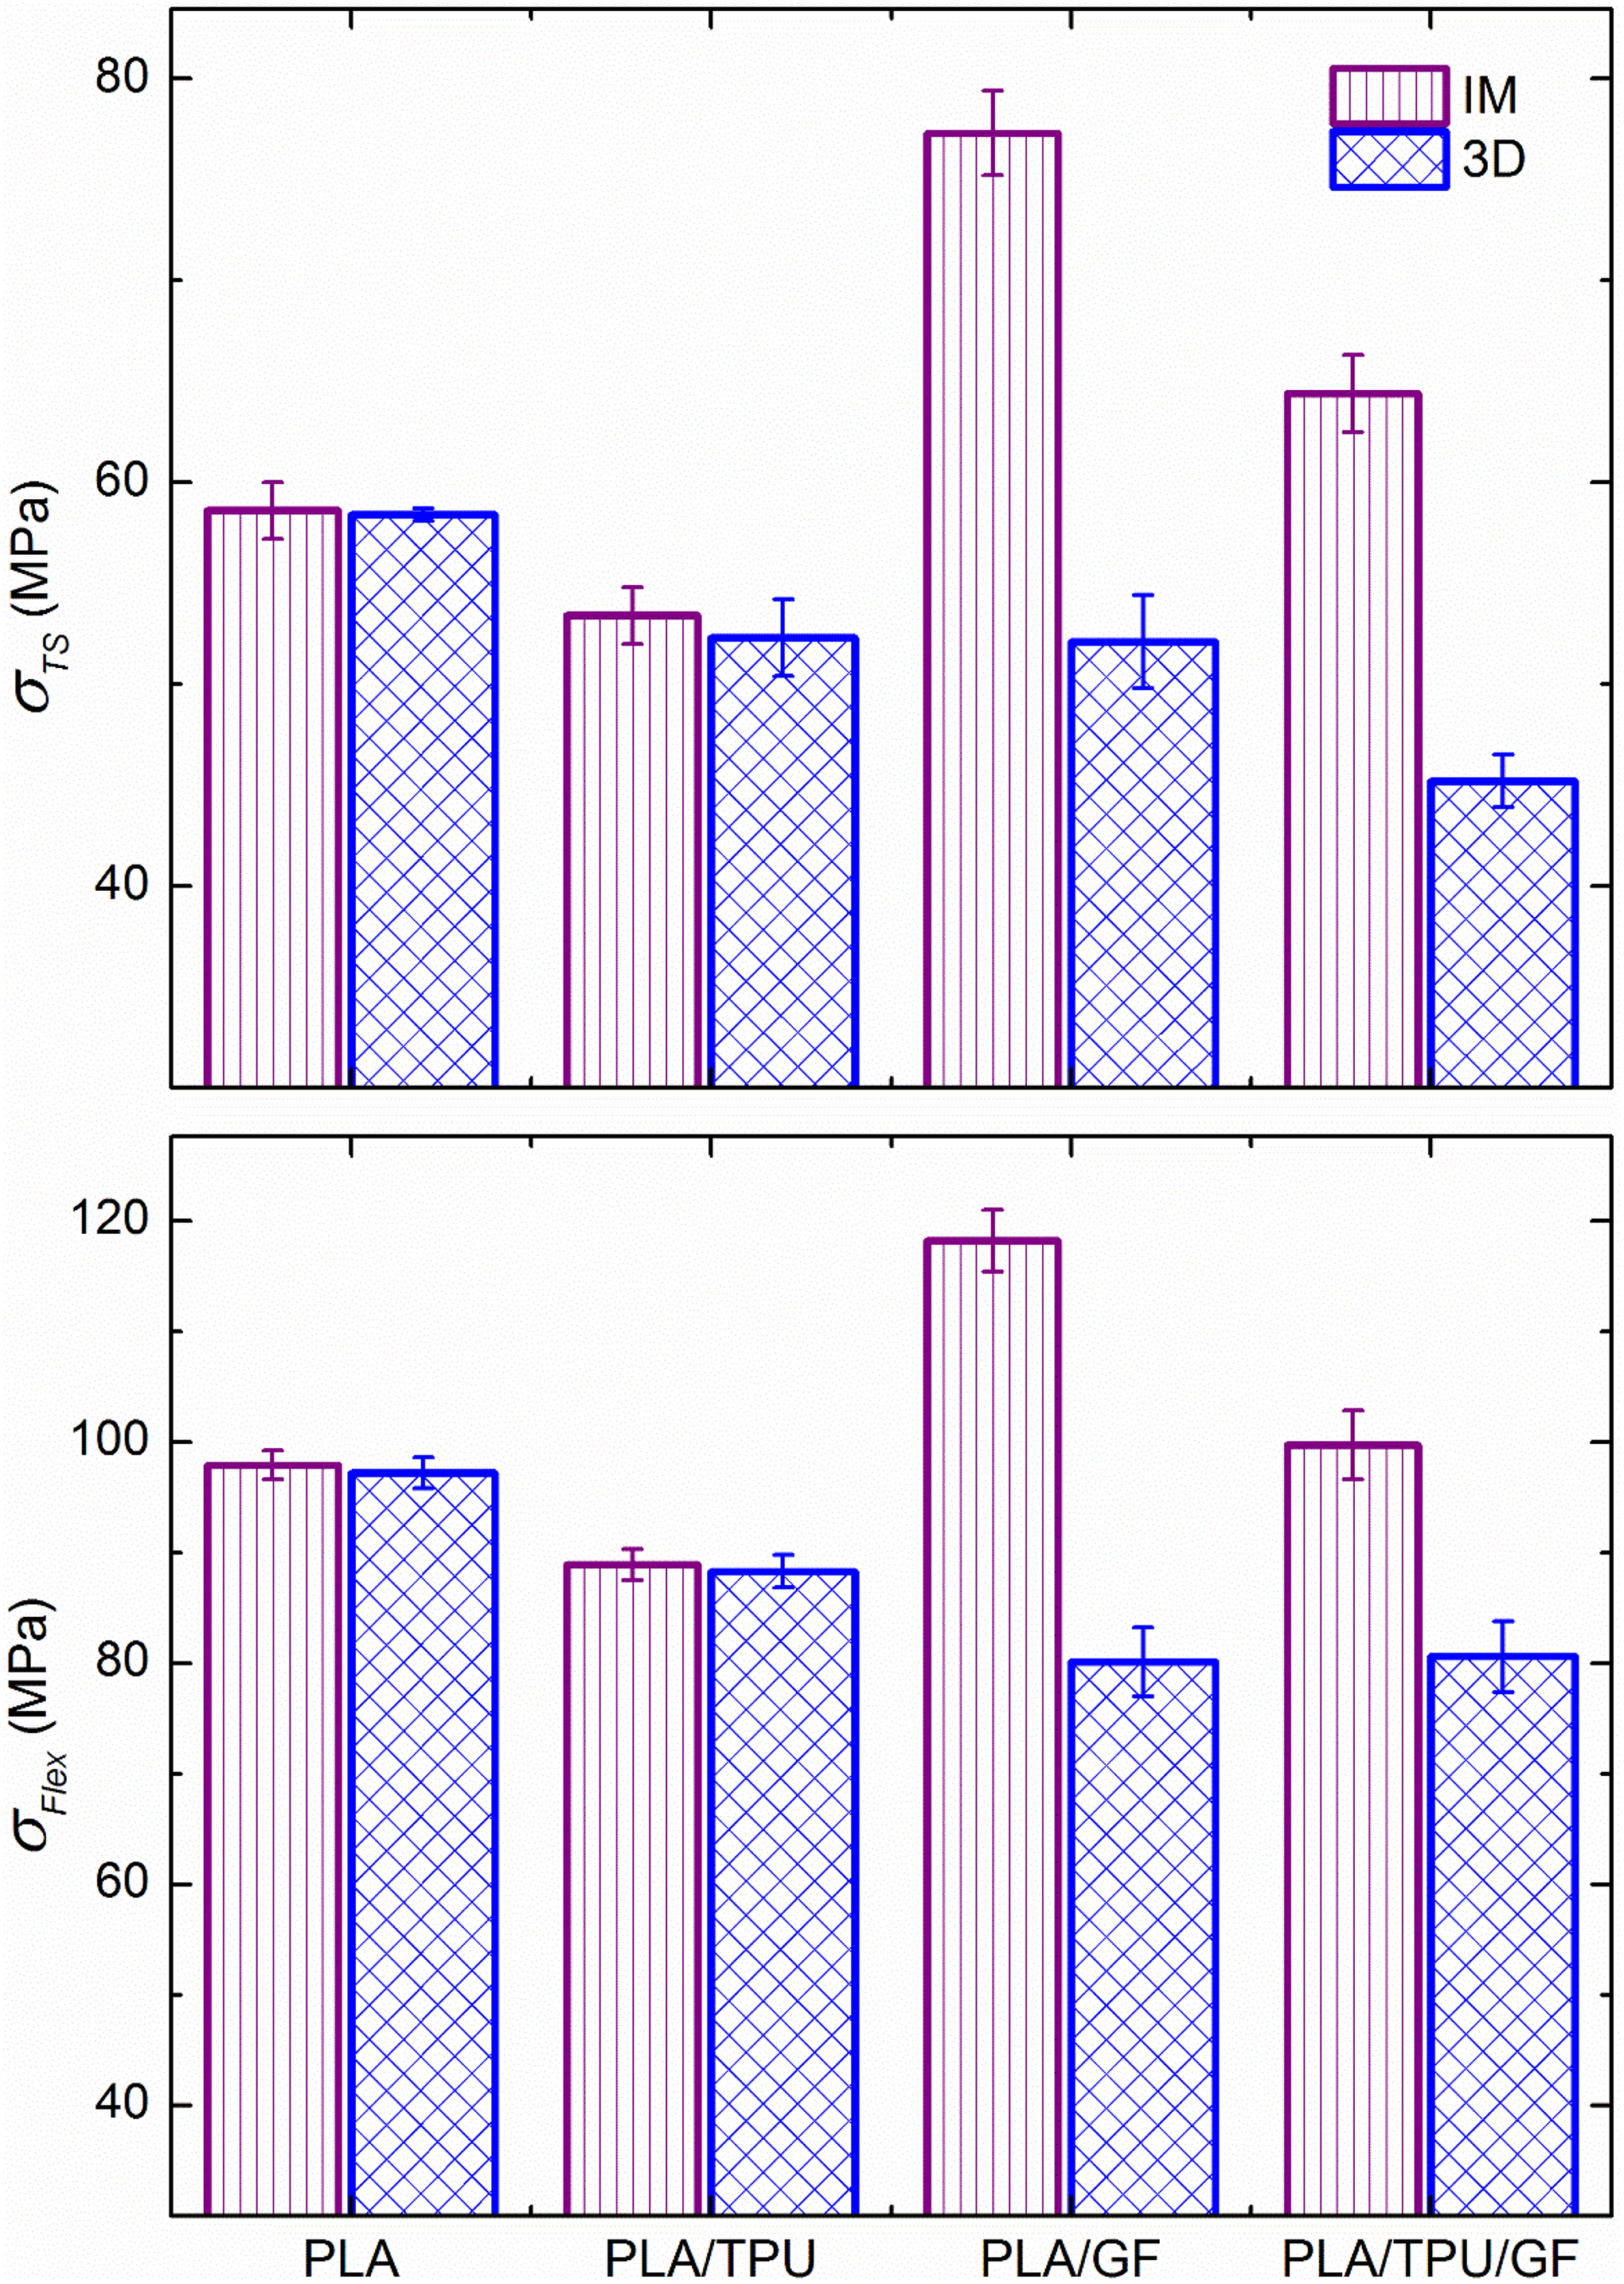
Comparison of the tensile strength and flexural strength of injection-molded and 3D-printed specimens. 3D: 3D-printed; IM: injection-molded
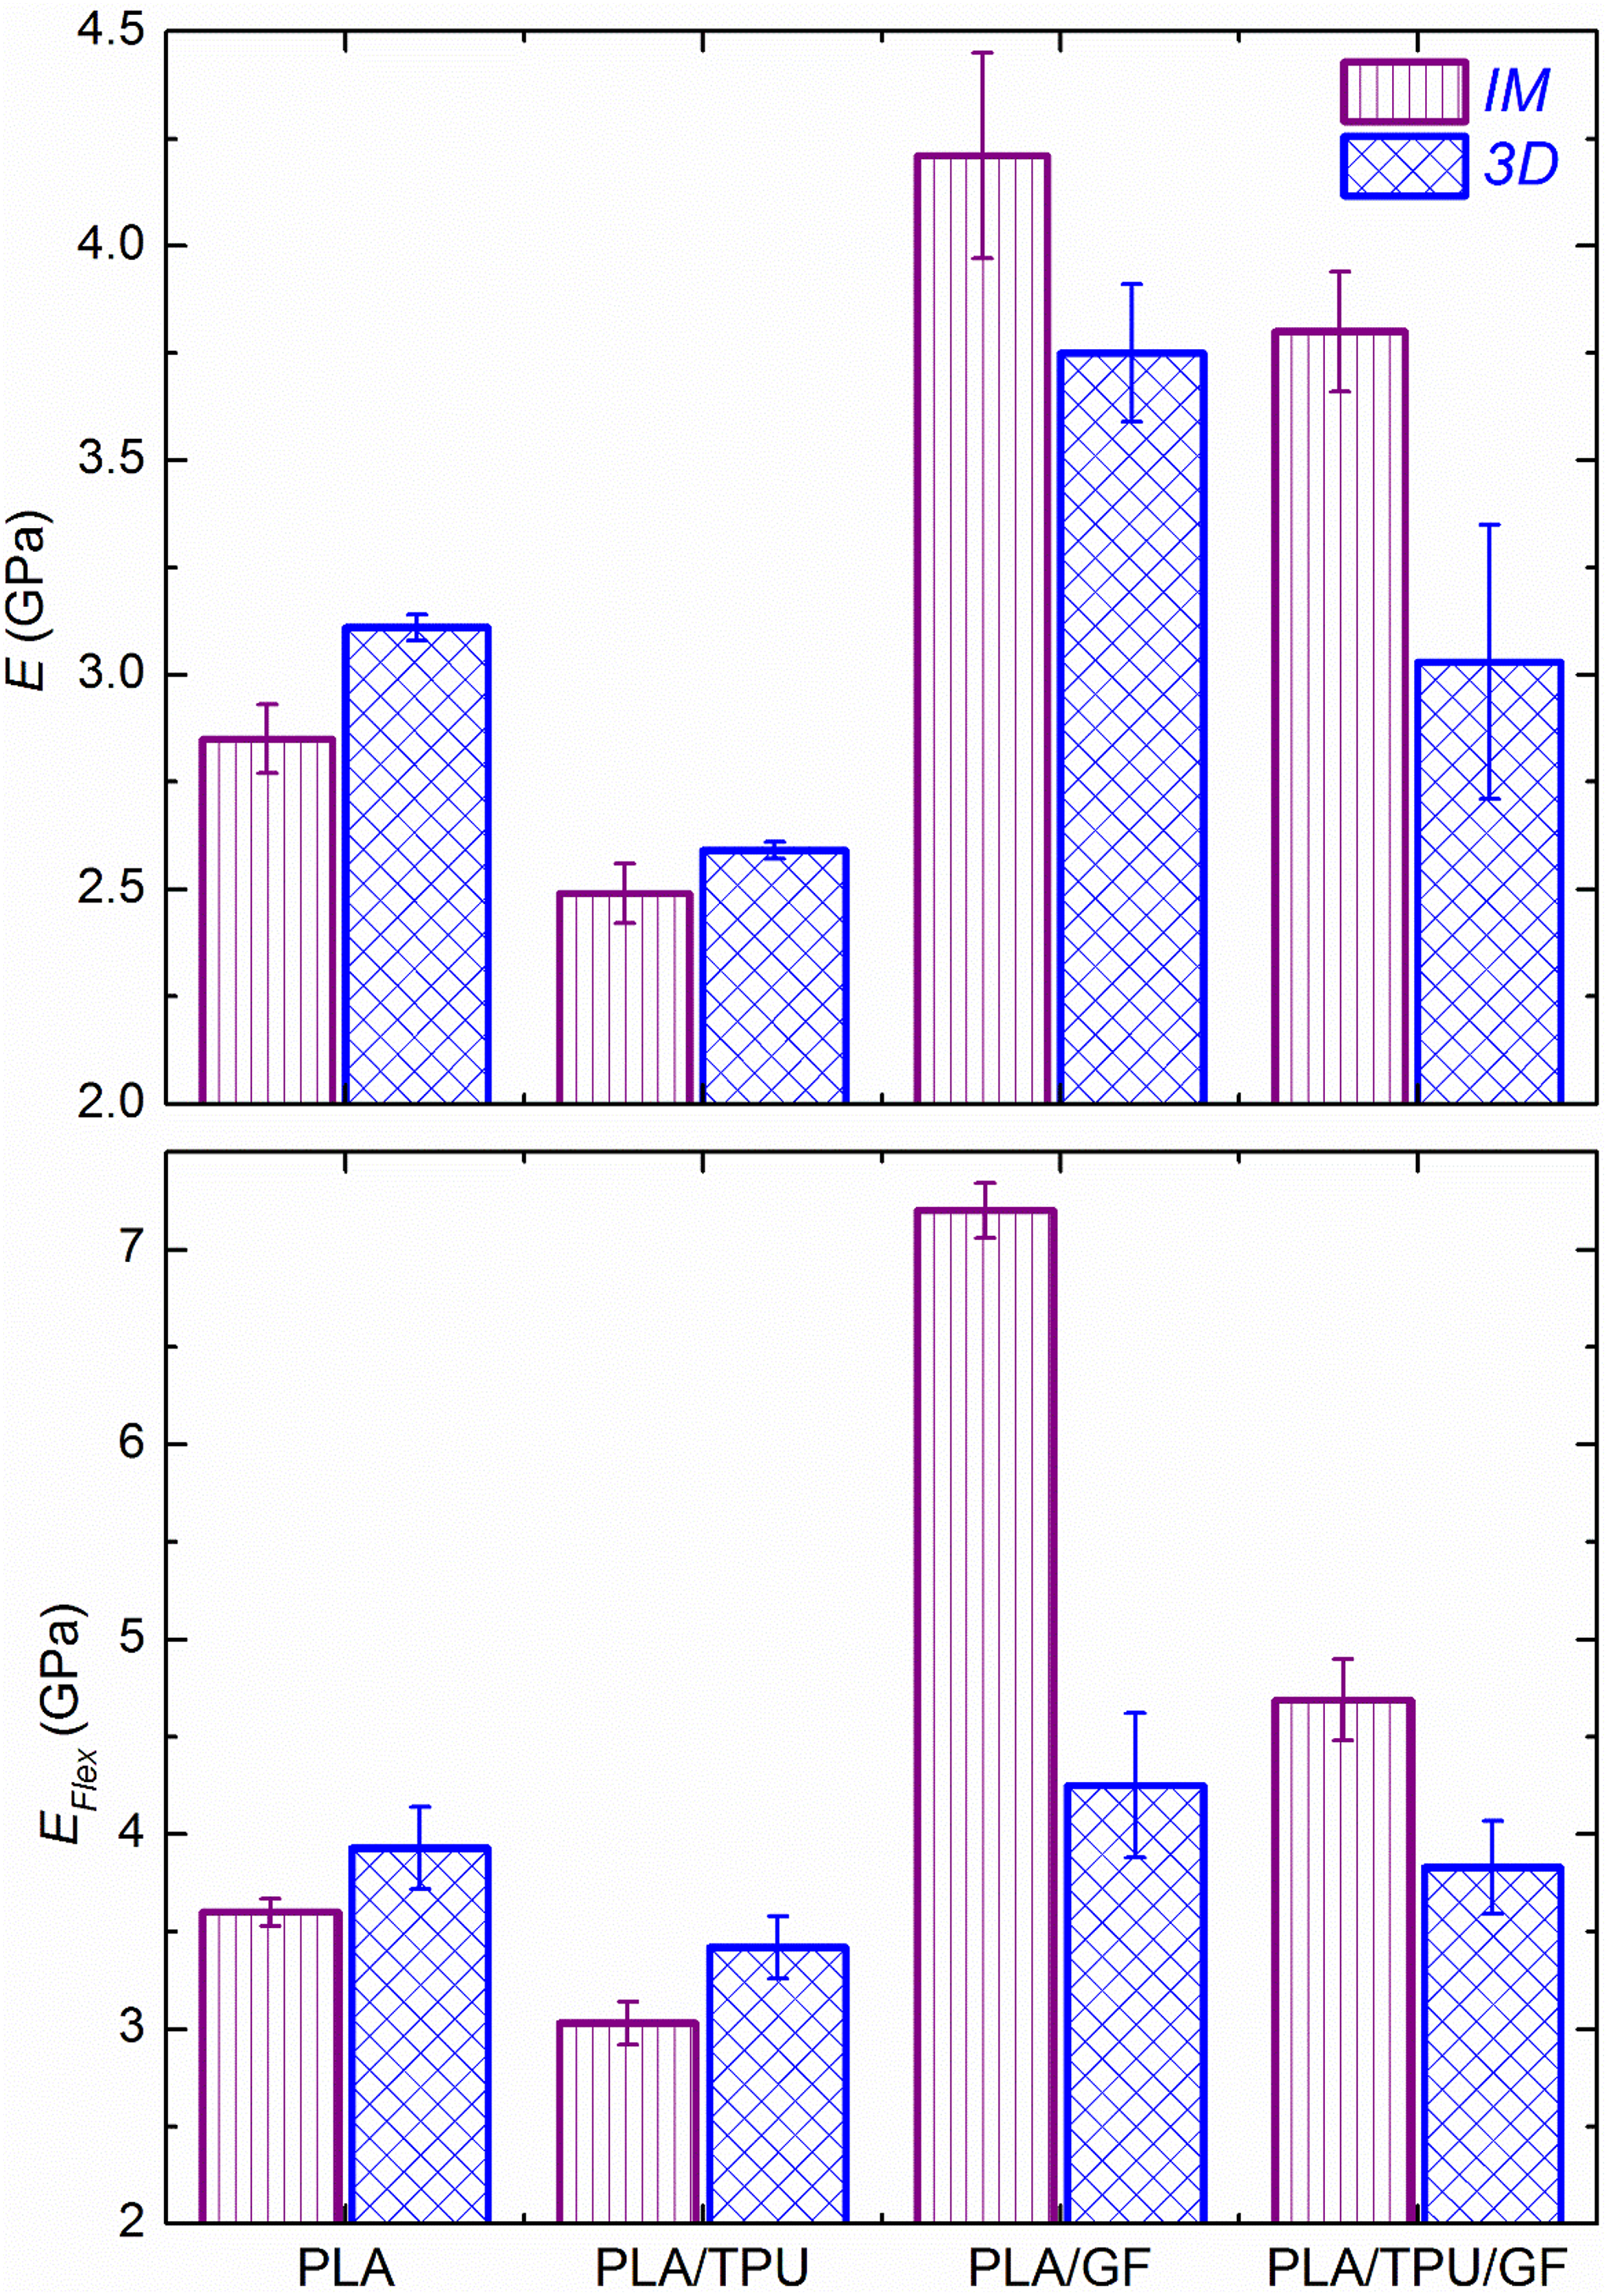
Comparison of the tensile modulus and flexural modulus of injection-molded and 3D-printed specimens. 3D: 3D-printed; IM: injection-molded.
These figures and Table 2 indicate that for the specimens of neat PLA and PLA/TPU blend, there were no influences of the injection molding and 3D-printing shaping processes on their strength values, because it was seen that both σ TS and σ Flex values of these specimens are almost equal.
Moreover, for these PLA and PLA/TPU specimens, the elastic modulus values (both E and E Flex) of 3D-printed specimens were slightly higher than that of the injection-molded specimens. For example, E and E Flex of the 3D-printed specimens were both 9% higher for neat PLA and 4% and 13% higher for PLA/TPU blend. These higher modulus values could be due to the stiffening action of the slightly textured structure formed during ±45° raster angle orientation of 3D-printing.
On the other hand, Table 2 also shows that for the GF reinforced specimens, there were significant reductions in the strength and elastic modulus values of their 3D-printed specimens. For example, the highest reductions in strength and modulus of the PLA/GF specimens were 32% in σ Flex and 41% in E Flex, while reductions for the PLA/TPU/GF specimens were 30% in σ TS and 20% in E values.
As discussed in the aforementioned SEM morphology analyses, the main reason for these reductions could be due to the very different orientation of GF reinforcements, being almost all parallel to the longitudinal axis of injection-molded specimens leading to highly effective load transfer mechanism for strength and stiffening mechanism for modulus. In the 3D-printed specimens, ±45° oriented GF reinforcements resulted in decreased level of strengthening and stiffening mechanisms.
Since PLA is an inherently brittle biopolymer, measurement of its toughness becomes crucial. Thus, in order to compare the fracture toughness values of injection-molded and 3D-printed specimens, both their “critical stress intensity factor (K IC)” and “critical strain energy release rate (G IC)” values were determined and compared in Table 2 and Figure 8. It is known that K IC and G IC values basically indicate the ability of materials to withstand crack initiation and propagation.
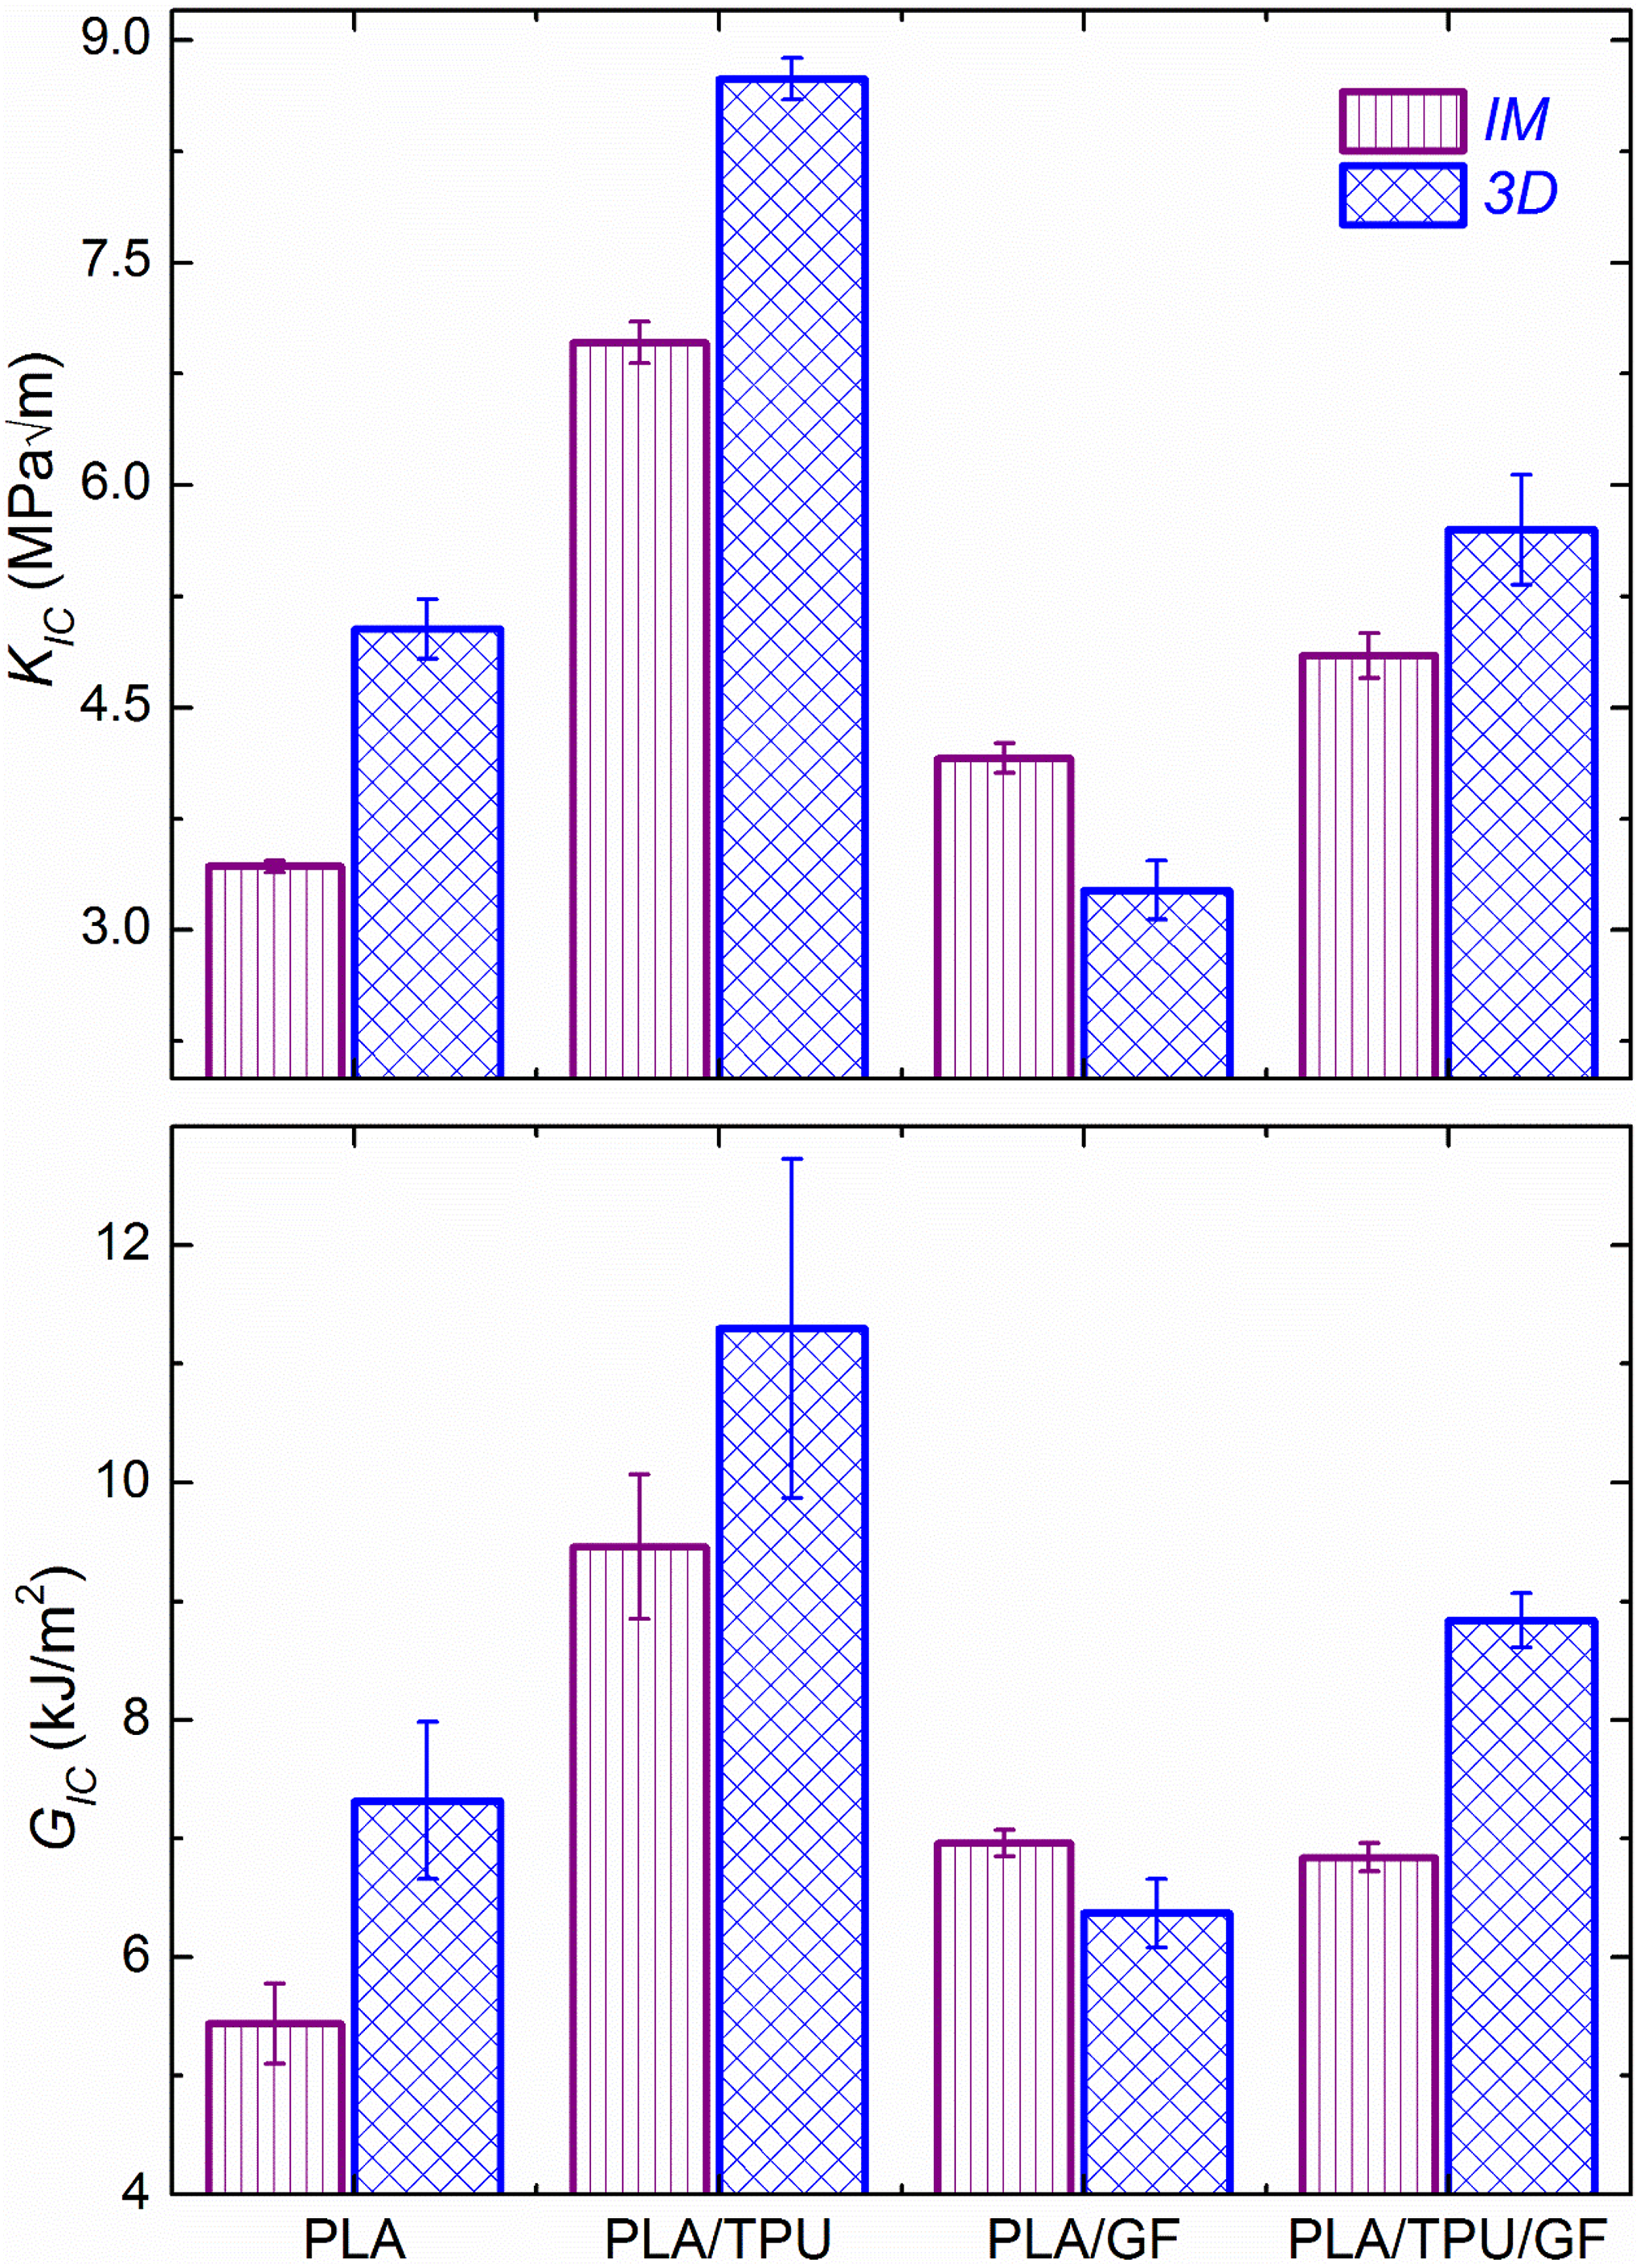
Comparison of the fracture toughness of injection-molded and 3D-printed specimens. 3D: 3D-printed; IM: injection-molded.
Table 2 and Figure 8 show that both fracture toughness values of 3D-printed neat PLA and PLA/TPU specimens were again very beneficial compared with their injection-molded specimens. The benefits in the K IC and G IC values of neat PLA were 47% and 35%, respectively, while these benefits were 26% and 19% for the PLA/TPU specimens, respectively. This behavior could be again due to the ±45° textured structure of specimens leading to additional toughening mechanism of “crack deflection” in the textured body.
However, for PLA/GF composites, the fracture toughness values of 3D-printed specimens were slightly lower compared with their injection-molded specimens, because crack deflection mechanism at the ±45° oriented GF reinforcements of 3D-printing would be lower compared with 90° oriented GF reinforcements in injection molding. This means that perpendicular GF reinforcements to the crack propagation plane would be much more effective in crack deflection and crack bowing mechanisms.
In the PLA/TPU/GF composite, the fracture toughness values of 3D-printed specimens were again beneficial compared with their injection-molded specimens. This time, the benefits of 3D-printing were 18% in K IC and 29% in G IC, because in this specimen reduced crack deflection toughening effectiveness with ±45° oriented GF reinforcements was recovered by the enormous level of rubber toughening mechanism of TPU domains in the matrix.
Finally, in order to reveal percent benefits and percent reductions in the mechanical properties of 3D-printed specimens compared with injection-molded ones, Figure 9 was constructed. It can be concluded that the use of 3D-printing in the shaping of neat PLA and PLA/TPU blend was generally very beneficial; on the other hand, due to the differences in the orientation of GF reinforcements, there could be certain reductions in the mechanical performance of PLA/GF and PLA/TPU/GF.
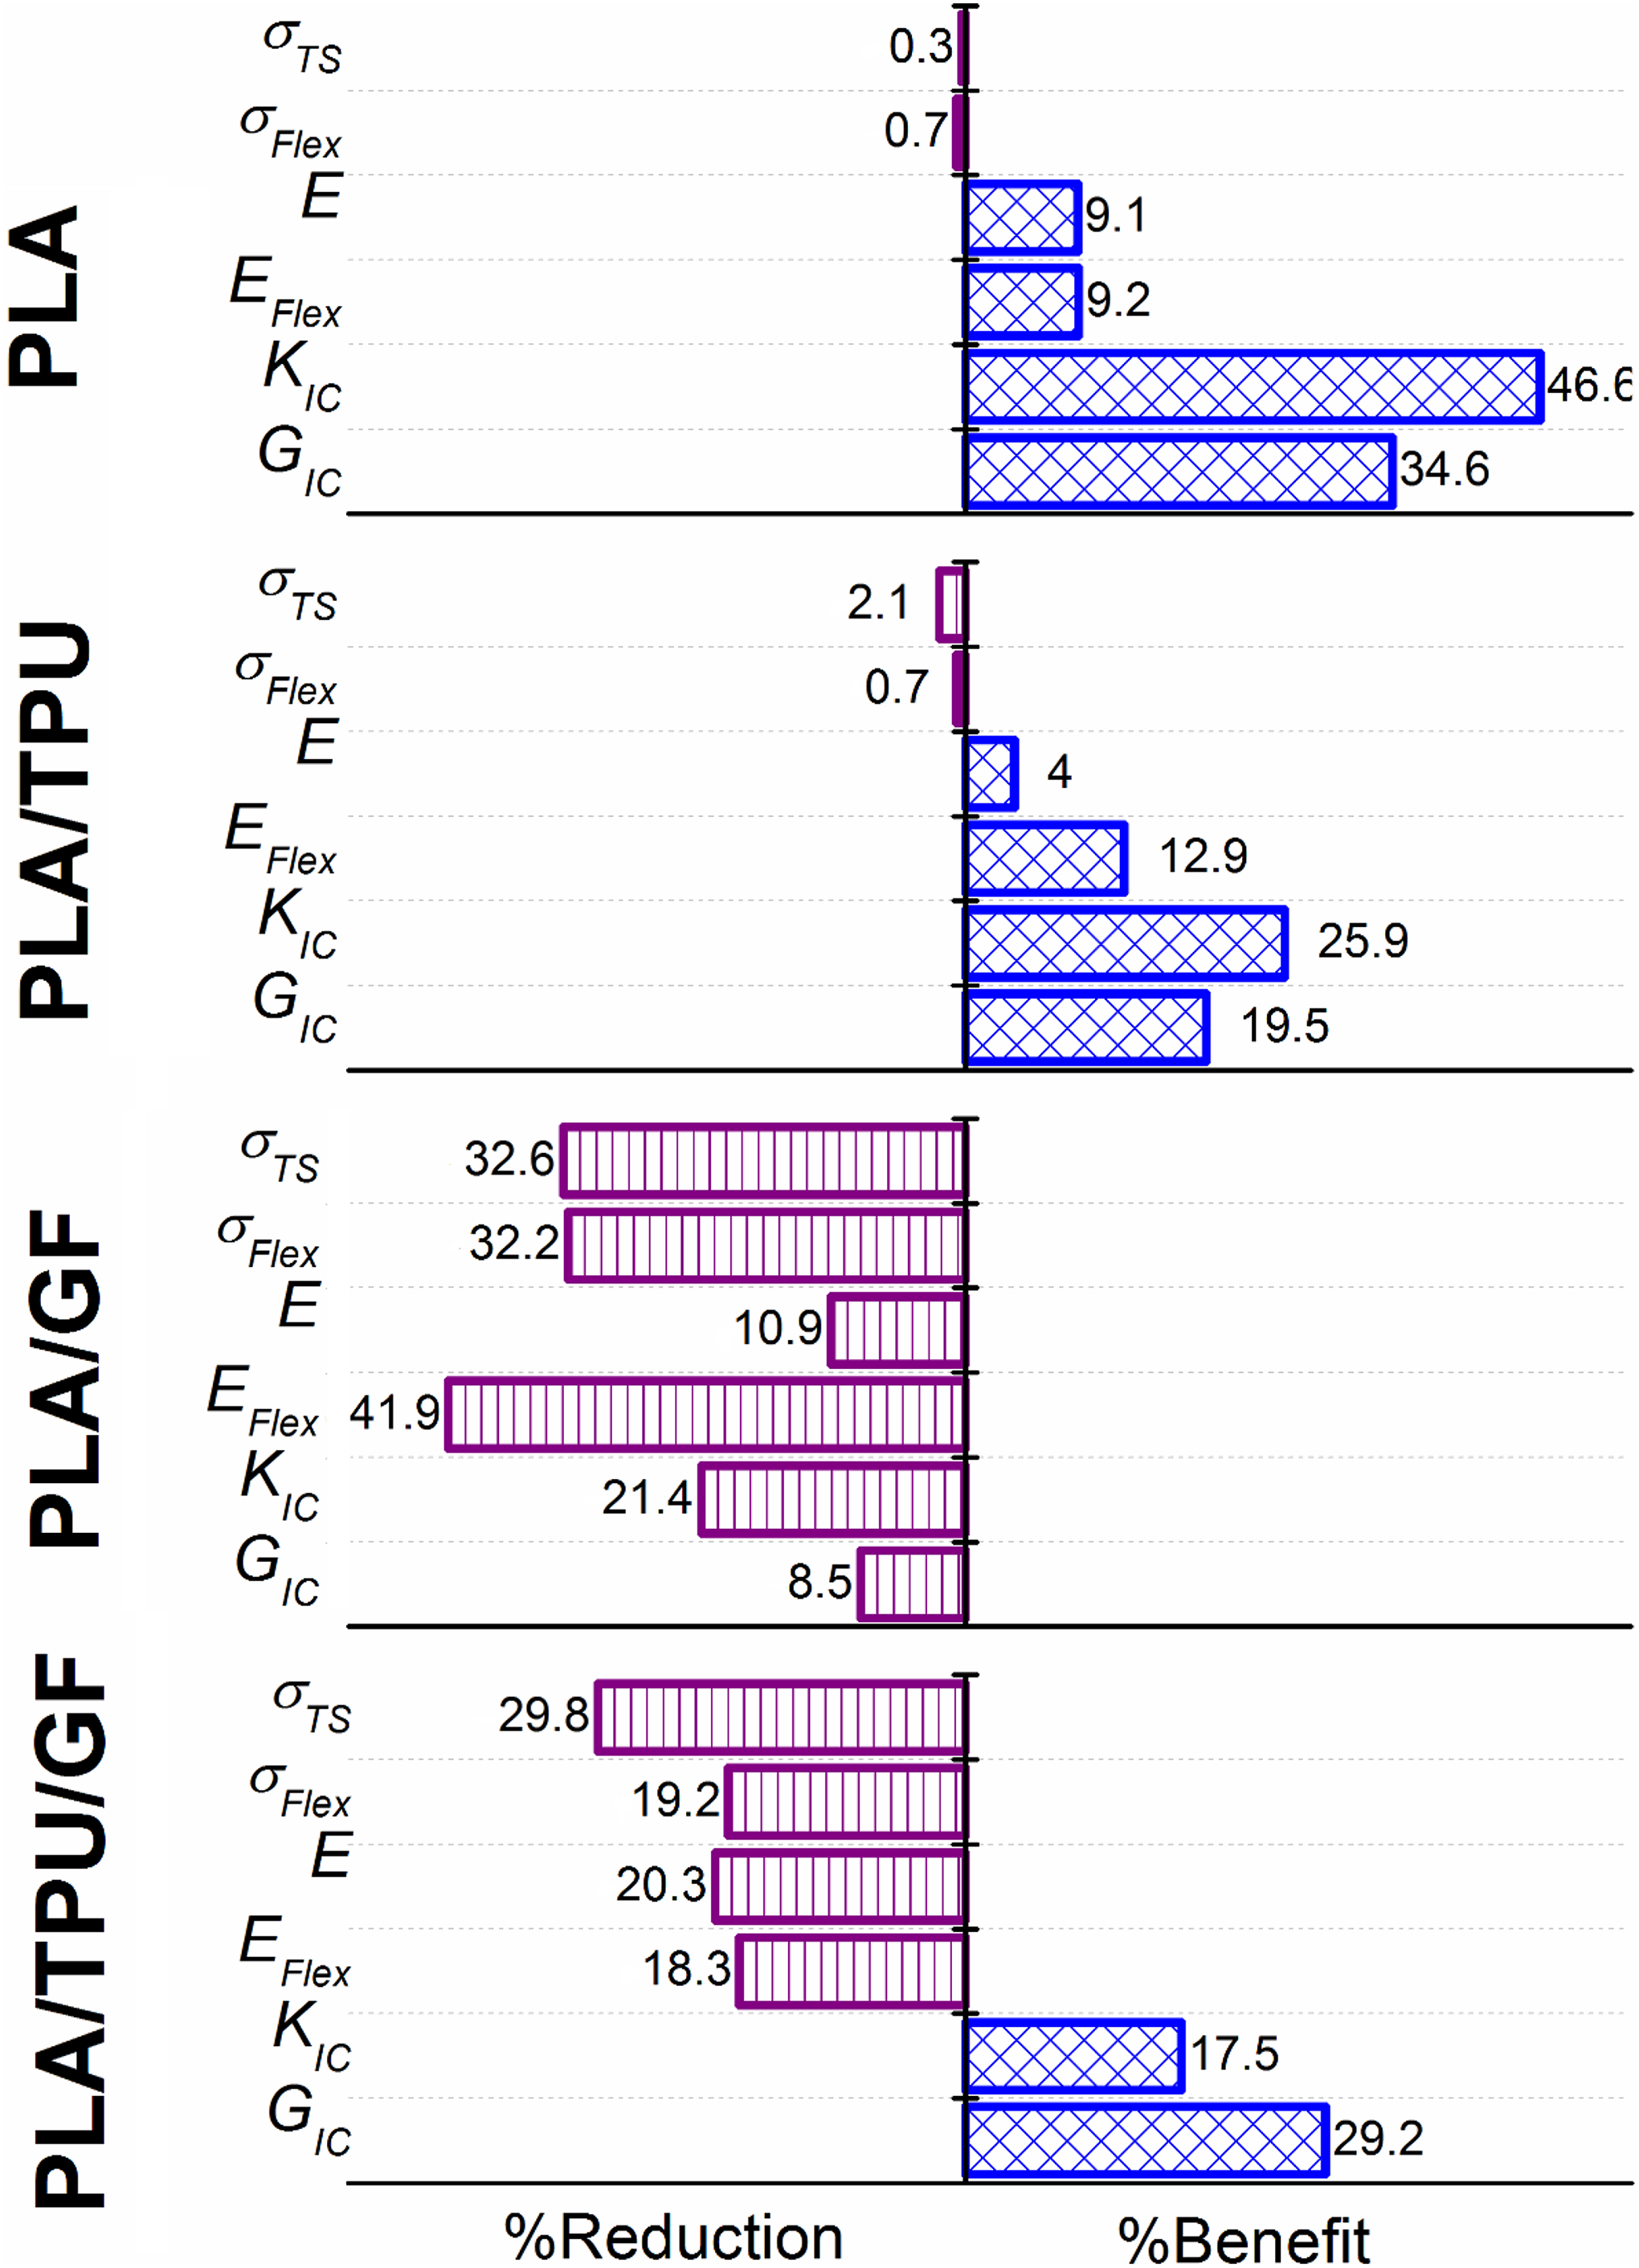
Percent benefits and percent reductions in the mechanical properties of 3D-printed specimens compared with injection-molded specimens. 3D: 3D-printed; IM: injection-molded
Comparison of the thermal behavior of the specimens
The first analysis to compare the thermal behavior of injection-molded and 3D-printed specimens was DSC. First, heating thermograms of the specimens were given in Figure 10, while the important transition temperatures, that is, glass transition (T g), cold crystallization (T c), and melting (T m) temperatures together with melting and crystallization enthalpies (ΔH m and ΔH c) including percent crystallinity (X C) of the specimens were tabulated in Table 3. The relation used in the calculation of percent crystallinity is given below, where w PLA is the weight fraction of the PLA matrix and ΔH m° is the melting enthalpy of 100% crystalline PLA determined as 93 J/g in the literature. 15
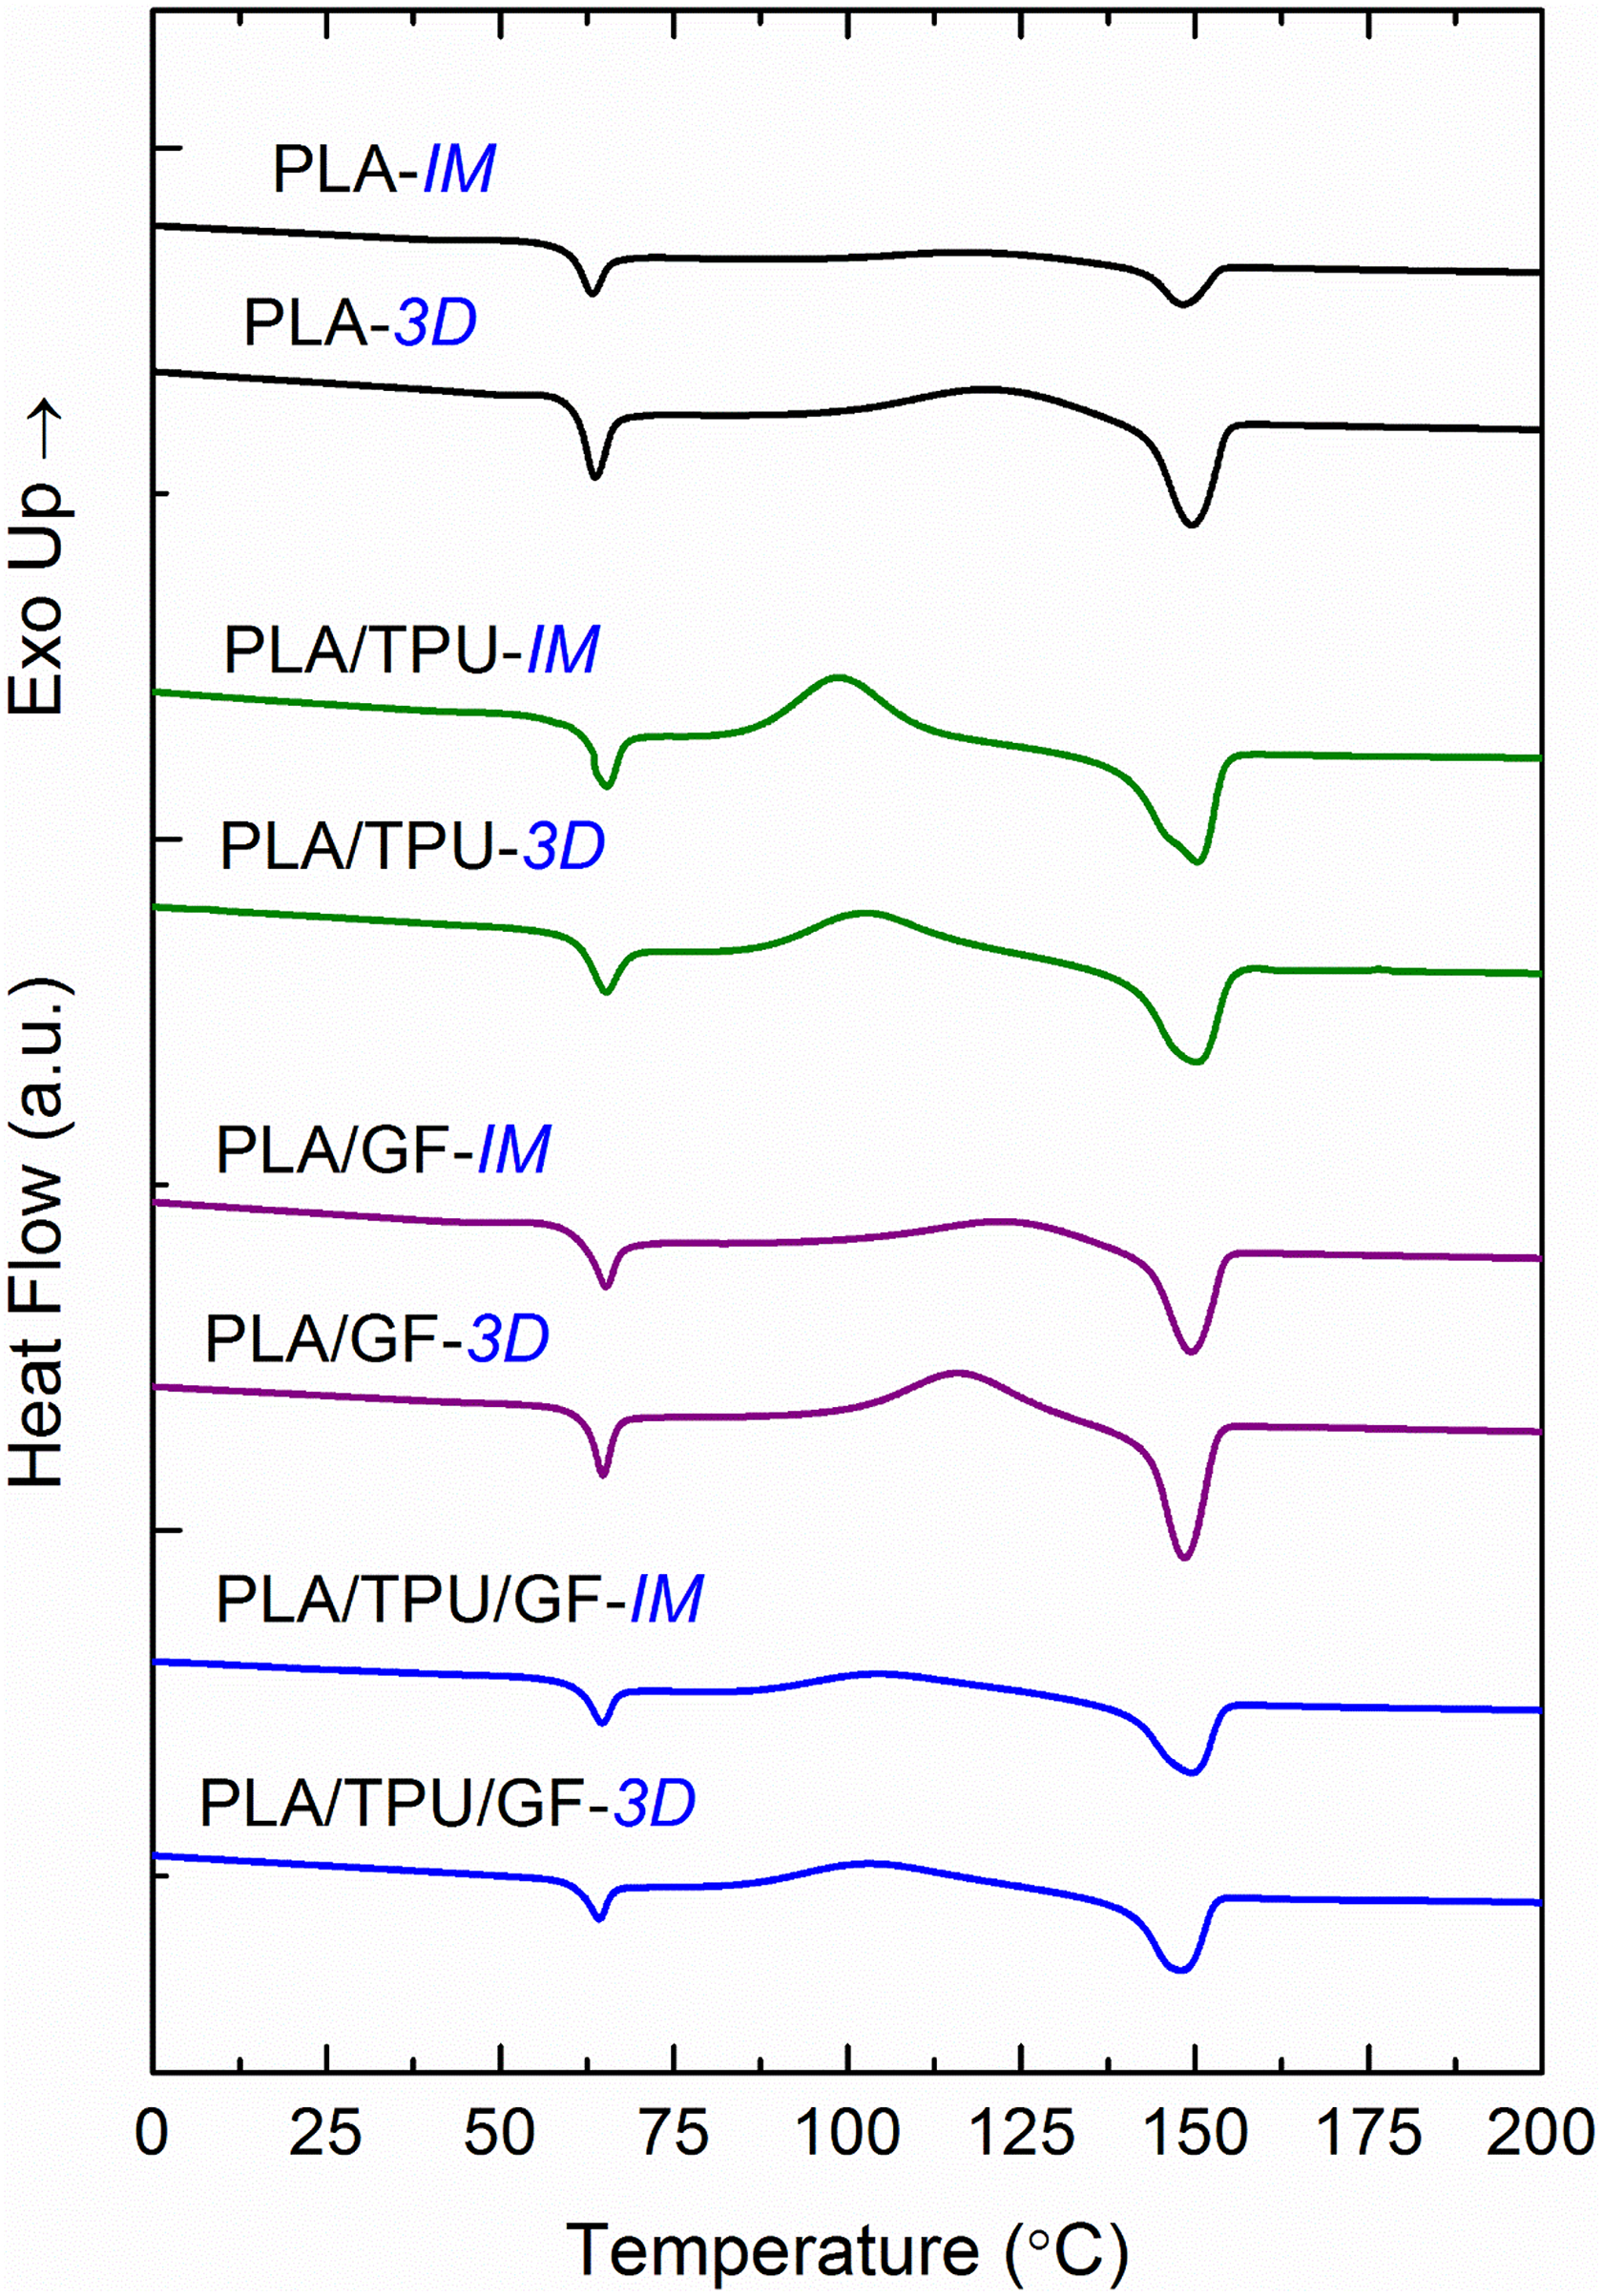
Comparison of the first heating DSC thermograms of injection-molded and 3D-printed specimens. 3D: 3D-printed; IM: injection-molded; DSC: differential scanning calorimetry.
Comparison of the transition temperatures (T g , T c, and T m), enthalpies (ΔH m and ΔH c), and crystallinity percent (X C) of injection-molded and 3D-printed specimens during DSC first heating.
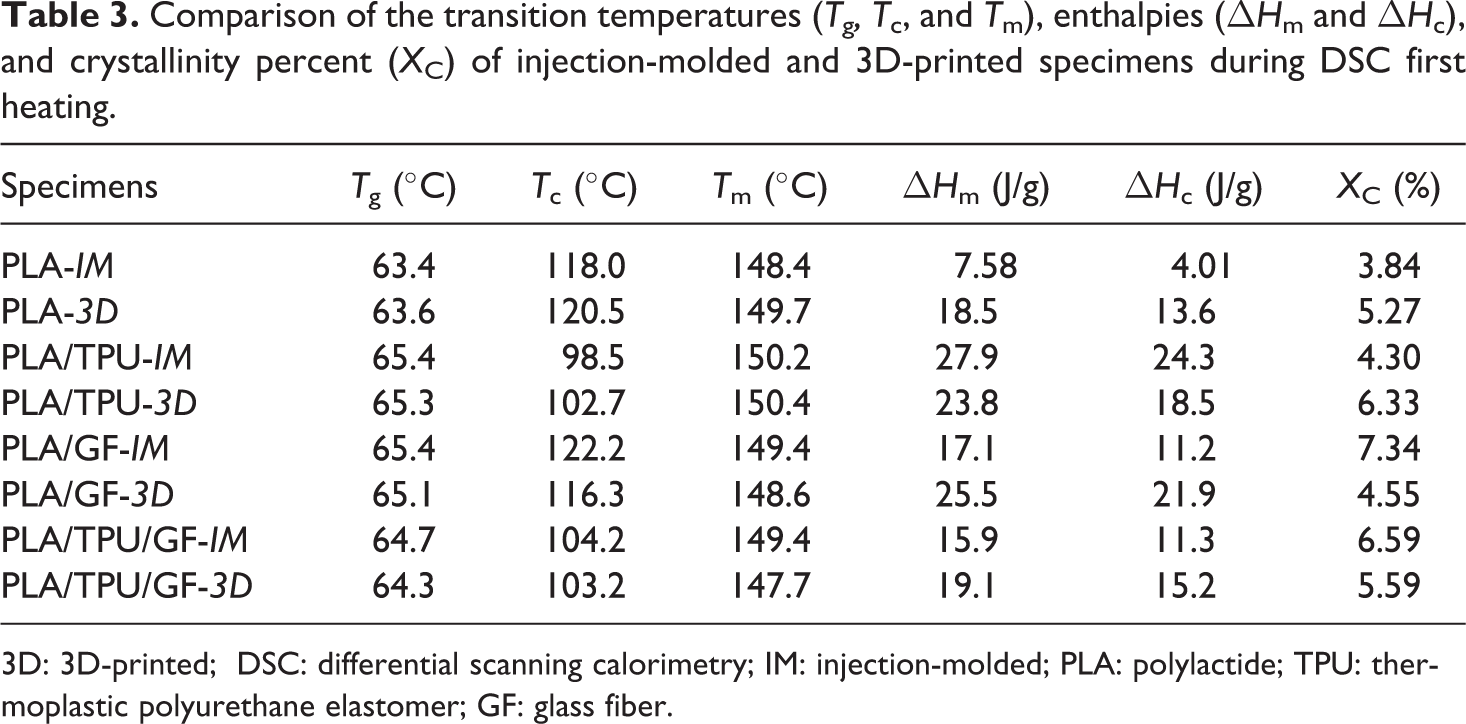
3D: 3D-printed; DSC: differential scanning calorimetry; IM: injection-molded; PLA: polylactide; TPU: thermoplastic polyurethane elastomer; GF: glass fiber.
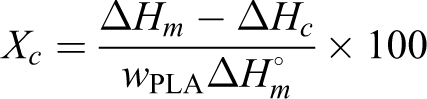
Table 3 and Figure 10 show that the two shaping processes used in this study do not lead to any differences in the transition temperatures (T g, T c, and T m) of PLA-based materials, because it is seen that the values of all these transition temperatures of injection-molded and 3D-printed specimens are almost equal.
On the other hand, shaping by injection molding and 3D-printing has certain influences on the enthalpies and consequently on the crystallinity amount (X C) of the specimens. For example, percent X C of the injection-molded PLA specimen is 3.84, while it is 5.27 for the 3D-printed one; similarly, these values are 4.30 and 6.33 for the PLA/TPU blend, respectively. It could be interpreted that the cooling rate during 3D-printing is rather lower than the cooling rate during injection molding, so that macromolecular PLA chains have more time to crystallize during 3D-printing.
However, Table 3 indicates that the crystallinity amount of GF reinforced specimens (both PLA/GF and PLA/TPU/GF) shaped by 3D-printing was lower than their injection-molded specimens, because these high aspect ratio GF reinforcements could hinder the conformational mobility of PLA chains to crystallize.
The second analysis to compare the thermal behavior of injection-molded and 3D-printed specimens was TGA. TGA curves of the specimens were given in Figure 11, while the data determined were tabulated in Table 4 as T 5%, T 10%, and T 25%, representing the thermal degradation temperatures of the samples at 5, 10, and 25% mass losses, and T max representing the temperature at maximum mass loss. In the table, percent residue of each specimen determined at 550°C was also included. Table 4 and Figure 11 revealed that shaping by injection molding and 3D-printing had no influences on the thermal degradation temperatures of all PLA-based materials, because it is seen that all values are almost equal.
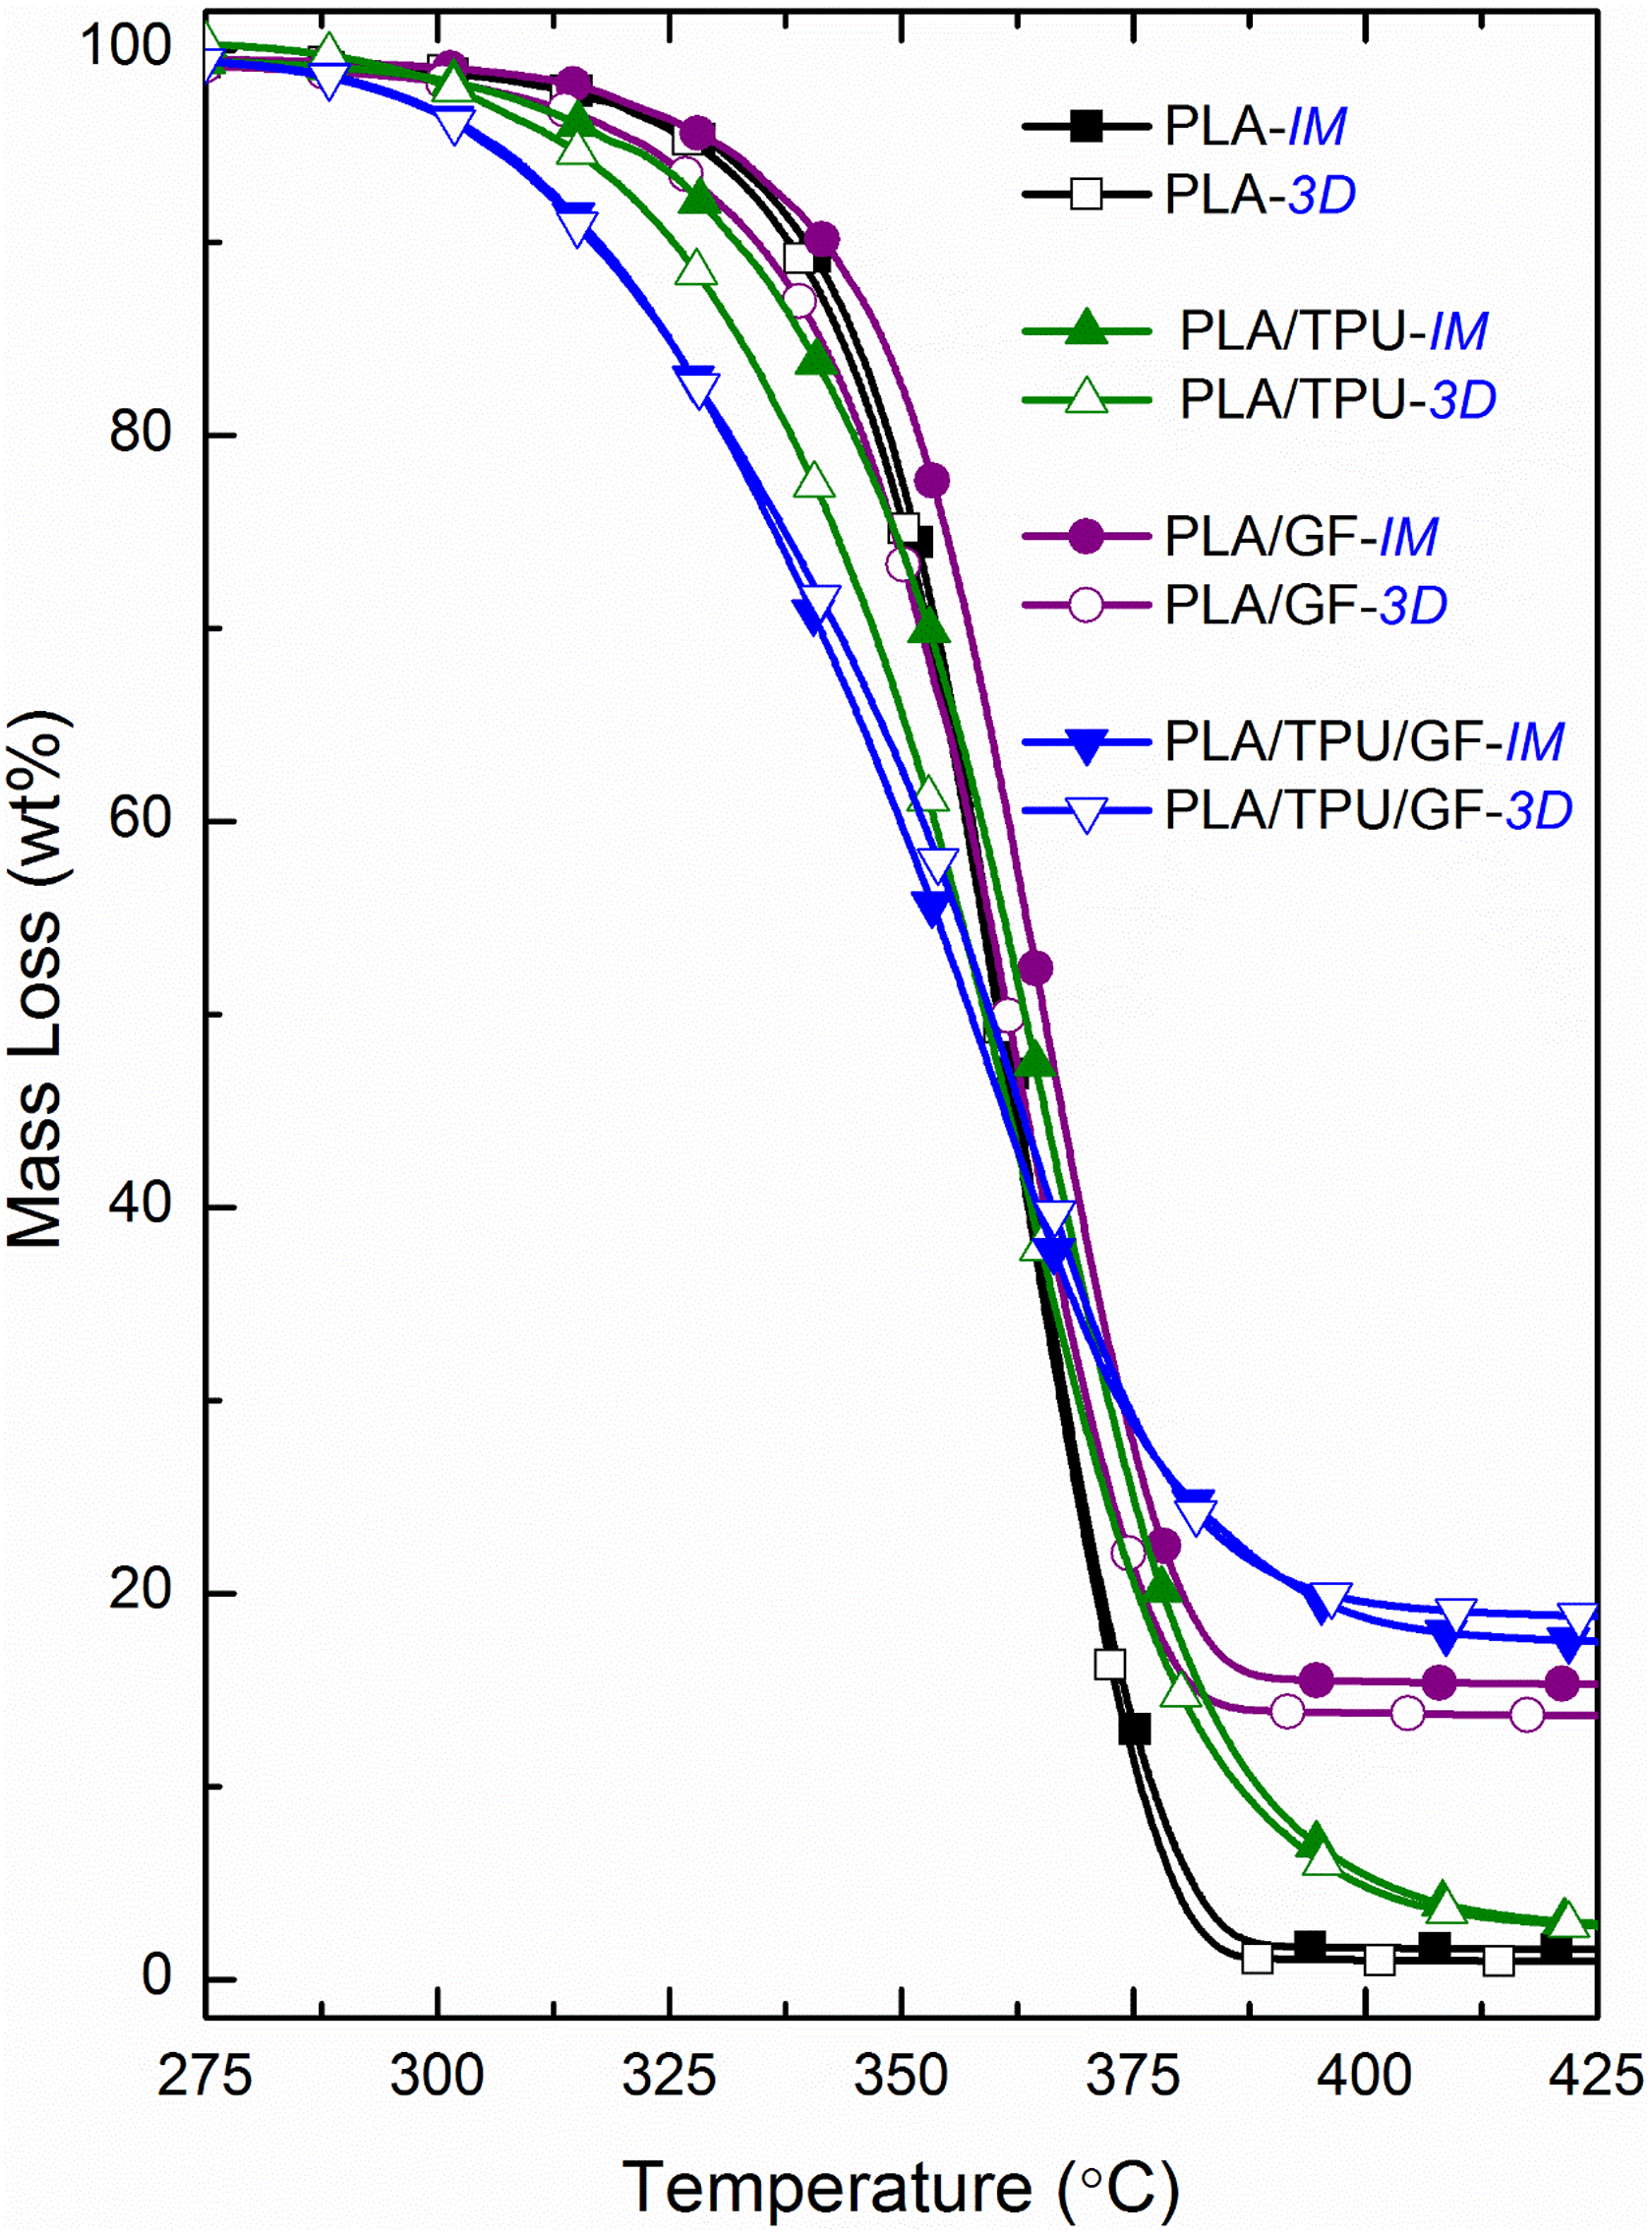
Comparison of the thermogravimetric curves of injection-molded and 3D-printed specimens. 3D: 3D-printed; IM: injection-molded.
Comparison of the thermal degradation temperatures (T 5% , T 10%, and T 25%) of injection-molded and 3D-printed specimens at 5, 10, and 25 wt% mass losses, the maximum mass loss temperature (T max) and percent residue at 550°C.
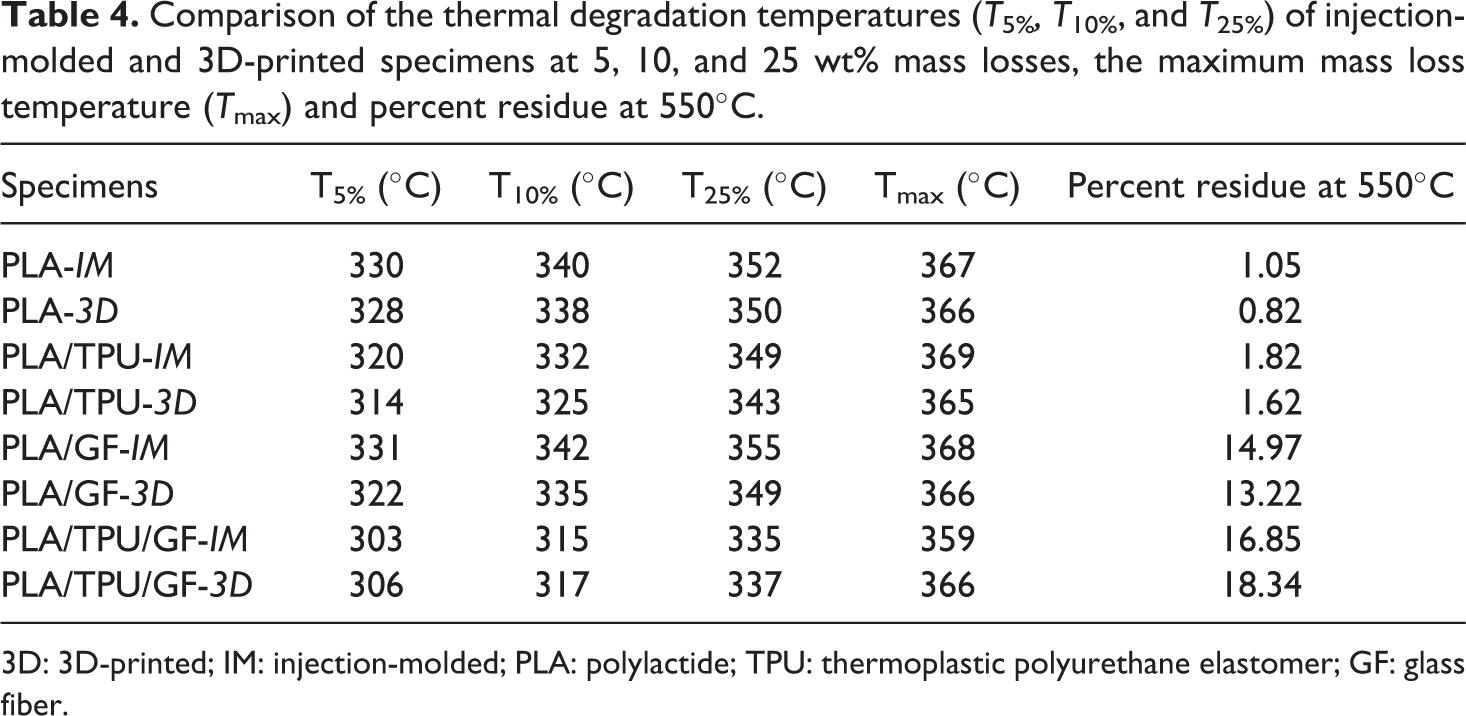
3D: 3D-printed; IM: injection-molded; PLA: polylactide; TPU: thermoplastic polyurethane elastomer; GF: glass fiber.
Conclusions
Photographic images revealed that generally, there was no significant difference in the macro-level appearances of injection-molded and 3D-printed PLA blend and composite specimens. The most noticeable difference was for the neat PLA specimen. Due to the highly amorphous structure, injection-molded neat PLA was very transparent. Contrarily, due to the more crystallinity amount and textured structure, 3D-printed neat PLA specimen appeared to be opaque.
SEM analysis illustrated that there was no significant difference in the fracture surface morphology of injection-molded and 3D-printed neat PLA and blend specimens. The most significant difference was in terms of the orientation of GF reinforcements in PLA composite specimens. In the injection-molded specimens, almost all GF reinforcements were aligned perpendicular to the fracture plane. Contrarily, in the 3D-printed specimens, due to the ±45° raster angle printing directions, some of the GF reinforcements were oriented to the fracture plane with +45°, while some of them are oriented with −45°.
Tensile and flexural tests indicated that for the neat PLA and blend specimens, there were no influences of the injection molding and 3D-printing shaping process on their strength values, being almost equal. Moreover, due to the stiffening action of the slightly textured structure formed during 3D-printing, the elastic modulus values of 3D-printed specimens were even slightly higher than that of the injection-molded specimens.
On the other hand, due to the lower efficiency of the ±45° oriented GF reinforcements in the strengthening and stiffening mechanisms, there were significant reductions in the strength and elastic modulus values of 3D-printed composite specimens, being as much as 32% in strength and 41% in modulus values compared with injection-molded specimens.
Fracture toughness tests indicated that 3D-printed neat PLA and blend specimens were also very beneficial compared with their injection-molded specimens; these benefits in the fracture toughness values being as much as 47% for neat PLA and 26% for PLA/TPU blend. This behavior could be again due to the ±45° textured structure of specimens leading to additional toughening mechanism of “crack deflection” in the textured body.
However, due to lower efficiency of the ±45° oriented GF reinforcements in the composite toughening mechanisms of crack deflection and crack bowing, the fracture toughness values of 3D-printed PLA/GF composite specimens were slightly lower compared with their injection-molded specimens.
In the PLA/TPU/GF composite, the fracture toughness values of 3D-printed specimens were again beneficial as much as 29% compared with their injection-molded specimens. Because in this specimen, reduced effectiveness of the crack deflection toughening mechanism with ±45° oriented GF reinforcements was recovered by the enormous level of rubber toughening mechanism of TPU domains in the matrix.
TGA analyses revealed that specimen shaping by injection molding and 3D-printing processes has no effects on the thermal degradation temperatures of PLA-based materials. Similarly, DSC analyses indicated that they also have no effects on the transition temperatures of all specimens, but there are certain influences on the crystallinity amount. For example, due to the rather lower cooling rate during 3D-printing compared with the very fast cooling rate of injection molding, the crystallinity amount of the neat PLA specimen increased from 3.84% to 5.27%. Consequently, higher crystallinity of the 3D-printed PLA and PLA/TPU samples resulted in higher stiffness, while their higher toughness values were especially dominated by their ±45° textured structure.
Footnotes
Declaration of Conflicting Interests
The author(s) declared no potential conflicts of interest with respect to the research, authorship, and/or publication of this article.
Funding
The author(s) disclosed receipt of the following financial support for the research, authorship, and/or publication of this article: This work was financially supported by the Scientific and Technological Research Council of Turkey—TUBITAK under the project 315M556.