
Abstract
Fused filament fabrication (FFF) or fused deposition modeling is an additive manufacturing (AM) process commonly used for geometric modeling and rapid prototyping of parts called three-dimensional (3-D) printing. Commonly used thermoplastic materials in FFF 3-D printing AM are acrylonitrile butadiene styrene (ABS), polylactic acid (PLA), and polybutylene terephthalate (PBT). However, these materials exhibit relatively low strength and toughness. Therefore, it is desirable to improve various properties of thermoplastics in 3-D printing AM by employing nanotechnology. The combination of 3-D printing and nanotechnology opens new venues for the manufacture of 3-D engineered materials with optimized properties and multifunctionality (e.g. mechanical, electrical, and thermal properties). Hence, in this work, the multifunctional property improvement effects of graphene oxide (GO) on thermoplastic materials suitable for 3-D printing AM are investigated. Low loading of GO with carboxyl and hydroxyl surface functional groups is incorporated into thermoplastic materials suitable for 3-D printing AM by a special mixing technique. ABS is chosen in this study due to its availability. Graphene nanosheets are employed to improve the properties of the developed nanocomposites by 3-D printing AM. GO is chosen to improve the dispersion of graphene nanosheets into the thermoplastic system to increase their interfacial adhesion. A multifunctional property improvement is observed in the developed nanocomposite with less than 0.1 wt% GO. Employing ASTM standard tests, it was found that at a very small loading of 0.06% by weight, GO could improve the properties of the thermoplastic in terms of strength, strain-to-failure, and toughness, while maintaining the stiffness, rendering the developed nanocomposites suitable for various applications of static and dynamic loading. GOs are now commercially available at low prices. At such low loadings, these graphene-type materials become economically feasible components of nanocomposites.
Keywords
Introduction
With the availability of low-cost fused filament fabrication (FFF) or fused deposition modeling (FDM) 1 three-dimensional (3-D) printing additive manufacturing (AM) machines, the interest in their abilities has expanded to include final end-use parts in addition to rapid prototyping. This has motivated research into the mechanical, electrical, thermal, and other properties characterizations and improvements of parts manufactured employing this technology. 2 A method to improve the properties of parts manufactured using FFF/FDM is to add nanomaterials to the thermoplastic. Although research shows particularly promising improvement in thermal and electrical conductivities of nanocomposites, albeit at relatively high percentages of graphene, 3 the primary goal of this research is to explore the initial steps toward improving mechanical and structural properties of nanocomposites in general and 3-D printed parts in particular. Especially, mechanical and structural properties improvement for thermoplastic nanocomposite wires for 3-D printing that include nanographene at low loading. Often researchers use relatively large amounts of nanomaterials (i.e. over 0.1% by weight) to achieve property improvements. 2 For example, Lin et al. 4 developed a stereolithography (SLA) 3-D printed nanocomposite employing a photopolymer loaded with 0.2% graphene oxide (GO) with a good combination of increased strength (62.2%) and increased elongation-to-failure (12.8%). Often a relatively large amount of nanomaterials addition could increase one mechanical property but compromise the other. For example, Sandoval and Wicker 5 showed that the addition of 10 wt% multiwalled carbon nanotube to a 3-D printed part gave 7.5% increase in the tensile strength but reduced elongation-to-failure and made the part more brittle. Wei et al. 6 demonstrated, for the first time, a graphene-reinforced acrylonitrile butadiene styrene (ABS) composite could be FDM 3-D printed with enhanced electrical conductivity. With the loading of 5.6 wt% graphene, the electrical conductivity of ABS nanocomposites showed four orders of magnitude improvement. In addition, incorporation of TiO2 nanoparticles 7 as well as nano-clay 8 into polymer matrix could primarily improve the thermal stability of printed nanocomposites. Gnanasekaran 9 showed that the inclusion of 0.04% carbon nanotube (CNT) and 0.08% graphene into polybutylene terephthalate (PBT) can increase the electrical conductivity of the 3-D printed nanocomposite by about sevenfolds. However, they did not report any particular functionalization on the CNTs or the graphenes, neither did they report any mechanical properties of the 3-D printed nanocomposites. Manapat et al. 10 showed that a 1% inclusion of GO into a conventional commercially available SLA resin 3-D printed employing SLA 3-D printing technique and subsequently thermally annealed at 100°C for 12 h can increase the tensile strength and modulus of these parts by 673.6%. It should be noted that no reports were given for the strain-to-failure or toughness.
Nanomaterial
Graphene is a single layer of carbon atoms and has recently emerged as a promising material for polymer nanocomposites, energy storage, and electronics applications, due to its unique structure and its excellent mechanical and electrical properties, and hence the introduction of graphene nanosheets into polymers results in improved mechanical, electrical, and barrier performances. 11 –16 Due to the high aspect ratio of graphene nanosheets, the property enhancements can be obtained at relatively small loadings, in some cases less than 0.5 wt%. 13 –19 Rafiee et al. 20 compared the fracture performance of epoxy composites with 0.1 wt% of pristine graphene, single-walled, and multiwalled carbon nanotubes and found that the composites with graphene showed the highest improvement (31% for stiffness, 40% for strength, and 53% for fracture toughness). 20 These authors also found that the improvement in fracture toughness peaked at 0.125 wt% of graphene with a 65% increase. 21 Since many industrial applications of graphene are still limited by its relatively high cost (particularly compared to the resin system), the improvements at low loadings of graphene provide opportunities to produce cost-effective graphene-based nanocomposites. Epoxy nanocomposites with surface functionalized graphene and GO were also studied. Ma et al. 22 used 0.489 vol% graphene platelets and demonstrated an eight-order reduction in electrical resistivity, a 47.7% improvement in modulus, and 84.6% improvement in fracture energy release rate. Bortz et al. 23 reported enhancements of 28–111% in mode I fracture toughness and up to 1580% in uniaxial tensile fatigue life through the addition of small amounts (≤1 wt%) of GO to an epoxy system. Measured improvements were also detected in quasi-static tensile and flexural stiffness and strength. The addition of only 0.1 wt% GO yielded an approximately 12% increase in tensile modulus. At 1 wt% of GO loading, flexural stiffness and strength were 12% and 23% greater than the baseline epoxy. However, most of these studies used solvents and dispersions with relatively high graphene loadings, which places limitations on industrial implementation. 12 Ghasemi Nejhad and coworkers showed that there is a very low regions of functionalized nanomaterials loading (i.e. below 0.1%) where substantial multifunctional property improvements of the resulting nanocomposites can be achieved, 11–12,24,25 and where substantial toughening effects of different functionalized graphene and other functionalized nanomaterials (such as carbon nanotubes and nanoparticles) were demonstrated at loadings less than 0.1 wt%. For example, a maximum toughening effect was observed at 0.02 or 0.04 wt% of graphene loading for all the composite samples, and GO modified with specific surface groups outperformed the pristine graphenes. 12 Fractographs of the composite samples were collected to investigate the toughening mechanism, and a mechanism based on “microcrack formation and propagation as well as their coalescence—as the graphene loading increased” was proposed to explain the fracture behavior of polymer composites with low loading levels of graphene. 12 The enhancement in mechanical performance in this work is attributable to the same morphological “microcrack and coalescence” mechanism described in the cited reference. During loading, plastic yielding occurs around the relatively rigid nanoparticles resulting in the formation of “microcracks,” which absorb and dissipate a significant amount of energy. As shown in the cited reference as well as in this work (e.g. see 0.02% GO loading in Figure 1), there is an initial peak point at very low level of nanomaterial inclusion. As the cracks propagate, additional absorbed energy is dissipated. However, at a relatively higher loading of nanomaterial, the propagating “microcracks” coalesce, which significantly reduces the energy absorption and dissipation from crack propagation beyond the initial peak (e.g. see 0.04% GO loading in Figure 1) leading to lower strength and toughness. As stated earlier, this work observed the maximum increase in strength at 0.02% GO concentration by weight (see Figure 1). Above this low level of GO loading, coalescence starts to happen for the first time (e.g. at 0.04% GO loading in Figure 1) which reduces the capacity of the material to absorb and dissipate higher level of energy through “microcracks” initiations and propagations. It should be noted that beyond the first instant of coalescence (e.g. 0.04% GO loading in Figure 1), as the graphene loading increases, higher level of energy is needed to initiate and propagate microcracks, as compared with the first instance of coalescence, and this is why the energy absorption and dissipation increases again beyond the first coalescence instance (e.g. 0.04% GO loading in Figure 1). Additionally, interfacial covalent bonding with functionalized graphene increases the energy required to form microcracks, and therefore, the composite has better strength and fracture toughness than pristine graphene or a composite without graphene. It should be noted that Figure 1 corresponds to the “mean fracture stress” (given in Figure 21) in this work.
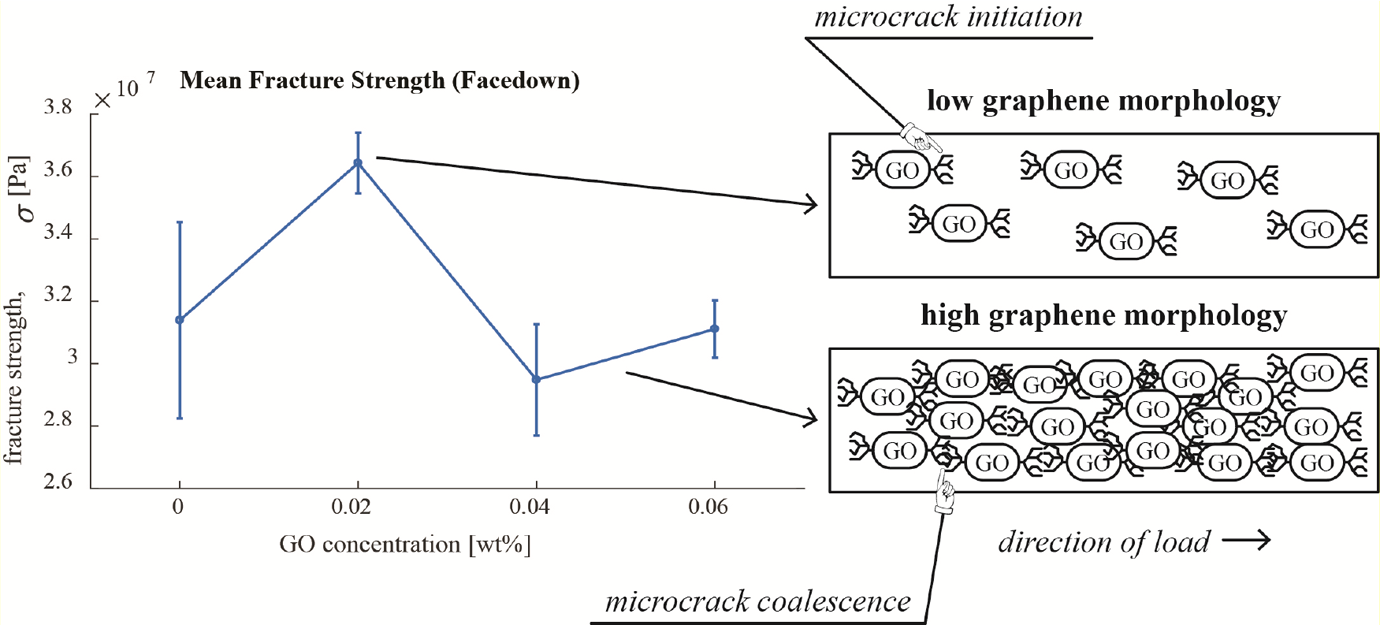
“Microcracks and coalescence” mechanism for mechanical properties improvement. 12 Inclusion of graphene nanomaterials results in “microcracks” formation due to local plastic deformation around the relatively rigid graphene. Formation and propagation of “microcracks” absorbs and dissipates energy. However, even at low loadings (e.g. at 0.04% GO wt% in this work), the graphene nanosheets are close enough to allow the microcracks to coalesce and reduce the energy dissipation capacity as compared with its peak at 0.02% GO wt%).
Therefore, the functionalized nanomaterial considered for this work is GO obtained from Graphenea Company. 26 Figure 2 shows the nanostructure of a GO with its hydroxyl (–OH), carboxyl (–COOH), and oxygen (=O) functional groups. GO contains oxygenated functional groups on its basal planes, which can improve graphene’s dispersion in polymer phases and graphene’s adhesion to the polymer’s molecules. 2,6,12
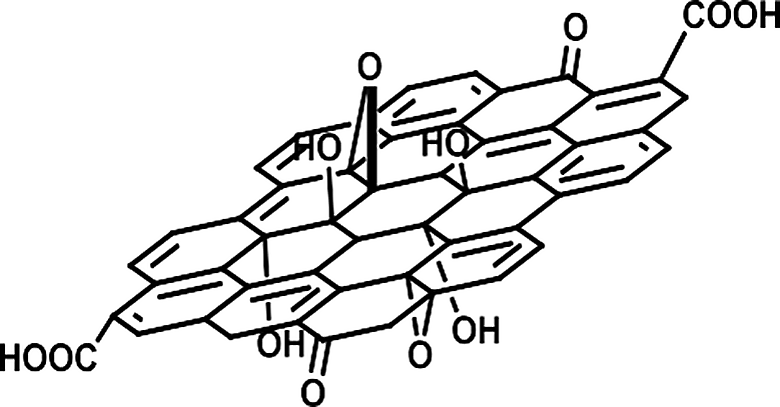
GO with its functional groups.
FFF 3-D printing and feed materials
FFF builds a 3-D part from a continuous bead of molten material. 1 A computer numerical controlled (CNC) “hotend” traces out and deposits molten material, in a thin bead, one layer at a time around the boundaries and within the interior of each two-dimensional part cross section or “layer.” Successive stacks of layers form a desired 3-D part based on the 3-D computer model which is fed into the 3-D printer’s slicing software. A schematic of a typical extrusion assembly of a 3-D printing is shown in Figure 3.
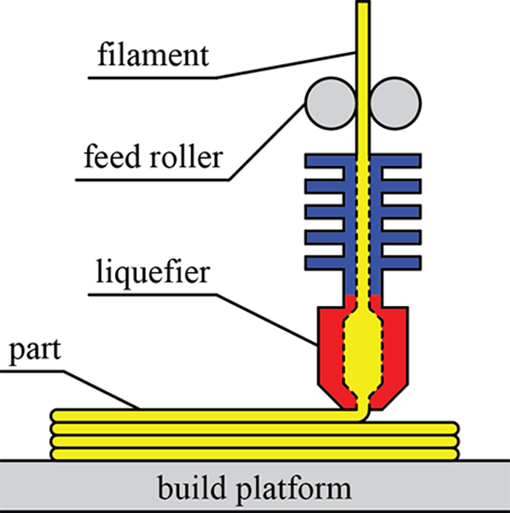
Schematic of a FFF hotend.
FFF requires that the working material (i.e. the filament) predictably transition into “liquid” or “paste” form, to allow the CNC hotend to precisely deposit the material while the material has the right viscosity (i.e. normally between the glass transition and melt temperatures). Therefore, FFF 3-D printing lends itself particularly well to thermoplastic materials, which are capable of repeated melt and solidification cycles. Of these materials, the most common are ABS, nylon, polyethylene terephthalate glycol-modified (PETG), polycarbonate, polylactic acid (PLA), and PBT. 1–2 In this study, the chosen thermoplastic materials must also be soluble for the inclusion process of GO. Due to the wide adoption, availability, and solubility in acetone (i.e. the solvent we used to disperse the GO nanomaterials), ABS was chosen as the thermoplastic feed materials for this study to produce our multifunctional nanocomposites by FFF 3-D printing.
FFF anisotropy of the manufactured parts
Existing literature shows that FFF and other functionally similar processes, such as FDM, demonstrate anisotropic behavior. 1,27 –38 When the load path is parallel to the layer lay down direction (i.e. in the longitudinal direction of the depositing material), the part exhibits significantly higher tensile strength than when the load path is orthogonal to the layer lay down direction (i.e. in the transverse direction of the depositing material). For a FFF-printed tensile sample, there are three possible orientations, as shown in Figure 4, and they are as follows: facedown (i.e. the part large face is parallel to the build plate), edge-up (i.e. the part thin face is parallel to the build plate), and upright (i.e. the part long axis is orthogonal to the build plate). In addition, Figure 5 shows these upright, edge-up, and facedown samples where their layer lay down directions are identified on each sample.
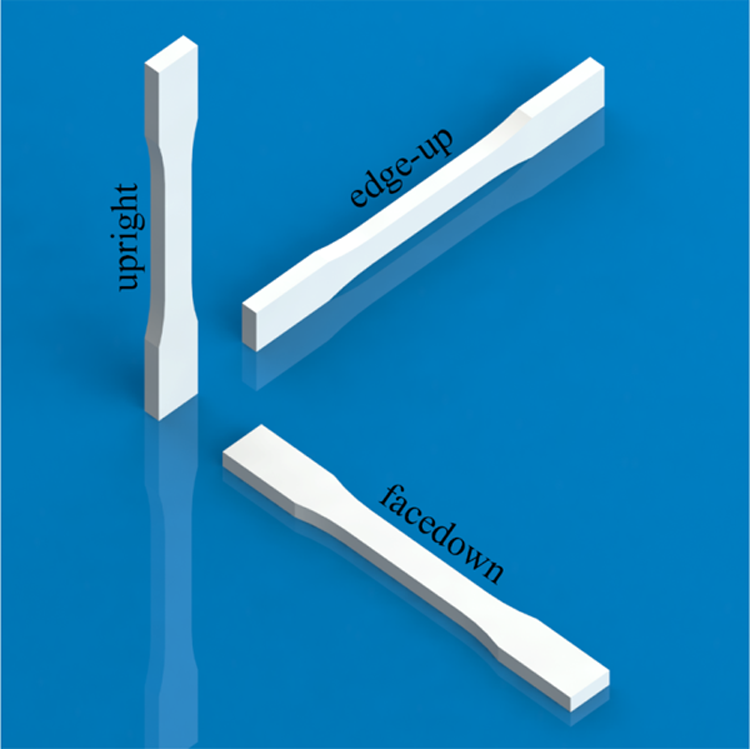
Upright, facedown, and edge-up tensile sample orientations.
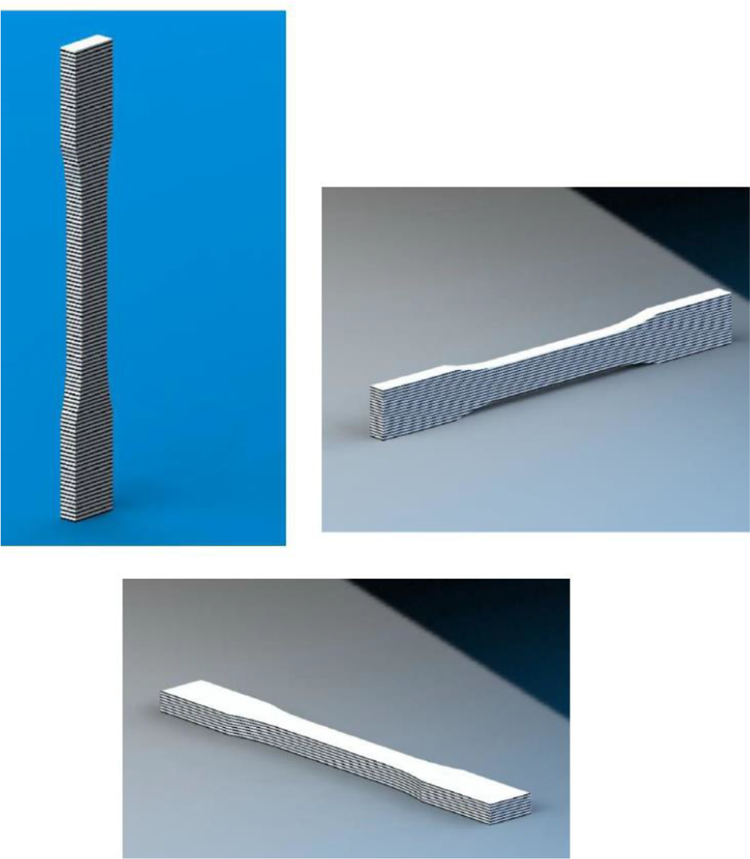
Upright (top-left), edge-up (top-right), and facedown (bottom) dog-bone tensile samples with their representative layer directions (all layers in all three samples are laid down horizontally, i.e. parallel to the build plate).
Past literature states that the FDM-manufactured tensile samples in the upright orientation (i.e. loaded transversely) demonstrate fracture strengths of 50–90% of the tensile samples in the facedown orientation (i.e. loaded longitudinally), depending on the materials’ lay down patterns as well as air gap spacing/density of the samples. 28,34,35,38 In addition, Yamamoto and Trimble 1 demonstrated that the FFF-manufactured tensile test samples, employing PLA materials, showed a ratio of 20% for the upright-to-facedown tensile strength.
Since the edge-up and facedown orientations are functionally similar regarding the load path relative to the layer lay down direction (i.e. loading in both cases are longitudinal, see Figure 5), only the facedown (i.e. longitudinal loading) and upright (transvers loading) tensile sample orientations were manufactured and tested in this research work.
Experimental setup and materials
Natural ABS Pellets, from Filabot.
39
GO Water Dispersion, from Graphenea.
26
Acetone, from Fisher Chemical.
40
S450A Analog Ultrasonic Cell Disruptor/Homogenizer Tip Sonicator, from Branson Ultrasonics.
40
Filabot EX2 Filament Extruder and Spooler, from Filabot.
39
Rigidbot Big FFF 3-D Printer, from Rigidbot.
41
Instron Model 4206 universal testing machine.
42
The GO inclusion into the ABS resin system
To minimize phase separation and obvious graphene aggregation, GO was used in this research as the filler nanomaterial. GO was included into the ABS thermoplastic system with 0.00, 0.02, 0.04, and 0.06 wt% to produce the nanocomposite filaments to manufacture the tensile test coupons. Five hundred grams of ABS material was necessary for each concentration to ensure enough thermoplastic to produce dog-bone test samples. To include the GO into the ABS system, the ABS system has to go through a process, explained later in this article, which affects the ABS material properties. Therefore, in addition to the as-received ABS filaments (i.e. control material/sample) that are used to prepare the tensile test coupons as the baseline system, the 0.00% filaments are also prepared to obtain the properties of the FFF 3-D printed samples when the ABS system goes through the nanomaterial inclusion process but no nanomaterial is added to the ABS system to gage the property variation of the ABS system due to the nanomaterial inclusion process without adding any nanomaterial. Therefore, since the inclusion of GO into ABS affects the properties of the finished part, the evaluation of the properties of parts with 0.00 wt% concentration is also important to establish a nanomaterial inclusion process-based baseline, in addition to the parts made of as-received, unprocessed (i.e. control) ABS system.
The additional GO and/or ABS processing represents a design trade-off. The goal for this work is to create a nanocomposite wire with low loading employing an off-the-shelf GO to reduce cost; and yet, produce a final product with improved properties than the one printed from the as-received pristine wire. The low loading naturally saves cost since less GO is required. In addition, off-the-shelf GO reduces cost by eliminating additional functionalization steps (which again reduces costs and production time). However, without additional functionalization, we observed major agglomeration of the GO and were not able to mix a low loading of the as-received GO within the wires uniformly without a solvent. It is possible to further functionalize the as-received GO and mix it within the polymer to create nanocomposite without using a solvent; however, that requires additional functionalization steps (e.g. MDI coupling, then ATBN functionalization 12 or a thermally activated TrGO3). Therefore, to include off-the-shelf functionalized GO nanomaterial into the ABS system, the following steps were followed.
First, the as-received ABS filaments were dissolved into liquid form by mixing the ABS filaments with acetone. Without supersaturating, 500 g of ABS requires approximately 12 L of acetone to fully dissolve (or an ABS/acetone mass ratio of 1/18.8, with ABS and acetone density of 1050 and 784 kg/m3, respectively). The ABS and acetone were mixed in a 2.5-gallon aluminum tub lined with vacuum bagging material, for ease of removal of the material in the final step. The solution was mixed with a physical blade agitator to ensure full dissolution of ABS into acetone.
Second, to ensure a homogeneous mixture of GO throughout the large volume of acetone required in the previous step, the as-received water-dispersed GO was first dispersed in approximately 350 mL of acetone. From the manufacturer, the GO is dispersed in water with 0.4 wt% ([g/mL%]). Therefore, for the 500 g of target ABS material, 25, 50, and 75 mL of water-dispersed GO was mixed in 250 mL of acetone for the 0.02, 0.04, and 0.06 wt% concentrations, respectively. Note that the volume of acetone is not sensitive, as the acetone and water are later boiled out of the solution, leaving behind only the GO. A tip sonicator 40 was used to ensure full dispersion of GO in the water–acetone solution to avoid agglomeration of the GO into the ABS system at the later stage. This setup is shown in Figure 6.
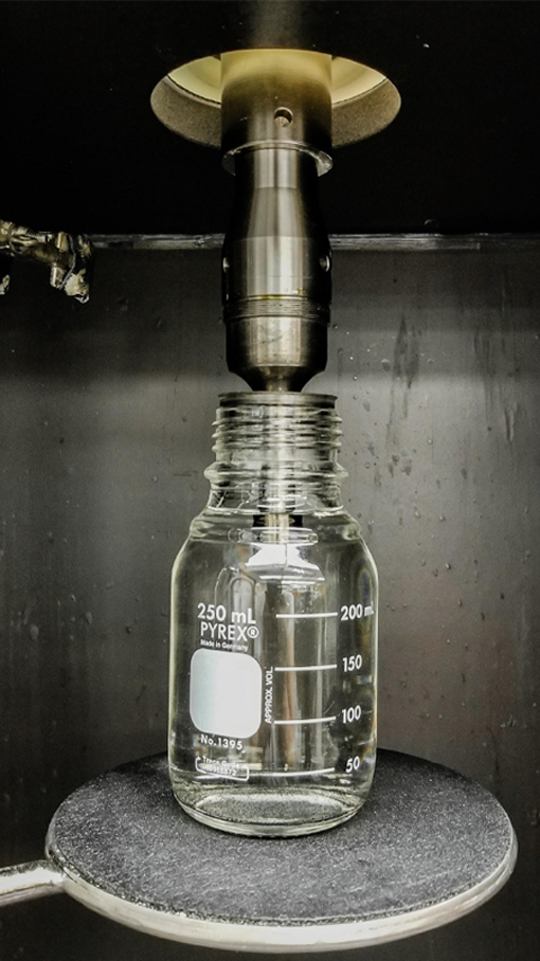
Tip sonicator setup for homogeneous mixing of water-dispersed GO and acetone.
Third, the ABS–acetone solution discussed in step one was mixed with the GO dispersed in the acetone–water solution discussed in step two. A physical blade agitator was used to ensure a homogeneous mixture of GO throughout the solution. This full solution was then set on a hot plate controlled to 60°C to evaporate off the acetone. This is shown in Figure 7.
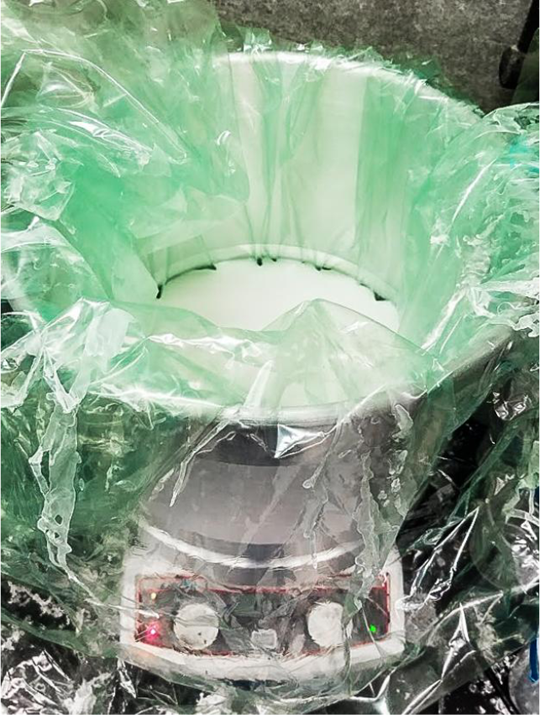
GO, water, and acetone solution on the hot plate controlled to 60°C.
Fourth, after evaporating the acetone, the vacuum bagging material was removed from the aluminum tub (see Figure 7), leaving behind a “plate” of ABS approximating the shape of the bottom of the tub. This is shown in Figure 8.
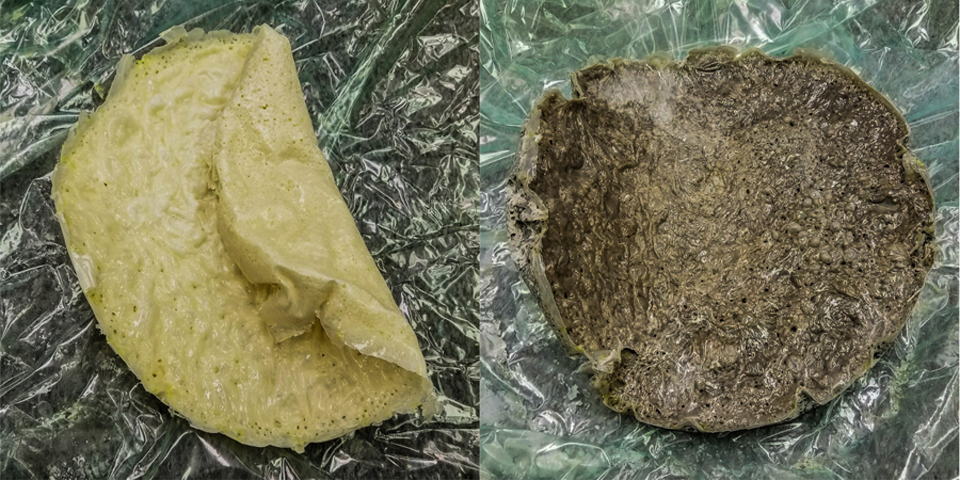
ABS “plate” after evaporation of acetone for the 0.00 wt% (left) and 0.06 wt% (right) GO concentrations.
To remove the residual moisture/water in the material, the ABS plate was put into a temperature-controlled vacuum furnace at 100°C for 12 h. This removed the remaining water and acetone from the ABS.
Extrusion process of nanocomposite filaments
Despite the many advantages offered by the combination of nanotechnology and 3-D printing, several challenges (e.g. nanocomposite processing, cost, reliability) have to be addressed in order to employ the full potential of 3-D printing of multifunctional nanocomposites. For example, the extrusion-based 3-D printing technique may encounter problems such as aggregation of the nanomaterials or the increase in viscosity after the addition of the nanoparticles to the printing materials, which may cause nozzle clogging. Therefore, a proper mixing and extrusion strategy has to be used in order to disperse nanomaterials into the host material before the actual 3-D printing. Therefore, the following steps were taken to resolve such issues.
First, to extrude the thermoplastic material in form of filaments, the ABS “plate” produced by the previous process was reduced to granular form. A band saw was used to slice the ABS into small pieces approximately 1″ × 1″ × 0.5″ pieces. These were then put into a standard kitchen blender until an average grain size of approximately 0.125″ × 0.125″ × 0.125″ was reached. The results of this process are shown in Figure 9.
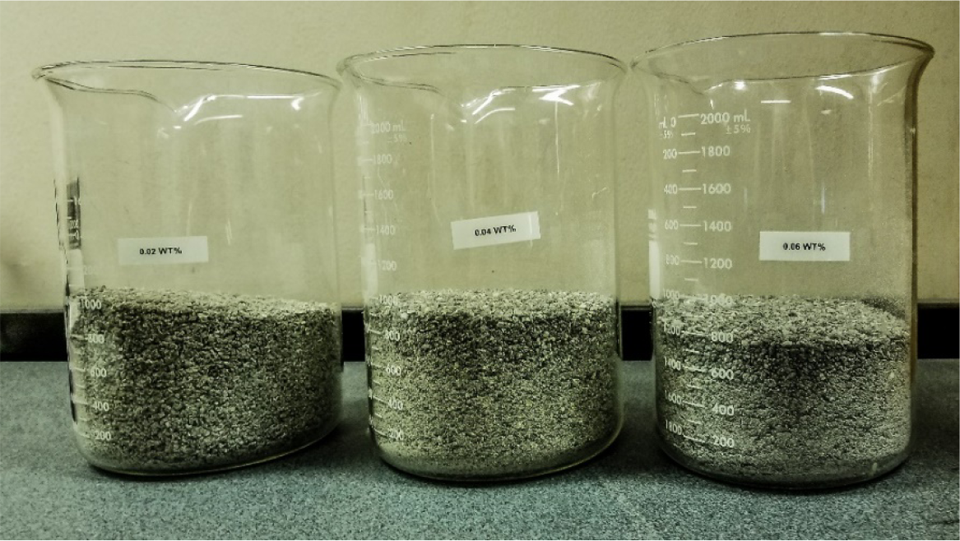
ABS thermoplastic in granular form. Samples are ordered 0.02, 0.04, and 0.06 wt% GO concentrations from left to right.
Second, the Filabot EX2 39 filament extruder was used to extrude the granular ABS discussed in step one above into 1.75-mm diameter filament compatible with the FFF printer. The granular ABS is gravity-fed into a lead screw, which pressurizes the material into the extrusion nozzle controlled at elevated temperature. The extruded filament is then spooled with an external filament spooler module. The Filabot Extruder and Filabot Spooler are shown in Figure 10.
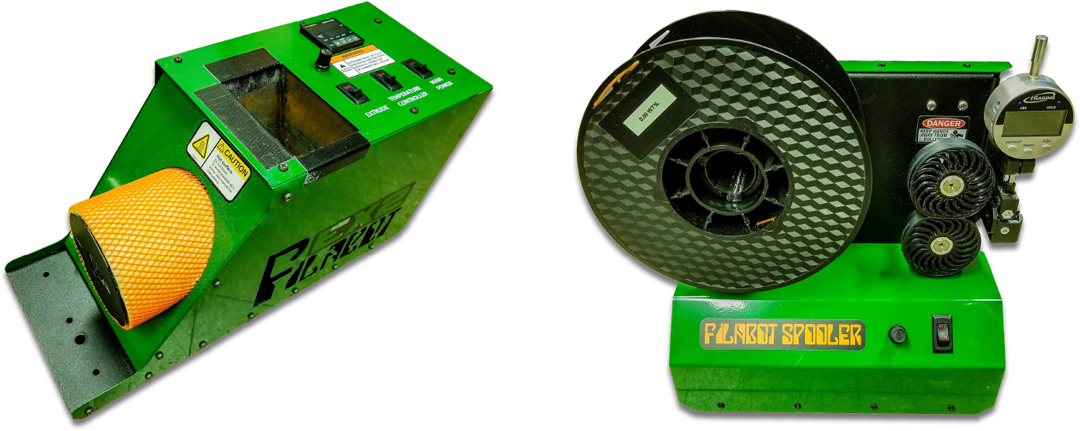
Filabot EX2 Filament Extruder (left) and Filabot Spooler (right).
The significant temperature difference between the extrusion nozzle and ambient temperature causes the filament to undergo significant shrinkage after exiting the extrusion nozzle. Therefore, trial-and-error is necessary to find the proper extrusion temperature to achieve the desired 1.75-mm filament output diameter. The extrusion temperatures used for the various ABS samples are shown in Table 1.
ABS filament extrusion temperatures for various concentrations of GO.
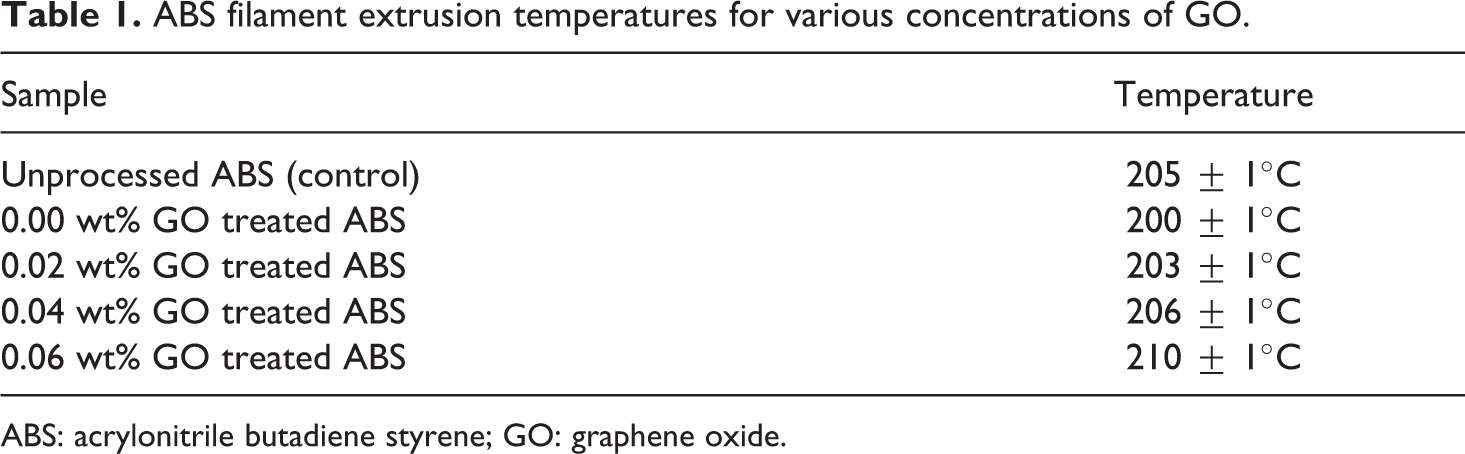
ABS: acrylonitrile butadiene styrene; GO: graphene oxide.
Numerous other factors also affect the output diameter of the filament (e.g. coefficient of thermal expansion, heat transfer coefficients, specific heat, ambient temperature, feed rate, etc.). Therefore, to replicate such experiments, one should not expect to utilize exactly the same temperatures as those listed in Table 1. However, the temperatures used and reported in Table 1 are good reference points. Furthermore, they demonstrate how significantly the required extrusion processing temperature changes/increases (which could also be an indication of changes/increases in the glass transition temperature) and somewhat increases in the viscosity with the increase in the concentration of the GO, while the feed rate and ambient temperature were held at the same level for various GO concentrations.
An image of the spooled extruded filament and close-up shot of the filament samples with varying GO concentrations are shown in Figures 11 and 12, respectively.
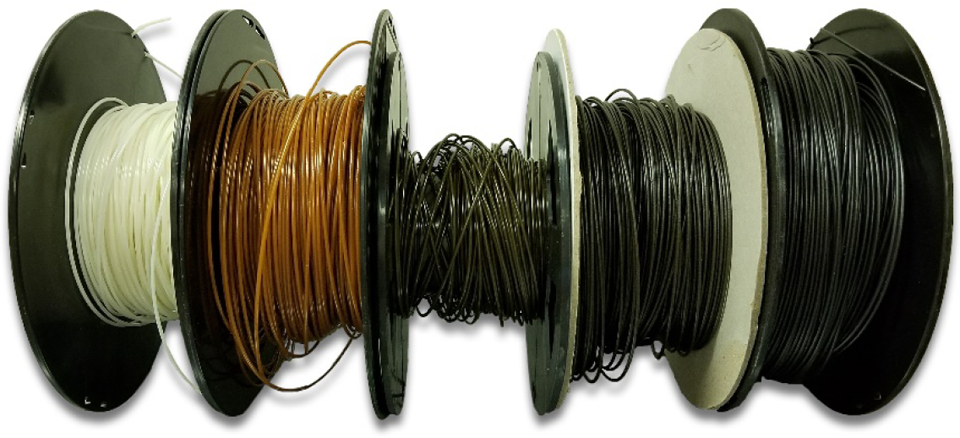
ABS spooled filaments with various concentrations of GO. From left to right: unprocessed/as-received (controlled) ABS (color: white), 0.00 wt% (color: brown), 0.02 wt% (color: brown-to-black), 0.04 wt% (color: black), and 0.06 wt% (color: jet black).
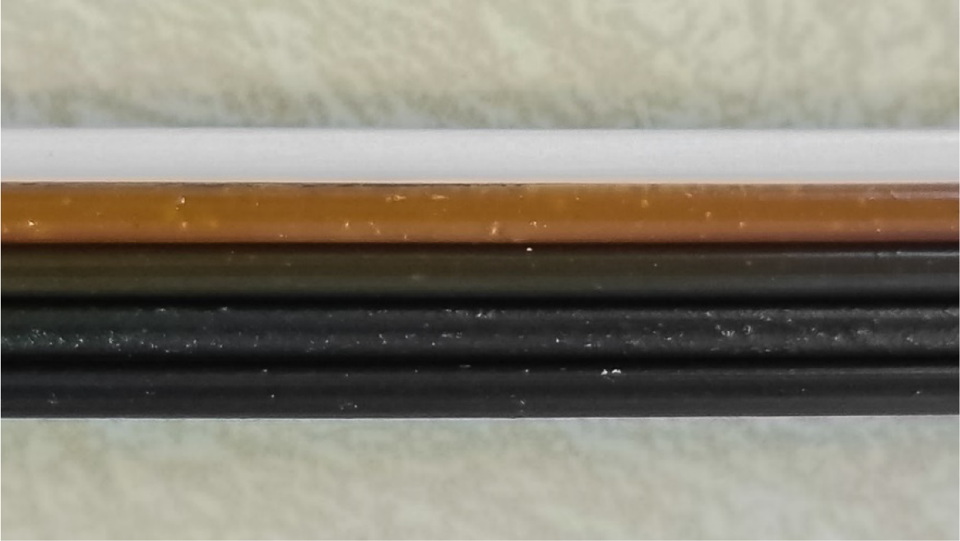
Close-up image of filaments. From top to bottom: unprocessed/as-received (controlled) ABS (color: white), 0.00 wt% (color: brown), 0.02 wt% (color: brown-to-black), 0.04 wt% (color: black), and 0.06 wt% (color: jet black).
Tensile test sample preparation by FFF
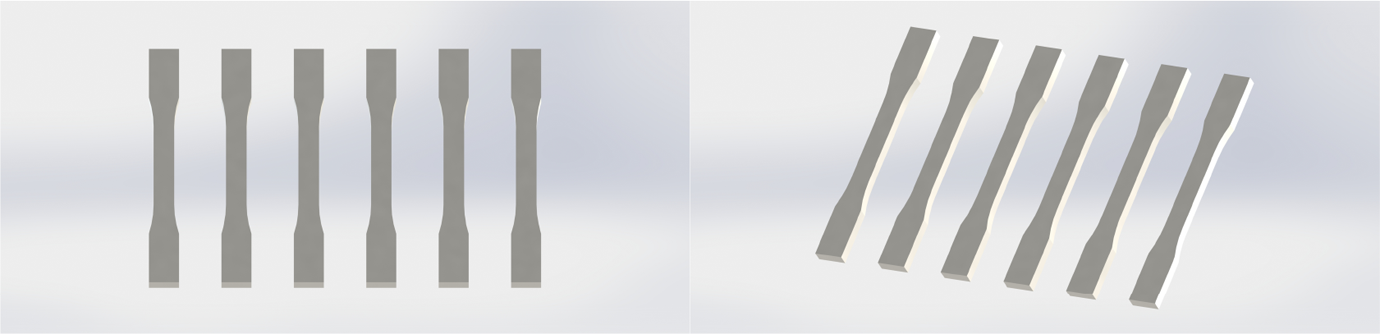
The tensile tests in this research are compliant with the ASTM D638-14 standard test method for tensile properties of plastics. 43 Type I dog-bone samples with 7 mm thickness 43 were chosen for this research. The FFF process utilized a “Rigidbot Big” FFF 3-D printer. 41 This FFF printer has a build volume of 400(x) × 300(y) × 254(z) mm, which is large enough to accommodate six Type I dog-bone samples in a single print. The ASTM D638-14 standard calls for at least five tensile samples along each principle axis of anisotropy, and hence six samples in the facedown and six samples in the upright configurations were tested. In addition, since the dog-bone samples have a very tall aspect ratio when printed in the upright configuration, the six dog-bone samples were printed as a single monolithic part with sacrificial stiffeners. The facedown and upright models are shown in Figures 13 and 14, respectively.
ASTM D368-14 Type 1 dog-bone tensile test sample model in the facedown orientation.
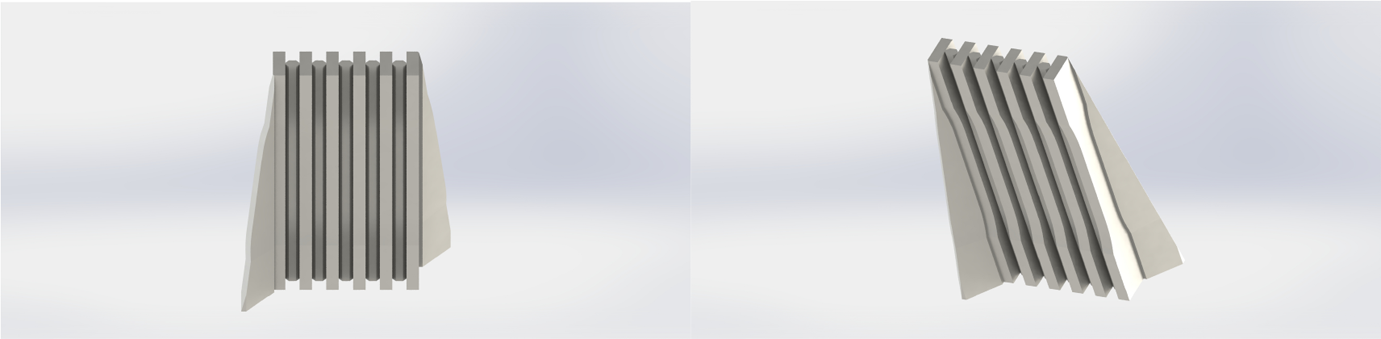
ASTM D368-14 Type 1 dog-bone tensile test sample model in the upright orientation.
The Type 1 dog-bone geometry, provided in the ASTM D638-14 standard, 43 was modeled in SolidWorks 44 and exported as an “.stl” (SLA) file, which approximates a standard vectorized 3-D model as a series of triangulated surfaces. This “.stl” file was then imported into “Simplify3D” slicing software. Slicing software takes a 3-D model, and, based on a suite of user settings, generates a “.gcode” file, which is a machine numerical control programming language for the 3-D printer. This “.gcode” file communicates machine toolpaths, speeds, feed rates, temperatures, offsets, and so on. The relevant process parameters are shown in Table 2.
FFF process parameters.
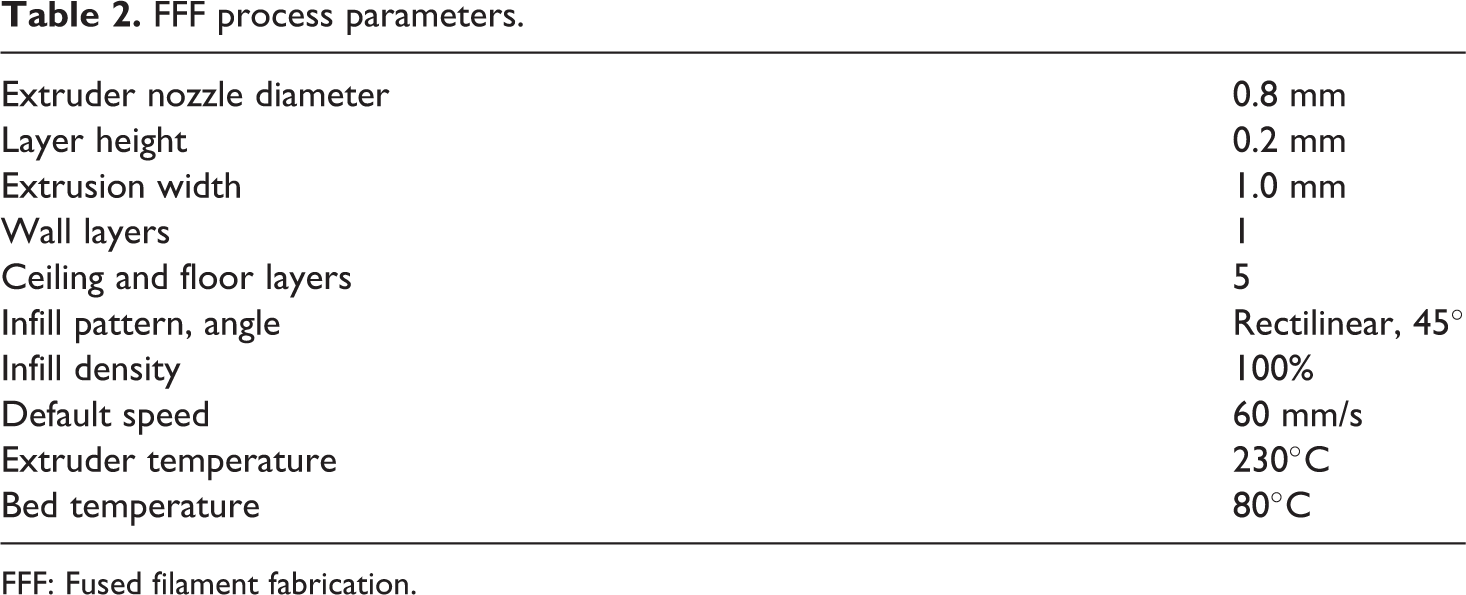
FFF: Fused filament fabrication.
A visualization of the facedown and upright print toolpaths from Simplify3D slicing software is shown in Figures 15 and 16, respectively.
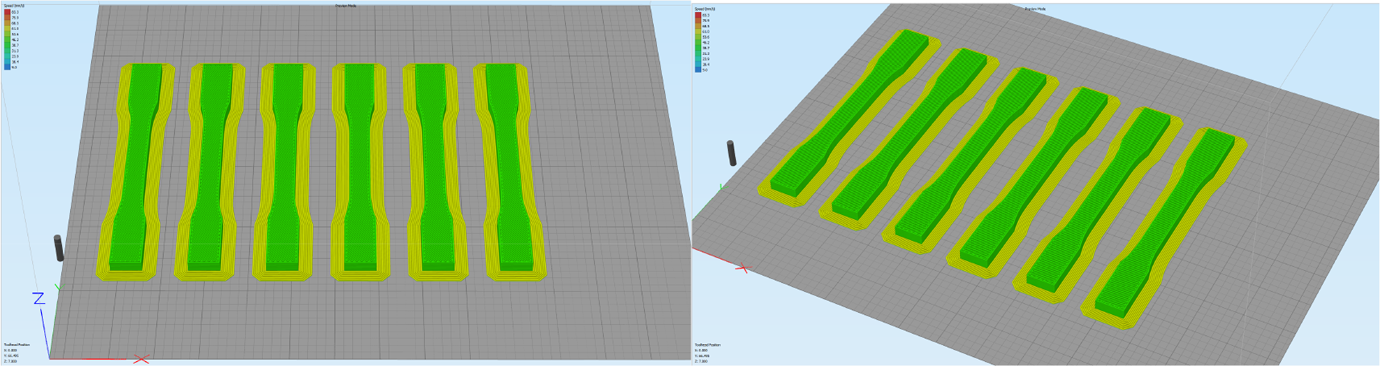
Facedown dog-bone “.gcode” visualization in Simplify3D software.
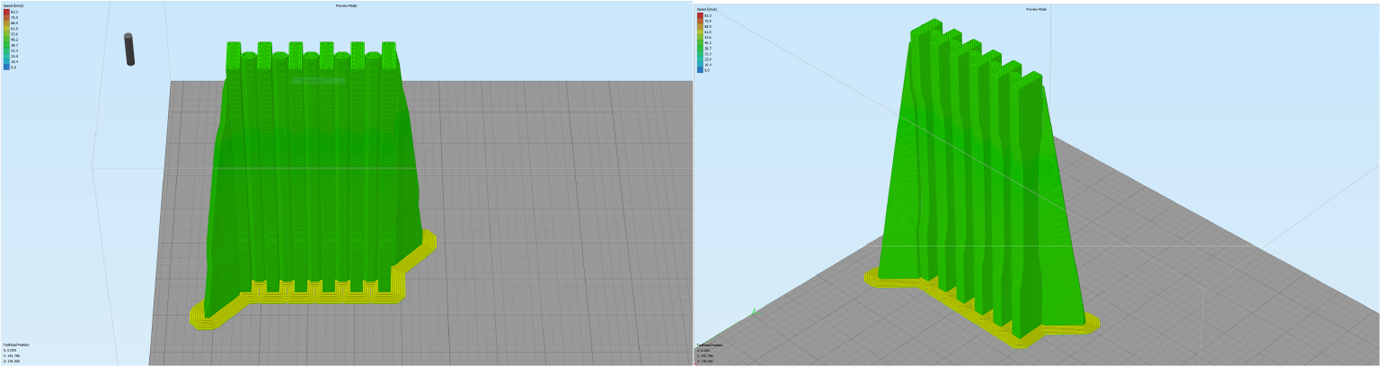
Upright dog-bone “.gcode” visualization in Simplify3D software.
Due to a high thermal expansion coefficient (and potentially processing shrinkage), 45 ABS-printed parts have a tendency to de-adhere from the print bed surface due to residual stresses and part warpage. 46,47 To improve adhesion between the ABS part and print bed surface, first, the print bed surface was pretreated with a thin layer of ABS, which increased adhesion between the part assembly and the print bed. Next, a sacrificial brim was printed with three layers initially before printing the ABS nanocomposite, to increase surface area between the print-bed surface and the part. Finally, the ABS nanocomposite was printed on the substrate described here to produce the tensile test coupons. After the completion of the printing of the tensile test coupons, the entire substrate, including the sacrificial brim, was removed to produce the tensile test coupons. Images of the completed facedown and upright printed assembly before and after the removal of the sacrificial layers are shown in Figures 17 and 18, respectively.
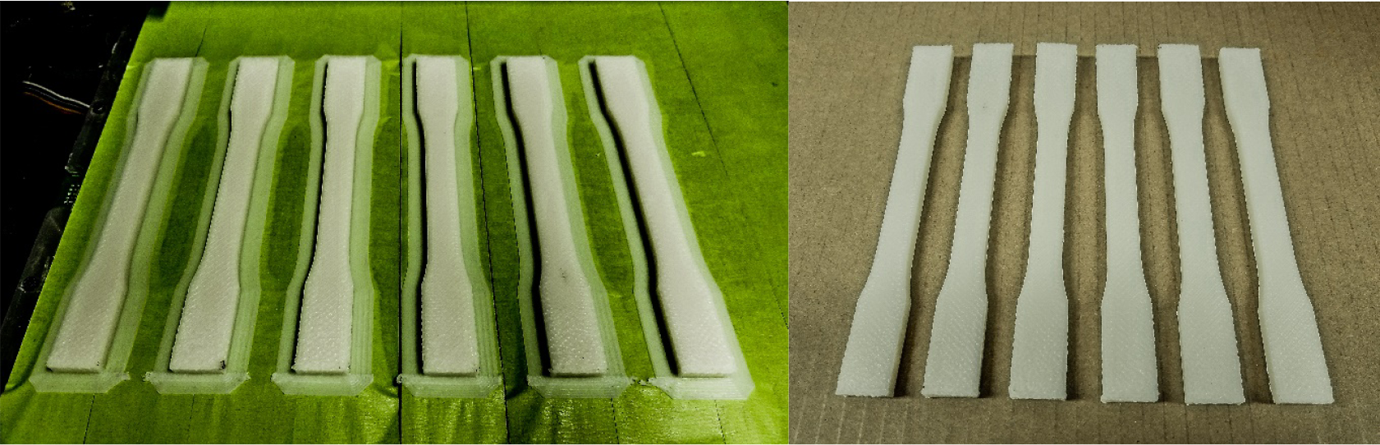
Facedown print of (unprocessed/as-received/control) ABS dog-bone tensile test samples immediately after the print completion (left) and after the removal of the sacrificial brim (right).
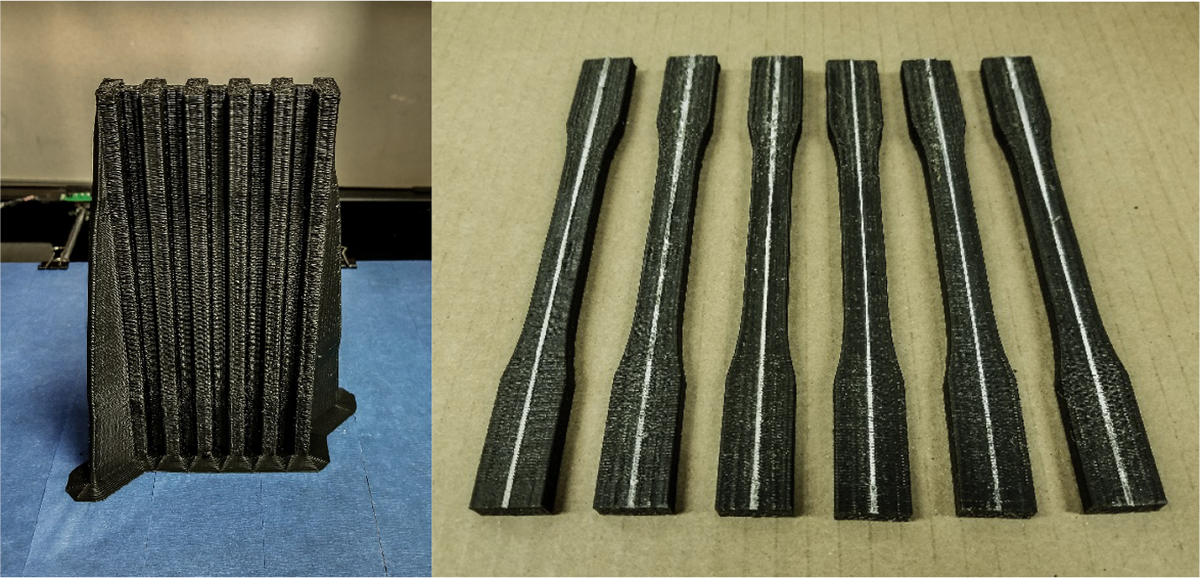
Upright print of 0.06 wt% ABS dog-bone tensile test samples immediately after print completion (left) and after removing sacrificial brim and stiffening material (right).
Tensile test process
To perform the tensile tests, an Instron Model 4206 universal testing machine 42 was used. Time, extension, strain, and load were recorded throughout the process. An image of the testing setup is shown in Figure 19.
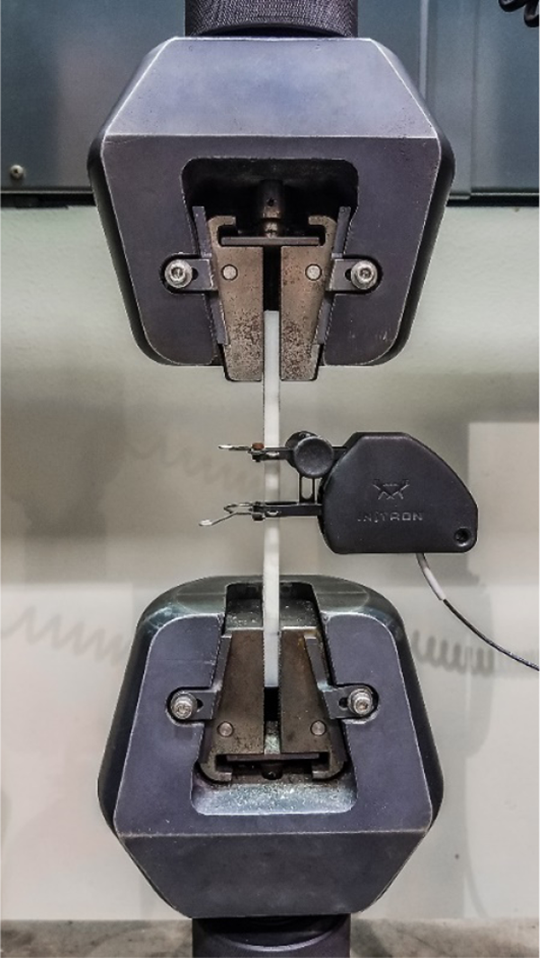
Tensile testing setup on the Instron machine, with the dog-bone sample and extensometer in place.
For accurate calculation of engineering stress, the thickness and width of each sample were measured at 10-mm increments along the 50-mm gauge length prior to the tensile testing. Upon breaking, the position of the break along the gauge length was recorded and cross-referenced to the respective thickness and width to calculate the engineering stress at the break.
Tensile test results
The stress–strain curves collected from the various tensile samples are shown in Figure 20.
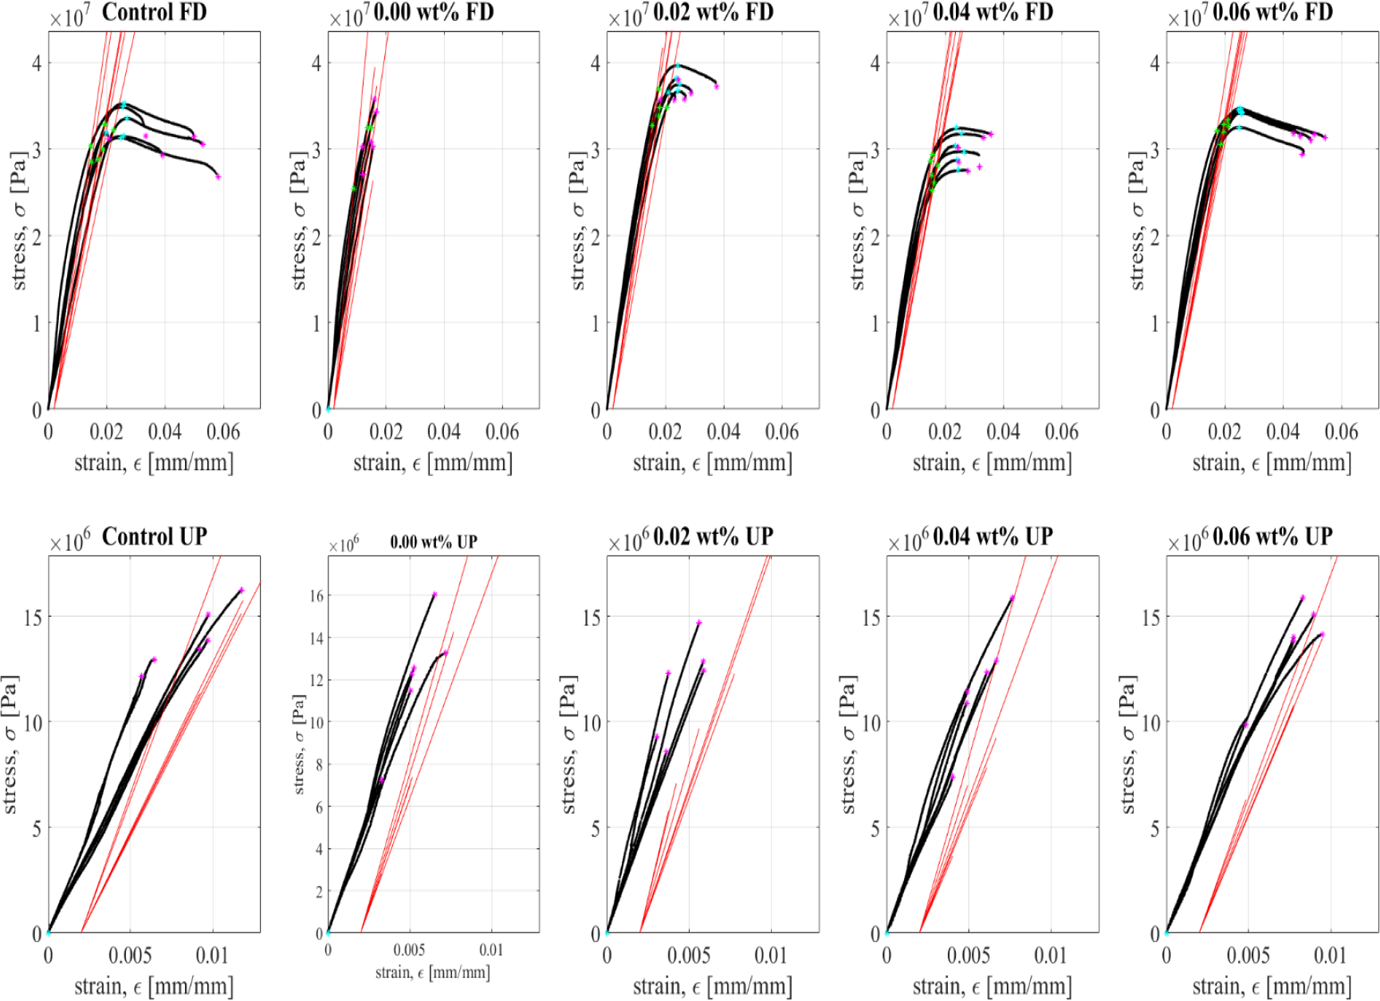
Stress–strain curves for all tensile test samples; stress–strain data (black), 0.2% yield offset (red), yield strength (green*), ultimate tensile strength (cyan*), fracture strength (magenta*). FD: facedown; UP: upright.
The average yield strength, ultimate tensile strength, fracture strength, stiffness, strain-to-failure, and toughness (calculated as the area under the stress–strain curve) were calculated from the stress–strain data shown in Figure 20. This information and ± one standard deviation are plotted as bar graphs in Figure 21.
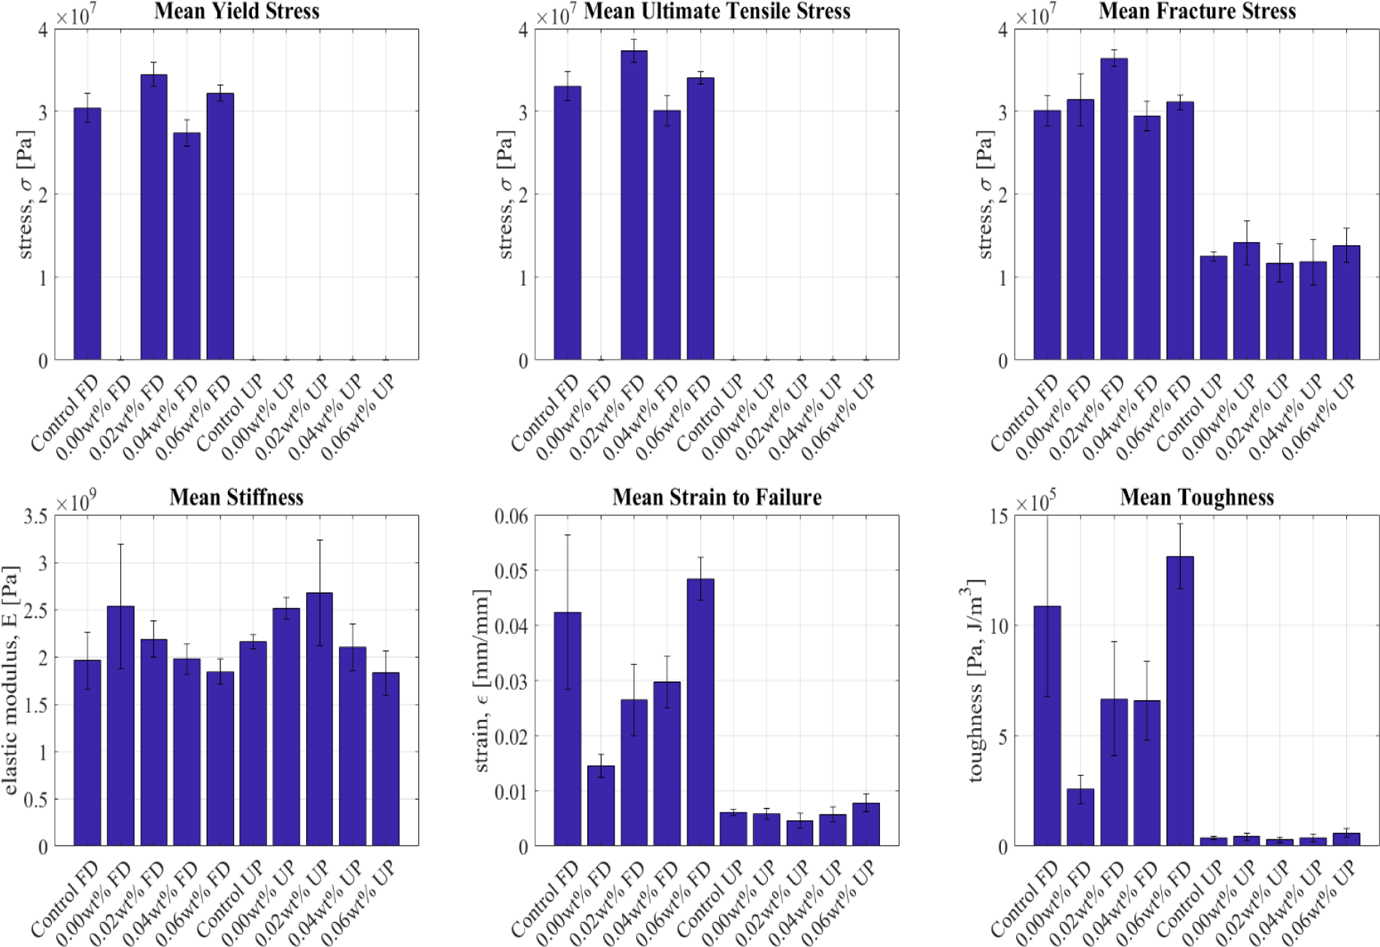
Mean yield strength, ultimate tensile strength, fracture strength, stiffness, strain-to-failure, and toughness for all tensile samples. Plus/minus (±) one standard deviation for each data set plotted as an error bar. FD: facedown; UP: upright (Note: The upright samples as well as the 0.00% FD samples did not produce a clear “mean yield strength” and “mean ultimate tensile strength,” which are attributed to the low toughness of these samples as evident from the “mean strain-to-failure” and “mean toughness” charts.)
Improvement results on produced nanocomposites samples over the control and baseline samples
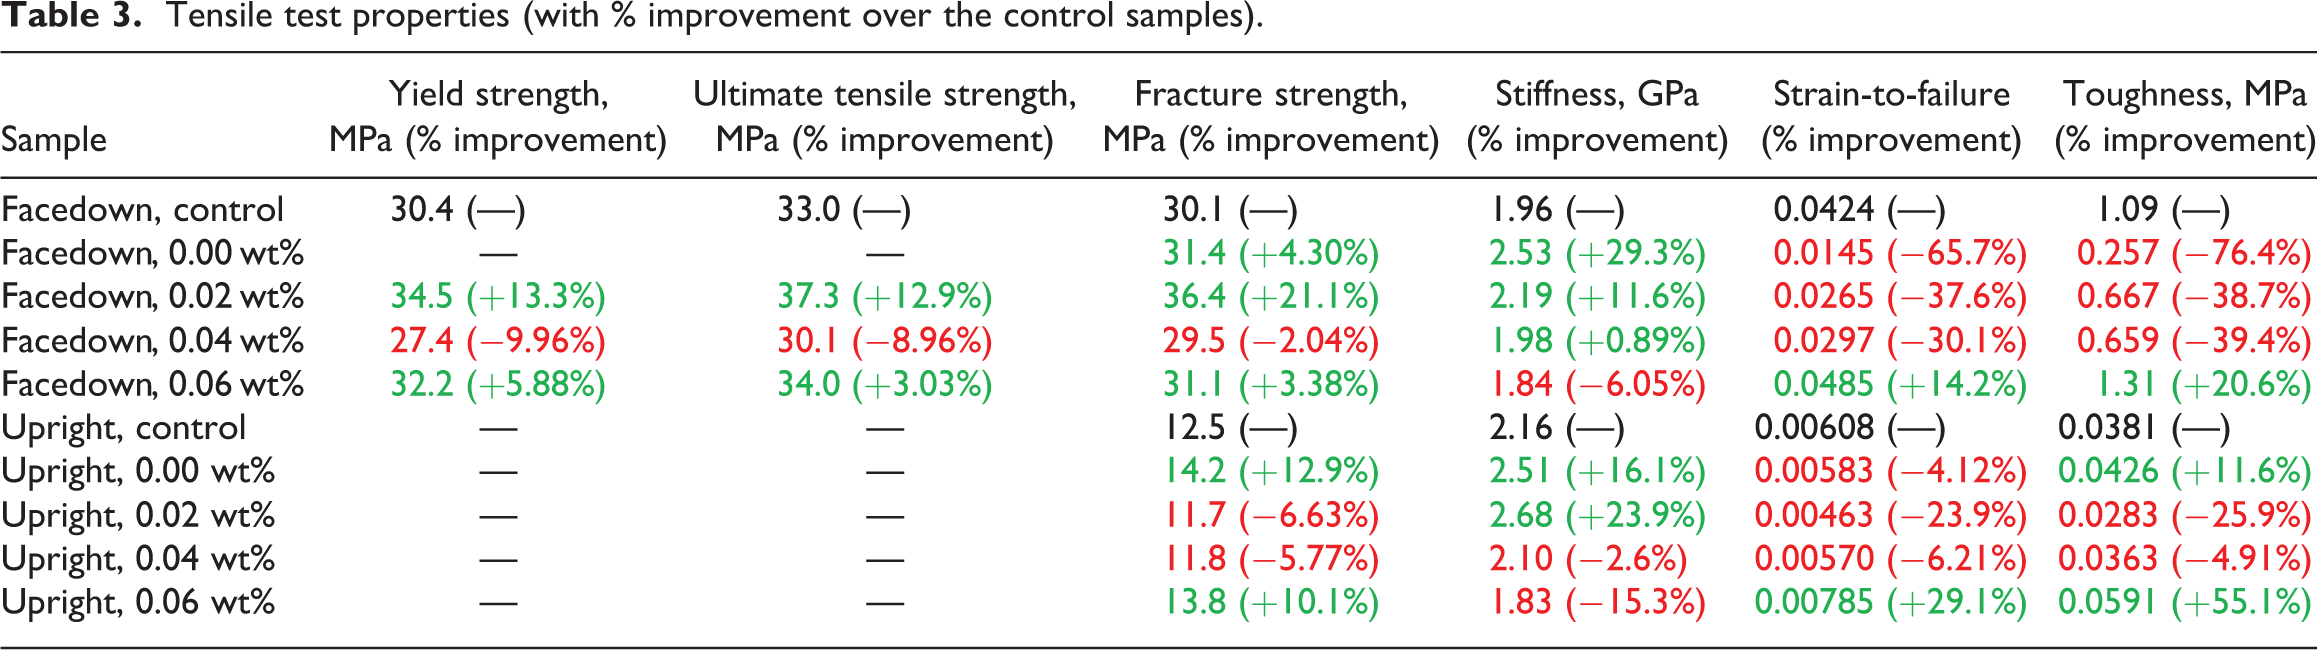
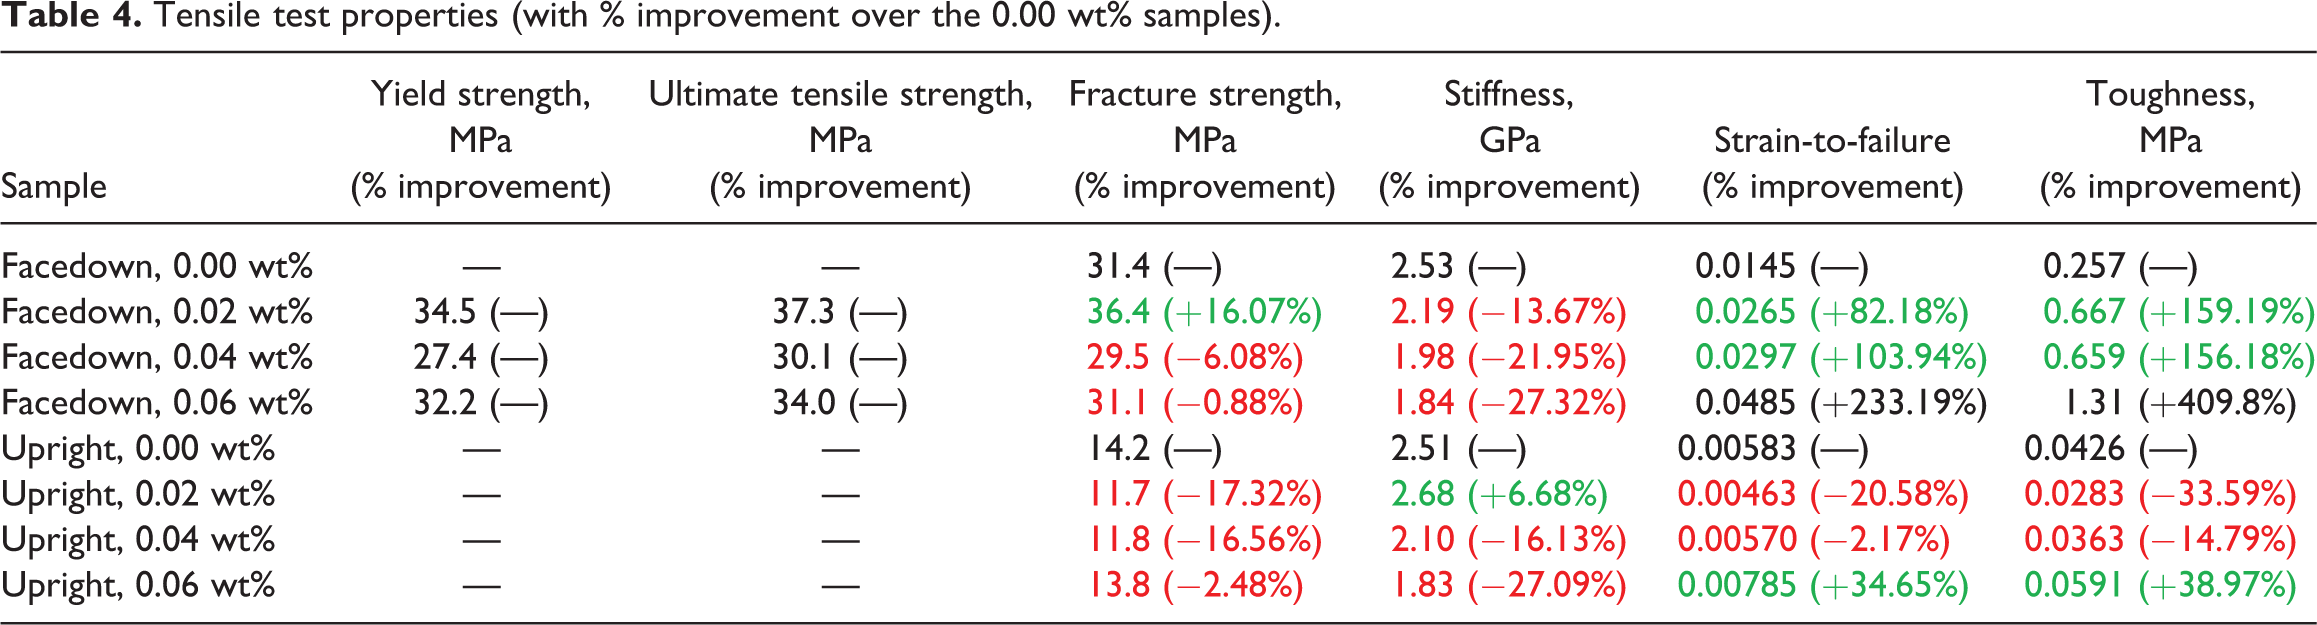
As previously discussed and corroborated by the results in Figures 20 and 21, the acetone evaporation process for impregnating GO into the ABS thermoplastic significantly affected the strength and toughness characteristics of the processed ABS samples (evident in Figure 21 and manifested itself in the “mean yield strength,” “mean ultimate tensile strength,” “mean strain-to-failure,” and “mean toughness” charts for 0.00%). Table 3 lists the magnitude and percentage improvement of the processed (i.e. 0.00, 0.02, 0.04, and 0.06 wt%) samples over the unprocessed/as-received/control samples. Therefore, in Table 3, a plus sign for the “improvement” shows the property enhancement and a minus sign for the “improvement” shows the property degradation. Table 4 lists the magnitude and percentage improvement of the processed (i.e. 0.02, 0.04, and 0.06 wt%) samples over the processed 0.00% samples. Table 4 is given to show the percentage of the improvement that GO induces into ABS after the property degradation induced into ABS just by the mixing process without adding any GO.
Tensile test properties (with % improvement over the control samples).
Tensile test properties (with % improvement over the 0.00 wt% samples).
Summary results of Table 3
The most notable “improvements” in Table 3 (compared to the control samples) are as follows:
Table 3: Facedown 0.00 wt% GO Fracture strength increase of 4% Stiffness increase of 29% Strain-to-failure decrease of 66% Toughness decrease of 76%
Table 3: Facedown 0.02 wt% GO Yield, ultimate tensile, and fracture strength increase of 13, 13, and 21%, respectively Stiffness increase of 12% Strain-to-failure decrease of 38% Toughness decrease of 39%
Table 3: Facedown 0.06 wt% GO Yield, ultimate tensile, and fracture strength increase of 6, 3, and 3%, respectively Stiffness decrease of 6% Strain-to-failure increase of 14% Toughness increase of 21%
Table 3: Upright 0.00 wt% GO Fracture strength increase of 13% Stiffness increase of 16% Strain-to-failure decrease of 4% Toughness increase of 12%
Table 3: Upright 0.02 wt% GO Fracture strength decrease of 7% Stiffness increase of 24% Strain-to-failure decrease of 24% Toughness decrease of 26%
Table 3: Upright 0.06 wt% GO Fracture strength increase of 10% Stiffness decrease of 15% Strain-to-failure increase of 29% Toughness increase of 55%
The most notable “improvements” in Table 4 (compared to the processed samples with 0.00% GO inclusion) are as follows:
Table 4: Facedown 0.02 wt% GO Fracture strength increase of 16% Stiffness decrease of 14% Strain-to-failure increase of 82% Toughness increase of 159%
Table 4: Facedown 0.06 wt% GO Fracture strength decrease of 1% Stiffness decrease of 27% Strain-to-failure increase of 233% Toughness increase of 410%
Table 4: Upright 0.02 wt% GO Fracture strength decrease of 17% Stiffness increase of 7% Strain-to-failure decrease of 21% Toughness decrease of 34%
Table 4: Upright 0.06 wt% GO Fracture strength decrease of 2% Stiffness decrease of 27% Strain-to-failure increase of 35% Toughness increase of 39%
Discussion
Table 3 shows that for the facedown samples, the acetone-based mixing process with 0.00% GO inclusion decreases the strain-to-failure and toughness by 66 and 76%, respectively, (i.e. making the 0.00% samples more brittle) and increases the fracture strength and stiffness by 4 and 29%, respectively, when comparing the unprocessed/as-received/control samples with the 0.00 wt% samples. As GO concentration increases from 0.00%, the fracture strength reaches its maximum of a 21% increase over the unprocessed control sample at 0.02 wt%. The strain-to-failure and toughness reach their maximum of 14 and 21% increase, respectively, over the unprocessed control sample, at 0.06 wt%. The stiffness demonstrates an opposite trend, decreasing with increasing GO concentration, reaching its maximum decrease of 6% (for the facedown samples) over the unprocessed control sample, at 0.06 wt%, possibly due to the fact that the samples become more ductile (as evident from their strain-to-failure and toughness data). For the upright samples, the acetone-based mixing process (i.e. the data for 0.00%) increased fracture strength by 13%, the stiffness by 16%, and toughness by 12%. Unlike the facedown orientations, when GO is added, the maximum increase in fracture strength of 10% over the unprocessed control sample occurred at 0.06 wt% and not at 0.02%. However, similar to the facedown samples, the maximum increase in strain-to-failure and toughness of 29 and 55%, respectively, as well as the maximum decrease in stiffness of 15% over the unprocessed control sample, all occurred at 0.06 wt%.
Table 4 also provides some useful information, where the magnitude and percentage improvement of the processed samples with the inclusion of GO (i.e. 0.02, 0.04, and 0.06 wt%) over the processed 0.00% samples (where ABS was processed but no GO was included) are given. Therefore, Table 4 is presented here to show the percentage of the improvement that GO induces into ABS after the property degradation is induced into ABS just by the acetone mixing process without adding any GO. Table 4 shows that for the facedown samples, the inclusion of GO either improves the fracture strength (with maximum of 16% at 0.02%) or the fracture strength remains practically unchanged. However, the inclusion of GO into the acetone-based processed parts, while reduces the stiffness, it increases the strain-to-failure and toughness with their maximum increase of 233 and 410, respectively, at 0.06% of GO inclusion, by increasing the percentage of GO inclusion, indicating that the GO inclusion increases the ductility of the samples while somewhat reducing their stiffness and practically maintaining their fracture strength (as evident from their data in Table 4). For the upright samples of Table 4, there were reductions in all properties at 0.02 and 0.04% and only the 0.06% samples showed strain-to-failure and toughness improvements of 35 and 39%, respectively, where the stiffness decreases by 27%. As expected from the previous literature, 1,27 –38 the premature brittle failure mode of the upright samples did not demonstrate an increase in fracture strength.
Conclusion
The results show that the acetone evaporation process necessary to include GO into ABS could decrease the strain-to-failure and toughness but increases the fracture strength and stiffness as evident from Table 3 and 0.00% case. Then, the addition of the GO beyond 0.00% will make the materials more ductile gradually, as GO increases it gradually compensates the initial loss due to the acetone processing, which leads to the gradual increase in the strain-to-failure and toughness of the processed parts beyond the 0.00% GO inclusion as compared with the 0.00% part properties, while somewhat reducing stiffness but maintaining or somewhat increasing the fracture strength as evident from Table 3. This research showed that at 0.06% GO inclusion, the resulting FFF 3-D printed nanocomposite ABS will have a much higher strain-to-failure (14% for facedown and 29% for upright) and toughness (20% for facedown and 55% for upright) while also somewhat increasing the fracture strength (3.5% for facedown and 10% for upright) and somewhat decreasing the stiffness (6% for facedown and 15% for upright). Therefore, the 0.06% GO inclusion demonstrated combinations of superior material properties over unprocessed/as-received/control ABS system. The improvement in strain-to-failure, toughness, and fracture strength shows the multifunctionality of the developed 0.06% GO loaded ABS system where a number of mechanical properties are improved lending itself to a number of structural applications. In addition, it is believed that a better toughness will lead to a better impact and fatigue resistance as well as a better damping coefficient 23–24 lending such materials to more multifunctionality, namely applications with static as well as dynamic loading. This low-level loading of 0.06% GO into ABS system with multifunctional properties improvement is also desirable economically and makes it a viable approach for the adoption by the industry.
Footnotes
Acknowledgment
The authors would like to thank Allison Wong of the Department of Mechanical Engineering of the University of Hawai‘i at Mānoa for assistance in operating the Instron testing machine.
Declaration of Conflicting Interests
The author(s) declared no potential conflict of interest with respect to the research, authorship, and/or publication of this article.
Funding
The author(s) received no financial support for the research, authorship, and/or publication of this article.