
Abstract
The effect of stearic acid-coated nano calcium carbonate (NCC) on transitions and chain mobility of poly(lactic acid) (PLA) was investigated. Dispersion state of NCC in polymeric matrix was explored using scanning electron microscopy and surface tension component measurements. Trends of PLA transitional phenomena were investigated using the results of dynamical mechanical analysis (DMA) and differential scanning calorimetry (DSC) in the nanocomposite systems based on PLA and NCC. In addition, two types of crystal structures and decreasing the glass transition temperature were distinguished using temperature-modulated DSC (TMDSC). Higher melting points of polymer crystals were found in TMDSC experiments due to low and dynamic heating rate compared to the conventional DSC. Dynamics of polymer chains, affected by NCC, were quantified using cooperativity length, ξ α , and the number of relaxing structural units, Nα , in the glass transition region. NCC particles hindered the cooperative motion of polymer chains at glass transitions and crystallization in TMDSC measurements, whereas the DMA results indicated that NCC particles may act as lubricant and simplified chain mobility.
Introduction
Recently, there are many biodegradable plastics being used in the packaging applications but the objectives like their cost and performance factors are different from the conventional plastics used in packaging industries. In addition, the amount of usage will considerably decrease the cost; however, the challenges of performances are still comparable to the conventional plastics. Poly(lactic acid) (PLA) is made from 100% renewable resources and requires very less energy for production unlike the other biopolymers. 1 –4
Studies of polymeric nanocomposites based on PLA and hydroxyapatite, carbon nanotubes, fumed silica, and titanium dioxide have revealed that crystallinity, thermal stability, mechanical properties, gas barrier, degradation, and flame-retardant properties of PLA have been greatly improved. 5 –9 Recently, PLA/nano calcium carbonate (NCC)-based nanocomposites have received a lot of attention owing to its wide range of potential applications, improvement of mechanical properties, and production cost. 10 –13 Incorporation of NCC to PLA matrix increases tensile modulus and stiffness, and the resulting nanocomposite shows no brittle fracture behavior. 10,11 Calcium carbonate can be modified with different surfactants such as fatty acids, phosphonate, and titanate to improve the dispersion state in the polymer matrix. 14,15
Understanding of the thermodynamic properties of macromolecules, such as the biodegradable PLA, is in close association with molecular dynamics and can be quantitatively explored by thermal analysis. 16 –21 The occurrence of the glass transition in polymers is associated with cooperative motions of macromolecular chain segments. This structural relaxation is a kinetic phenomenon which arises from the nonequilibrium characteristic of the glassy state. The glass transition temperature (T g), apparent heat capacity (Cp ), and enthalpy relaxation in the glass transition region depend on the rate of temperature change. The glass transitions involve the freezing of the cooperative, large-amplitude motion beyond the vibrational Cp which can be analyzed by modern calorimetry. Data from temperature-modulated differential scanning calorimetry (TMDSC) can be combined to obtain the apparent total, reversing, and non-reversing heat capacities. 22 –24
Adam and Gibbs 25 introduced cooperatively rearranging region (CRR) defined as a subsystem which can rearrange its configuration to another one independently of its environment.
Each CRR presents a subsystem having its own glass transition temperature and its own free volume, linked to its own relaxation time. According to Donth et al.,
26
the cooperativity length ξ
α
at the glass transition corresponds to the size of a CRR. The CRR size is estimated using the temperature fluctuation of the amorphous medium. The cooperativity length ξ
α
is associated with the volume of a CRR,
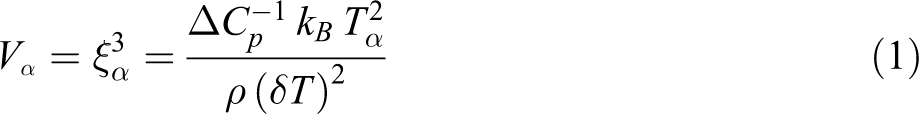
where
Another crucial transition of commercial PLA is cold crystallization phenomenon. Stiffness and modulus of PLA increase when the temperature is above about 90°C due to cold crystallization. 27 At the end of cold crystallization, melting process is started. Both the cold crystallization and melting of PLA depend on heating procedure with variables such as heating rate in DSC and TMDSC experiments and the measurement methods. 28
Recently, Bojda and Piorkowska 29 studied shear-induced nonisothermal crystallization of PLA. It was found that shearing intensified nonisothermal crystallization of PLA and all of the PLA transitions have been affected. The melting behavior of specimens reflected their thermomechanical history and the crystallinity changed during shearing, post-shearing, cooling, and subsequent heating, which led to single melting peaks with low or high temperature shoulders or to multiple melting peaks. Notta-Cuvier et al. 30 also investigated the effect of quasi-static and dynamic tensile tests on mechanical behaviors of PLA and PLA blends. It seems that different tension modes are important to characterize the properties of PLA.
The influence of crystallinity, nanofiller, and chain modification on the glass transition dynamics has been investigated in PLA, 14 –20 but to the best of our knowledge, the effects of rearranging time and applying tension during the experiment in solid state have been scarcely studied in the case of PLA-based systems especially in the presence of nanoparticles. In this study, chain rearranging of PLA during its transitions has been discussed and the effects of different methods were investigated in the solid state. DSC and TMDSC experiments were chosen as static tests (without tension) and dynamical mechanical analysis (DMA) was selected to be a dynamic test (with tension) for evaluation of PLA transitions in the presence of NCC as hindering, nucleating, and/or confining agent.
Experimental section
Materials
Amorphous PLA, grade 2002D, with Mn = 100 kg mol−1 was kindly provided by NatureWorks Co. (USA). The acid-modified NCC, grade Hakuenka CCR-S, with rhombohedral shape, the average particle size of 80 nm and surface area of 17 m2 g−1, was obtained from Shiraishi-Omya (Austria) and used as received. The nano-sized precipitated calcium carbonate was coated with stearic acid in order to improve the dispersion in polymers.
Sample preparation
Melt compounding in the presence of nitrogen gas was employed to prepare the polymeric nanocomposites. The NCC was dried at 80°C for 18 h before melt mixing. PLA was melt compounded with NCC in a lab-scale internal mixer (Brabender®, Germany) at 180°C and rotor speed of 60 r min−1 in order to prepare the nanocomposites with different NCC loading (0, 2, and 4 wt.% of NCC). The mixing time was 12 min (as an optimum value) to prepare samples with good dispersion state. Samples for DMA (with the size of 3 cm × 1 cm × 0.1 cm) and tensiometer (with the size of 2 cm × 2 cm × 0.1 cm) were prepared by hot-compression molding for 8 min at pressure and temperature of 10 MPa and 180°C, respectively.
Morphological properties
Scanning electron microscopy (SEM) of PLA/NCC nanocomposites was performed using a Seron Technologies Inc. SEM (Korea). All the samples were gold sputtered prior to examination.
Surface tension
Surface tensions (polar and dispersive parts) of PLA and its nanocomposites were measured using a tensiometer (kruss k-14, Germany). Surface tension parameters were determined by water and formamide as liquids in the plate method (according to Wilhelmy). Samples with sizes of (2 cm × 2 cm × 0.1 cm) were immersed vertically in the liquid and the surface tension components were obtained by measurement of the force acting on the plate.
Dynamical mechanical analysis
DMA characteristics of the obtained nanocomposite samples were evaluated using a DMA analyzer (Triton Co., TTDMA) under tension mode. The temperature sweep measurements were carried out in the range of 20°C to 100°C. The experiments were performed at a frequency of 1 Hz and at a heating rate of 2°C min−1.
DSC and TMDSC experiments
Melting and crystallization characteristics of samples were examined using a METTLER/TOLEDO DSC and TMDSC systems. Samples with 11–13 mg weight were encapsulated in aluminum pans and treated at heating/cooling ramps (between 25°C and 200°C) at the rate of 10 and 2°C min−1 in DSC experiments. The applied atmosphere was nitrogen with a flow rate of 80 mL min−1. To evaluate the cold crystallization behavior of nanocomposites without the interference of thermal history, after the first run of heating, the cooling ramp (10°C min−1) was performed to 25°C and subsequently, the second ramp of heating was employed. It should be noted that this type of PLA is not crystallized during the cooling from the melt.
The TMDSC experiments were performed on samples with the same thermal histories. Modulated temperature program was sinusoidal temperature profile with a heating rate of 2°C min−1, the amplitude of 1°C, and modulation period of 1 min. Heat capacities of samples versus temperature were measured according to TMDSC experiments. All PLA relaxation would be identified more accurately using TMDSC and heat capacities compared to DSC thermogram. In the remaining parts, the abbreviated codes will be used for the obtained samples. The samples were coded as PLAxRyz. In this code, x is weight fraction of NCC, y is the heating rate of DSC or TMDSC experiment, and z indicate the DSC experiment (D) or TMDSC experiment (T).
Results and discussion
Dispersion state and surface tension of PLA and nanocomposites
Dispersion state of NCC performs an important role in transitions of PLA, for example, crystallization and melting phenomena. Besides, one of the key characteristics of PLA nanocomposites, especially in foam industries, that are noticeably affected by nanofiller dispersion, is the crystallization and nucleation behavior of the matrix. 21
Morphology of PLA/NCC nanocomposites with different NCC contents is shown in Figure 1. As shown in this figure, nanocomposite containing 4 wt% of NCC (PLA4) has much more aggregates compared to nanocomposite containing 4 wt% of NCC (PLA2). In addition, the size of filler aggregation in PLA2 is smaller than that in PLA4.
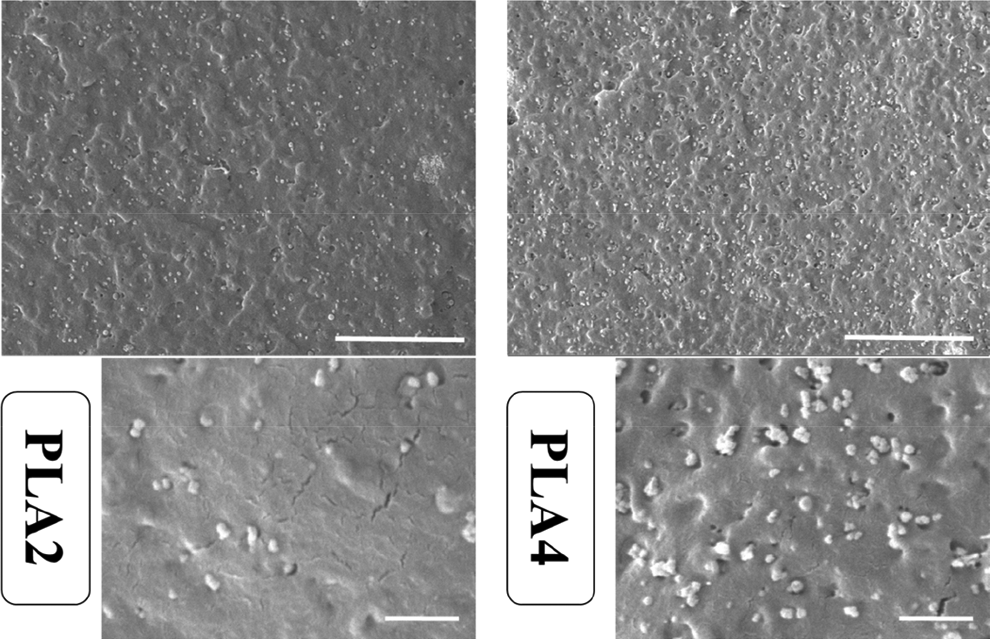
SEM micrographs of PLA2 (left images) and PLA4 (right images). The scale bars are 10 and 1 µm for top and bottom images, respectively. SEM: scanning electron microscopy; PLA: poly(lactic acid).
Because van der Waals interactions occur between all atoms and molecules, there is no substance with a surface energy/tension that solely consists of a polar part. On the other hand, there are substances that do not have any polar groups, such as alkanes that consist of hydrocarbon chains. Therefore, their surface energy/tension is purely dispersive. 31,32
By using the Wu method,
33
the solid surface free energy (Υ) and the corresponding polar (Υ
Polar and dispersive components of surface energy for PLA and its nanocomposites.
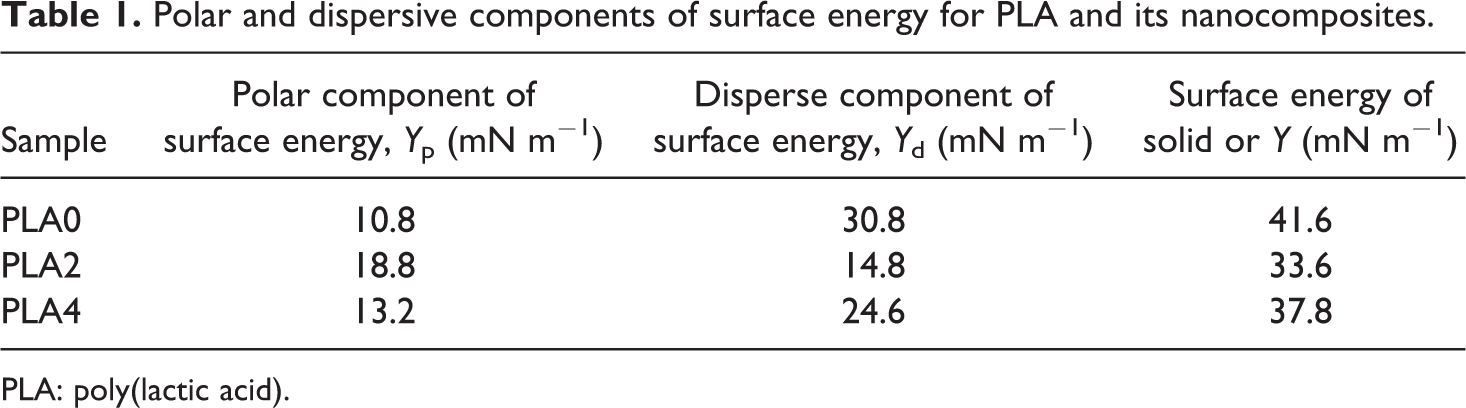
PLA: poly(lactic acid).
As mentioned earlier, before incorporation into plastics, calcium carbonate is often surface treated in order to facilitate dispersion in the polymer matrix and also to prevent loss of mechanical performance such as impact resistance. A common reagent is stearic acid. Stearic acid or its ammonium salt may be added directly during the precipitation step of calcium carbonate. Incorporation of stearic acid to calcium carbonate revealed a drastic decrease in surface energy, as a function of the degree of surface coverage by stearic acid. The totally covered calcium carbonate exhibits a surface energy close to that of pure stearic acid. 34 The NCC particles used in this work were modified with stearic acid and a layer of stearic acid was created around them. This is the reason for lower surface energy of nanocomposites compared to neat PLA. Besides the dispersion state and nucleation of NCC in polymeric matrix, stearic acid as a lubricant may decrease the polymer chain mobility and change the dependent properties.
Static thermal analysis
Crystallization and melting behavior of PLA and PLA/NCC nanocomposites in conventional DSC procedure with heating rates of 10 and 2°C min−1 are shown in Figures 2 and 3, respectively. The heating rate of 2°C min−1 was chosen to compare the results of conventional DSC and TMDSC. The characteristics of these curves including glass transition temperature (T g), melting and cold crystallization temperatures (T m and T cc), the onset temperature of cold crystallization (T ccs), and melting and cold crystallization enthalpies (ΔH m and ΔH cc) are summarized in Table 2.
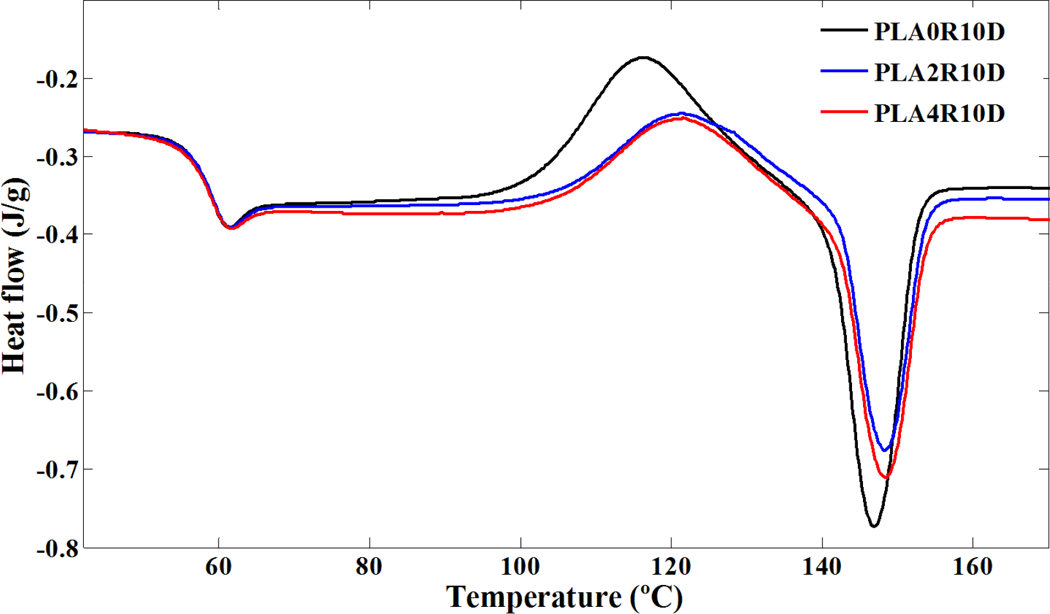
DSC heating curves of neat PLA and its nanocomposites filled with NCC after erasing thermal history; heating rate: 10°C min−1. DSC: differential scanning calorimetry; PLA: poly(lactic acid); NCC: nano calcium carbonate.
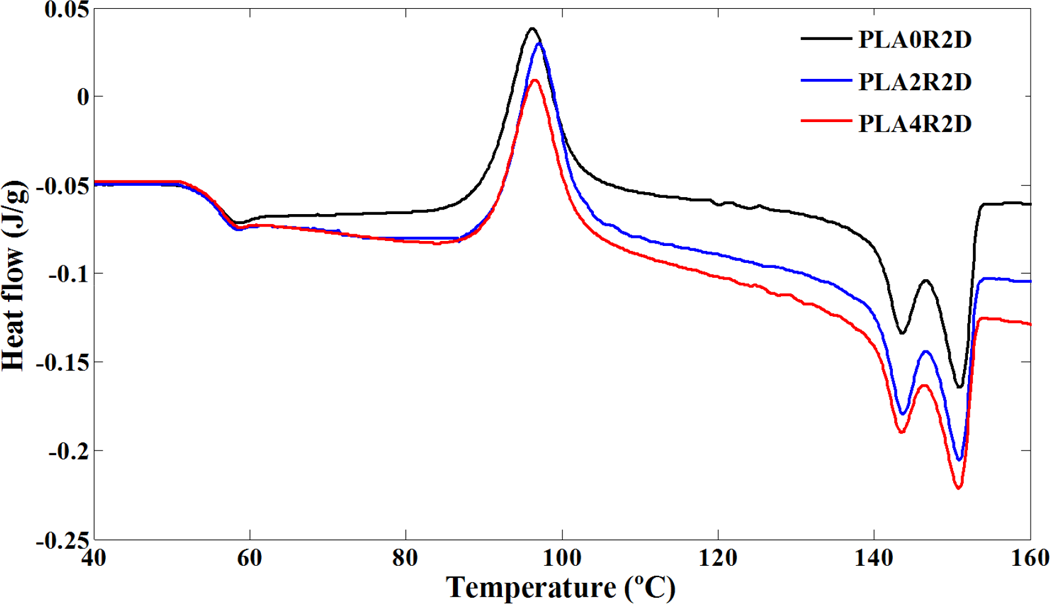
DSC heating curves of neat PLA and its nanocomposites filled with NCC after erasing thermal history; heating rate: 2°C min−1. DSC: differential scanning calorimetry; PLA: poly(lactic acid); NCC: nano calcium carbonate.
Parameters obtained from conventional DSC curves of PLA and its nanocomposites.
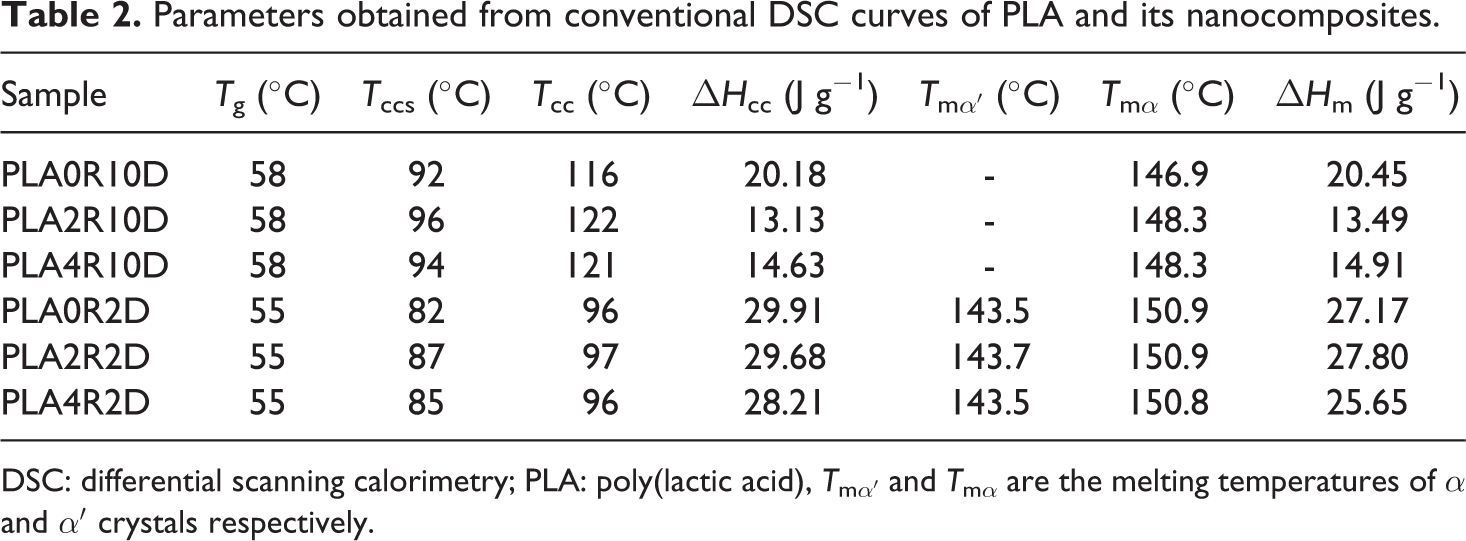
DSC: differential scanning calorimetry; PLA: poly(lactic acid), T mα′ and T mα are the melting temperatures of α and α′ crystals respectively.
Cold crystallization phenomenon can be observed for all samples due to rearrangement of polymer chains above glass transition. The enthalpy of cold crystallization was further found almost identical to the heat of fusion of the specimens in the experiments with heating rate of 10°C min−1 (Table 2), suggesting that PLA did not crystallize at any specimens under this procedure. In other words, there is no crystallization during the cooling (cooling curves not presented). Therefore, the unique structural gradient formed in some slowly crystallizing polymers did not appear in PLA nanocomposites. The similar values of ΔH cc and ΔH m for each sample also indicated that the PLA was primarily amorphous. It seems that NCC nanoparticles would act as hindrance agents for crystallization so the cold crystallization phenomenon of PLA was influenced on contact with NCC. According to Figure 2 and Table 2, addition of NCC in PLA did not result in a noticeable change in the glass transition of PLA (about 58°C) due to low efficiency of NCC in confining polymer chains. It was found that the cold crystallization temperature of the neat PLA was clearly increased by the incorporation of NCC at 2 and 4 wt%, indicating hindered crystallization ability of PLA in the presence of NCC, which might behave as hindering agents in conventional DSC procedure. These trends were observed in Figure 3, where experiments were carried out with heating rate of 2°C min−1 but the values of parameters were changed. While polymer chains have enough time to rearrange, the phenomena (glass transition or cold crystallization) are seen at lower temperatures. According to Tables 2, the T g and T cc values for samples exposed to heating rate of 2°C min−1 are lower than heating rate of 10°C min−1. In addition, unlike the heating rate of 10°C min−1, samples are semicrystalline (due to the difference in melting and crystallization enthalpy) at the heating rate of 2°C min−1 because more stable crystals during the heating were formed.
Results of TMDSC experiments were extracted and shown in Figures 4 to 6 and summarized in Table 3. Effect of NCC on PLA chain dynamics in glass transition region is demonstrated in these figures more accurately in the form of total heat flow and inphase and out-of-phase heat capacity of PLA and its nanocomposites. It seems that TMDSC with the special procedure is a useful tool to determine the chain dynamics of PLA. According to the out-of-phase Cp plots and Table 3, the dynamic glass transition (T α) of PLA was increased significantly in the presence of NCC nanoparticles. Time dependencies of glass transition phenomena, cold crystallization phenomena, and melting phenomena of PLA have been reported in literature. 28,35,36 It is observed that these phenomena are more sensitive using the TMDSC experiment procedure compared to conventional DSC, especially with heating rate of 10°C min−1. PLA chains are sensitive to rate and frequency of heating, so as in Figure 4, cold crystallization temperature for all samples decreased to the much lower temperature compared to conventional DSC. PLA polymer chains have more time to rearrange themselves in TMDSC procedures resulted in more uniform and stable crystals during the heating. Different crystal structures have been reported for PLA in which the crystal formation depends on the crystallization conditions. The most common α-form occurring in conventional melt and solution crystallization conditions was first reported by De Santis and Kovacs 37 and investigated further in a number of studies. 18,35,38,39 Based on wide angle X-ray diffraction (WAXD) and infrared (IR) data, Zhang et al. reported the slightly different α′-form for PLA crystallized below 120°C. 40 The chain conformation and crystal system of the α′-form is similar to α structure, but with a looser and less ordered chain packing. More recent studies suggest that only the α′ crystal is formed at crystallization temperatures below 100°C while crystallization between 100°C and 120°C gives rise to the coexistence of α′ and α crystal structures. 41 As mentioned earlier, in TMDSC procedure and conventional DSC with heating rate of 2°C min−1, PLA chains have enough time to rearrange and create α′ crystals besides α crystals. Melting phenomena of these two types of crystals are seen in Figure 4. Aforementioned α′ crystals showed lower melting point compared to α crystals as discussed earlier. Unlike to the conventional DSC with heating rate of 10°C min−1, NCC particles did not affect cold crystallization temperature and melting phenomenon of the crystals in TMDSC experiment. It seems that in TMDSC, transitions of PLA chains can be evaluated using kinetic parts (e.g. non-reversing and out of phase heat capacity). In TMDSC and DSC with heating rate of 2°C min−1 PLA chains have enough time to nucleate and grow the crystals so the effect of NCC is negligible in crystal structures. Another important factor which extracts from TMDSC experiment is heat capacity. As shown in Figures 5 and 6, the changes of heat capacities around glass transition and melting points were explored. As an interesting result, the T α, which is the kinetic part of TMDSC experiments, was found to be higher than T g (obtained by DSC) and affected by NCC loadings unlike to conventional DSC. Addition of NCC nanoparticles in PLA decreases the heat capacity differences around these two transitions (ΔCp ). The changes of the out of phase heat capacity during the glass transition and melting for PLA4 sample is much lower compared to two PLA2 and PLA0. It may be the results of stearic acid coated on NCC which may create more interface area with PLA, especially during the melting.
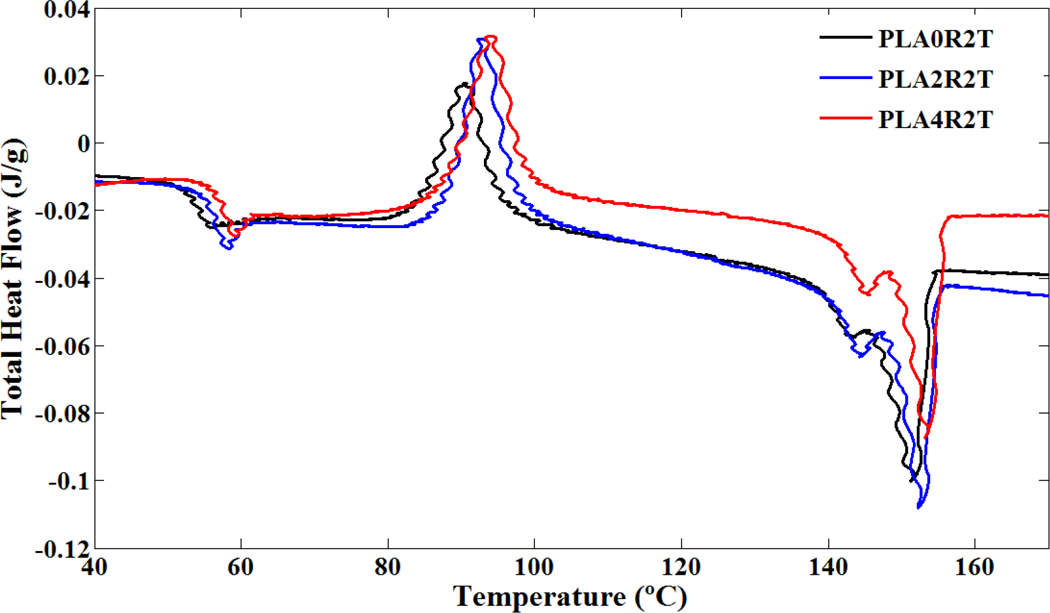
Total heat flow of neat PLA and its nanocomposites versus temperature in TMDSC heating profile. PLA: poly(lactic acid); TMDSC: temperature-modulated differential scanning calorimetry.
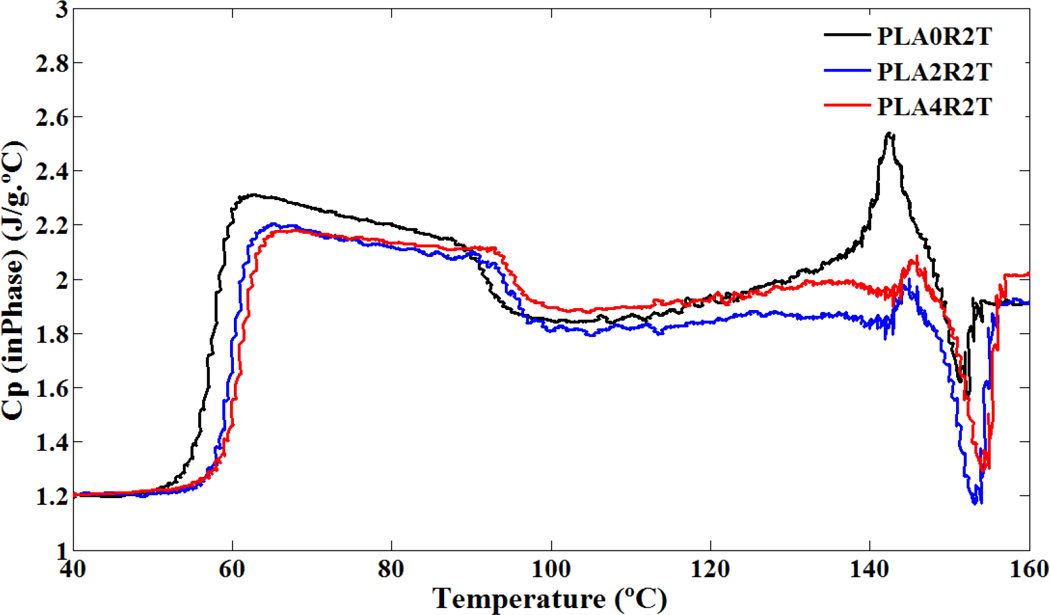
Inphase heat capacity of neat PLA and its nanocomposites versus temperature in TMDSC heating profile. PLA: poly(lactic acid); TMDSC: temperature modulated differential scanning calorimetry.
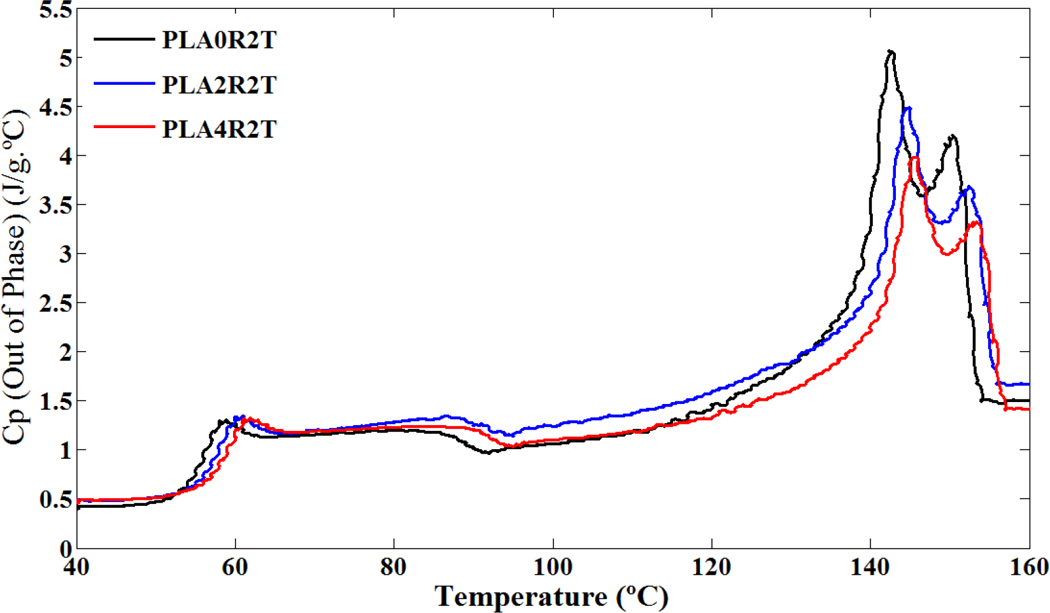
Out-of-phase heat capacity of neat PLA and its nanocomposites versus temperature in TMDSC heating profile. PLA: poly(lactic acid); TMDSC: temperature modulated differential scanning calorimetry.
Parameters obtained from TMDSC curves of PLA and its nanocomposites.
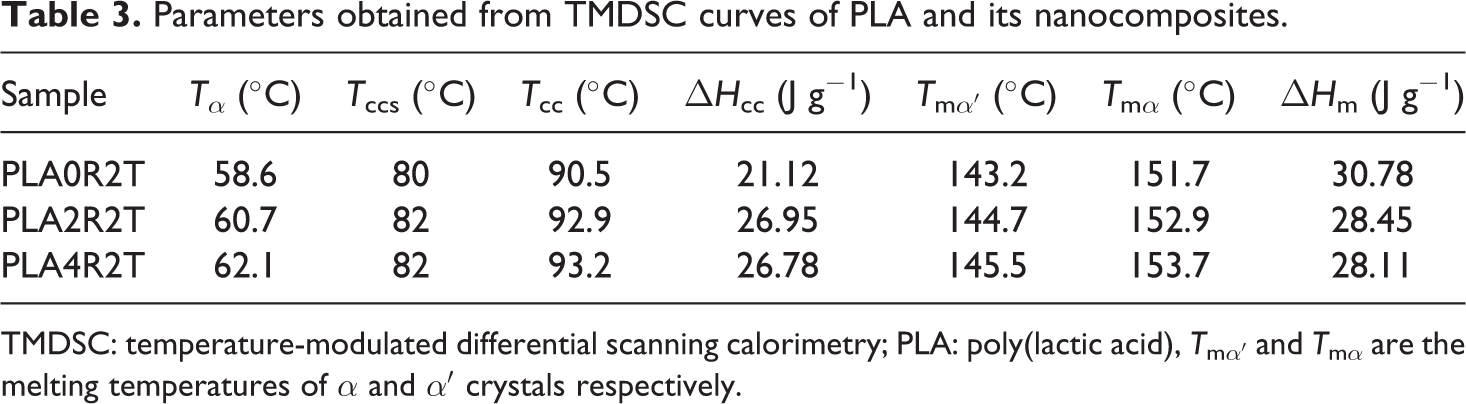
TMDSC: temperature-modulated differential scanning calorimetry; PLA: poly(lactic acid), T mα′ and T mα are the melting temperatures of α and α′ crystals respectively.
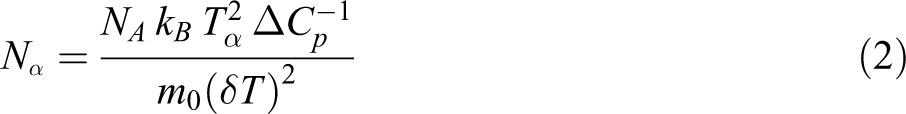
Dynamics of polymer chains around the glass transition can be evaluated by measuring the cooperativity length (equation (1)) and the number of relaxing structural units per CRR (equation (2)). The average CRR sizes are calculated by taking ρ = 1.25 g cm−3, m0 = 72 g mol−1 for the PLA amorphous phase, and the temperature fluctuation δT is the half-width at half-height of the out of phase Cp spectra. As shown in Figure 7, the CRR size (ξ α ) and degree of cooperativity (Nα ) decrease to a lower value in the presence of NCC. Results indicated that addition of NCC to PLA decreased chain flexibility leading to decrease in the size of cooperativity and the number of relaxing units.
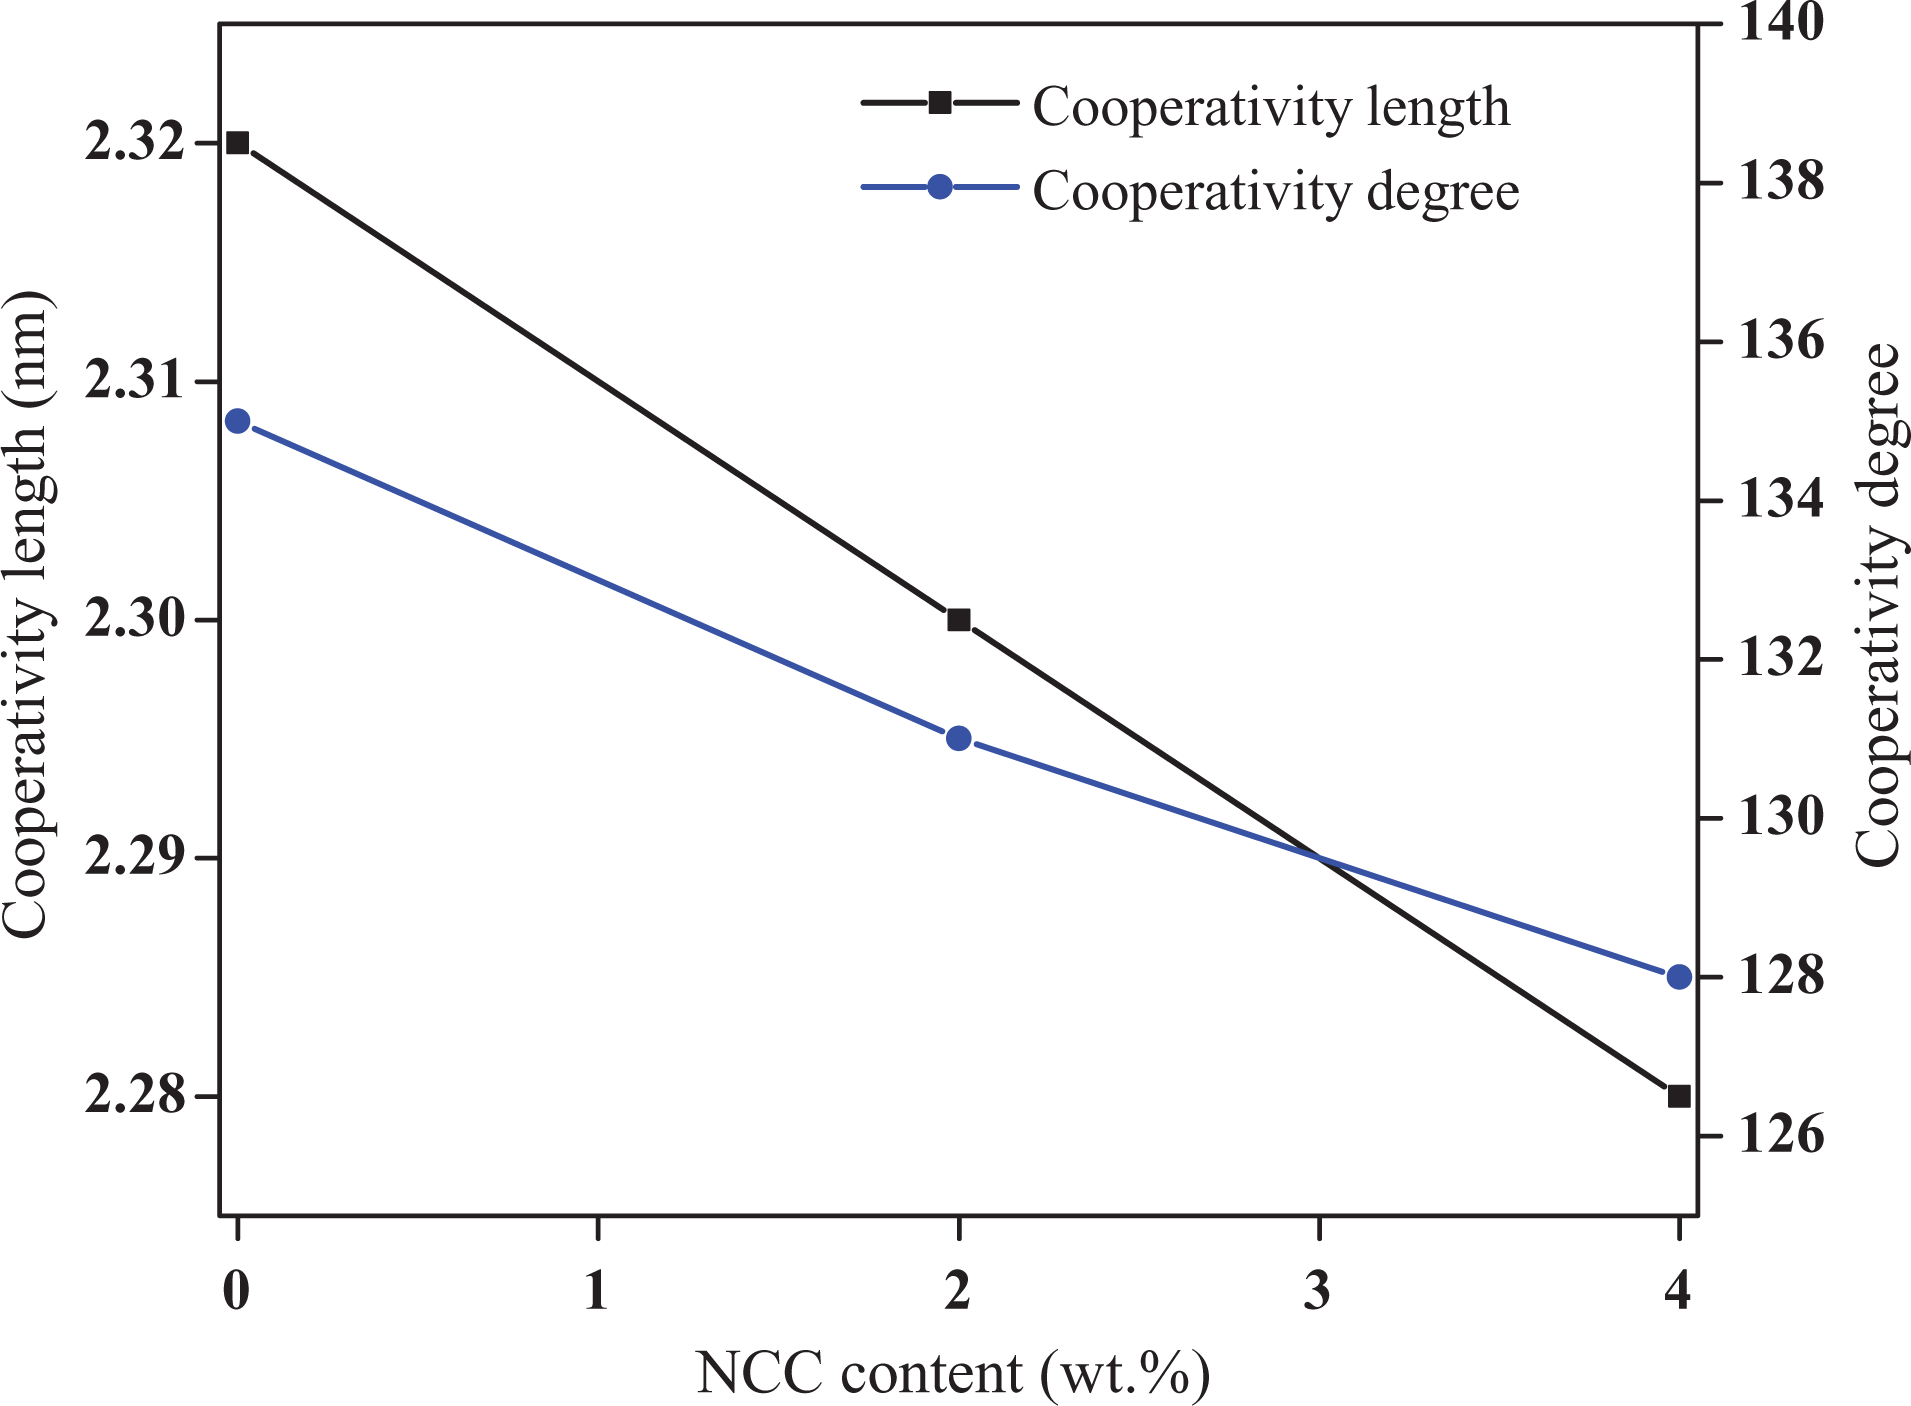
Variations in cooperativity length and cooperativity degree (number of relaxing units) versus NCC content. NCC: nano calcium carbonate.
Dynamic thermal analysis
Typical dynamic mechanical spectra of storage modulus, loss modulus, and loss factor (tan δ) for various PLA/NCC nanocomposites were recorded in the range of 20–130°C (Figures 8 to 10). As shown in Figure 8, below the glass transition temperature, storage modulus of PLA was decreased with addition of NCC. It seems that poor interphase properties of PLA and NCC particles and existence of defects in nanocomposite deteriorate the reinforcement effect of NCC. This phenomenon was reported before in the case of PLA/clay-based nanocomposites. 10,42 In addition, the presence of stearic acid around the nanoparticles during the modification process performs an important role to determine the mechanical properties of nanocomposites. Stearic acid may act as a lubricant and affect the mobility of the polymer chains. The results of dynamic measurement are discrepant with conventional DSC and TMDSC as a static measurement especially in the region of glass transition phenomenon. Results of conventional DSC showed no variation in the T g of PLA and its nanocomposites whereas increase in the T g values were observed in TMDSC experiments. It seems that the constraining effect of NCC was observed just in this experiment. According to DMA results, near the glass transition temperatures, opposing effect of static and dynamic measurements can be seen clearly. The DMA results demonstrated that addition of NCC to PLA decreased the T g values, which may be the role of stearic acid coated on NCC. In other words, the plasticizing effect in the interfacial region offset the reinforcing effect of NCC, which attributes to the decrease in the T g for the PLA4 sample. In addition, the tan δ peak height or area, an indication of the sample toughness, increases slightly when 4 wt.% of NCC is added into the PLA matrix, yet, in contrast, decreases as the 2 wt.% of NCC is added. It seems that in tension mode, dynamic tension increases the interface of PLA and stearic acid which may result in facilitating the chain mobility of PLA. Cold crystallizations of PLA and PLA/NCC nanocomposites were also seen in tan δ spectra (Figure 10). Similar to the effect of NCC on glass transition temperature, cold crystallization of PLA was accelerated by addition of NCC during the DMA experiments. It seems that the trends of both glass transition and cold crystallization of PLA in the presence of NCC are contrary to static tests (DSC and TMDSC). The reason was not understood completely but it may be the interface variation of PLA/stearic acid or rolling effect of NCC particles in tension mode of this dynamic test.
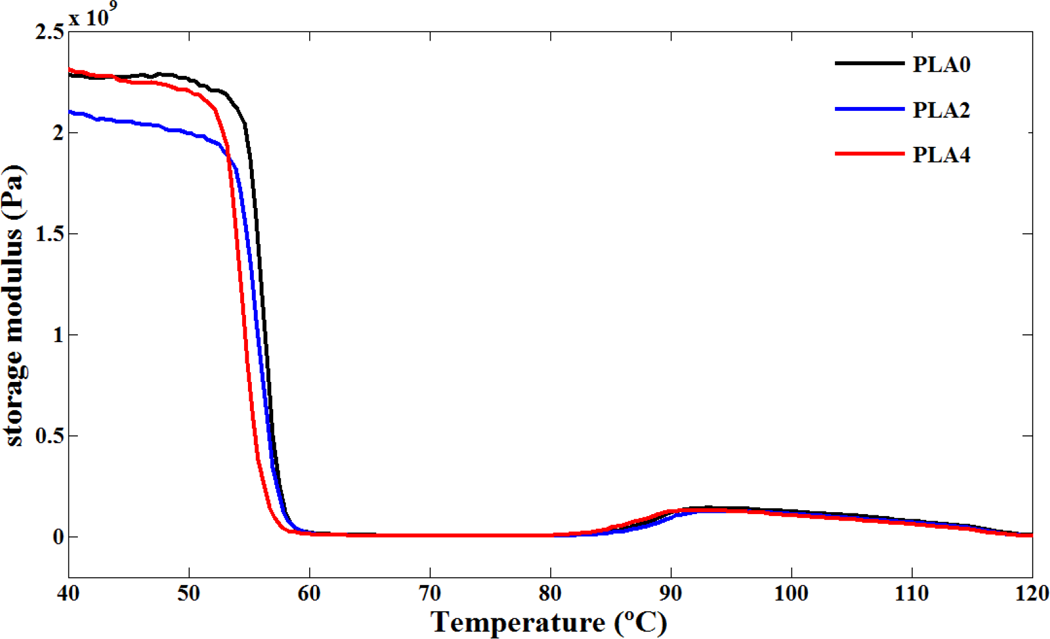
Storage modulus versus temperature for PLA and its nanocomposites. PLA: poly(lactic acid).
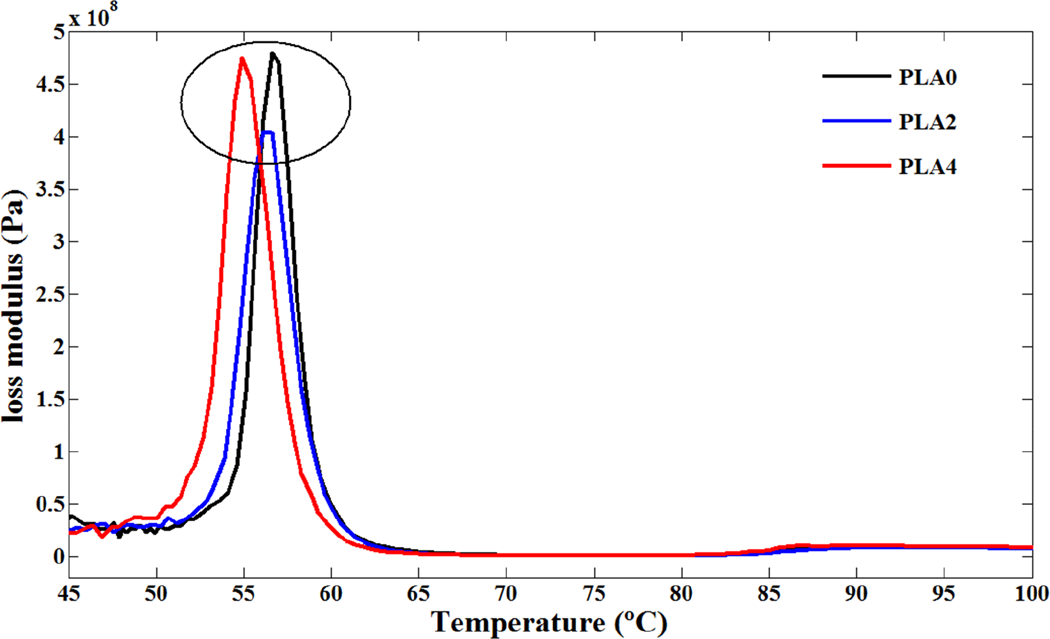
Loss modulus versus temperature for PLA and its nanocomposites. PLA: poly(lactic acid).
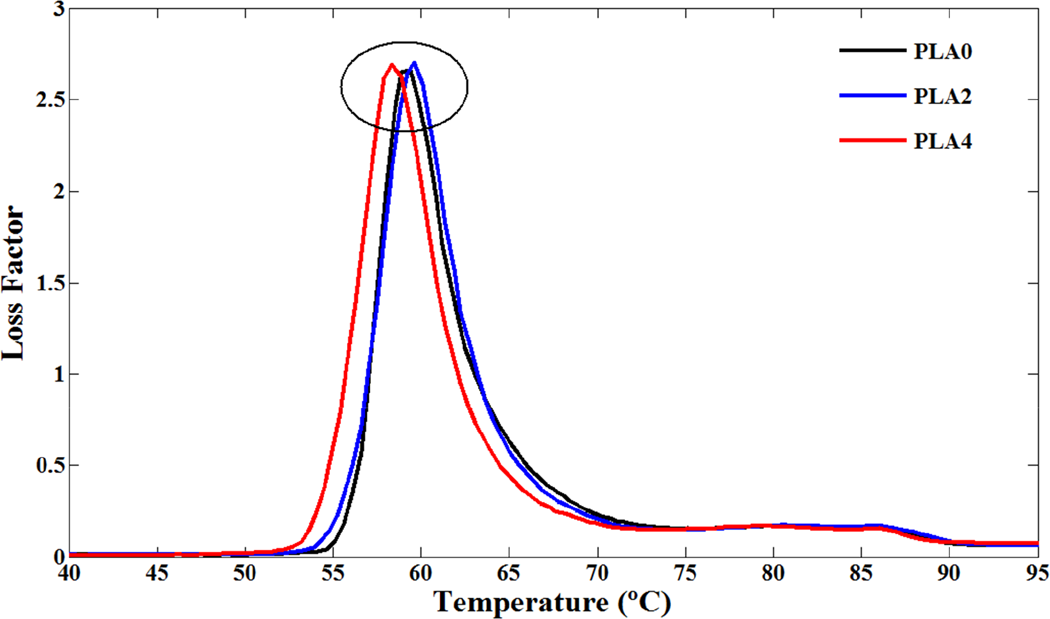
Loss factor (tan δ) versus temperature for PLA and its nanocomposites. PLA: poly(lactic acid).
Conclusion
In this study, modified NCC was used to prepare nanocomposites based on PLA. This type of nanoparticle had different effect on chain mobility of PLA during the static (DSC and TMDSC) and dynamic (DMA) measurements. Glass transition, cold crystallization, and melting phenomena of PLA were not changed considerably using the conventional DSC procedures while in TMDSC procedures all of these phenomena were affected noteworthy by addition of NCC. In addition, in conventional DSC procedure, amorphous samples were obtained while in TMDSC experiments the final samples were semicrystalline. Opposing effect of dynamic measurements compared to static measurements was seen in the glass transition and cold crystallization regions for all neat polymer and nanocomposites which may attribute to lubricant effect of stearic acid coated on NCC.
Footnotes
Declaration of Conflicting Interests
The author(s) declared no potential conflicts of interest with respect to the research, authorship, and/or publication of this article.
Funding
The author(s) received no financial support for the research, authorship, and/or publication of this article.