
Abstract
To quantify the relation between process condition, raw materials’ properties, and the interfacial tension of polystyrene (PS)/polypropylene (PP) blend, we evaluated the effect of temperature and molecular weight on the interfacial tension of PS/PP blend with deformed drop retraction method. The accuracy of measurement was improved by eliminating the residual stress in polymers and selecting retraction scale of imbedded PS fiber. Results show that the interfacial tension of PS/PP blends decreases lineally with increasing temperature. The temperature coefficient of PS/PP blends is of the same order of magnitude as reported in the PS/PP systems in the case of similar weight distribution of PS. A primary quantitative relation between interfacial tension, temperature, and molecular weight was established, which could be utilized to guide the design of novel polymer blends.
Introduction
Interfacial tension is one of the major factors governing the compatibility of polymer blends and plays a major role in controlling the morphological structure and the final-state properties of polymer blends. In the design of new materials from polymer blends, the first step requires selection of the polymer pair. In the second step, a decision regarding the most appropriate blend morphology for the specified application must be made. Therefore, it is necessary to quantify the effect of process condition and raw material property, such as the temperature, pressure, molecular weight, and molecular weight distribution, on the interfacial tension and the morphological structure of polymer blends during the development of novel polymer materials. Especially in melt spinning of blend fibers, there is an obvious nonuniform distribution of temperature along the spinning line and radial direction, which result in a nonuniform morphological structure within blend fibers, as showed in our previous researches. 1,2 So the better understanding of the quantitative relation between the temperature, molecular weight, and interfacial tension of polymers will give us a deep insight into the formation of special morphological structure and help us precisely control the morphological structure and the final-state properties of polymer blends.
The measurement of interfacial tension of polymer pairs has been studied by many researchers and the methods are summarized in review. 3 The interfacial tension of polymer blends can be directly measured by dynamic methods, which have been widely used in determining the interfacial tension of polymer due to its advantages in processing high viscosity polymers. 3 The dynamic methods are based on shape evolution of liquid drop from a nonequilibrium state to an equilibrium state, including the imbedded fiber retraction method (IFRM), 4 breaking thread method (BTM), 5 and deformed drop retraction method (DDRM). 6 DDRM was first proposed by Luciani, and it overcomes the limitations of IFRM and BTM. Luciani presented the following equation for describing the shape evolution of slightly deformed droplet (axisymmetrical ellipsoidal drops) based on Tylor’s small deformation theory 7

where D is the drop deformation parameter defined as D = (L − B)/(L + B), L is the major axis of ellipsoidal drop, and B is the minor as shown in Figure 1. D 0 is the initial value of deformation parameter, σ is the interfacial tension, p is the viscosity ratio of the dispersed droplet to the matrix, η m is the viscosity of matrix, R 0 is the equilibrium radius of sphere drop, and t is the time of retraction.
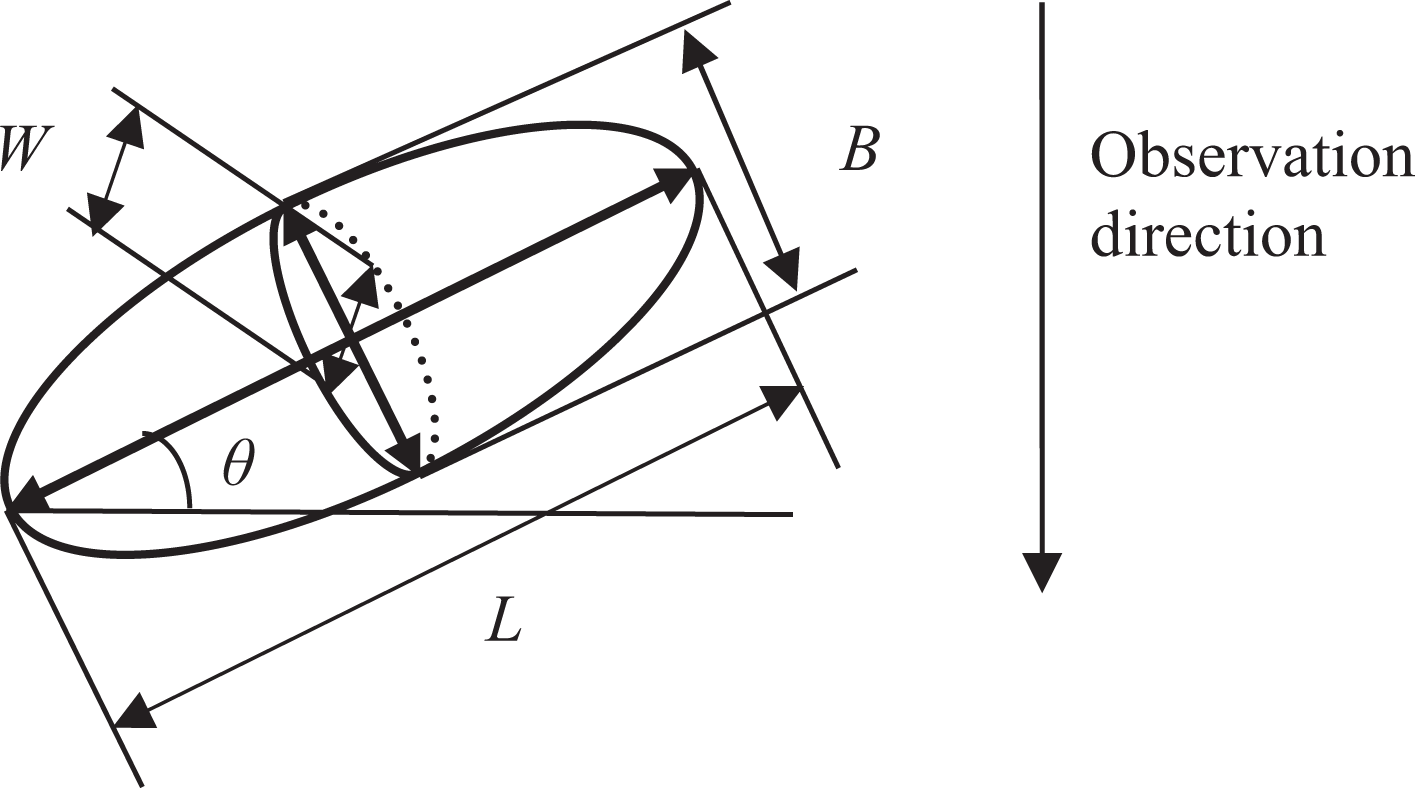
Schematic representation of a deformed drop, θ is the angle between the major axis and the plane perpendicular to observation direction.
The deformed drop in Luciani’s method was produced by applying an external shear force to polymer melt, so a tilt angle was produced and just one shape parameter, B, can be directly measured under microscope. Many attempts have been made to develop accurate and convenient techniques to measure the interfacial tension for polymers. 8 –11 Mo et al. 11 proposed a convenient method to simultaneously measure two dimensions, L and B. In this approach, an ellipsoidal droplet with a zero tilt angle was produced from the breakup of thread. Son and Kalman 10 proposed an improved deformed droplet method, which combines the analytical power of the DDRM with the experiment simplicity of the IFRM. In Son’s method, a perfect axisymmetrical ellipsoidal droplet with a zero tilt angle was produced at a later stage of relaxation of short imbedded fibers. These published researches and developed methods give us a chance to measure the interfacial tension more conveniently and accurately. Even though many researchers are concerned with the factors influencing the interfacial tension of polymer blends. However, there is rare study concerned on establishing a quantitative relation between the process conditions, materials properties, and interfacial tension.
In this article, the effect of temperature and molecular weight on the interfacial tension of polystyrene (PS)/polypropylene (PP), using four different molecular weights PS and one single PP, was evaluated with DDRM. Series of methods were used to improve the accuracy of measurement. A quantitative relation between interfacial tension, temperature, and molecular weight was established based on mathematic fitting and would be used to simulate the evolution of morphology of polymer blends during the process.
Experimental
Materials
The materials used in this work and their characteristics are listed in Table 1. PS1 was purchased from BASF Chemical Company (trade name: Polystyrol 144C [Europe]). PS4 was purchased from Taiwan Taida Chemical Company (trade name: 951F [Taiwan, China]). PS2 and PS3 were obtained from PS1 and PS4 by mixing solution at different weight ratios. All the materials were dried under vacuum at 80°C for at least 24 h before use.
Properties of materials.
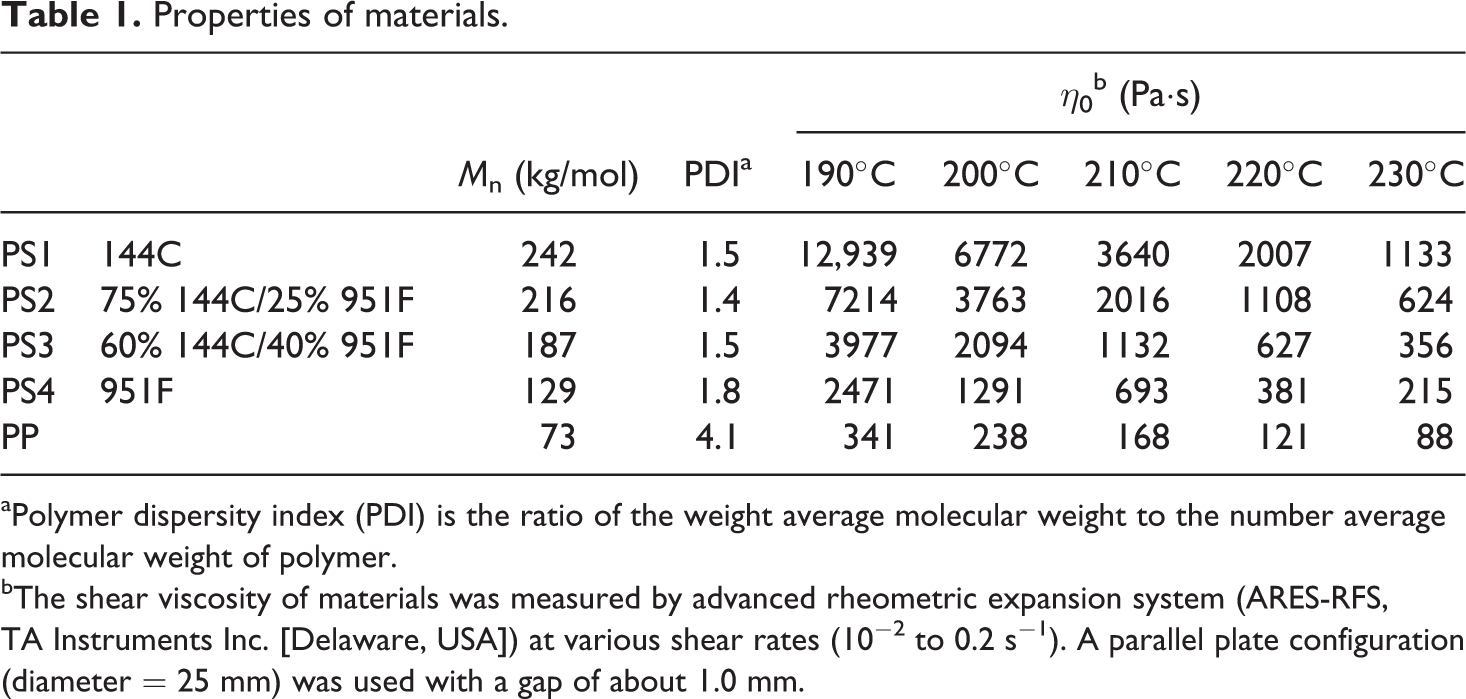
aPolymer dispersity index (PDI) is the ratio of the weight average molecular weight to the number average molecular weight of polymer. bThe shear viscosity of materials was measured by advanced rheometric expansion system (ARES-RFS, TA Instruments Inc. [Delaware, USA]) at various shear rates (10−2 to 0.2 s−1). A parallel plate configuration (diameter = 25 mm) was used with a gap of about 1.0 mm.
Interfacial tension measurement
The interfacial tension between PP and PS was measured by DDRM, which combines the advantages of IFRM and DDRM. PS fibers with a diameter of about 0.5 mm were obtained at a draw speed of 100 m/min and 230°C with a laboratory level melt spinning machine. Due to the orientation of the molecular chain during extension, internal stress was left in PS fibers. The internal stress will affect the retraction of PS droplet in PP matrix, therefore has an adverse influence on the result of interfacial tension. The sonic velocity value (C) of fiber demonstrates the orientation degree of polymer molecular chain, so the PS fibers used here were annealed in water at 100°C for several minutes to make the fiber disorientation. The sonic velocity value of annealed PS fibers was measured on an SOM-2 voice speed orientation determining instrument (Shanghai, China) at 10 kHz and was used to evaluate the residual internal stress in PS fibers. PP was molten at 230°C for 5 min to eliminate the residual stress. Then, PS fibers were cut into a short fiber with about 2 mm in length. A sandwiched sample was prepared by placing the short PS fiber between two PP films. The thickness of PP film is about 2 mm. The sandwiched sample was placed between two glass walls in the hot stage, which is loaded in a sealed box equipped with two tubular connectors for aeration of nitrogen, to observe the shape evolution of PS droplet under an optical microscope (BX51-P, Olympus, Japan). The measurement was taken at the nitrogen flow rate of 10 mL/min to avoid thermal degradation of the polymer. At first, the temperature was elevated and maintained at 170°C for 10 min to ensure perfect imbedding without any undesired deformation of the PS fiber. Then, the temperature was increased to 190°C, 200°C, 210°C, 220°C, and 230°C, respectively. Images of PS droplet during retraction were recorded and used to analyze the data for the interfacial tension measurement.
Results and discussion
Heat treatment was used to eliminate the residual internal stress of imbedded fiber as reported by Palmer and Demarquette. 12 However, few papers discuss the effect of heat treatment condition due to the difficulty of characterizing the residual internal stress of polymers. The sonic velocity values (C) of annealed PS fibers and its value at different anneal timings in 100°C water are used to evaluate the residual internal stress as mentioned in the former section (Figure 2). In this article, it is seen that C decreases with increasing anneal time and reaches a constant value after 80 min for all cases. It indicates that the residual internal stress was eliminated after a certain period of annealing.
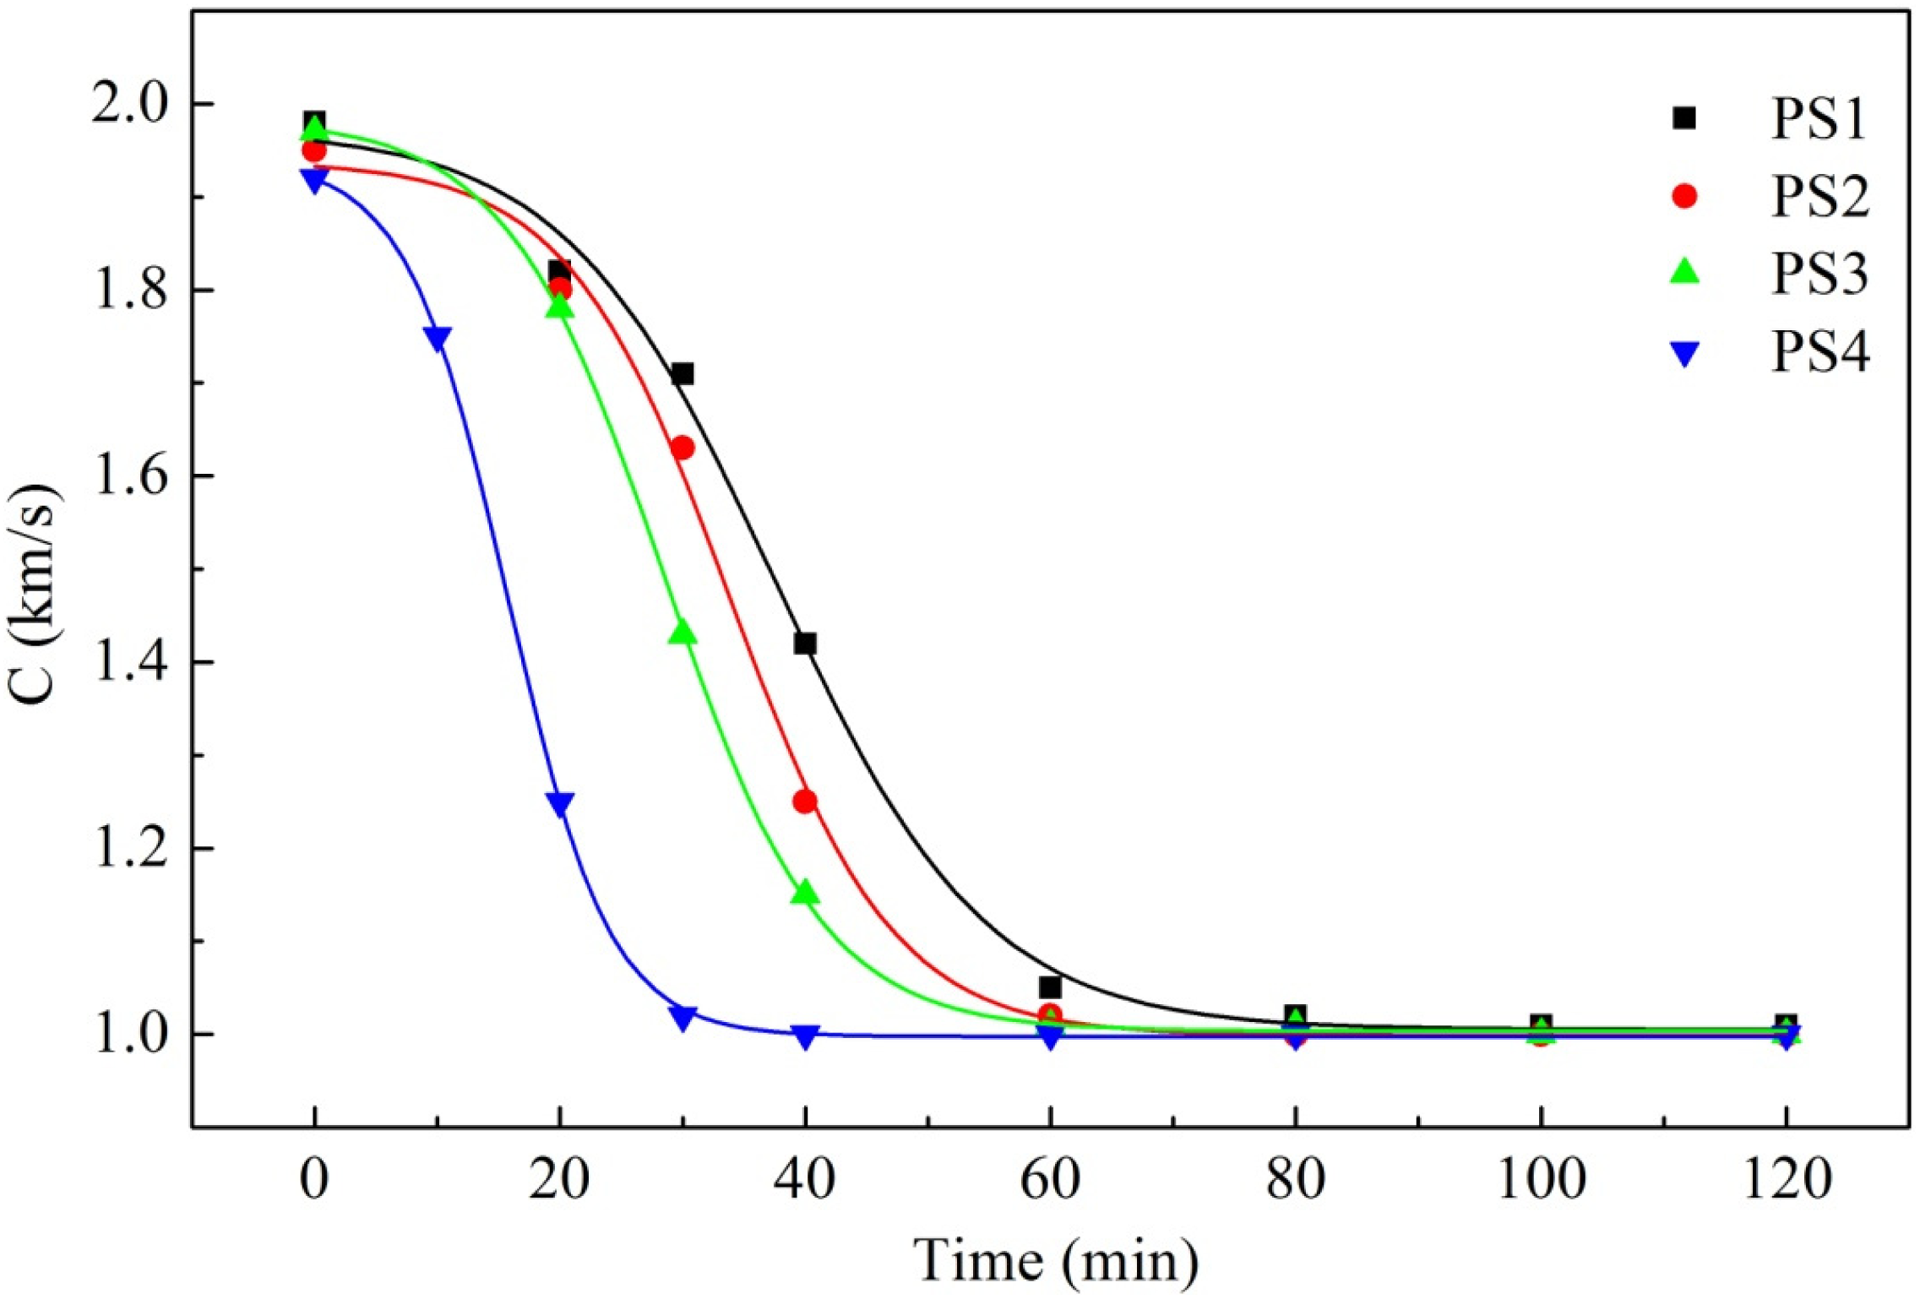
The C value of PS fibers at different anneal timings. PS: polystyrene.
The typical retraction process of imbedded PS fiber in PP matrix is presented in Figure 3. It can be seen that the PS fiber experiences two stages of retraction. In stage I, the initial cylindrical short PS fiber transforms to an ellipsoidal droplet. In stage II, the ellipsoidal droplet transforms to a spherical droplet under the force of interfacial tension. It also can be seen that θ = 0° due to both tips of the deformed droplet are in clear focus in the microscope. 10
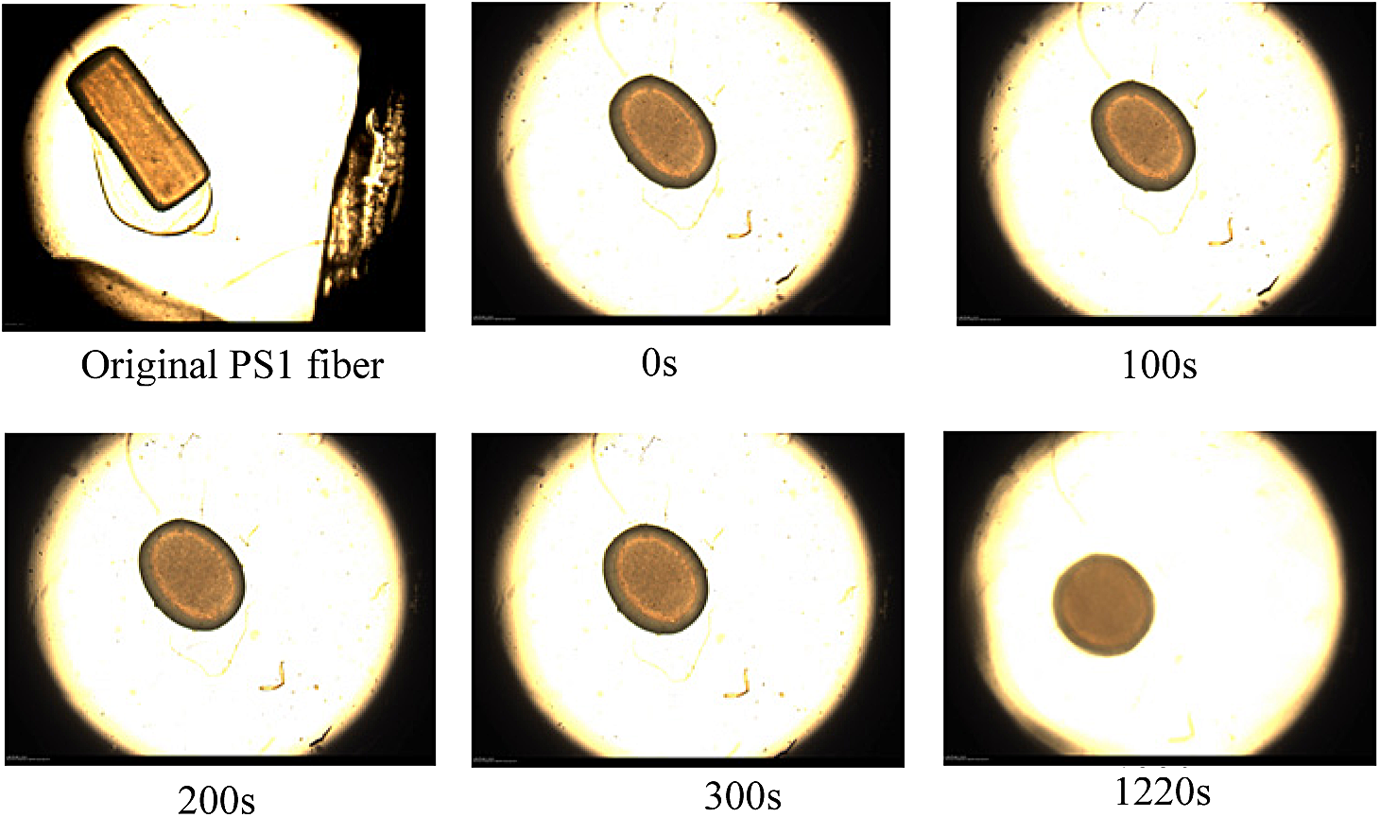
The shape evolution of PS1 fiber imbedded in PP matrix at a temperature of 210°C. PS: polystyrene; PP: polypropylene.
The time evolution of the observed values of L and B as well as the calculated second minor axis W using isovolumetric principle (W = R
0
3/(LB)) in stage II is shown in Figure 4. It is found that in all period of retraction, B and W are different under the assumption of volume preservation. Mo et al.
11
also found that the B and W are not in the same length in most cases. Liu’s study found that when using DDRM, the most applicable retraction scale D
0 is 0.15–0.17 and the distortion criterion γ (γ = (B − W)/L) must be smaller than 0.2.
8
In this scale, the three shape parameters cannot make much difference in the measurement deviation from the standard. So, we set the starting point at D0 ≅ 0.15 to describe the shape evolution of PS droplet using equation (1). Time evolution of the observed values of L and B as well as the calculated value of W of PS1 fiber at 210°C using isovolumetric principle. PS: polystyrene.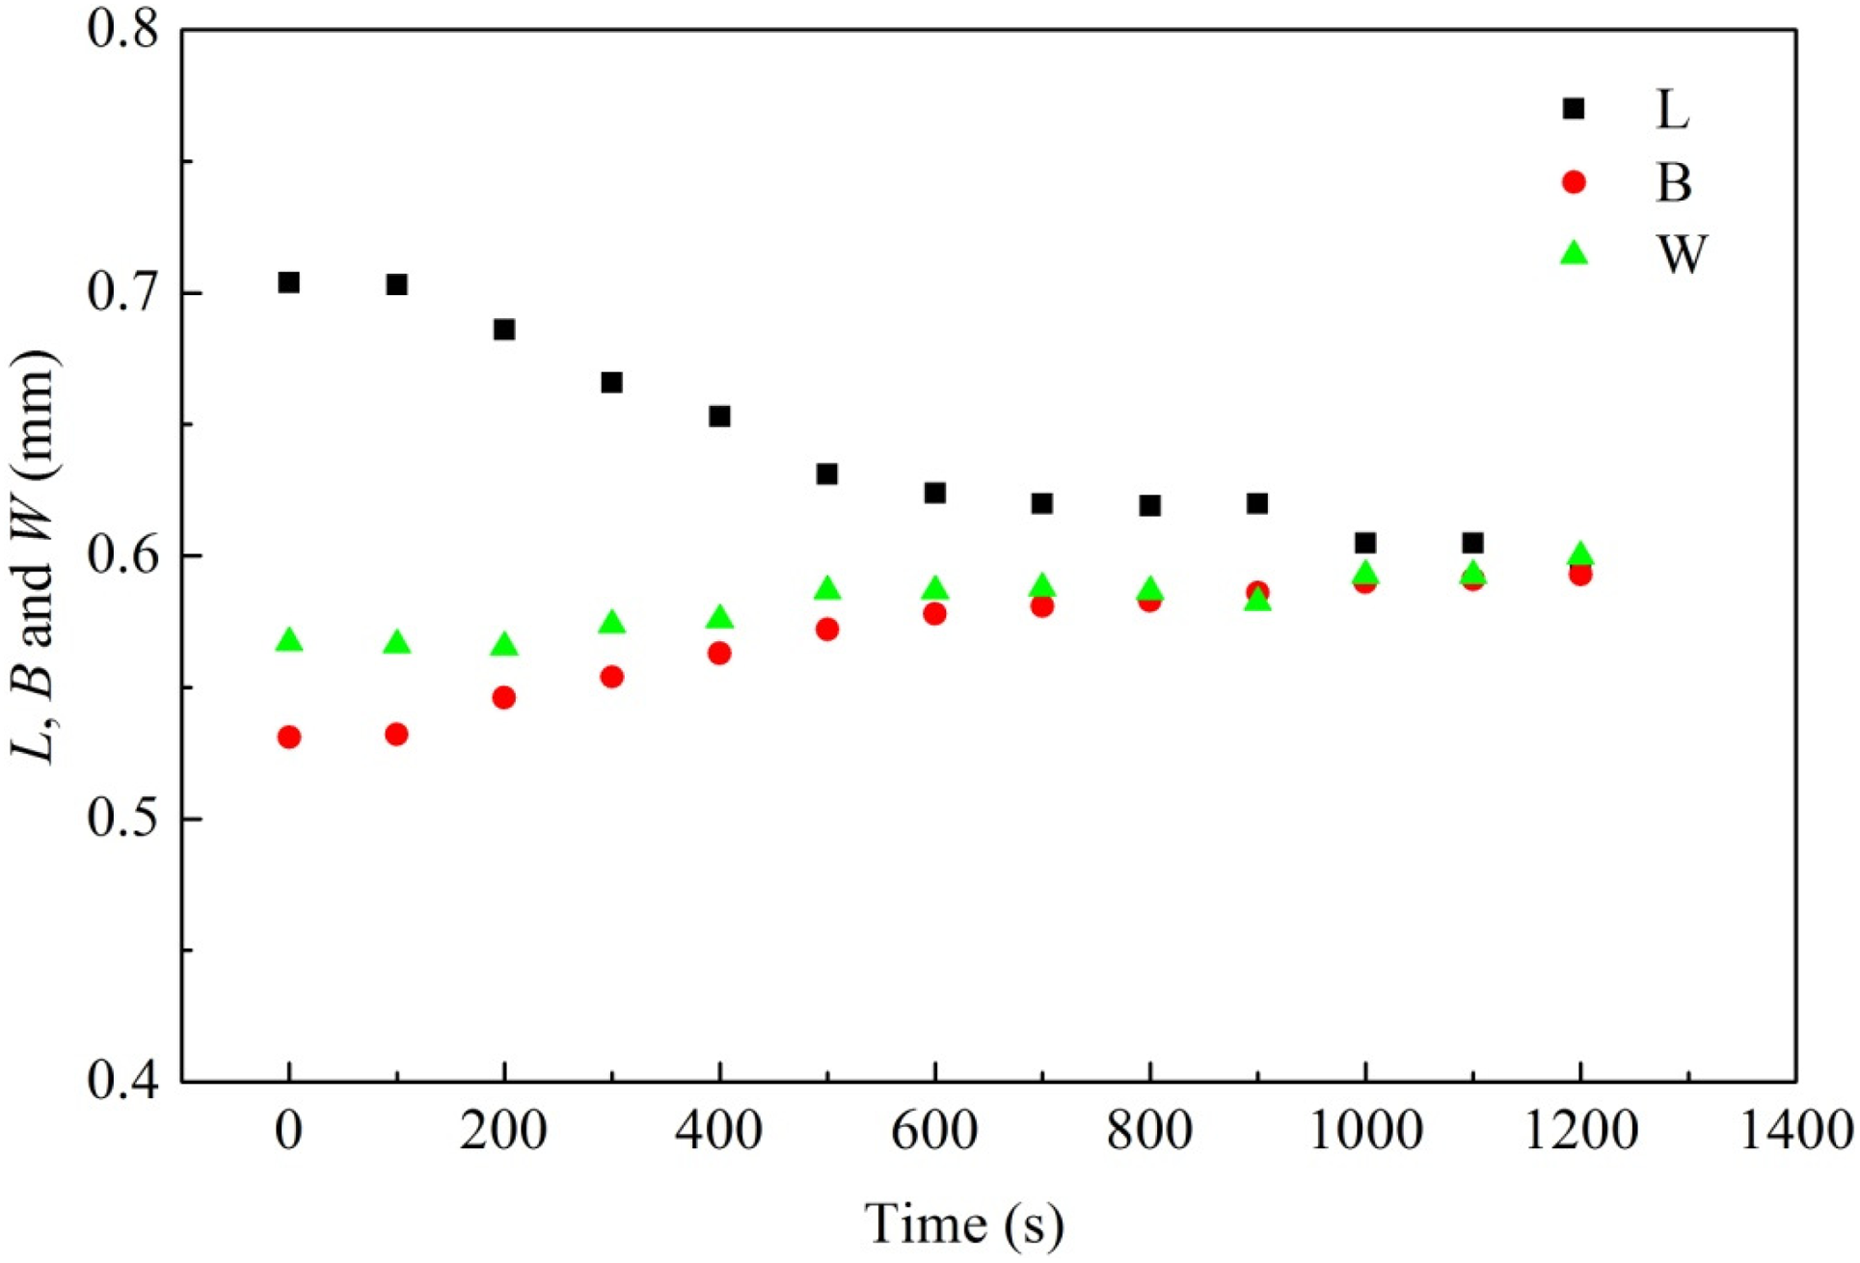
Figure 5 shows a plot of D as well as the apparent dimensionless volume V (
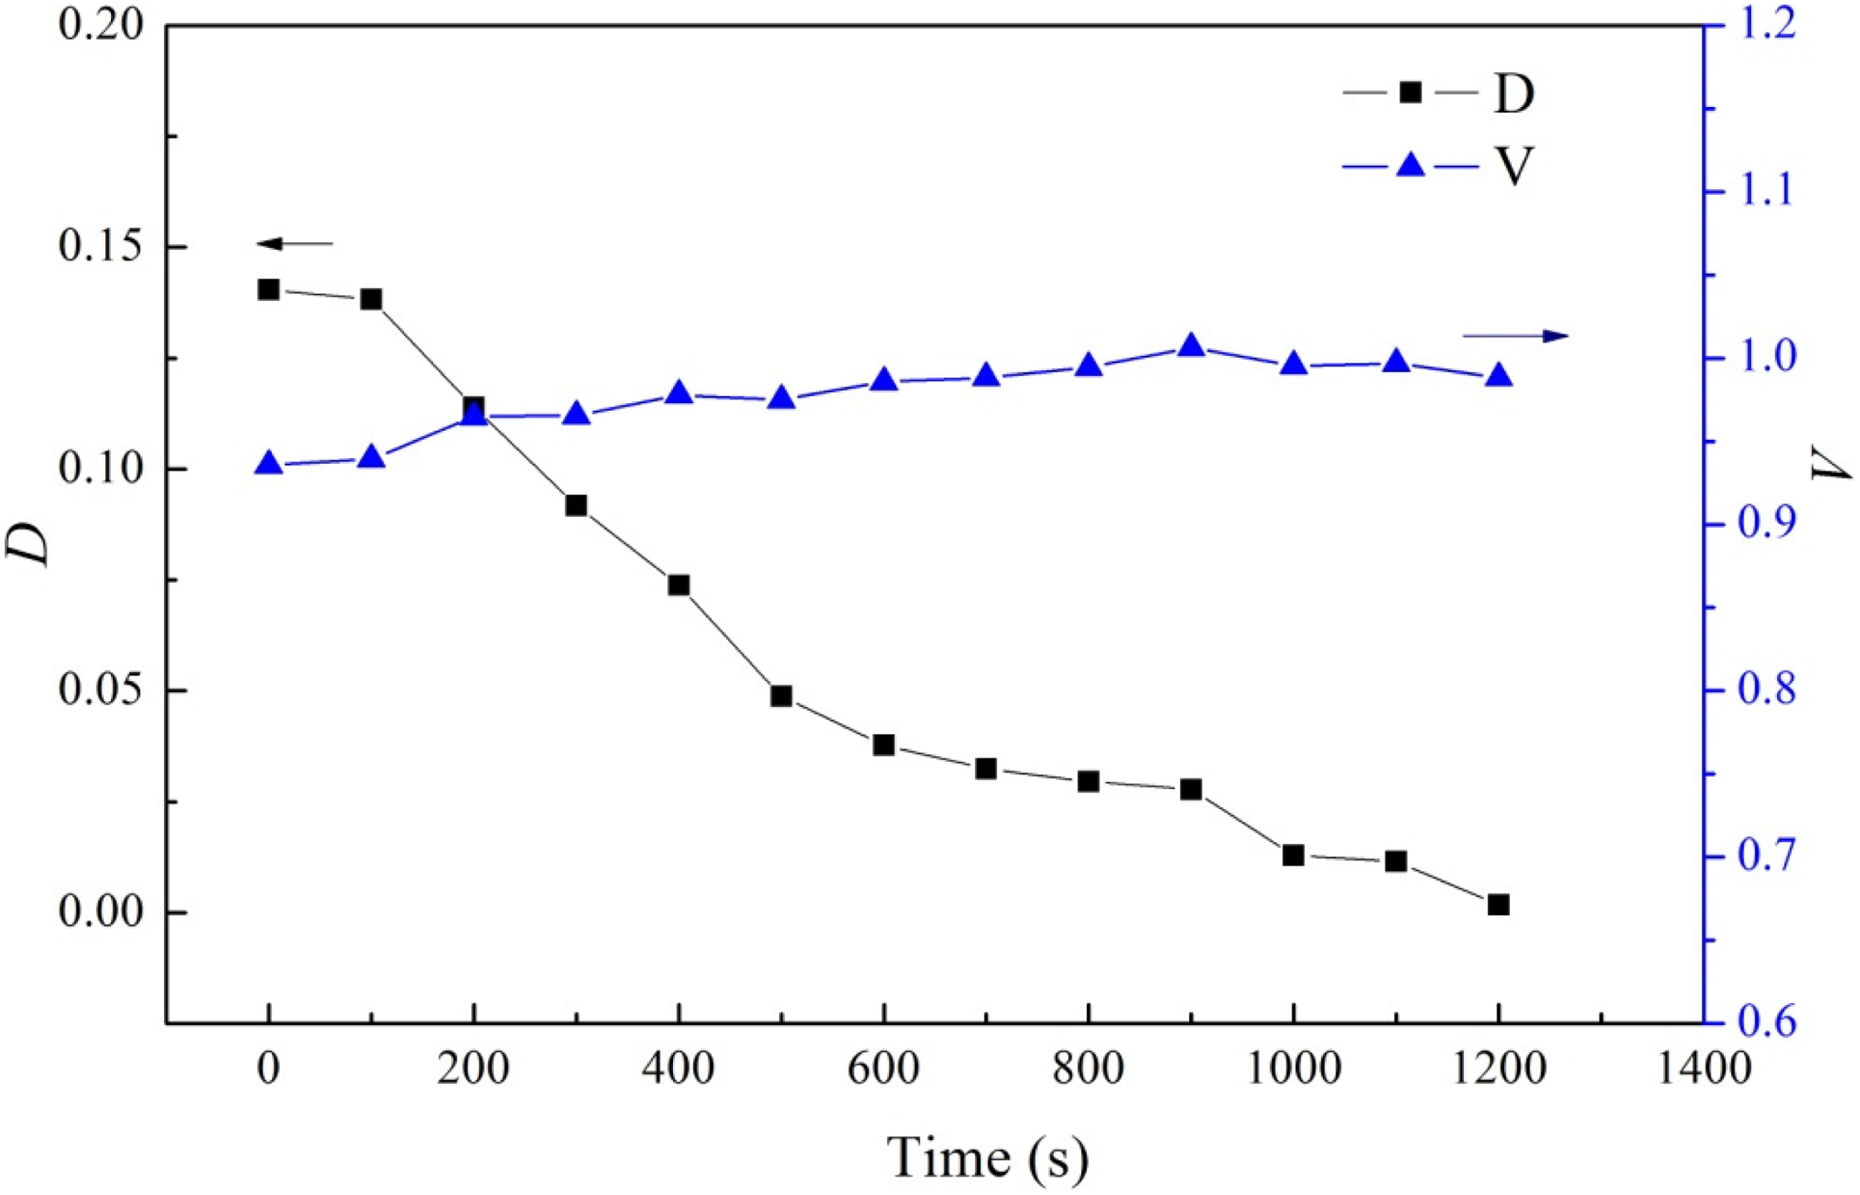
D and the apparent dimensionless volume V of the PS1 droplet at 210°C as a function of retraction time. PS: polystyrene.
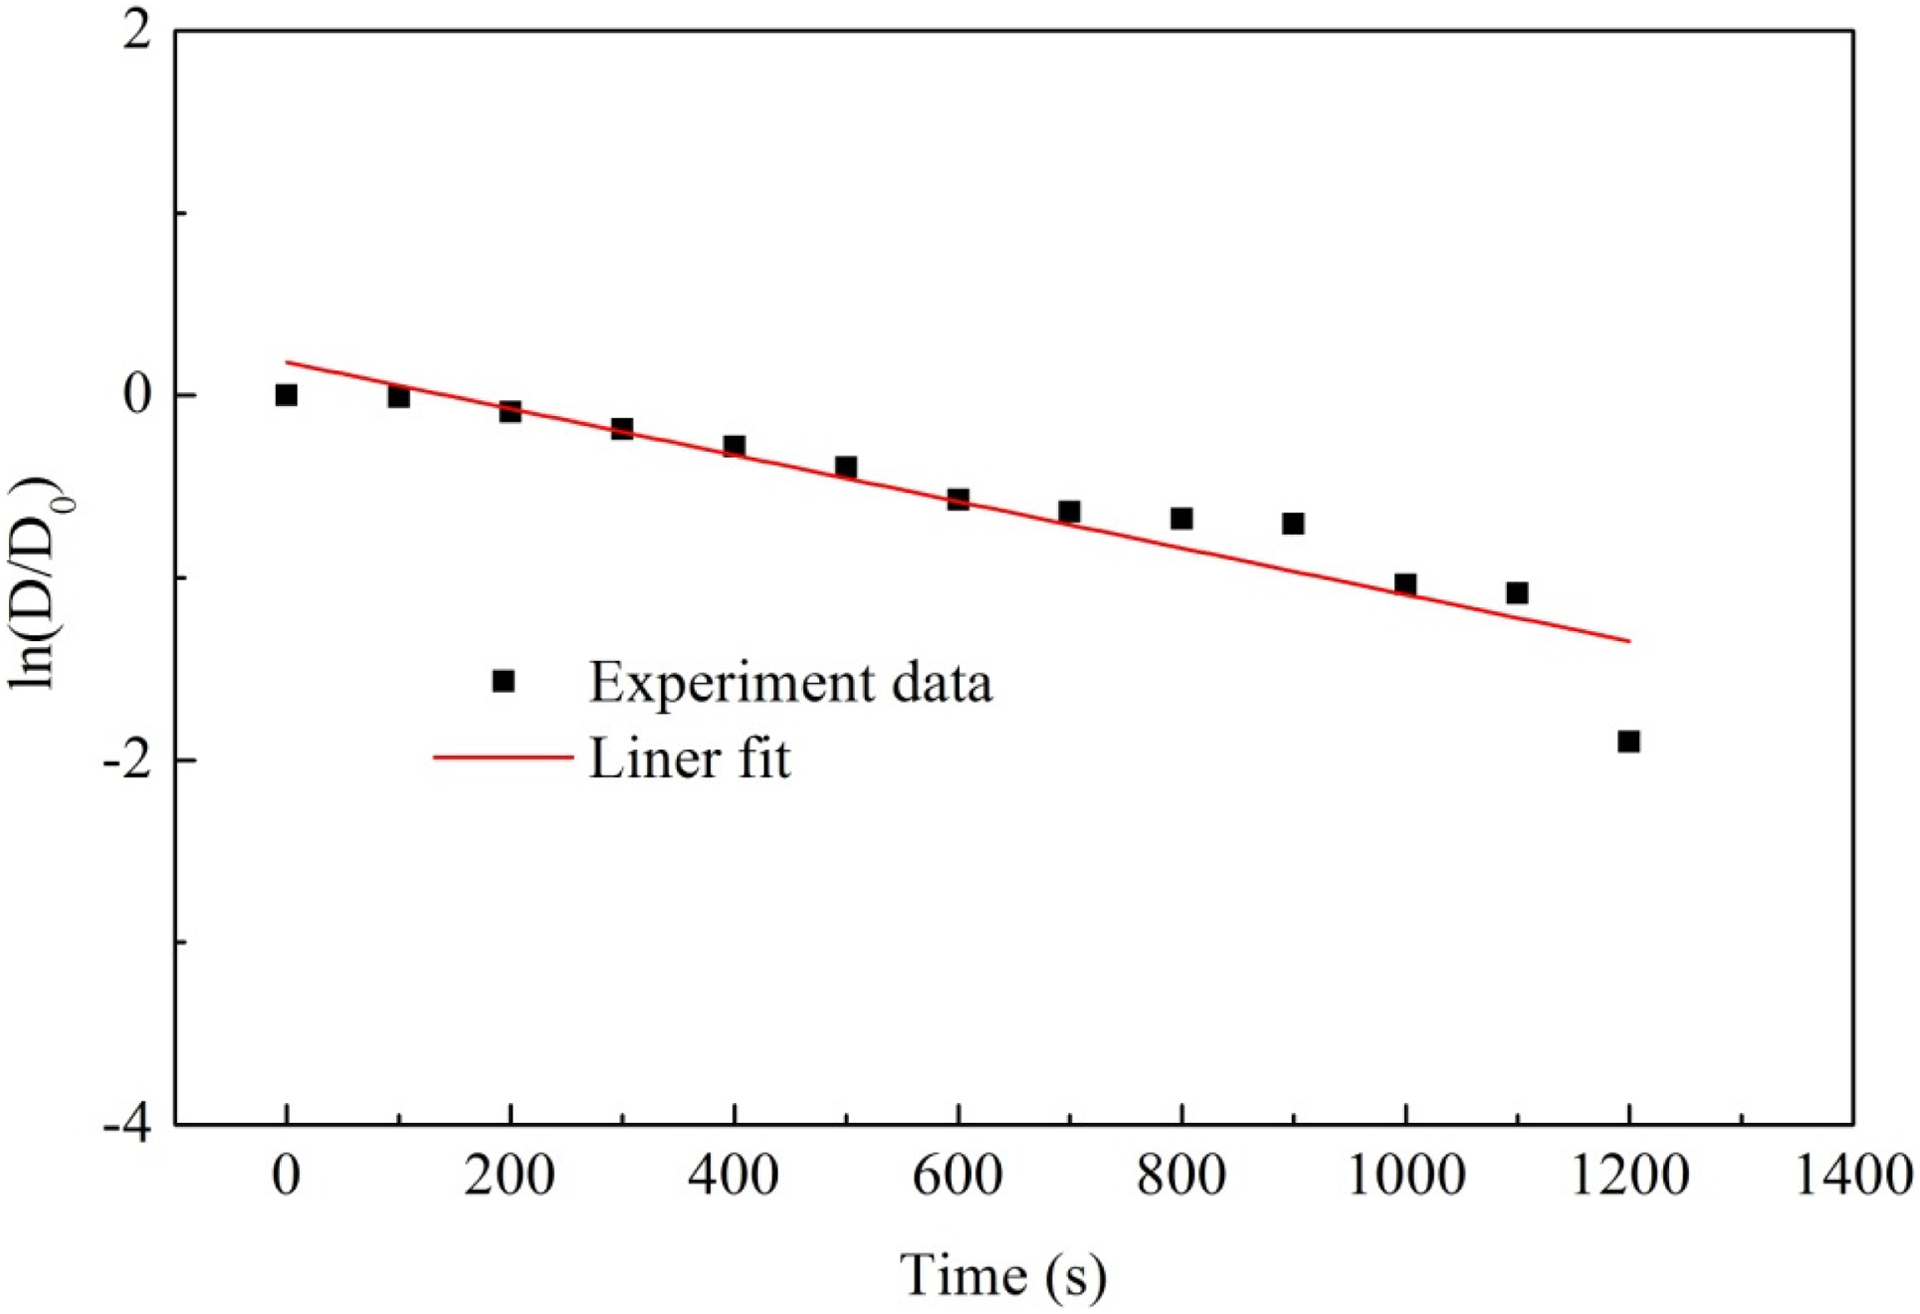
Time evolution of D/D 0 for PS1 droplet at 210°C. PS: polystyrene.
Effect of temperature on the interfacial tension of PS/PP
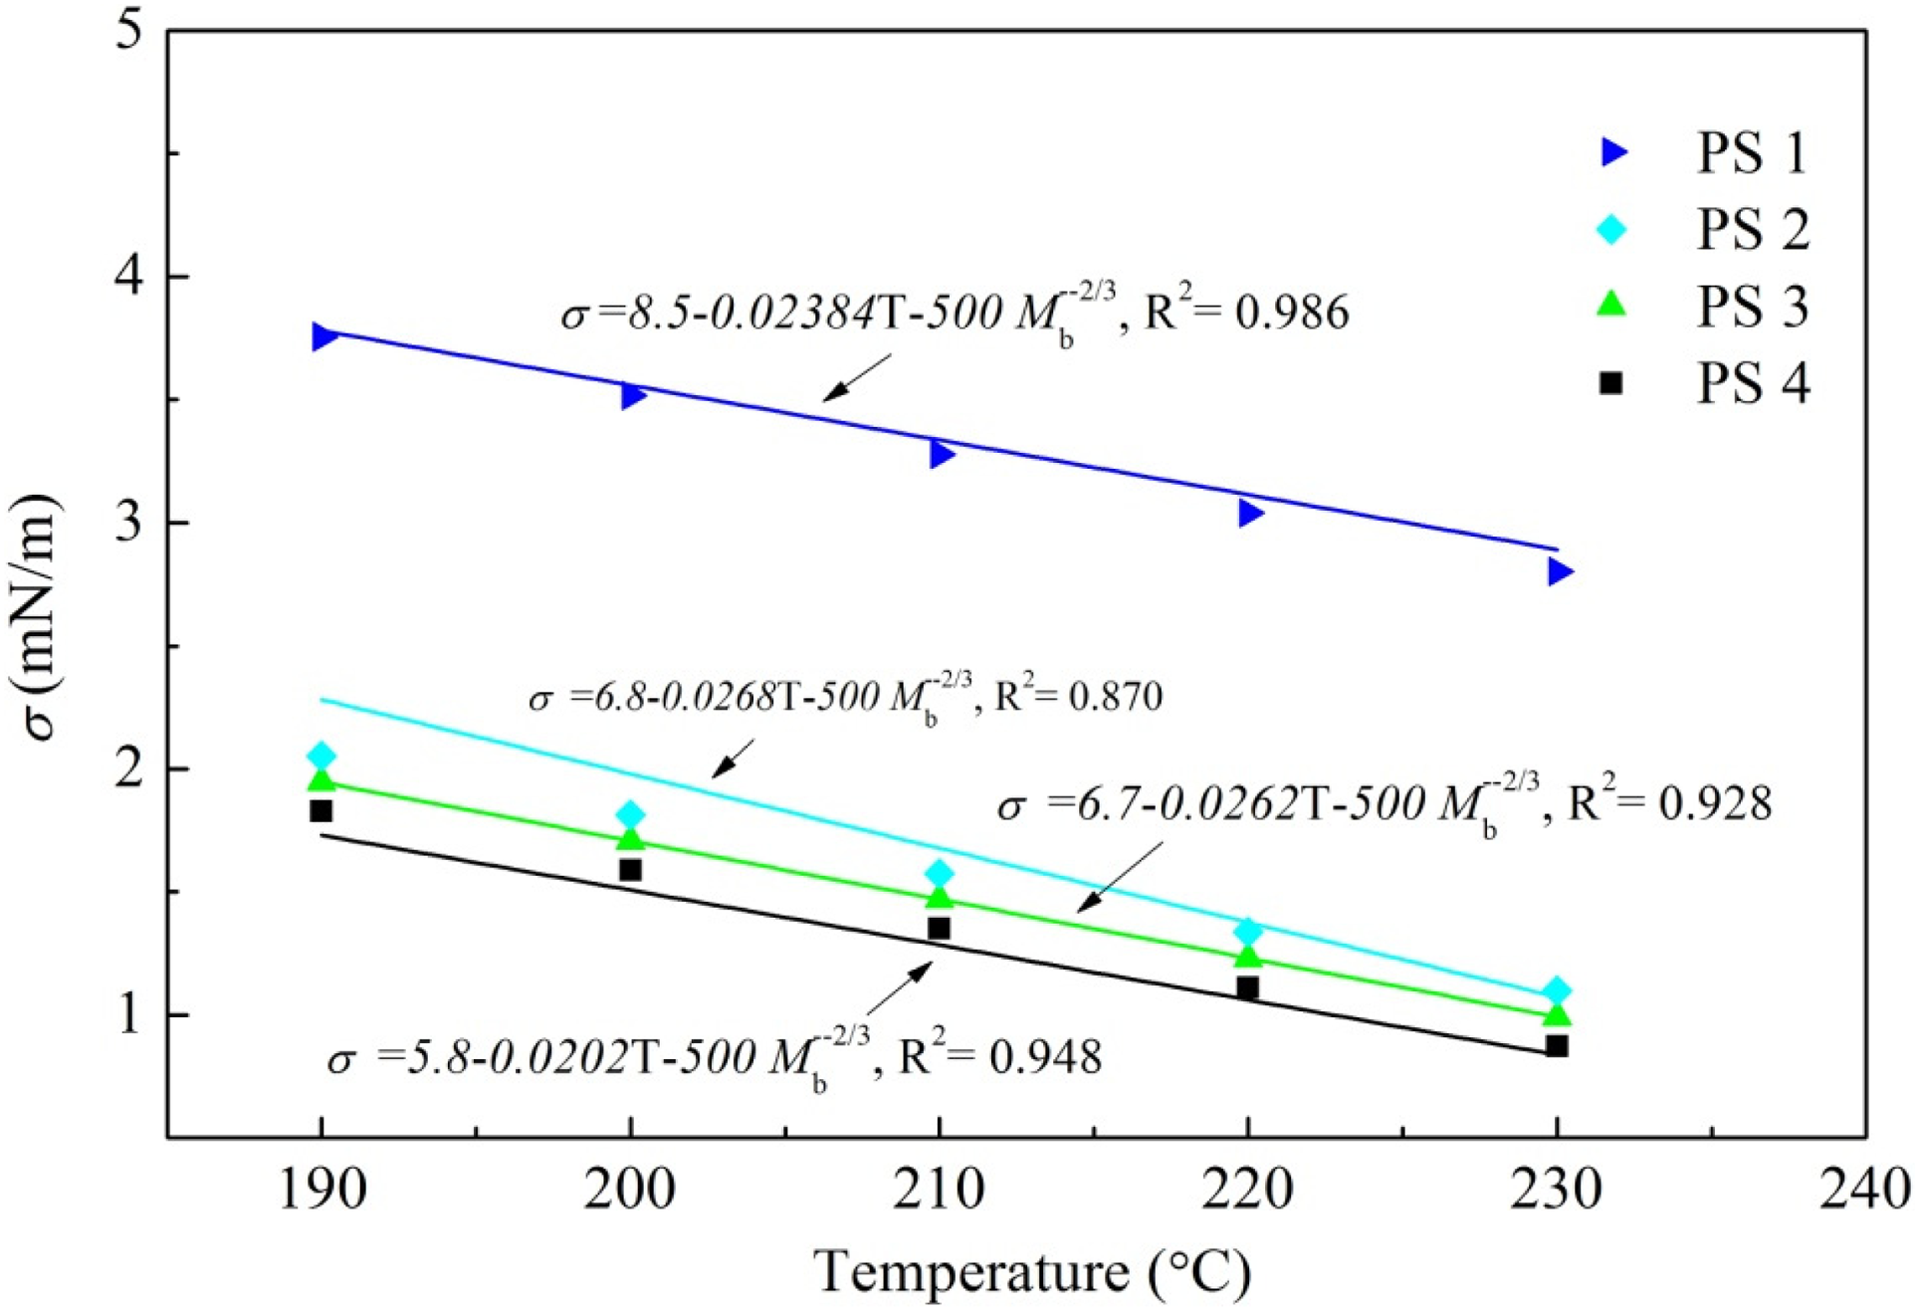
The measured interfacial tension between PP and PS with the different molecular weight of PS as a function of temperature is shown in Figure 7. The data of Kamal et al. 13 and Palmer and Demarquette 9,12 are also presented in Figure 7. Theoretically, an increase in temperature leads to a decrease in free energy of mixing, resulting in a decrease in the interfacial tension of polymer blends. For all the cases studied in this work, the interfacial tension of PS/PP decreases linearly with increasing temperature as shown in Figure 7. It is consistent with the general results obtained by other researchers. 9,12 –16
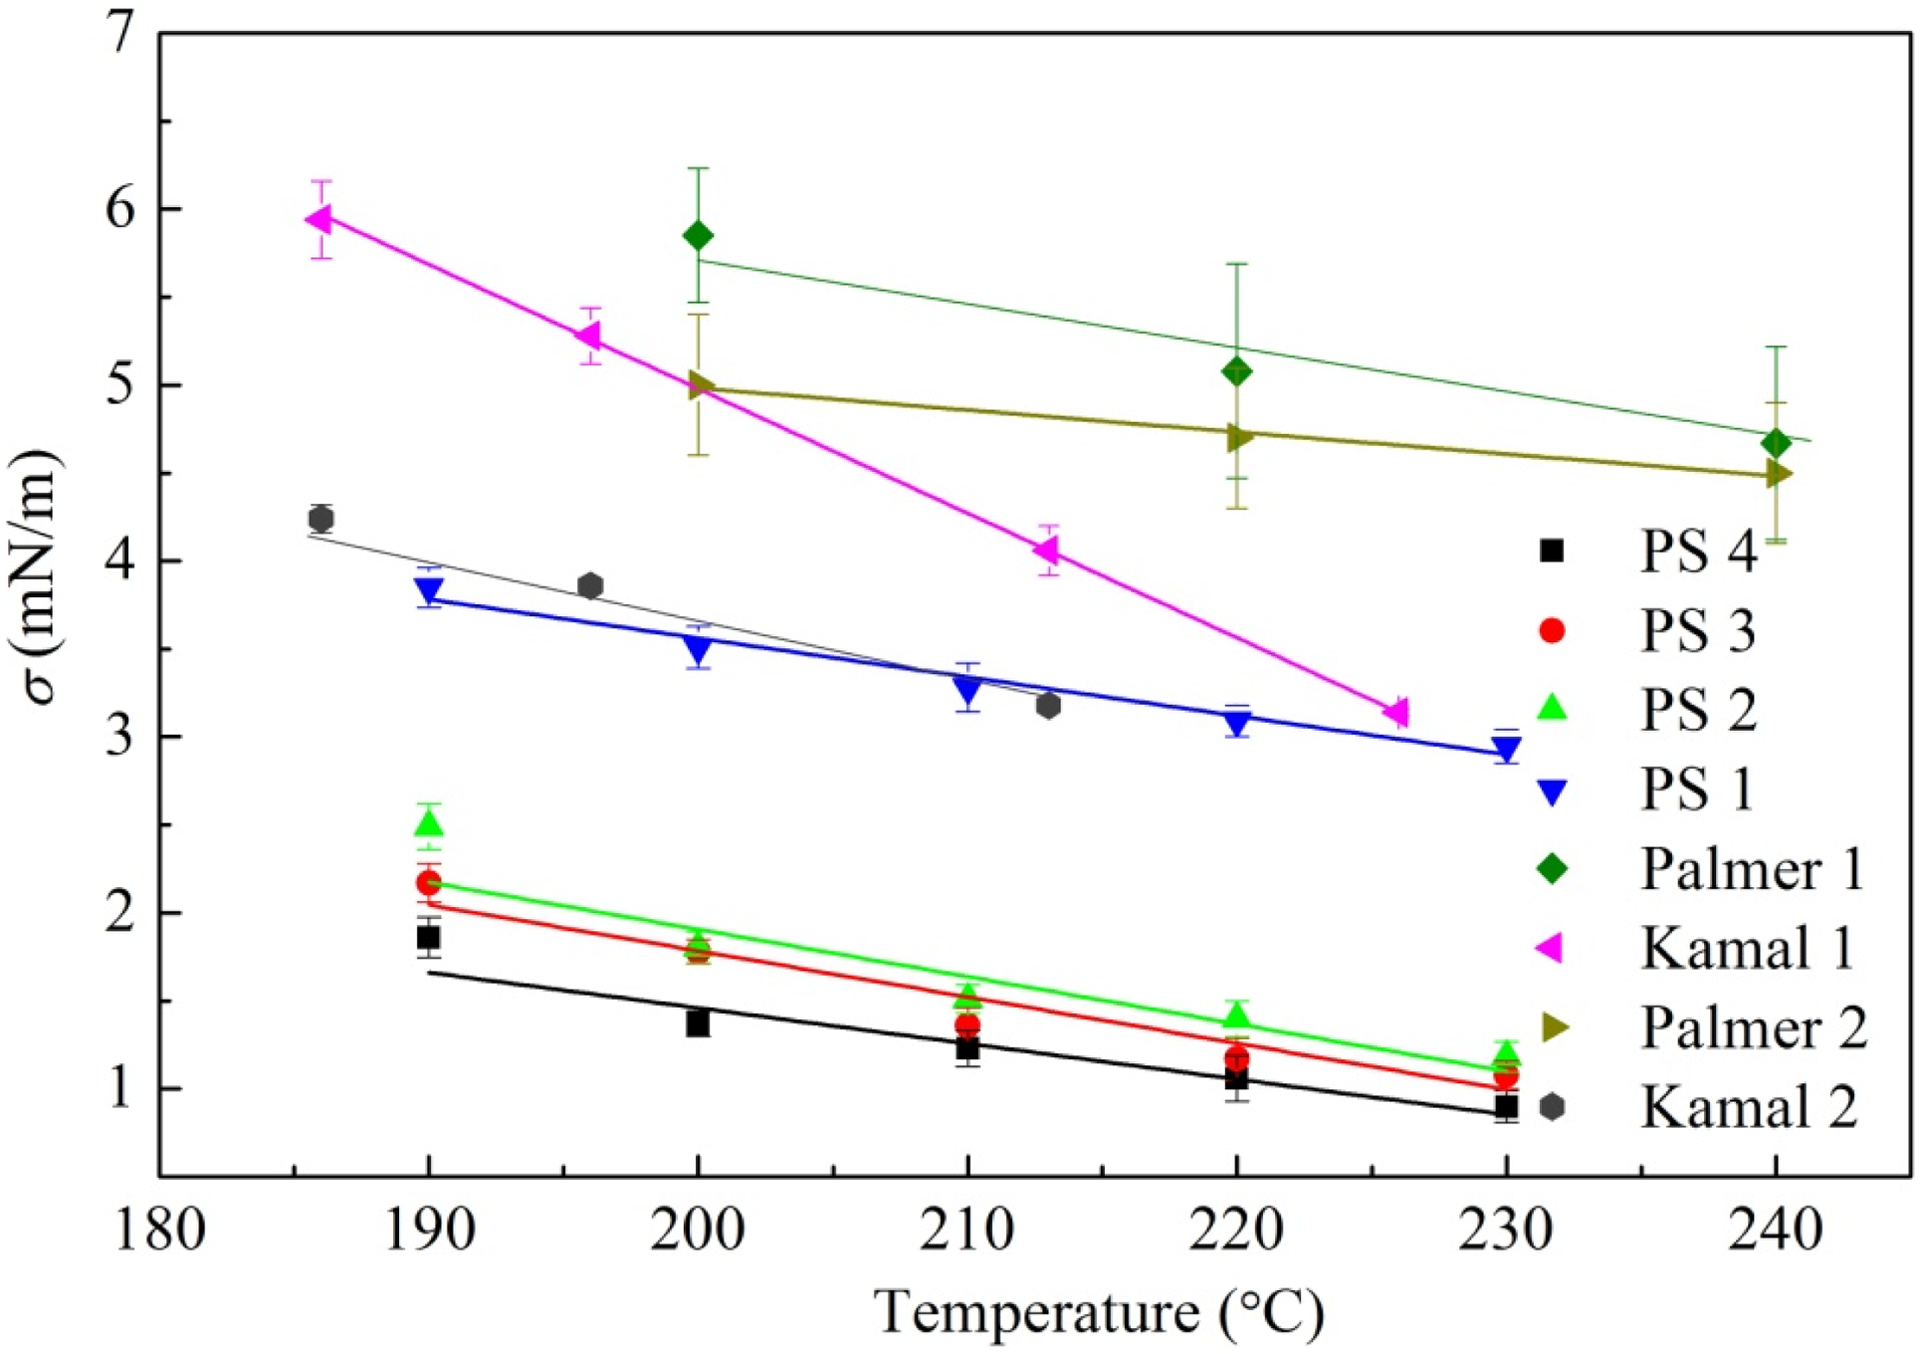
Interfacial tension of different PS/PP pairs as a function of temperature. PS: polystyrene; PP: polypropylene.
Effect of molecular weight on the interfacial tension of PS/PP
The temperature coefficients (dσ/dT) of four PS/PP pairs were obtained by fitting the curves in Figure 7. The results were compared with Palmer and Demarquette 9,12 and Kamal et al.’s 13 data as shown in Figure 8. The methods and materials used by Palmer and Kamal were listed in Table 2. However, the differences exist between the molecular weight, molecular weight distribution of polymers, and the measuring method they adopted. It is interesting to found that the temperature coefficients of PS/PP polymer pairs researched here are of the same order of magnitude as reported in the PS/PP systems with the low molecular weight distribution of PS. So, this gives us a possibility to quantify the effect of temperature and molecular weight on the interfacial tension of PS/PP blend.
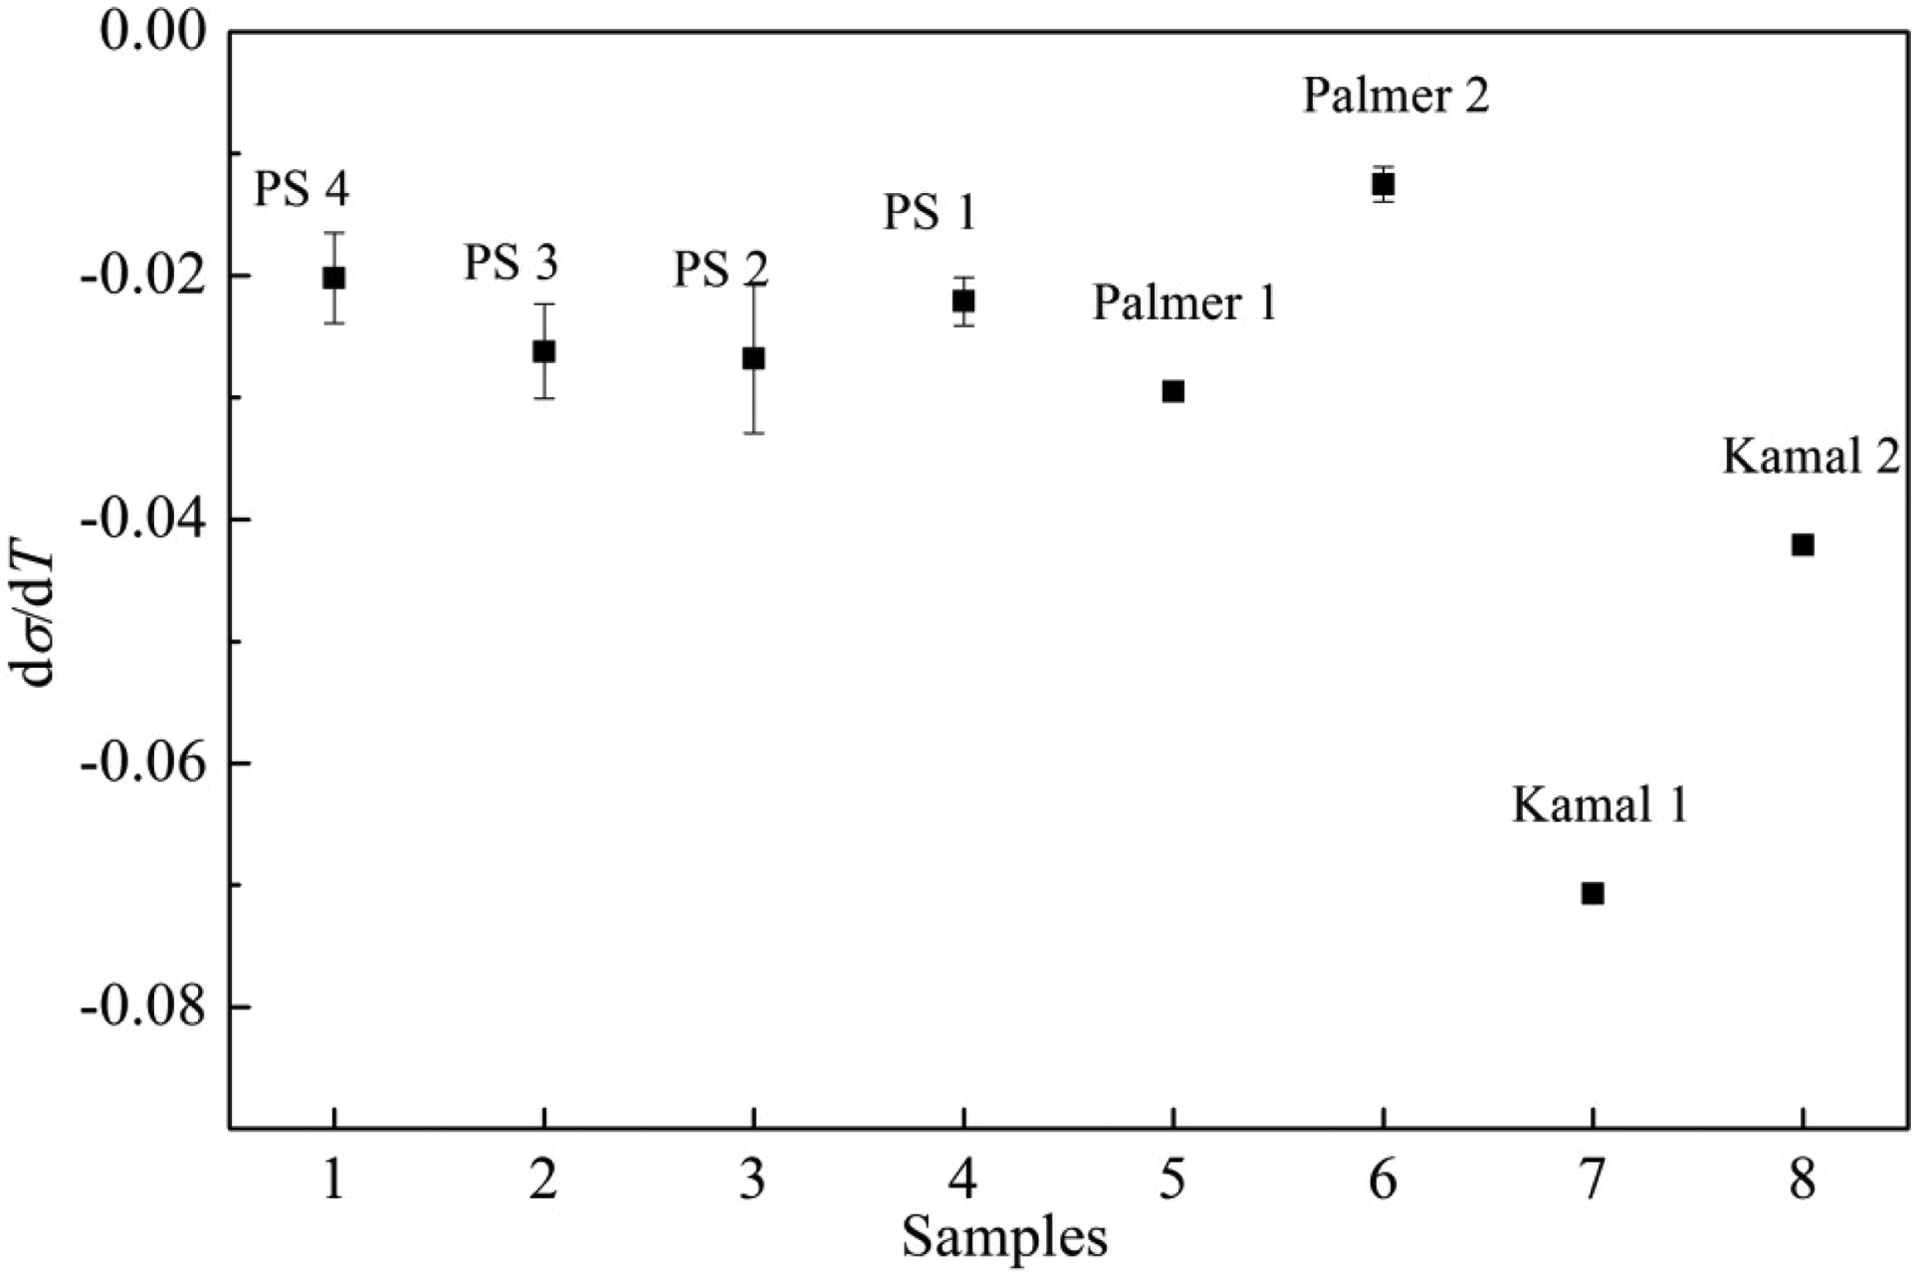
Temperature coefficient of different PS/PP pairs. PS: polystyrene; PP: polypropylene.
The methods and materials used by Palmer and Kamal.
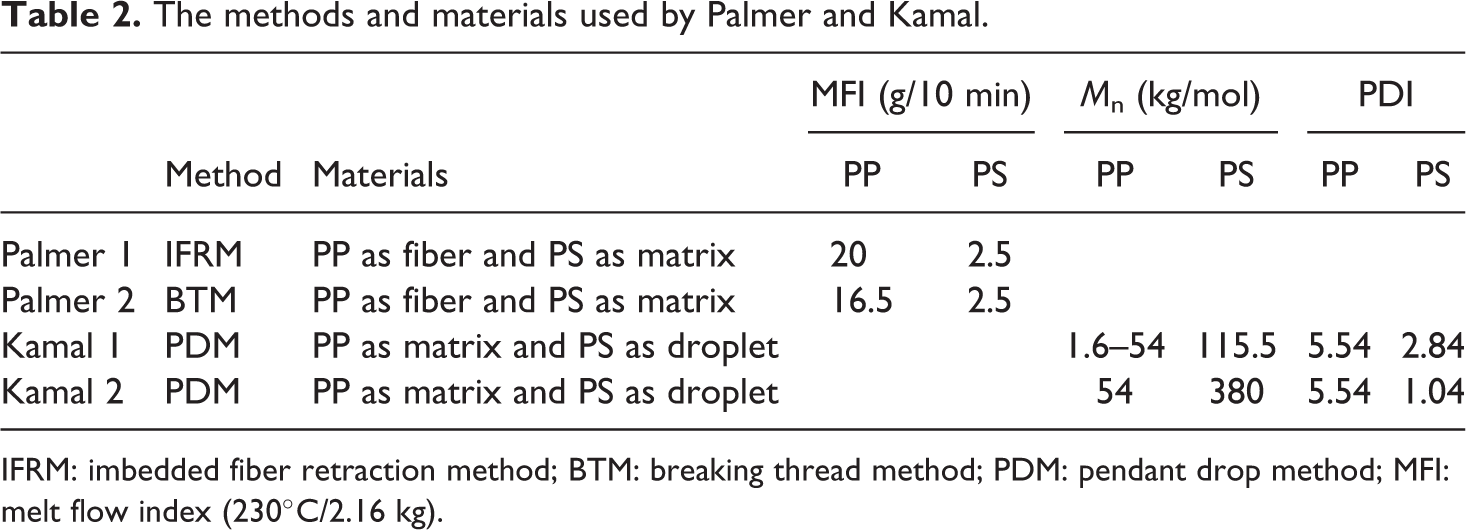
IFRM: imbedded fiber retraction method; BTM: breaking thread method; PDM: pendant drop method; MFI: melt flow index (230°C/2.16 kg).
Figure 7 shows that there is an increase in the interfacial tension of PS/PP pairs with the increase in the molecular weight of PS. However, the data were not enough to obtain the quantitative relation between interfacial tension and molecular weight in this work. Fortunately, many published literatures
13,17
–20
systematically studied the effect of molecular weight on the interfacial tension between polymers with a broad range of molecular weight. Literature reports show that the interfacial tension for polymer pairs increases as the molecular weight of one of the components increases, and the interfacial tension will be level off when the molecular weights of polymers are way above their entanglement molecular weight M
e. Welygan and Burns
21
report the W
e value of PS is 40 kg/mol. According to LeGrand and Gaines
22
and Kamal et al.’s
13
studies, the effect of molecular weight on interfacial tension follows the
The combined effect of temperature and molecular weight on the interfacial tension of PS/PP polymer blends could be represented as

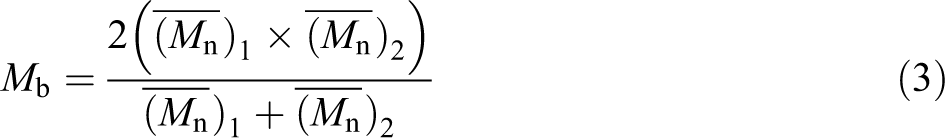
where Mb is the combined molecular weight and C 1, C 2, and C 3 are adjustable constants. C 2 = −dσ/dT, C 3=500, 22 and z = −2/3.
C 1 was obtained by linear regression (Figure 9) as well as the other coefficients in equation (2). It is seen that equation (2) could describe the interfacial tension of PS/PP blends well at different temperatures and molecular weights. However, we cannot obtain a general equation (2) for all PS/PP systems. This also gives us a possibility to quantify the effect of interfacial tension on the morphology during the process of polymer blend in nonisothermal flow field.
Simulation of interfacial tension for PS/PP blends. PS: polystyrene; PP: polypropylene.
Conclusions
The interfacial tension of PS/PP blends, using four different molecular weights PS and one single PP, was evaluated at different temperatures with DDRM. The residual internal stress was eliminated after long times anneal treatment. The apparent dimensionless volumes almost maintain at the value of 1 in the selected scale of D0 ≅ 0.15. Results show that the interfacial tension of PS/PP blends decreased linearly with increasing temperature. Temperature coefficients of PS/PP blends researched here are of the same order of magnitude as reported in the PS/PP systems in the case of the low molecular weight distribution of PS. A primary quantitative relation between interfacial tension, temperature, and molecular weight was established.
Footnotes
Acknowledgement
The authors would like to thank the National Key Research and Development Program of China for financial support.
Declaration of Conflicting Interests
The author(s) declared no potential conflicts of interest with respect to the research, authorship, and/or publication of this article.
Funding
The author(s) disclosed receipt of the following financial support for the research, authorship, and/or publication of this article: This work was supported by the National Key Research and Development Program of China (2016YFB0302602).