
Abstract
Polypropylene (PP)/polyolefin elastomer (POE; ethylene–octene copolymer) blends with varying weight percentages of POE were prepared in a twin-screw extruder and molded through high shear rate injection-molding process. The morphologies and rheology of the PP/POE blends were systematically investigated based on rheological data and experimental analysis. The results indicate that the polymer blends of plastic and rubber in a high shear stress field result in a multilayered microstructure, which can be divided into skin, transitional, shear, and core layers according to the morphology of the dispersed phase. The morphology formation of the dispersed phase depends on the shear field and temperature field in the processing. Morphological evolution of the dispersed POE phases in PP matrix was described and quantified. A dragging ellipsoid model and capillary number were employed to describe the morphological evolution of the dispersed phase, and the morphological parameters were obtained. The results show that the dragging ellipsoid model is well suited to explain the morphological evolution of the dispersed phase in polymer blends molded under high shear rate.
Keywords
Introduction
Strength and toughness are two important mechanical parameters for plastic products used as a mechanical structure part. A high-performance polymer material should possess high strength and toughness simultaneously. Isotactic polypropylene (PP) is a versatile commercial thermoplastic with good stiffness, low density, easy processing, and low cost. However, its notch sensitive and poor impact resistance under severe conditions, such as at low temperatures and high impact rates, limits its use in engineering fields. 1 Ethylene/α-olefin copolymers, such as polyolefin elastomers (POEs), have been widely used to toughen the PP matrix due to their pellet form and the partial compatibility with PP; this allows for faster mixing, broader handling, and blending options. 2 –5 In the past decade, the phase morphology, rheology, and thermal and mechanical properties of PP/POE blends were studied. 3,4,6 –10 Recently, the author investigated their crystallization and crystalline structure. 2,6,7 Svoboda et al. 11 studied the PP crystallization kinetics behaviors in PP/POE blends by transmission electron microscopy, optical microscopy, and differential scanning calorimetry. It is well known that mechanical properties of plastic products depend not only on the properties of the materials themselves but also on the microstructure. 12 –15 Since the microstructure of plastic products is formed under complex forces and temperature fields, 16 the quality of plastic products is mostly controlled by its processing experience. Therefore, an efficient method to improve the quality of plastic products is needed and should be based on scientific analysis of the molding process. Zuev et al. 17 investigated the morphology of the multilayered structure from extrusion-molded PP/PEO blends. Li et al. 18 studied the hierarchy structure of injection-molded PP/POE blends under various processing conditions such as barrel temperature, injection rate, and mold temperature.
The rheology of polymer provides an efficient way to understand the complicated polymer processing. 19 Lee and Han 16 investigated the morphology evolution of polymer blends including polystyrene (PS)/poly(methyl methacrylate), PS/polycarbonate, PS/high-density polyethylene, and PS/PP blends during compounding in an internal mixer and a twin-screw extruder. Injection molding is a dominant processing technique for plastic products. To the best of our knowledge, the morphology of injection-molded PP/POE blends based on rheology and its model has not been studied quantificationally. In the work, PP/POE blends with 25 wt% of POE were prepared by a twin-screw extruder and molded by injection molding. Cryo-fractured specimens were taken from various positions along the injection bar both in parallel and vertical to the flow direction for morphological observation, respectively. The morphological evolution of the dispersed phases in the PP/POE blends was systematically investigated based on the combination of rheological and experimental analysis. This work attempts to provide a basic theory to adjust the morphology of PP/POE blends with high performance through controlling the temperature field and shear stress field.
Experimental section
Materials and sample preparation
Isotactic PP (T36f) with a melt flow rate of 3.5 g/10 min (2.16 kg, 230°C) and a density of 0.903 g cm−3 was supplied by Wuhan Petrochemical Co. Ltd, China. The molecular weight distribution Mw /Mn is 12, and the average molecular weight is 260,000 g mol−1. POE (EG8150, a metallocene-catalyzed copolymer of ethylene and 1-octene with 25 wt% comonomer) was obtained from Du Pont Dow Elastomers Co. Ltd. (Texas, USA); its melt flow rate is 1.0 g/10 min (2.16 kg, 230°C) and the density is 0.886 g cm−3. The PP/POE blends were prepared (with 25 wt% of POE) through melt compounding of PP and POE in a twin-screw extruder, which is connected to a torque rheometer (Rheocord 90; Haake Co., Germany) at a screw speed of 50 r min−1. The barrel temperature profile from the feeding zone to the extruding zone was set to 190°C, 210°C, 220°C, and 220°C. The extrudates were palletized and dried. Then, the PP/POE blends were injection molded into rectangle bars in a high shear stress field, with dimensions of 80 × 10 × 4 mm3, using an injection-molding machine (XS-ZY-125; Zhejiang Plastics Machinery Co. Ltd, China). A comparison sample was taken out from the barrel section, in which the shear rate is very small. The barrel temperature profile was set at 195°C, 215°C, and 225°C, and the nozzle temperature was 200°C. The injection pressure, mold temperature, and cooling time were set to 110 MPa, 40°C, and 60 s, respectively. The interfacial tension between PP (75 wt%) and POE (25 wt%) is 0.56 dyn cm−1 at 200°C. 20
Scanning electron microscopy
To be able to study the morphology of the PP/POE blends by scanning electron microscopy (SEM), cryo-fractured specimens were taken out from different regions of the injection-molded bar, that is, the middle and end positions of the rectangle bar along the direction parallel and vertical to the injection flow direction, respectively, as shown in Figure 1.
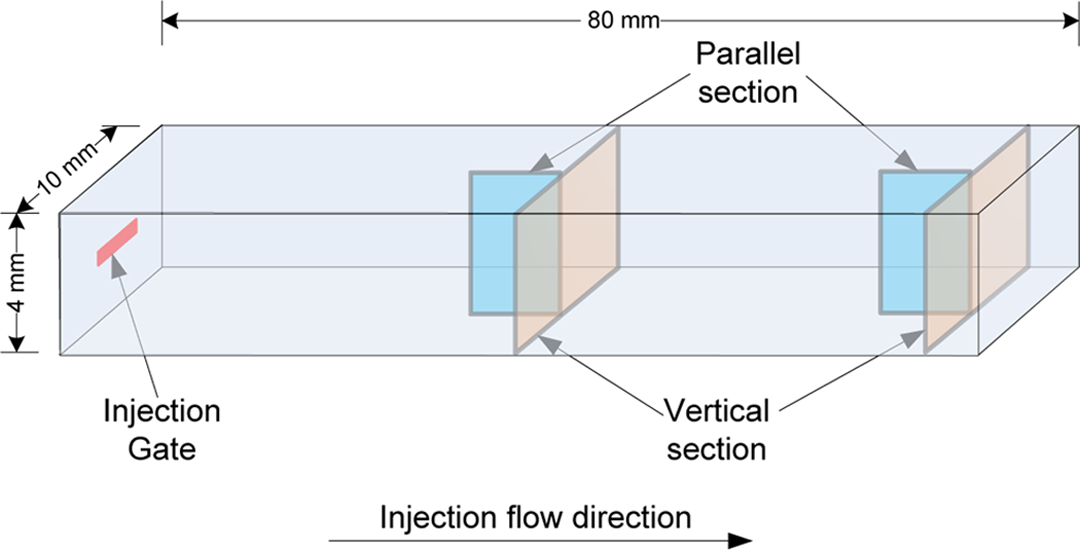
Schematic illustration of the location specimens taken for SEM observation in an injection-molded rectangle bar. SEM: scanning electron microscopy.
The cryo-fractured surfaces of the specimens were etched by n-heptane assisted by ultrasound at a temperature 60°C for 48 h to remove the POE phase. After being dried for 24 h, the surfaces of the specimens were coated with a thin layer of gold for observation under a SEM (Quanta 200; FEI Co., the Netherland). The accelerating voltage of the SEM was set to 12.5 kV. The distances between the observed point and surface were recorded during the SEM observation. The gray level and binary processing of the SEM images were performed to obtain statistic morphology parameters for each layer; the SCION image analysis software (ver. 4.0, Scion Corporation) and a Visual FoxPro program were used to perform the statistic calculation of the morphology.
Rheological measurement
A high-pressure double tube capillary rheometer (RH7D; Bohlin Co., UK) was used to measure the rheological properties of PP, POE, and PP/POE blends melts. The diameter and length–diameter ratio of the capillary were l mm and 16: l, respectively. The test temperature was 190°C, 210°C, and 230°C and the shear rate was varied from 20 s−1 to 10,000 s−1. For double tube capillary rheometer, no Bagley correction was required, but Rabinowitch correction was applied to the experimental data. 19
Results and discussion
The deformation and orientation of the dispersed phases in a matrix under shear fields can be described by a Dragging ellipsoidal model 21,22 as described in Figure 2, where the x-axis is the direction of shear flow, L and B are the long and short axis of the ellipsoid, respectively, and the orientation angle (θ) is an angle between the long axis direction and flow direction.
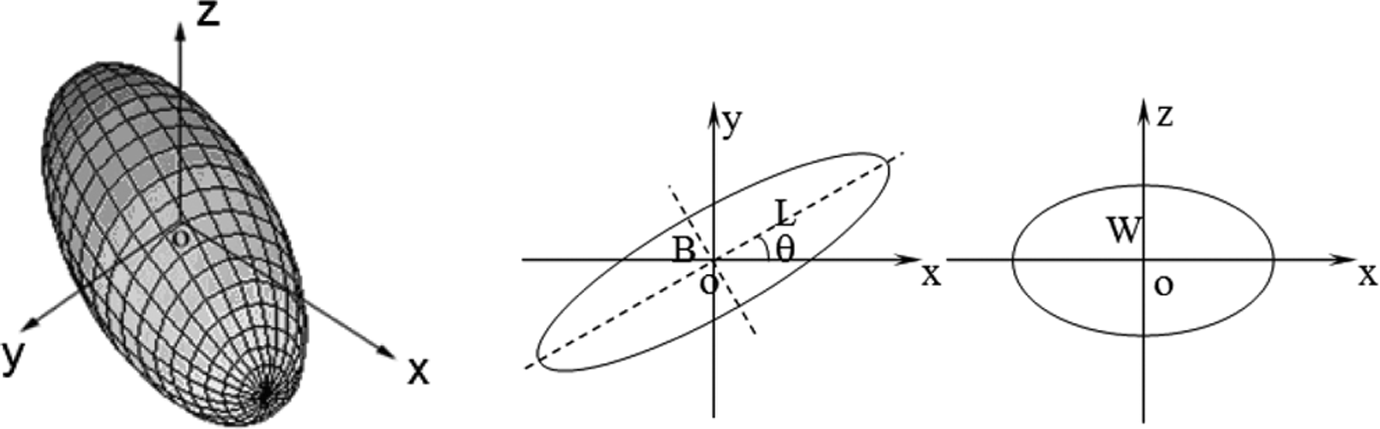
Dragging ellipsoid model scheme of dispersed phase particle in a shear stress field.
The deformation of the dispersed phase can be described by the deformation degree (D), which is defined as
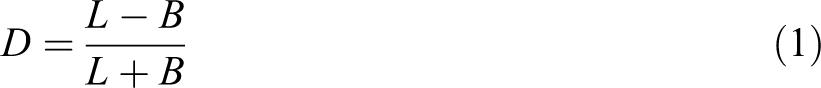
Considering the interactions between the matrix and the dispersed phases, the deformation degree is

And the orientation angle θ can be written as follows:
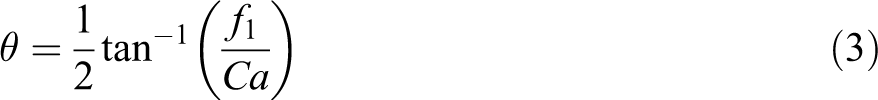
where f 1 and f 2 are the factors related to viscosity (and interfacial viscosity) ratio of the dispersed phase and the matrix and Ca is the capillary number, which is defined as follows:
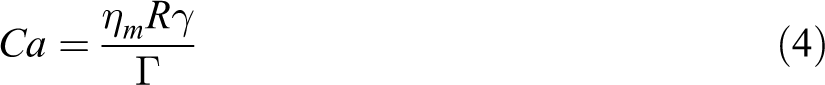
where ηm is the viscosity of the matrix, R is the radius of droplet before shearing, γ is shear rate, and Γ is interfacial tension. And dispersed phase droplets will vary with the following conditions:
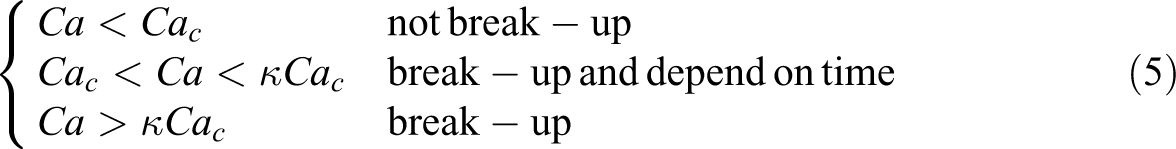
where κ is equal to 2 or 5.
Without shear stress field, the dispersed phases in the matrix will not be deformed and have no change in orientation. For example, a PP/POE blend specimen was taken from a barrel section close to the injection nozzle when the screw stopped, where the shear rate is 0 and temperature is even. The morphology of the POE phases and the particle size distributions in the specimen are shown in Figure 3. It can be seen that the morphologies of the POE phases exhibit sphere-like shapes because the shear rate on the fluid is zero.
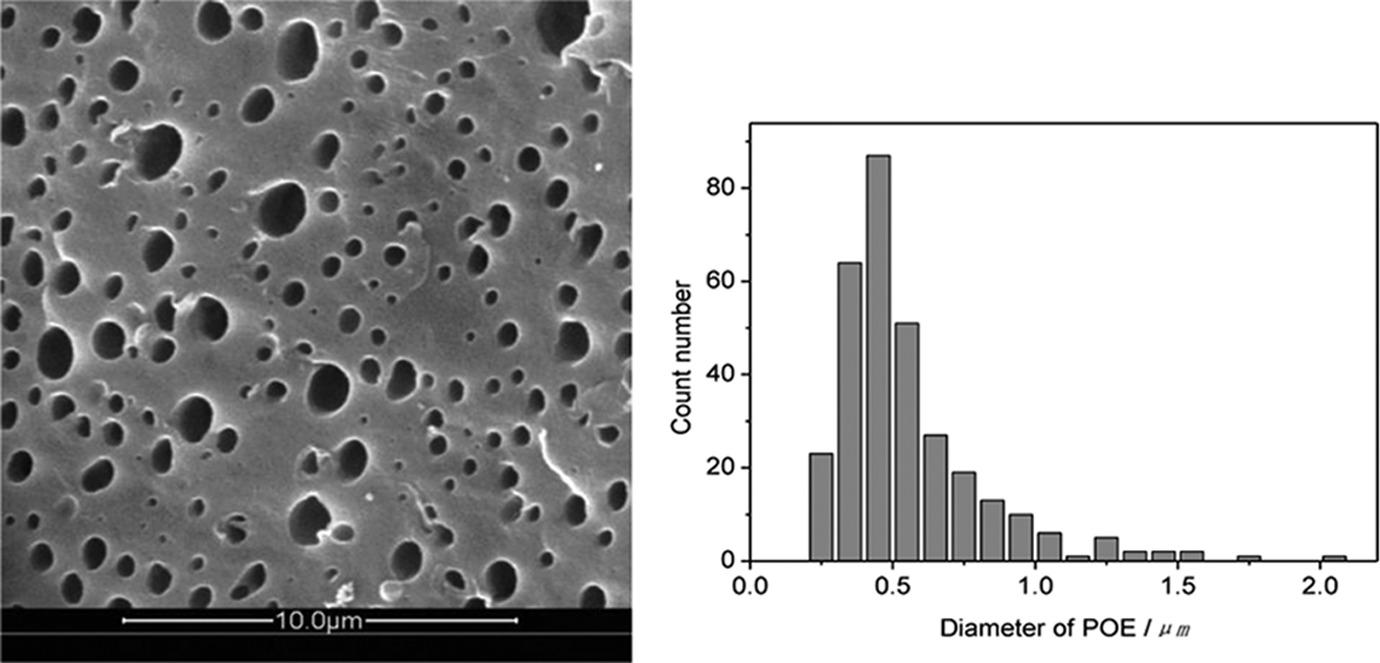
The initial morphology and particle size distribution of the POE phase in the 25 wt% PP/POE blend before injection into a mold (shear rate = 0 and the temperature of the nozzle is 200°C).
Figure 4 is the SEM panorama image of the cryo-fractured surface parallel to the injection flow direction in the middle region of the PP/POE blend molded bar. There exist multilayered structures in the injection-molded sample according to the morphologies of POE in the PP matrix. In this work, skin, transition, shear, and core layers from the surface to the center of the injection-molded bar are defined according to various dispersed phase morphology. The multilayered structure was formed from skin to the core of the specimen caused by temperature gradient and shear gradient applied during the injection process. The panorama of the parallel section shows the 1.5 mm region from surface to core. From the figure, various flow field morphologies can be observed on the specimen. According to the morphologies of the POE dispersed phases in the PP matrix, the approximate thickness of each layer was determined to be: skin layer is 0.025–0.05 mm, transitional layer is 0.05–0.1 mm, shear layer is 0.75–2 mm, and core layer is 1–1.6 mm. These values depend on the thickness of the product and processing condition such as melt temperature, injection rate, and the temperature of mold. To study the details of the morphological evolution of the dispersed phases, SEM observations were performed from thickness direction of the injection specimen on the direction parallel and perpendicular/vertical to the flow direction, respectively.
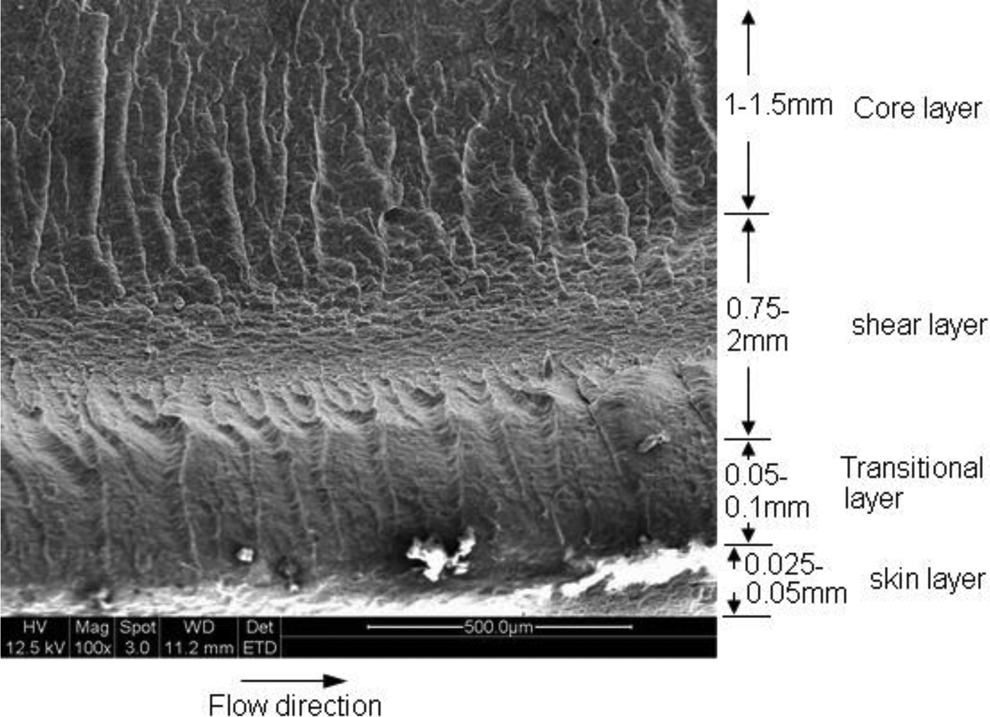
SEM image of the cryo-fractured surface parallel to injection flow in the middle of an injection-molded rectangular bar, 25 wt% PP/POE. SEM: scanning electron microscopy; PP: polypropylene; POE: polyolefin elastomer.
Morphology of POE phases in the middle region of injection-molded bar
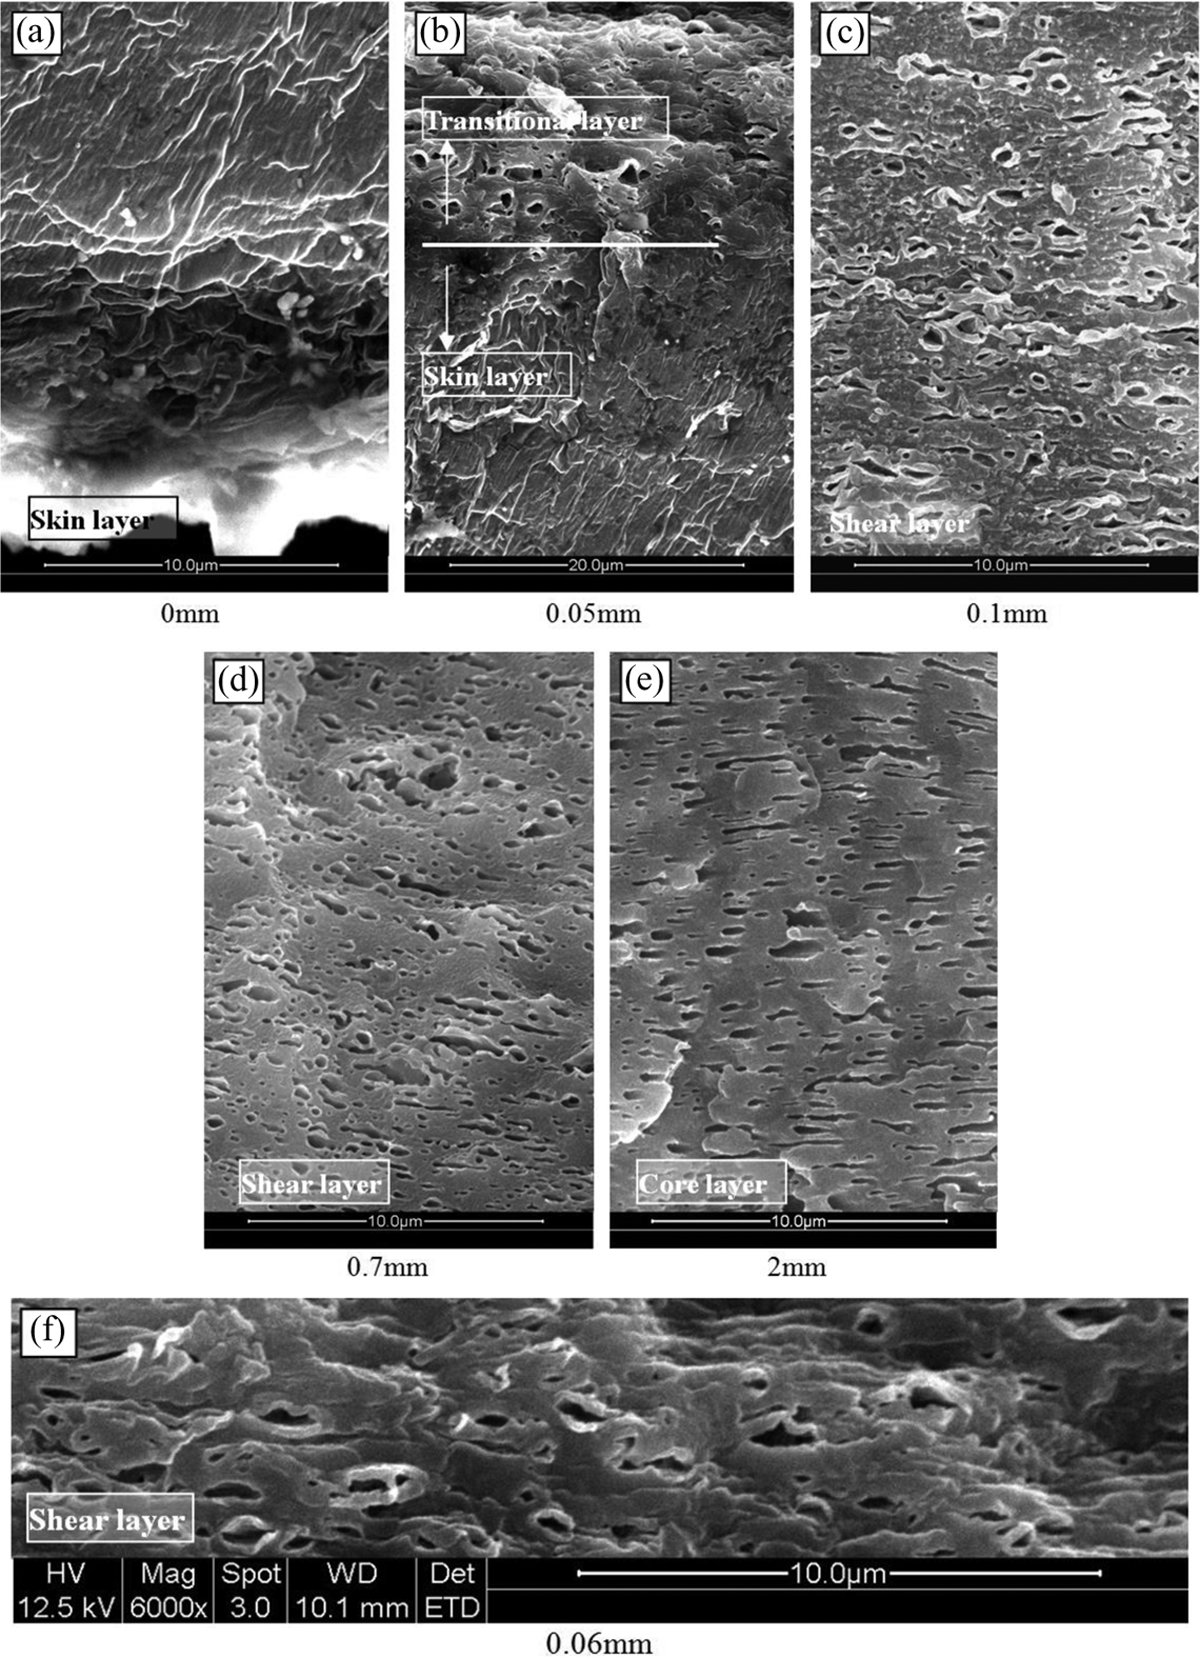
Figure 5 shows the SEM micrograph of each layer of the middle region of the specimen paralleling to flow direction. Figure 5(a) is the skin layer with a thickness of 0.05 mm, in which there is no POE phase observed. This observation is supported by Karger-Kocsis and Csikai 23 ; here, no rubber phase was found in a specimen taken from PP/EPDM injection molding. The reasons behind this phenomenon are as follows:
In the view of crystallography dynamics, when the skin layer of melted polymer comes into direct contact with the cold mold surface, the crystallization rate of PP becomes very fast; thus, the rubber phases are pushed out from the PP crystal lattice. 24
On the other hand, from the perspective of the rheology, the mold cavity can be regarded as a fluid tube; the low viscosity component tends to gather at the skin. Cheng 25 experimented with non-Newtonian fluid as medium and found that the directions of suspended particles move are decided by the relative effects between elastic behavior and shear shinning behavior of the medium when the spherical particle suspension flows in a pipe. Under the effect of the fluid elasticity, first normal stress forms a push force perpendicular to the flow field direction in the fluid, making the particles move from high shear zone to low shear zone, then, the particles will tend to central axis direction when the suspension flows in a pipe. On the contrary, the effect of shear thinning behavior will push particles from low to high shear zone. When the fluid with both elastic behavior and high shear thinning behavior flows as Poiseuille flow, which driven by the pressure drop, the particles will move to the wall, but does not come into contact with the pipe wall.
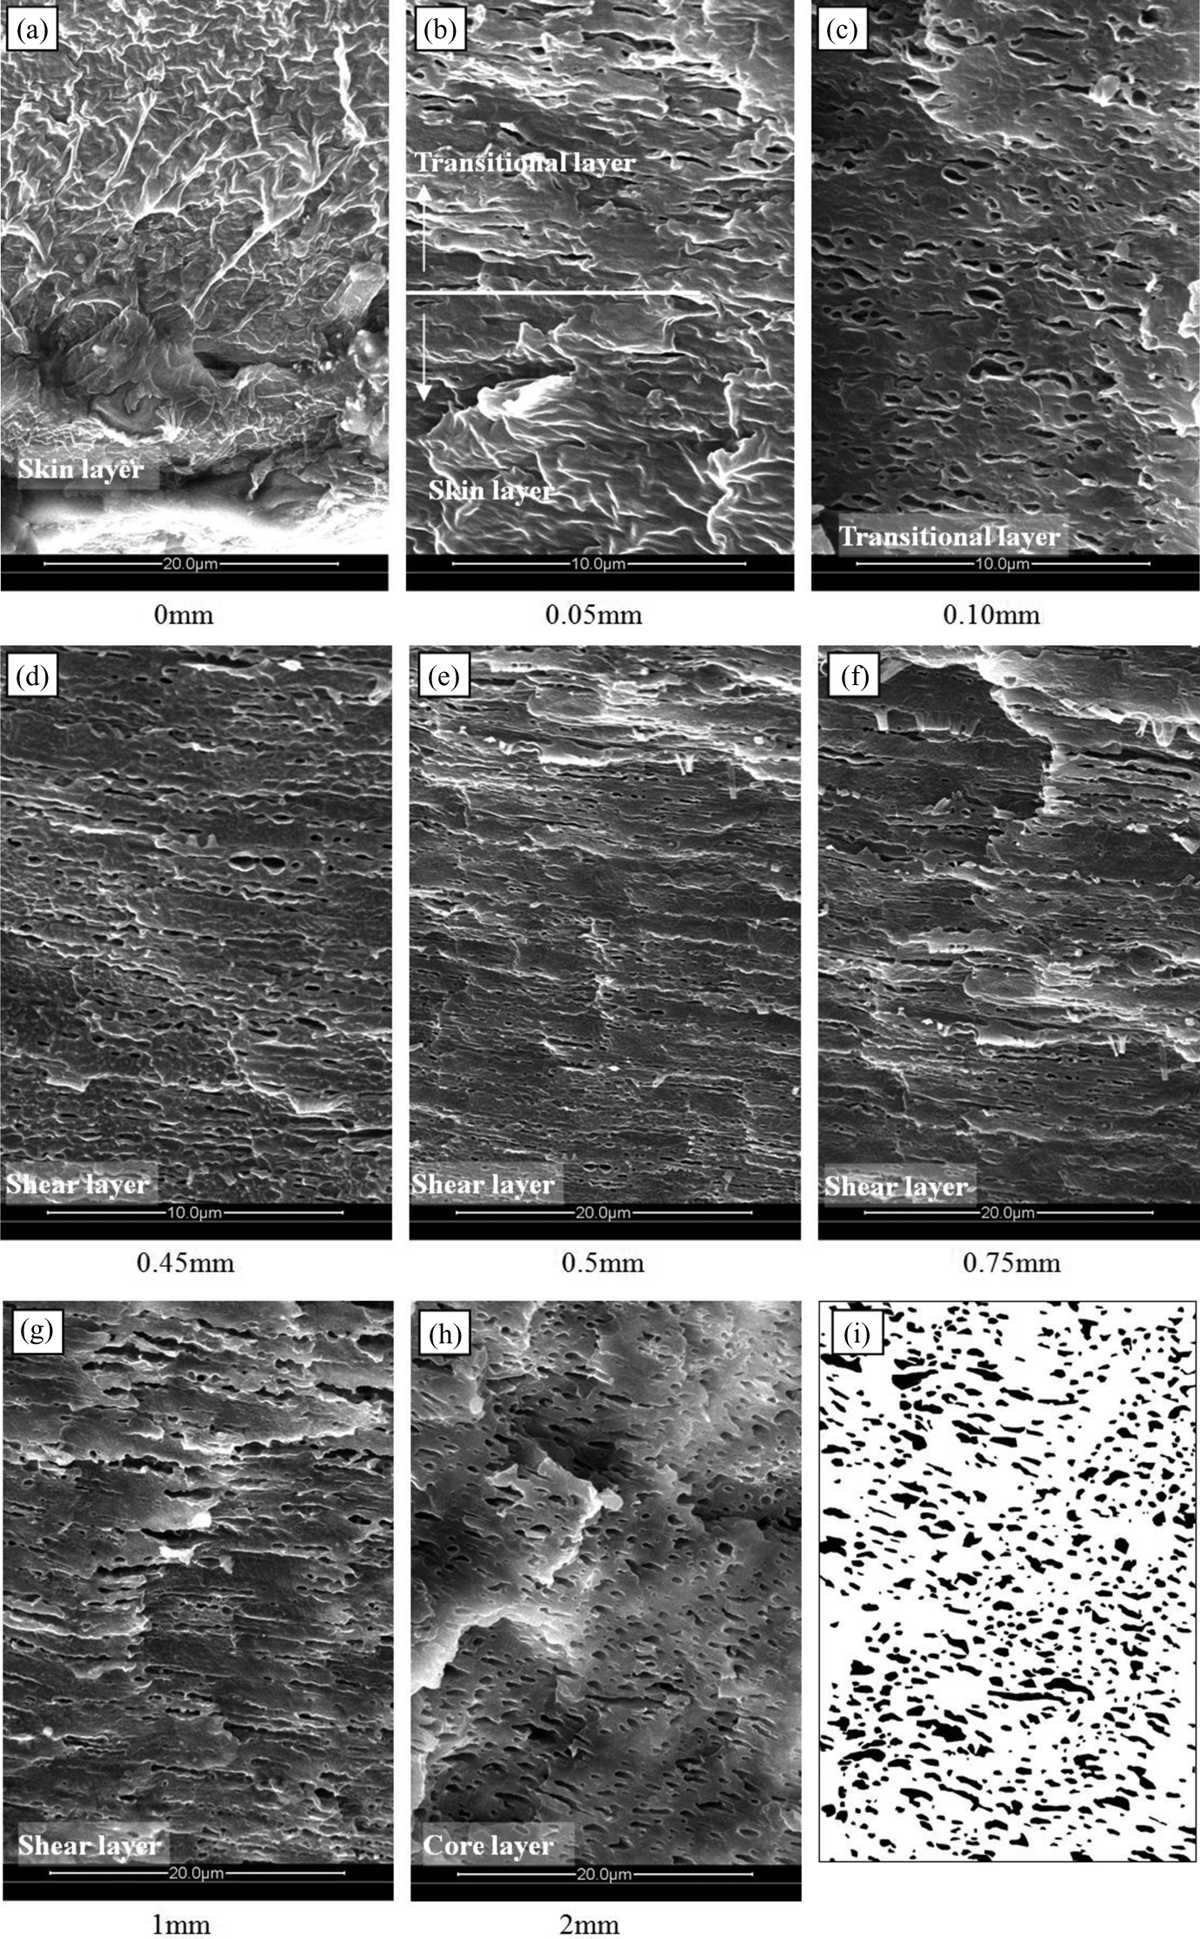
SEM micrographs of various layers parallel to the flow direction in the middle region of an injection-molded bar (the number below the image is the distance of micrograph section to skin; (i) binary image of the core layer (h) after gray level and binary treatment), 25 wt% PP/POE. SEM: scanning electron microscopy; PP: polypropylene; POE: polyolefin elastomer.
The deformation degree and orientation angle can be calculated via equations (1) to (4). In order to describe the morphology of the dispersed phase, the radius of an equivalent sphere (Re ) is defined. The equivalent sphere has the same volume as dispersed phase ellipsoid droplet after shearing. Re is the average value of long axis (L) and short axis (B) of the dispersed phase ellipsoid. The values of Re , D, and θ were calculated and tabulated in Table 1.
The dispersed phase morphological parameters at different layers of the injection sample.
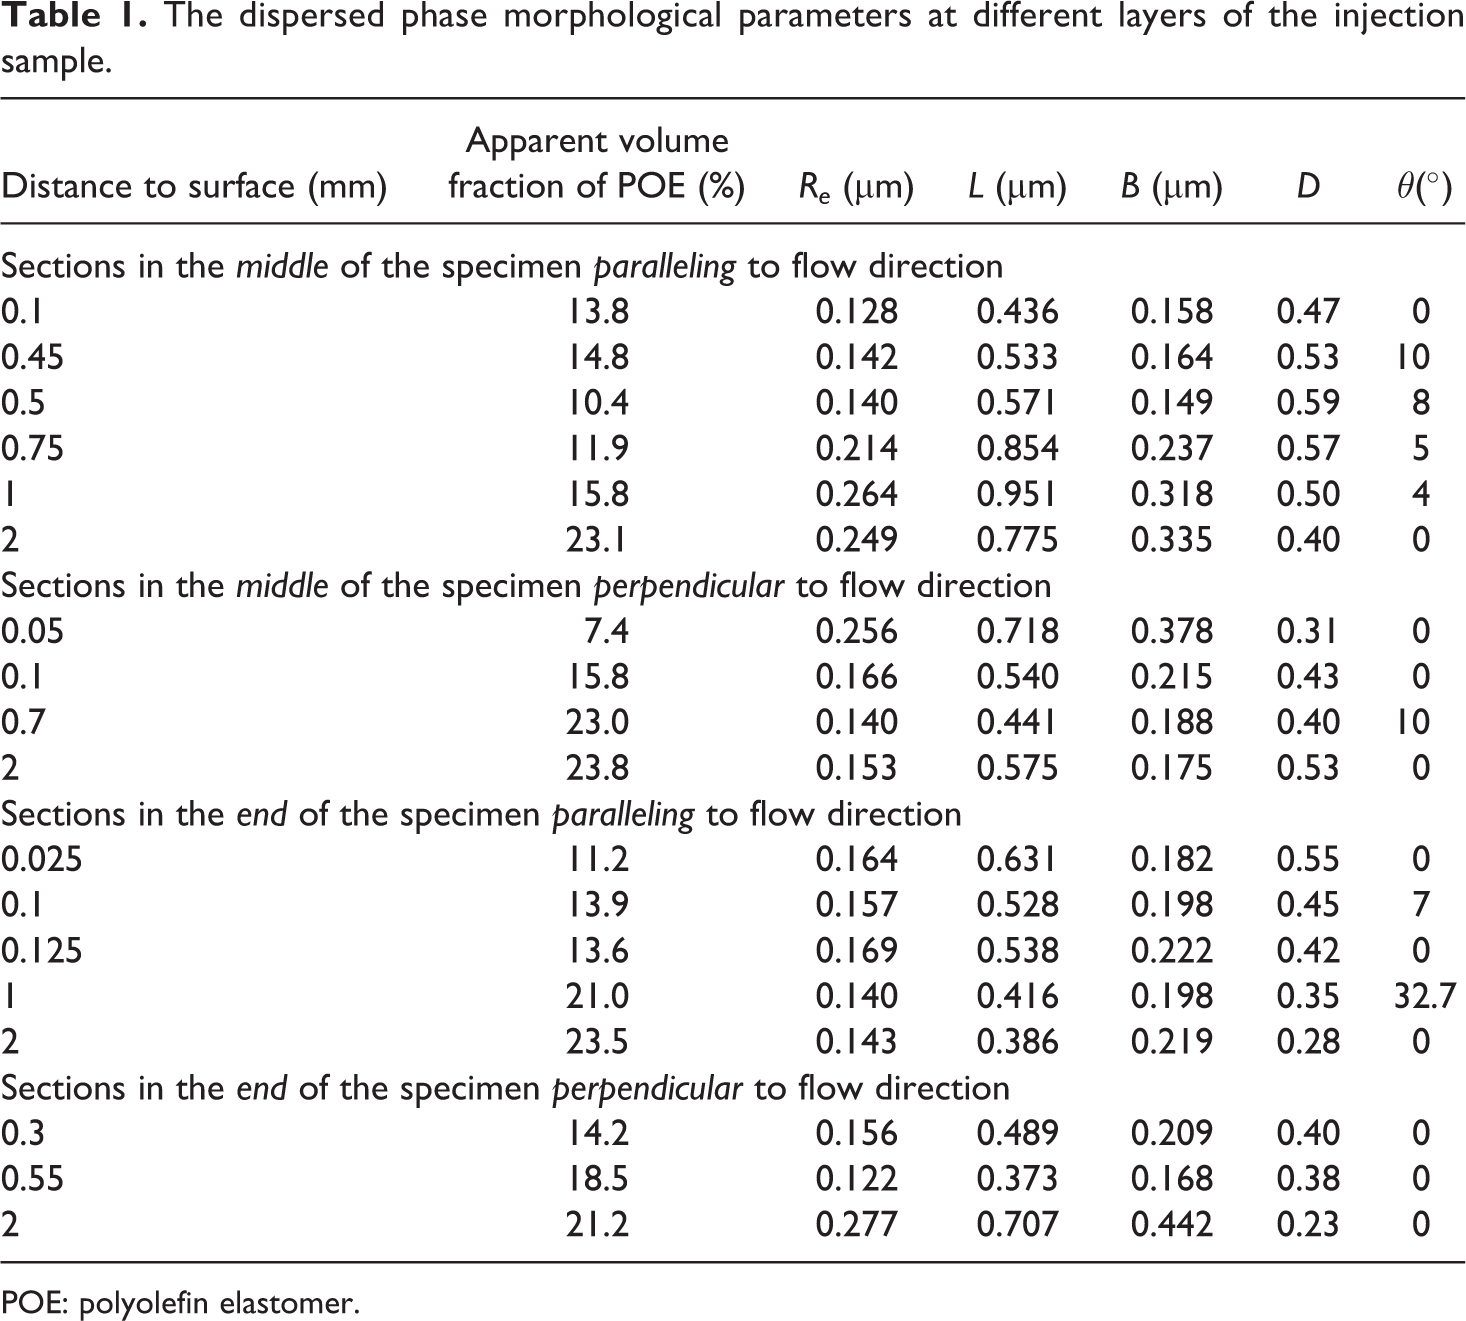
POE: polyolefin elastomer.
As shown in Figure 5(b), the boundary between skin layer and transitional layer is relatively clear. The POE phase is not present in the skin layer at the bottom of the image, and a few POE phases are observed in the transitional layer at the top part of the image. It can be seen from Figure 5(b) and (c) that the deformation degrees of the POE phases are small in the transitional layer; the D value is only 0.47 and the Re value is 0.128 as listed in Table 1. This is because the temperature in transitional layer is low due to closeness to the wall of the mold, resulting in too high viscosities of PP and POE, which again lead to the POE phases elongating difficultly in the shear field.
Figure 5(d) to (g) shows the morphologies of POE phases in the shear layer. It can be seen that the deformations of the POE phases in the shear layer are very large and that there are various POE morphologies in varying sizes and deformation degrees. This is due to the higher shear field and appropriate viscosities of the melt in the shear layer. More so, some of the POE phases are elongated into lines and then broken into two or more parts, and some of them coalesce further into sphere shapes. The result is in agreement with Iza and Bousmina’s result. 26 It can also be seen that in the shear layer, the closer to the core the POE phases are, the larger the POE phase zones become, the more coalescence phenomena occur, and the smaller the D values are. For example, the D value varies from 0.59 (at 0.5 mm distance to the skin) to 0.50 (at 1 mm distance to the skin) as shown in Table 1. The breakup and coalescence of the dispersed phase particles depends on the capillary number 21,27 defined in equation (4).
The morphology of the dispersed phase particle depends on the parameter, Ca, at different viscosity ratios (ηd/ηm ) of the two polymers melts. For the same viscosity ratio, the greater the Ca value is, the more easily the dispersed phase droplets are stretched and broken. However, the dispersed phase droplets will not be stretched and broken when the viscosity ratio reaches a certain high value (such as 50–100), even if the Ca value is high. 27 This is because the matrix viscosity is too small to change the shape of a dispersed phase with high viscosity. Charles and Paula 27 summarized the relationship between the Ca value and the morphology of dispersed phase. The Ca value of the polymer system at different shear rates can be obtained according to equation (4). It is assumed that there are no interactions between the dispersed phases; thus, the Ca value is independent of the POE content.
To calculate the Ca value and interpret the morphology of the POE phases in the PP matrix, rheology behaviors of PP, POE, and PP/POE blends (25 wt% POE) with different shear rates at 190°C were measured, as shown in Figure 6. The results show that the PP, POE, and its blends are pseudoplastic fluid whose viscosity decreases with increasing shear rate. But the viscosity of POE is larger than that of PP, and the viscosity of the PP/POE blend is between that of PP and POE. Based on the rheology data, the viscosity ratio (η POE /η PP) at different shear rates from 2.6 (γ = 28 s−1) to 3.5 (γ = 1000 s−1) at 190°C was obtained.
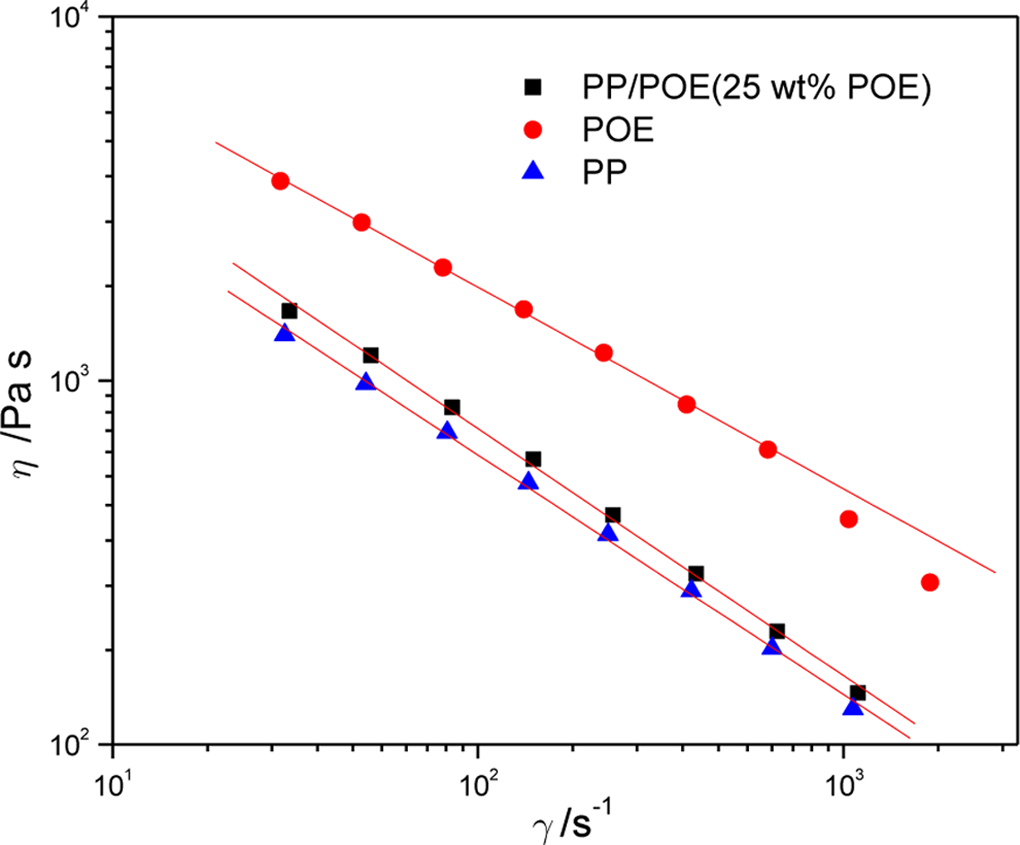
Rheology behaviors of PP, POE, and PP/POE blends (25 wt% POE) at 190°C (the solid lines are the linearity fit of the experimental data, respectively). SEM: scanning electron microscopy; PP: polypropylene; POE: polyolefin elastomer.
The initial average radius R of the POE phase droplets can be calculated, and the average value of R is 0.25 μm in this case. The interfacial tension Γ between PP and POE is obtained from literature. 26
Based on the rheological analysis and parameters, the Ca value was then calculated according to equation (4) and listed in Table 2.
Ca values at different shear rates of PP at 190°C.
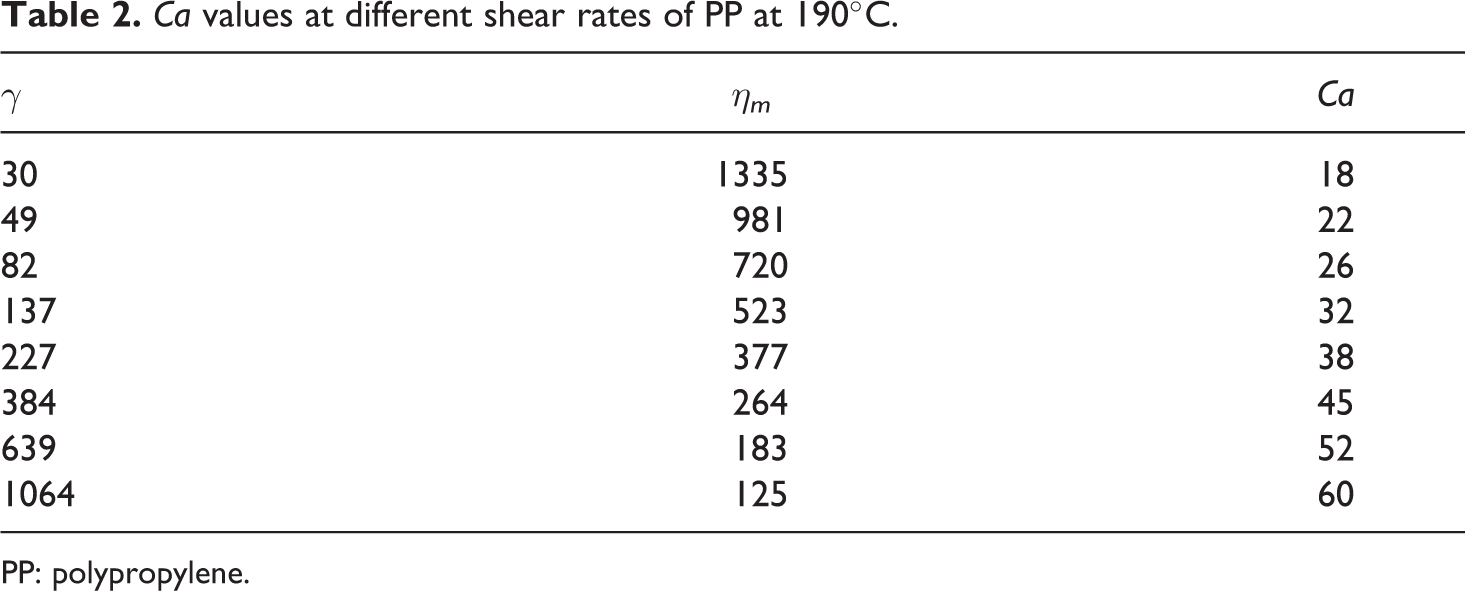
PP: polypropylene.
It is found from Table 2 that Ca increases with increasing shear rate. In injection molding, the polymer melt will only take 0.1–0.5 s to fill the mold cavity when the product is small; thus, the breakup of the dispersed phase droplets is independent on time according to equation (5), namely the dispersed phase droplet will be broken when Ca is greater than κCac. Combined with the POE phases in the shear layers shown in Figure 5, it could be concluded that the Ca values in the shear layer are bigger than the critical value, κCac; then, the POE phases present more morphologies in the shear layer such as elongation into line, breakup, and so on. However, there are no breakup phenomena in the core layer and transitional layer because Ca values are below the critical value Cac .
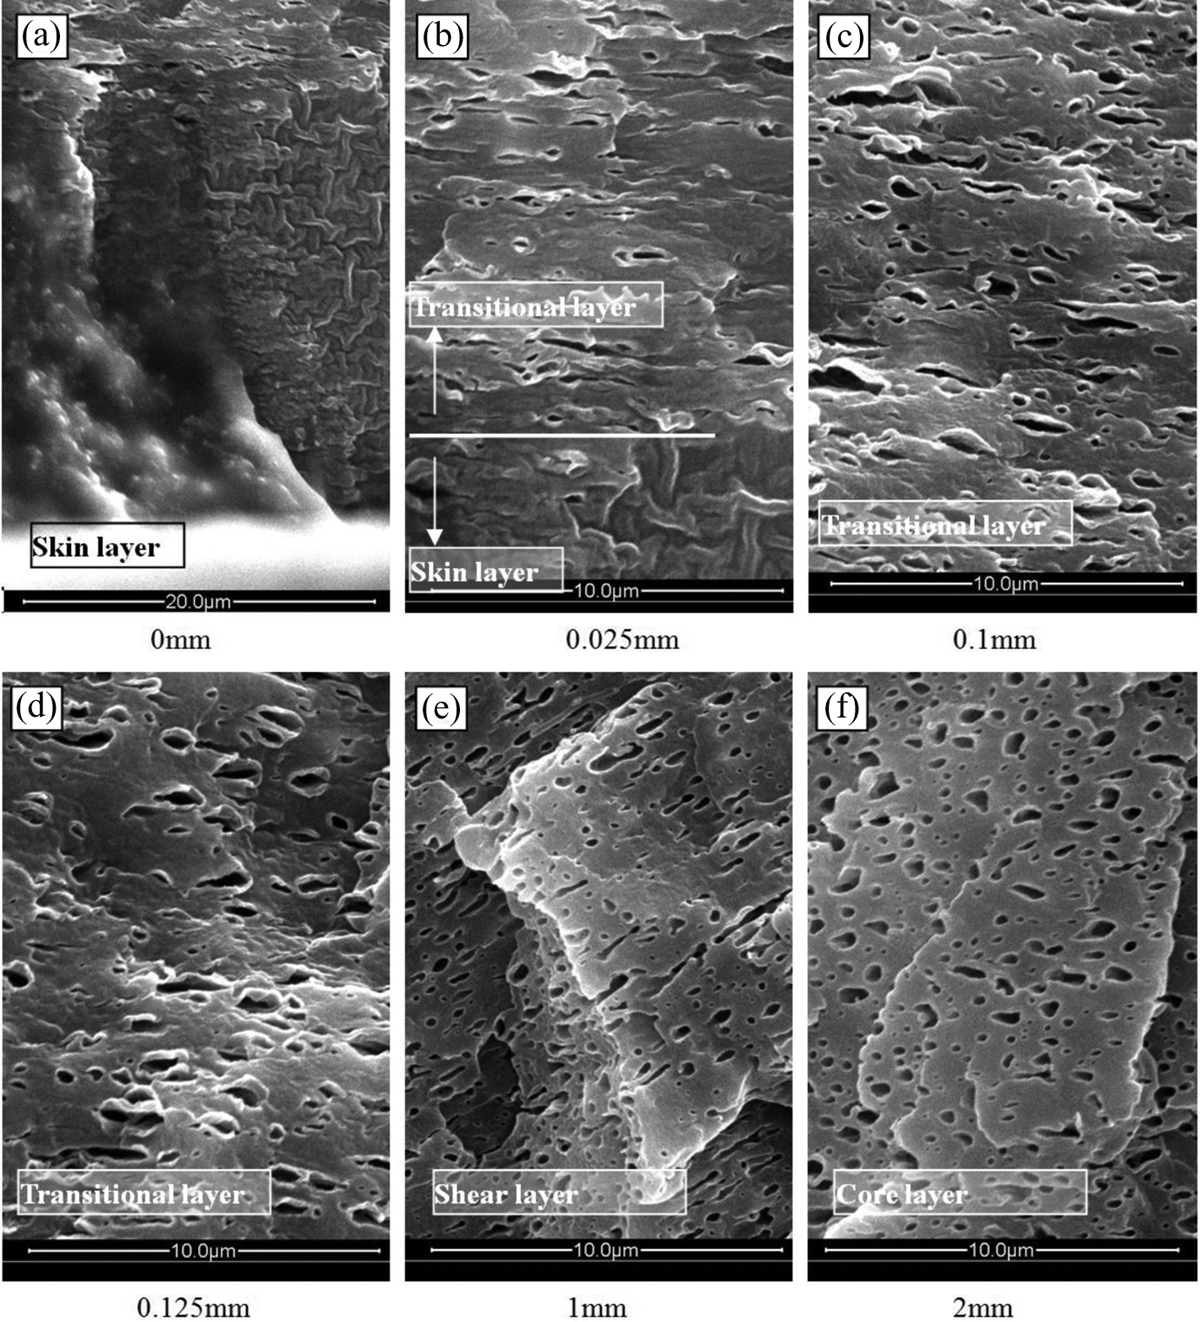
Figures 5(h) and 7(e) show that the deformations of the POE phases in the core layer parallel and perpendicular to the flow direction, where the deformations of the POE phases are small (D = 0.4), but there is still a certain degree deformation, indicating that there exist small shear fields in the center zone. The shear rate depends on the size of the flow channel, injection rate, and melts temperature in injection-molding process. Furthermore, it is noted that the stretched POE phases could return to sphere shape due to the higher temperature in the core layer, and the cooling rate is slow.
SEM micrographs of different layers perpendicular to the flow direction in the middle region of an injection-molded bar (the number below the image is the distance of micrograph section to skin), 25 wt% PP/POE. SEM: scanning electron microscopy; PP: polypropylene; POE: polyolefin elastomer.
Figure 7 shows the SEM micrographs of each layer in the middle region of the specimen perpendicular to the flow direction. Figure 7(a) shows the skin layer and the thickness of this layer is approximately 0.05 mm; this is comparable to the skin layer thickness in the parallel direction shown in Figure 5(a). Comparing to the skin layer images of the two directions, it is confirmed that there is no POE phase in the skin layer.
In Figure 7(b), the morphology of the transitional layer shows that most of the POE particles display round shapes in the vertical direction specimen. Combined with the morphology of this layer in the parallel to flow direction shown in Figure 5(b), it indicates that the POE phase morphology in the transitional zone presents an ellipsoid shape. These observations agree with the dragging ellipsoidal model, and the long axis orientation of the POE ellipsoid in the middle region of the specimen is parallel to the flow direction.
Figure 7(c), (d), and (f) shows the morphologies of the POE phases in the shear layer perpendicular to the flow direction. The cavities, which are the POE phase left after etching, display round or elliptic shape. Considering the morphologies of the POE phases in the shear layer parallel to the flow direction (as shown in Figure 5(d) to (f)), it indicates that the POE phase in the shear layer deformed slightly in the vertical direction and significantly in the parallel direction. The D values of the POE phases in parallel and vertical direction were calculated and listed in Table 1. It can be seen that the POE phases in the shear layer are akin to ellipsoids. This is because the shear fields at various zones of the flow rectangular section are different due to the height being less than the width of the rectangular cross section. Thus, the POE phase displayed oblate ellipsoids in some areas of the shear layer. Furthermore, in the shear layer, it can be found that a few of the POE ellipsoids are not parallel to the flow direction; the orientation angles between the ellipsoid long axial orientation and flow direction are shown in Table 1.
As Figures 5(c) and (e) and 7(c) and (d) shown, there are many evaginations (like human lips) around the cavities of the PP matrix in the shear layer. The phenomenon is probably caused by the interaction between POE and PP molecules, the POE phases, and the PP matrix partially cross and adhere each other. Due to the difference in viscosities for PP and POE, the PP phases could be stretched by the POE phases in the high shear stress field. Then, the lip-like edges around the cavities of the PP matrix in the shear layer are formed when POE phases are etched out. The cavity evagination phenomenon of the PP matrix indicates that PP and POE are partial compatible, and the result is in agreement with the previous work. 2 However, there is no lip-like cavity morphology in the core layer due to weakness of the shear field in the core layer.
Morphology of POE dispersed phases in the end region of injection-molded bar
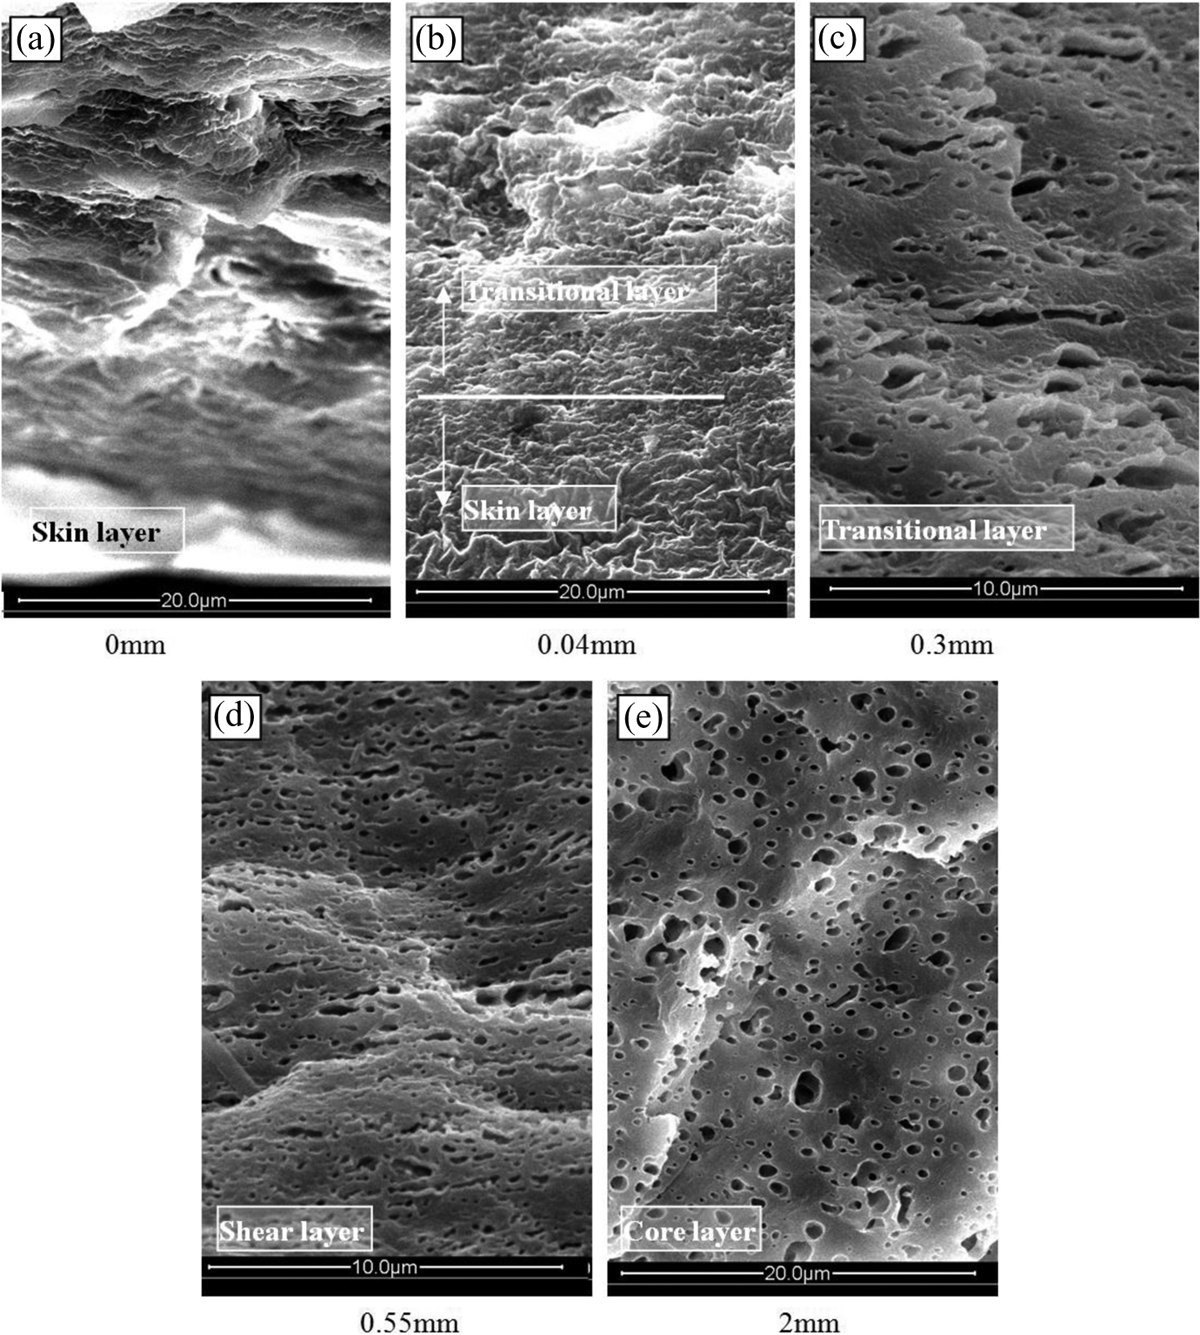
Figures 8 and 9 show the SEM micrograph of each layer in the end region of the rectangle bar parallel and perpendicular to the flow direction, respectively. In this region, the skin layer, as shown in Figures 8(a) and 9(a), there is still no POE phase present. However, the thickness of the skin layer in the end region of the bar is only 0.02 mm, obviously thinner than that in the middle region.
SEM micrographs of different layers paralleling the flow direction at the end region of an injection-molded bar, 25 wt% PP/POE. SEM: scanning electron microscopy; PP: polypropylene; POE: polyolefin elastomer.
SEM micrographs of different layers perpendicular to the flow direction at the end region of an injection-molded bar, 25 wt% PP/POE. SEM: scanning electron microscopy; PP: polypropylene; POE: polyolefin elastomer.
Figures 8(c) and (d) and 9(c) show the transitional layer in the end region of the rectangle bar. It is obvious that the dispersed phase morphology in the transitional layer in the end region of the bar is similar with that in the middle region of the bar. This implies that the deformation of the dispersed phase in the transitional layer is limited.
In the shear layer of the end region of the bar, as shown in Figures 8(e) and 9(d), the deformation degree of the POE phases (D = 0.35, at 1 mm to skin, parallel section) is smaller than that of in the middle region (D = 0.50, at 1 mm to skin). Compared to the oblate ellipsoid shape of the POE phase in Figure 5(d) and (f), the POE phase morphologies are close to perfect ellipsoid shape. In addition, compared to the same layer in the middle region of the specimen, the deformation degree of the core layer in the end region of the specimen, as shown in Figures 8(f) and 9(e), is small (D = 0.28, parallel section, D = 0.23, perpendicular section, at 2 mm to skin). This is because the normal stress of the front melt in fountain flow, see Figure 10, pushes the rubber particles to tend toward a sphere morphology, while the flow shear stress drags the particles toward an ellipsoid shape. In Figure 10, the shear rate, velocity, and temperature profile are sketched to explain the mechanism of morphological evolution of the dispersed phase. The fountain flow behavior and temperature gradient cause a special velocity profile, which exists two opposite direction velocities in the shear layer, and cause the shear rate is the greatest of various layers in the injection-molded sample.
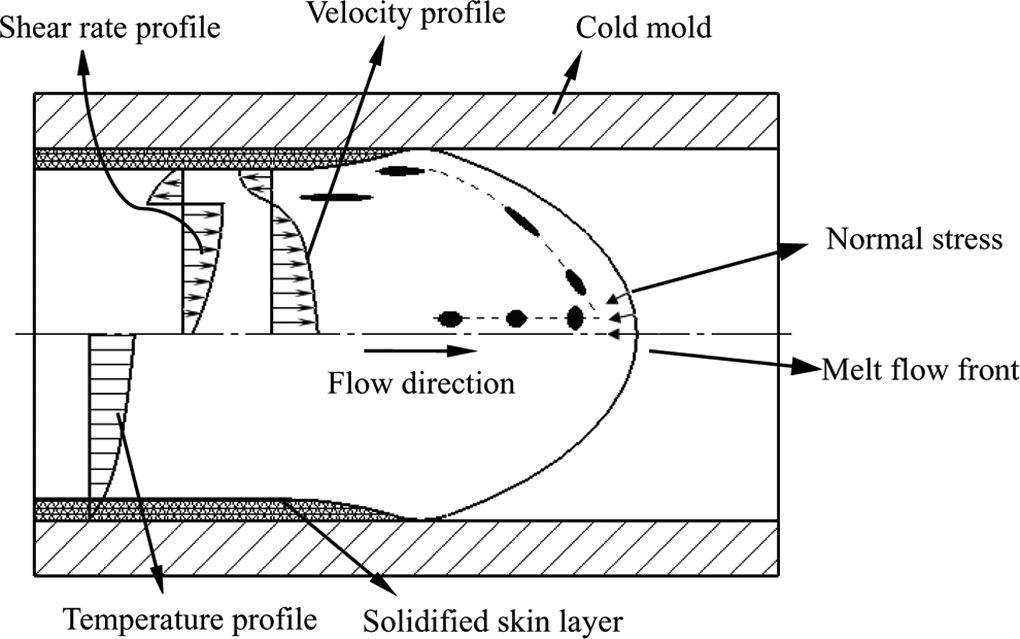
Schematic representation for shear rate, velocity and temperature profile, and fountain flow in the cold mold showing the mechanism of the rubber particles deformation.
Interestingly, as Figure 8(e) shows, the orientation angle of the POE ellipsoid phases is large. It manifests at the front flow of the melt and makes the rubber particles turn around under the normal stress and shear stress, as described in Figure 10.
Particle size analysis for each layer
The particle size distribution of the POE phases in each layer at the different directions was analyzed and the results are shown in Figure 11. A statistical analysis was conducted based on binary picture such as Figure 5(i) (the other binary pictures are not presented here). It can be seen that the particle size and its distribution in the core layer are larger and wider than that of the shear and transitional layers. The particle size distribution of the section in the middle region is wider than that of the end part, especially in the section perpendicular to the flow direction. The average size values of the particle (R e) and the average volume fractions of POE in the blend are listed in Table 1. This 2-D image statistical method may not describe the actual POE volume fraction and size in each layer. Then, the apparent volume fraction is named for the POE, and the apparent volume fraction can describe the varying tendency of the dispersed phase volume.
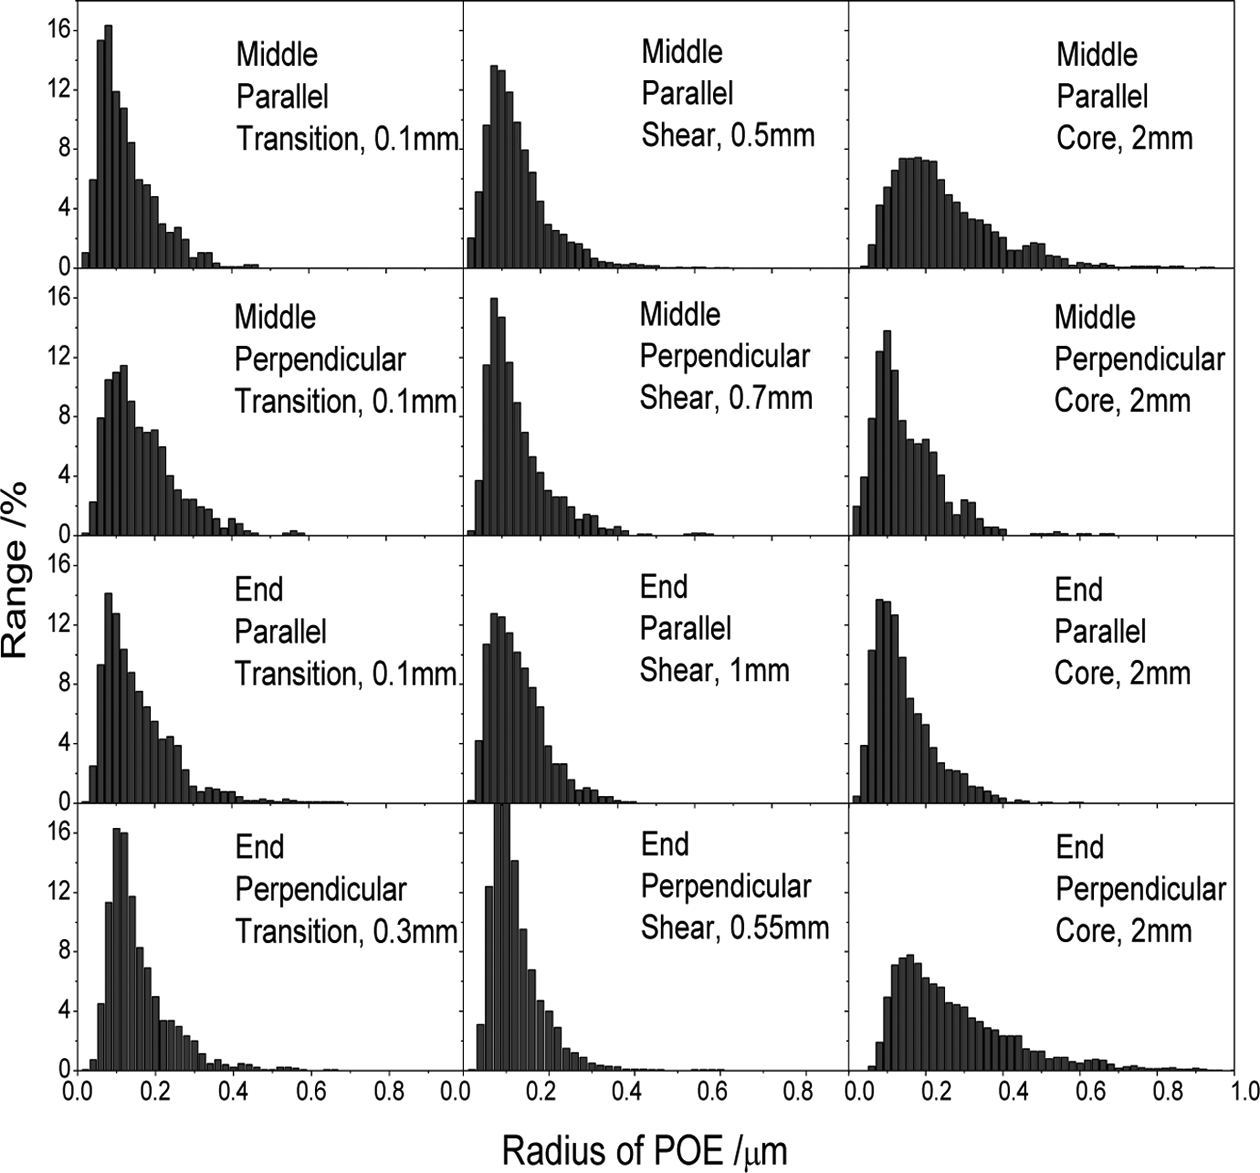
Particle size distribution of dispersed phase of every layer at different positions and directions (middle and end—the position of taking sample; parallel and perpendicular—the direction if the section; transition, shear, and core—layers; number—the distance of the SEM photo section to skin).
It can be found from Table 1 that the apparent volume fraction of POE increases gradually from the skin layer to the core layer, and the tendency is consistent with Cheng’s results experimenting on suspension. 25
Conclusion
Based on the morphology and rheology analysis of PP/POE blends at various layers and regions of an injection sample, the polymer blend (plastic/rubber system) displays a multilayered structure. The injection sample can be divided into skin layer, transitional layer, shear layer, and core layer from skin to core in terms of dispersed phase morphology. The deformation degree (D) of the dispersed phase is at its maximum in the shear layer. In the shear layer, the dispersed phases elongate, breakup, and coalescence and display an oblate ellipsoid morphology. The capillary number (Ca) is larger than the critical value Cac in the shear layer. The deformation degrees of the dispersed phases in the core layer and transitional layer are small, and the Ca value is smaller than critical value. The capillary number and ellipsoid model can be used to describe the deformation and orientation of the dispersed phase in the flow shear field. There is no POE phase present in the skin layer. The core and shear layers are thicker than the skin and transitional layers. The POE content in the core layer is the maximum.
Footnotes
Declaration of Conflicting Interests
The author(s) declared no potential conflicts of interest with respect to the research, authorship, and/or publication of this article.
Funding
The author(s) disclosed receipt of the following financial support for the research, authorship, and/or publication of this article: This work was supported by National Natural Science Foundation of China (no 20490220), Open Fund of Hubei Key Laboratory of Materials Chemistry and Service Failure (no 200701), and National High Technology Research and Development Program of China (863 Program; no 2009AA03Z104).