
Abstract
Polyimide (PI) nanocomposites containing two different functionalized graphene sheets (FGSs) were synthesized, and their thermal properties, morphology, oxygen permeability, and electrical conductivity were compared. Hexadecylamine–graphene sheets and 4-amino-N-hexadecylbenzamide–graphene sheets were utilized. Hybrid films were obtained from blended solutions of PI and FGSs, with the filler content with respect to the PI varying from 0 wt% to 10 wt%. The differences in the properties of the PI matrix were then analyzed with respect to filler content. Transmission electron microscopy analysis confirmed that the two FGSs were dispersed homogeneously throughout the polymer matrix, although some FGS aggregates were also formed. Furthermore, it was observed that the addition of small amounts of FGS nanofiller was sufficient to improve the coefficient of thermal expansion, the gas barrier properties, and the electrical conductivity of the hybrid films. In contrast, the glass transition temperature and the initial decomposition temperature of the PI hybrid films continued to decrease with increasing FGS content.
Introduction
In recent years, nanoscale composites containing polyimides (PIs) paired with either clay or graphene-based materials have been the focus of extensive study. 1 –3 Nanoscale composites, or nanocomposites, are a class of composite materials that contain ultrafine nanometer-scale fillers homogeneously dispersed throughout a polymer matrix. The nanometer scale of the filler material results in nanocomposites whose properties are superior to those of conventional composite materials given the resulting enhancement of interfacial adhesion. 4,5
Graphene has attracted wide attentions as the representative of the new carbonaceous material. Graphene is a single layer of carbon atoms arranged as a two-dimensional honeycomb crystal. Graphene has become a research hot spot in the field of composite materials. Thus, the two-dimensional plane structure of graphene enables very high thermal conductivity, and it has become one of the most ideal materials for improving thermal property of polymers. Since then, it has broad application prospects in the fields of electronic device, biological and chemical sensors, energy storage devices, and composite materials. 6,7
Functionalization of the graphene surface introduces reactive moieties that disrupt the bundle structure and can potentially make it possible to obtain individual sheets. Functionalization involves attachment of functional moieties to the open ends and sidewalls of the graphene, primarily to improve the solubility and the dispersibility of the graphene sheets (GSs). Accordingly, one of the best methods for achieving a homogeneous dispersion of graphenes in a polymer matrix is the use of functionalized graphene sheets (FGSs). This involves functionalizing the graphenes with polymers that are structurally similar to the matrix polymer in order to ensure that the dispersed graphenes are compatible with the polymer matrix and limit any microscopic phase separation in the nanocomposites. 8,9
Although traditional composites typically contain a significant proportion (∼40 wt%) of fillers bound to the polymer matrix, drastic changes in material properties are possible with loading amounts lower than 10 wt% by using nanofillers such as exfoliated nanoclays, carbon nanotubes, and GSs. 10,11 This performance is achieved not only by utilizing the inherent properties of the chosen nanofiller but also by optimizing dispersion characteristics, interface chemistry, and nanoscale morphology in order to take advantage of its enormous surface area—clay and graphene, for example, can exhibit surface areas of up to 760 m2/g and 2630 m2/g, respectively. 12,13 The inherent and potential properties of graphene, in particular, indicate that it holds tremendous potential for synergistically improving the thermal and gas barrier properties of various polymers.
In this study, we have developed a method by which to make hexadecylamine–graphene sheets (HDA-GSs) and 4-amino-N-hexadecylbenzamide–graphene sheets (AHB-GSs), two novel FGSs. These two FGSs are distinct from each other in that AHB-GS contains both long alkyl and aromatic amide groups, while HDA-GS contains only long alkyl groups. We also prepared hybrid films that combine either HDA-GS or AHB-GSs with PI synthesized from the monomers 4,4′-biphthalic anhydride (BPA) and bis(4-aminophenyl) sulfide (SDA), using blended solutions of the precursor polymer and the FGSs. Additionally, the effect of FGS incorporation was tested using a range 1–10 wt% FGS. Finally, the effects of FGS amount and type with regard to thermal properties, morphology, gas permeation, and electrical conductivity were then compared in detail.
Experimental
Materials
All reagents were purchased from TCI (Seoul, Korea) and Aldrich (Yongin, Korea). BPA and SDA were obtained from TCI. N,N-Dimethylacetamide (DMAc) was purified and dried over molecular sieves before use. All other reagents were used without further purification. Natural flake graphite of 75-mesh particle size was purchased from Aldrich.
Synthesis of HDA-GS
Graphene oxide (GO) was synthesized from natural graphite by utilizing a multistep route known as the Hummers’ method. 14 HDA-GS was synthesized from HDA and GO according to the following procedure: First, GO (1 g) was dissolved in distilled water (1.5 L). HDA (2.00 g; 8.28 × 10⁻³ mol) was then added to ethanol (25 mL), and the mixture was stirred at 25°C under N2 and subsequently added to the GO/water mixture. After the mixture was heated for 12 h at 25°C under N2, it was then cooled to 25°C, washed twice with distilled water and ethanol (v/v = 1:1), and dried under vacuum at 70°C for 24 h in order to obtain HDA-GS. 15,16 The synthetic route for HDA-GS is shown in Figure 1. Formation of the product was confirmed by Fourier transform infrared (FTIR) (Figure 2) spectroscopy. Figure 2 shows the FTIR spectra of pure graphite and GO. The spectrum of pure graphite exhibits no peaks (Figure 2(a)), while the GO spectrum contains strong and broad characteristic absorption peaks corresponding to OH and COOH moieties (Figure 2(b)). FTIR (KBr): ν (cm−1) 3383 (–OH), 1729, 1624 (–C=O), 1048 (–C–O). The FTIR spectrum of HDA-GS is also shown in Figure 2(c) and contains characteristic absorption peaks at 3160 cm−1 (O–H), 2921 and 2852 cm−1 (aliphatic C–H), and 1375 cm−1 (aromatic C–N).
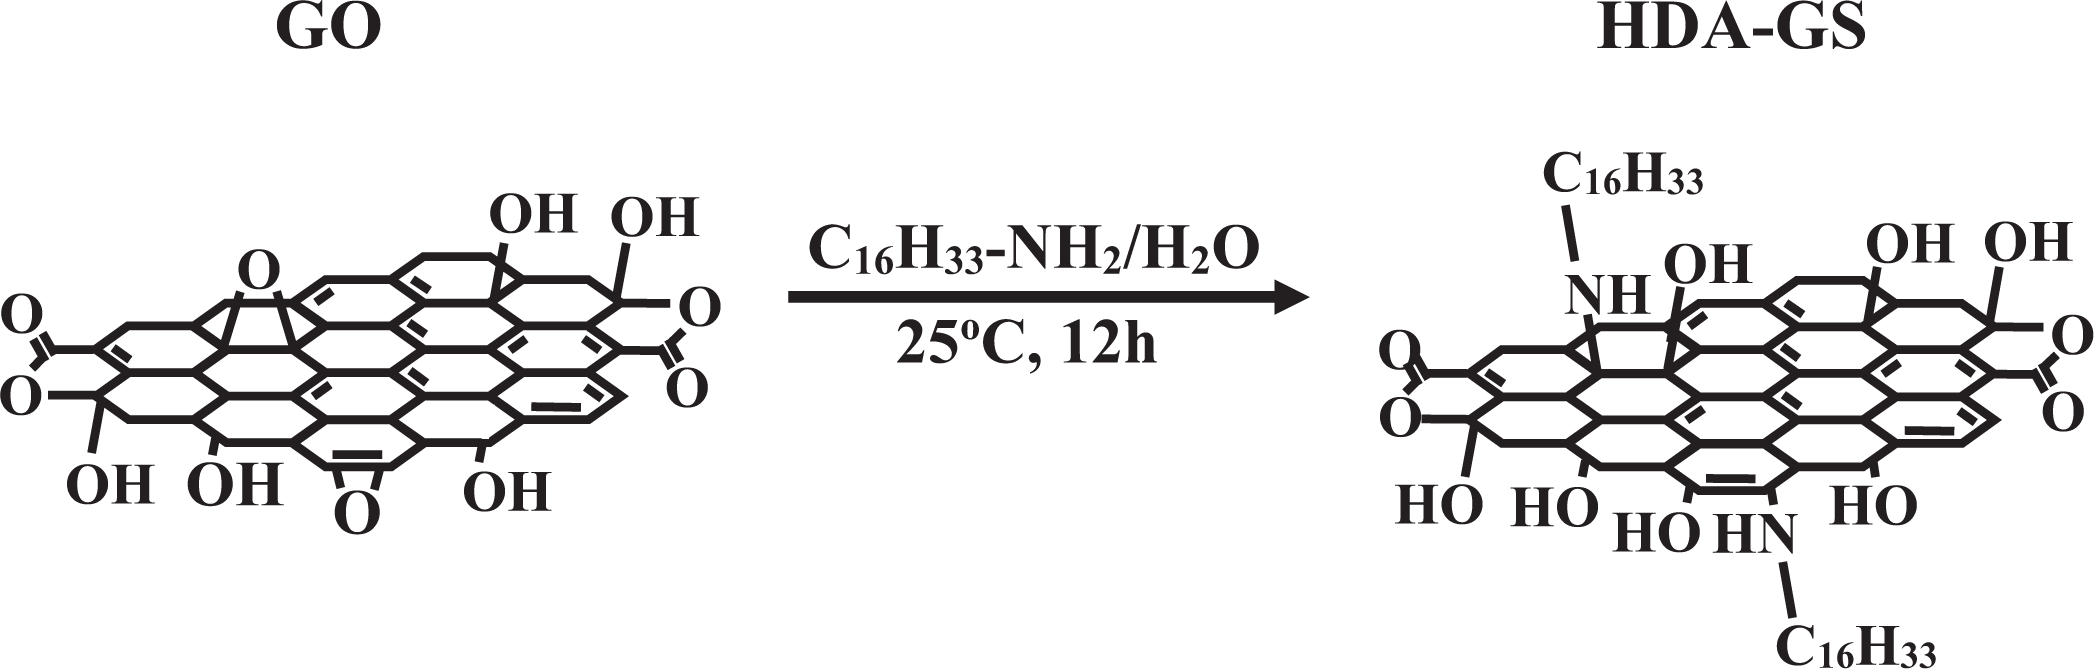
Synthesis of HDA-GS. HDA-GS: hexadecylamine–graphene sheet.
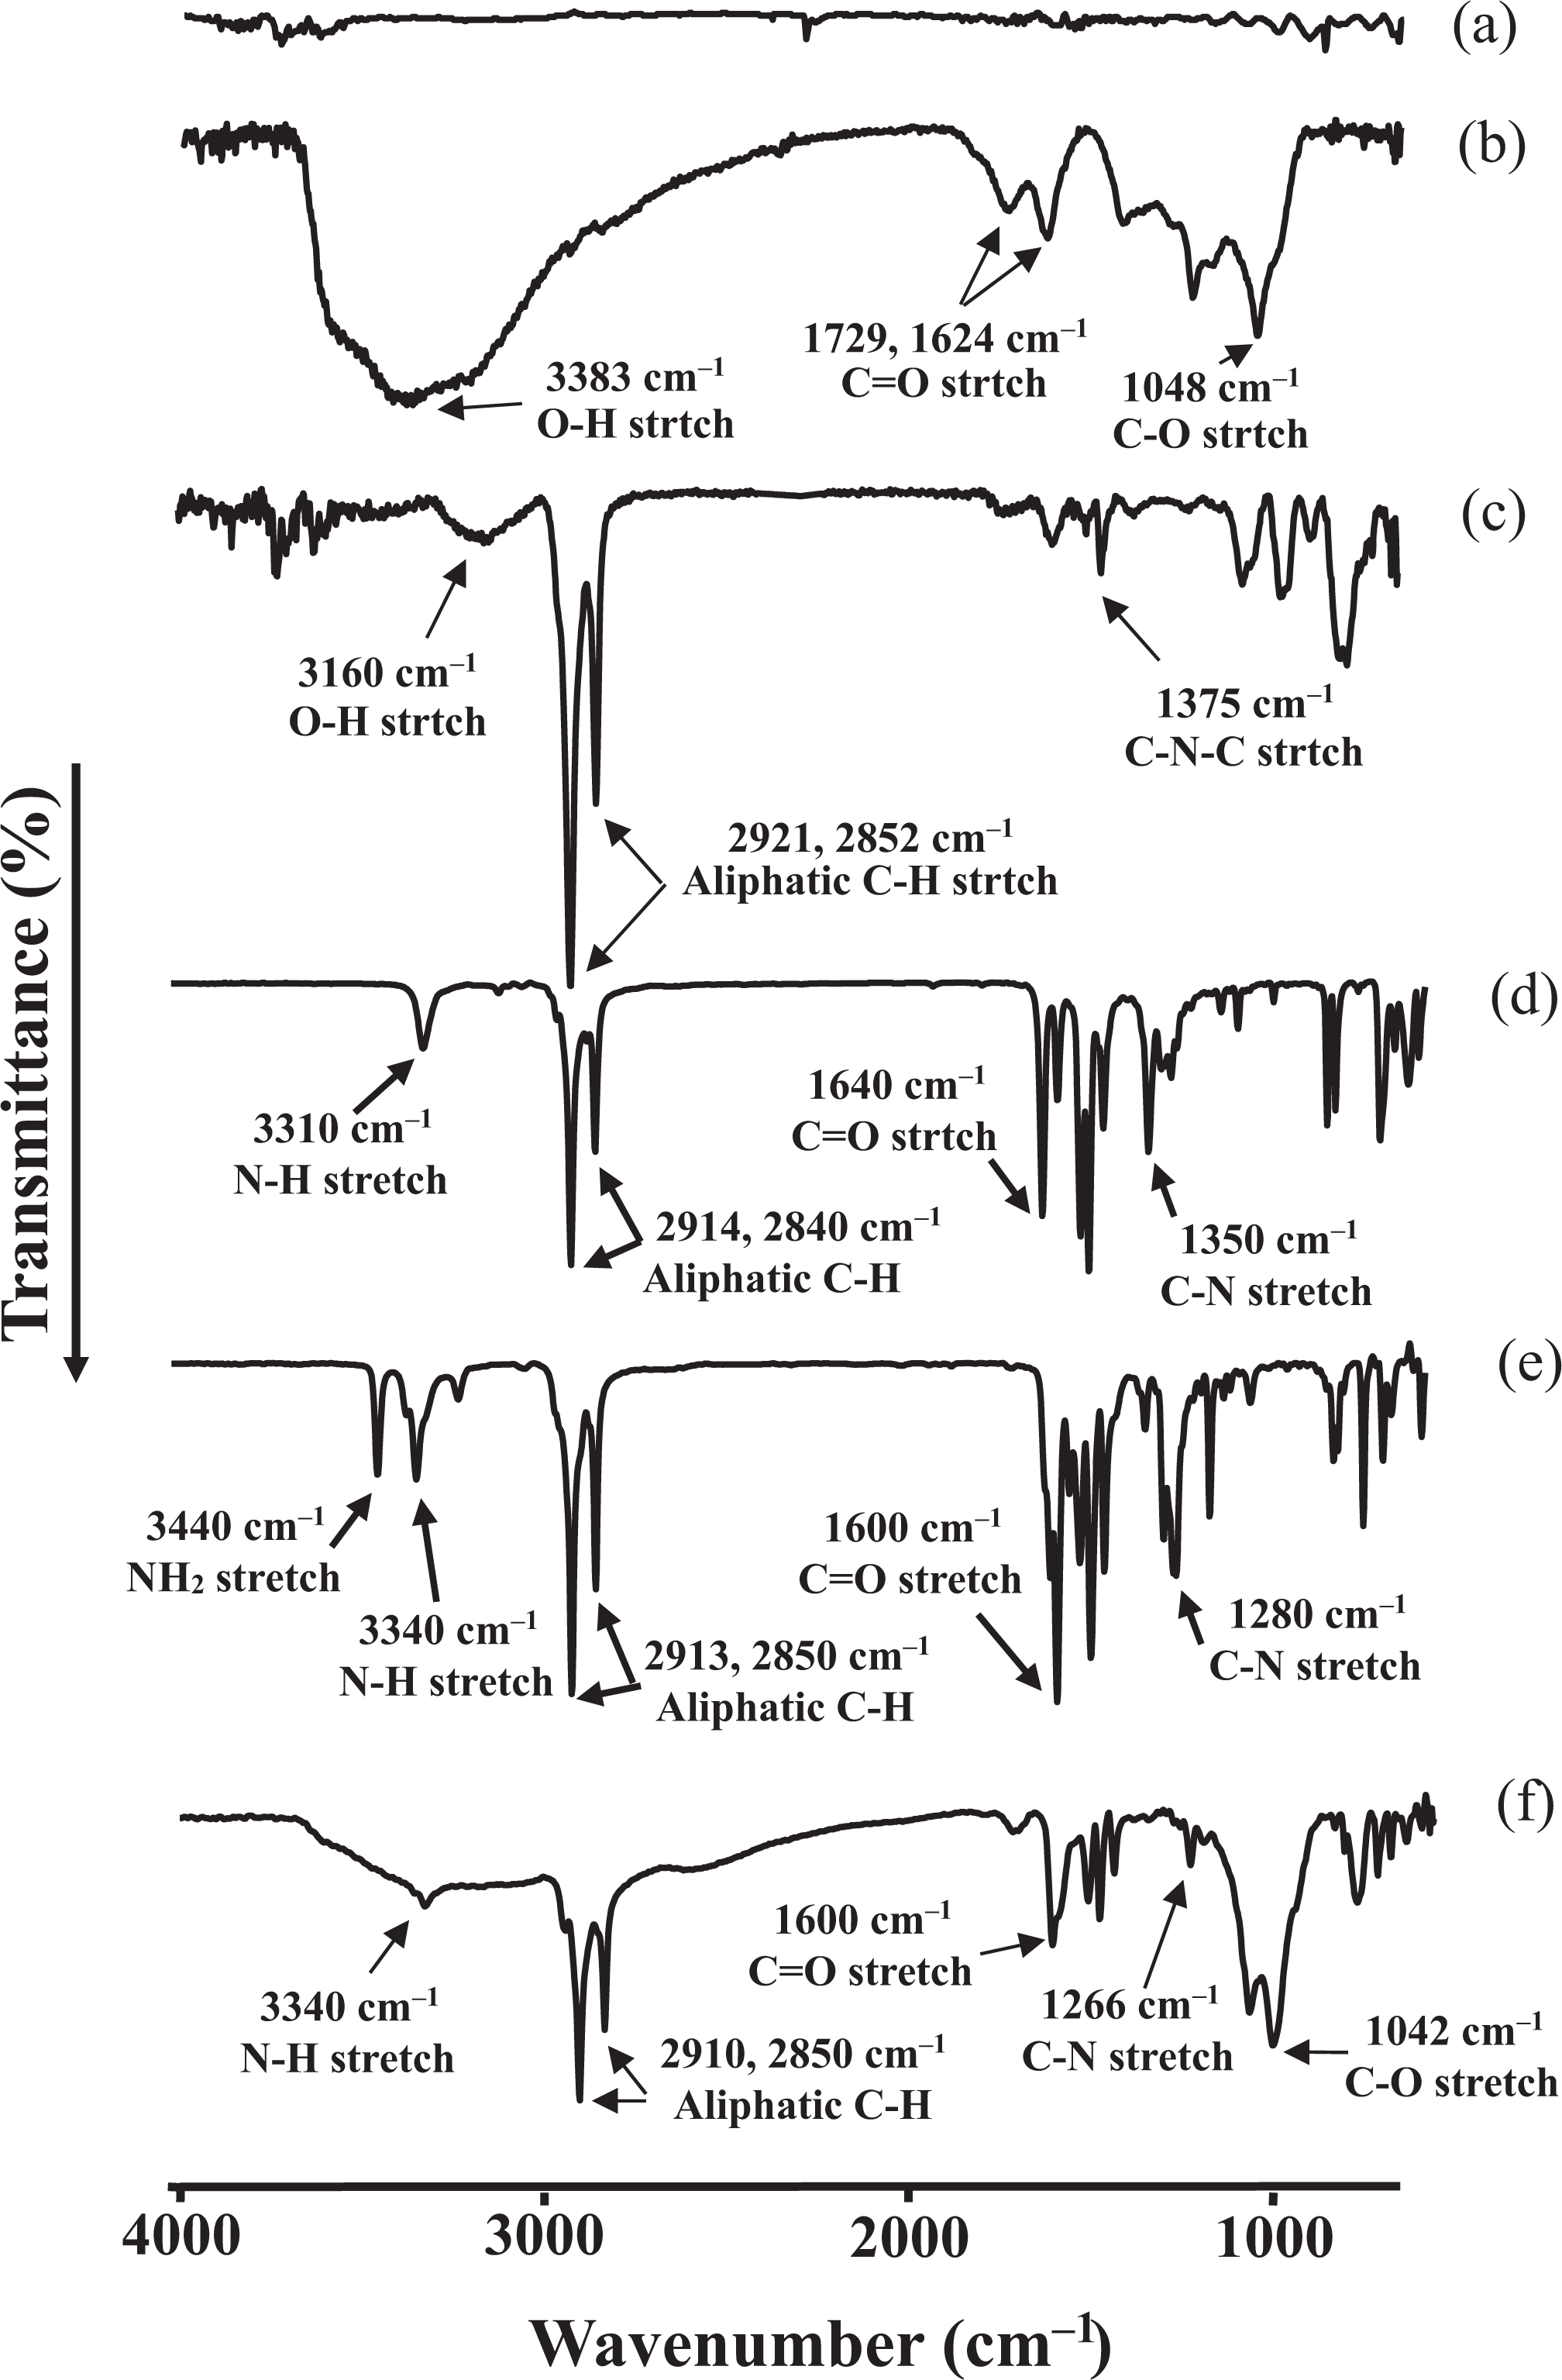
FTIR spectra of (a) graphite, (b) GO, (c) HDA-GS, (d) HNA, (e) AHB, and (f) AHB-GS. FTIR: Fourier transform infrared; GO: graphene oxide; HDA-GS: hexadecylamine–graphene sheet; HNA: N-hexadecyl-4-nitrobenzamide; AHB: 4-amino-N-hexadecylbenzamide; AHB-GS: 4-amino-N-hexadecylbenzamide–graphene sheet.
Synthesis of N-hexadecyl-4-nitrobenzamide
N-Hexadecyl-4-nitrobenzamide (HNA) is an intermediate in the synthesis of AHB-GS, the route for which is shown in Figure 3. HNA was synthesized from 4-nitrobenzoyl chloride and HDA according to the following procedure: First, 4-nitrobenzoyl chloride (2.17 g, 1.17 × 10⁻² mol) was dissolved in tetrahydrofuran (THF; 30 mL). Then, HDA (2.83 g, 1.17 × 10⁻² mol) was dissolved in THF (70 mL), after which the resulting solution was added to the 4-nitrobenzoyl chloride/THF mixture, which was stirred vigorously at 25°C for 30 min. Pyridine (15 mL) was slowly added to this solution, after which it was stirred at 25°C for 24 h. The reaction mixture was then filtered to collect the precipitate, which was repeatedly washed with distilled water for 6 h and then dried under vacuum at 100°C for 12 h. Formation of the product was confirmed by FTIR (Figure 2(d)) and 1H-NMR (Figure 4) spectroscopies.
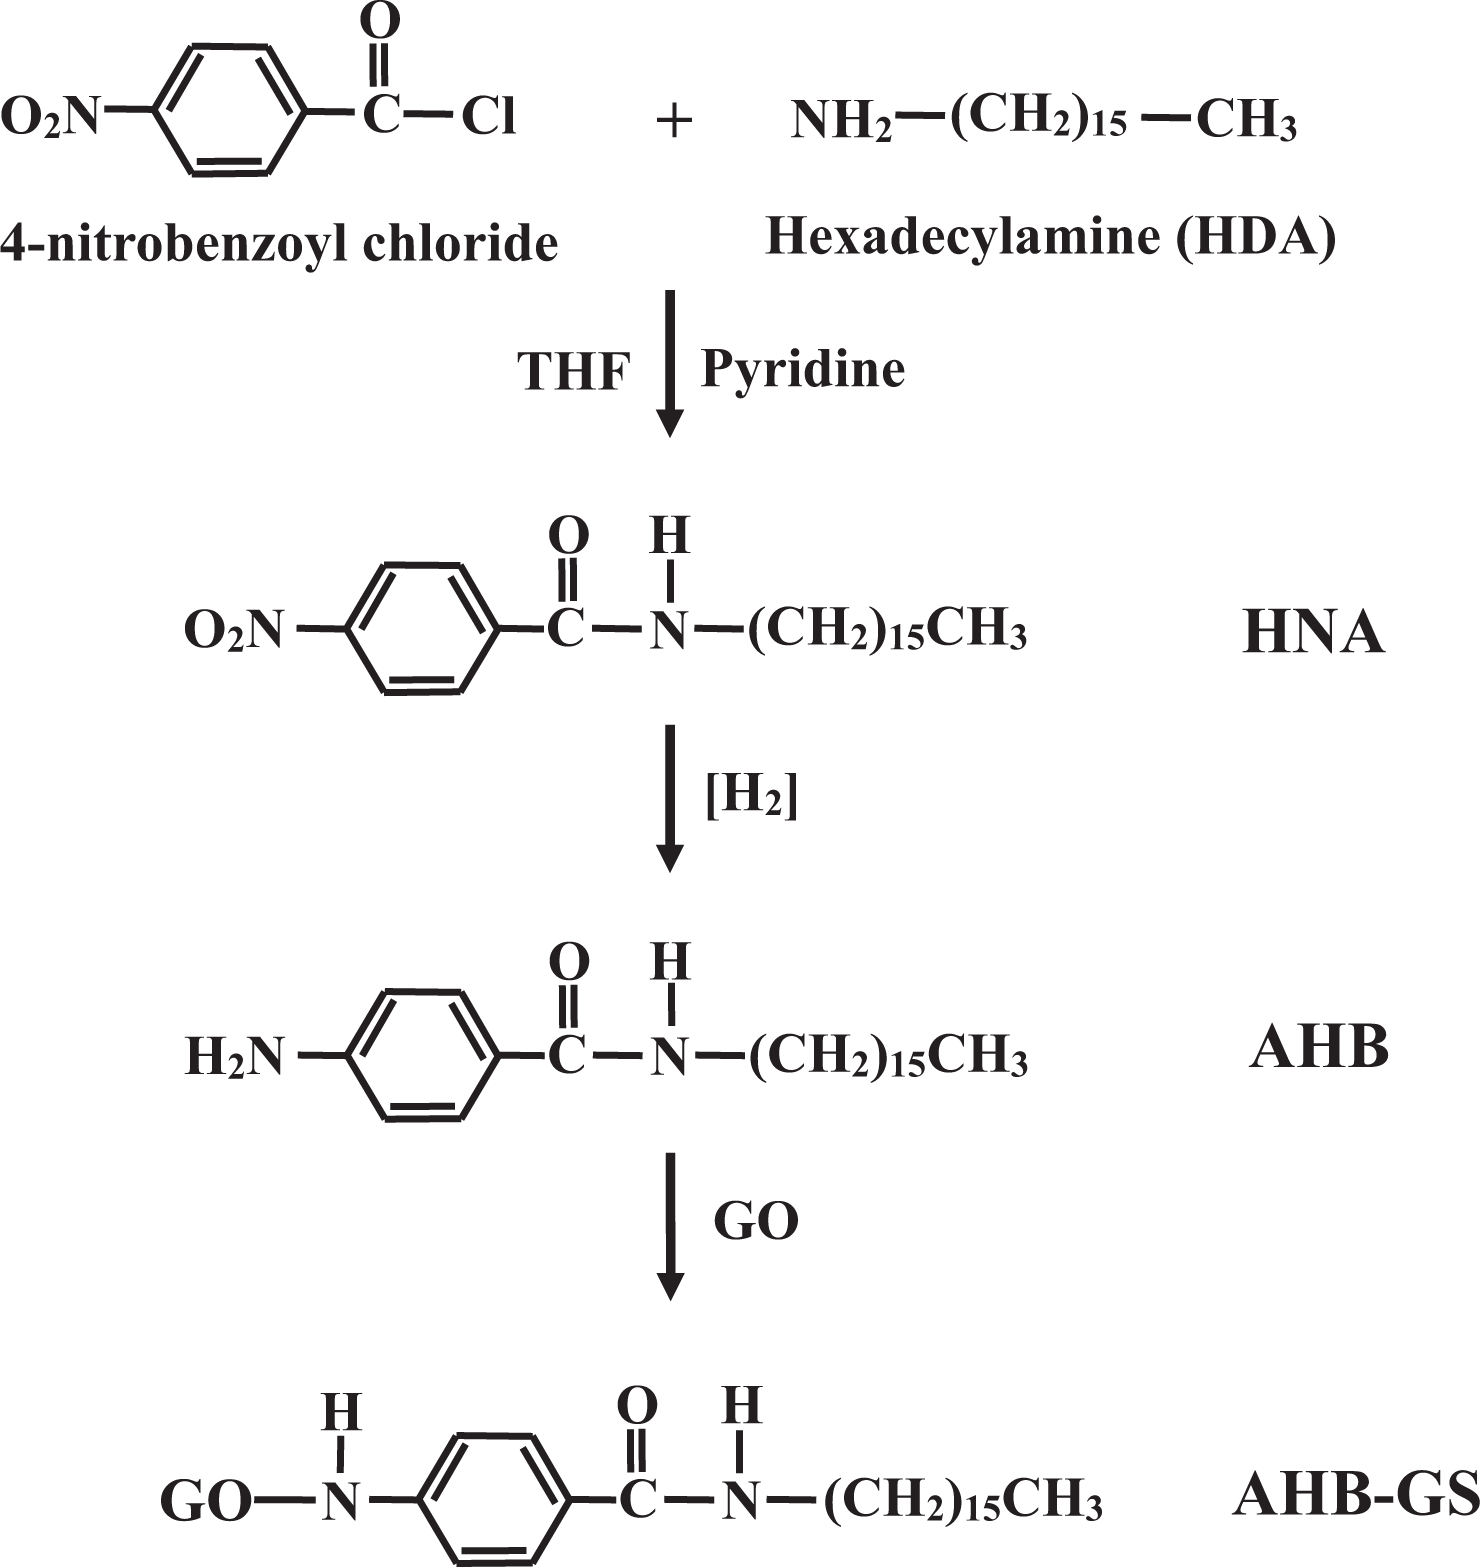
Synthetic route for AHB-GS. AHB-GS: 4-amino-N-hexadecylbenzamide–graphene sheet.
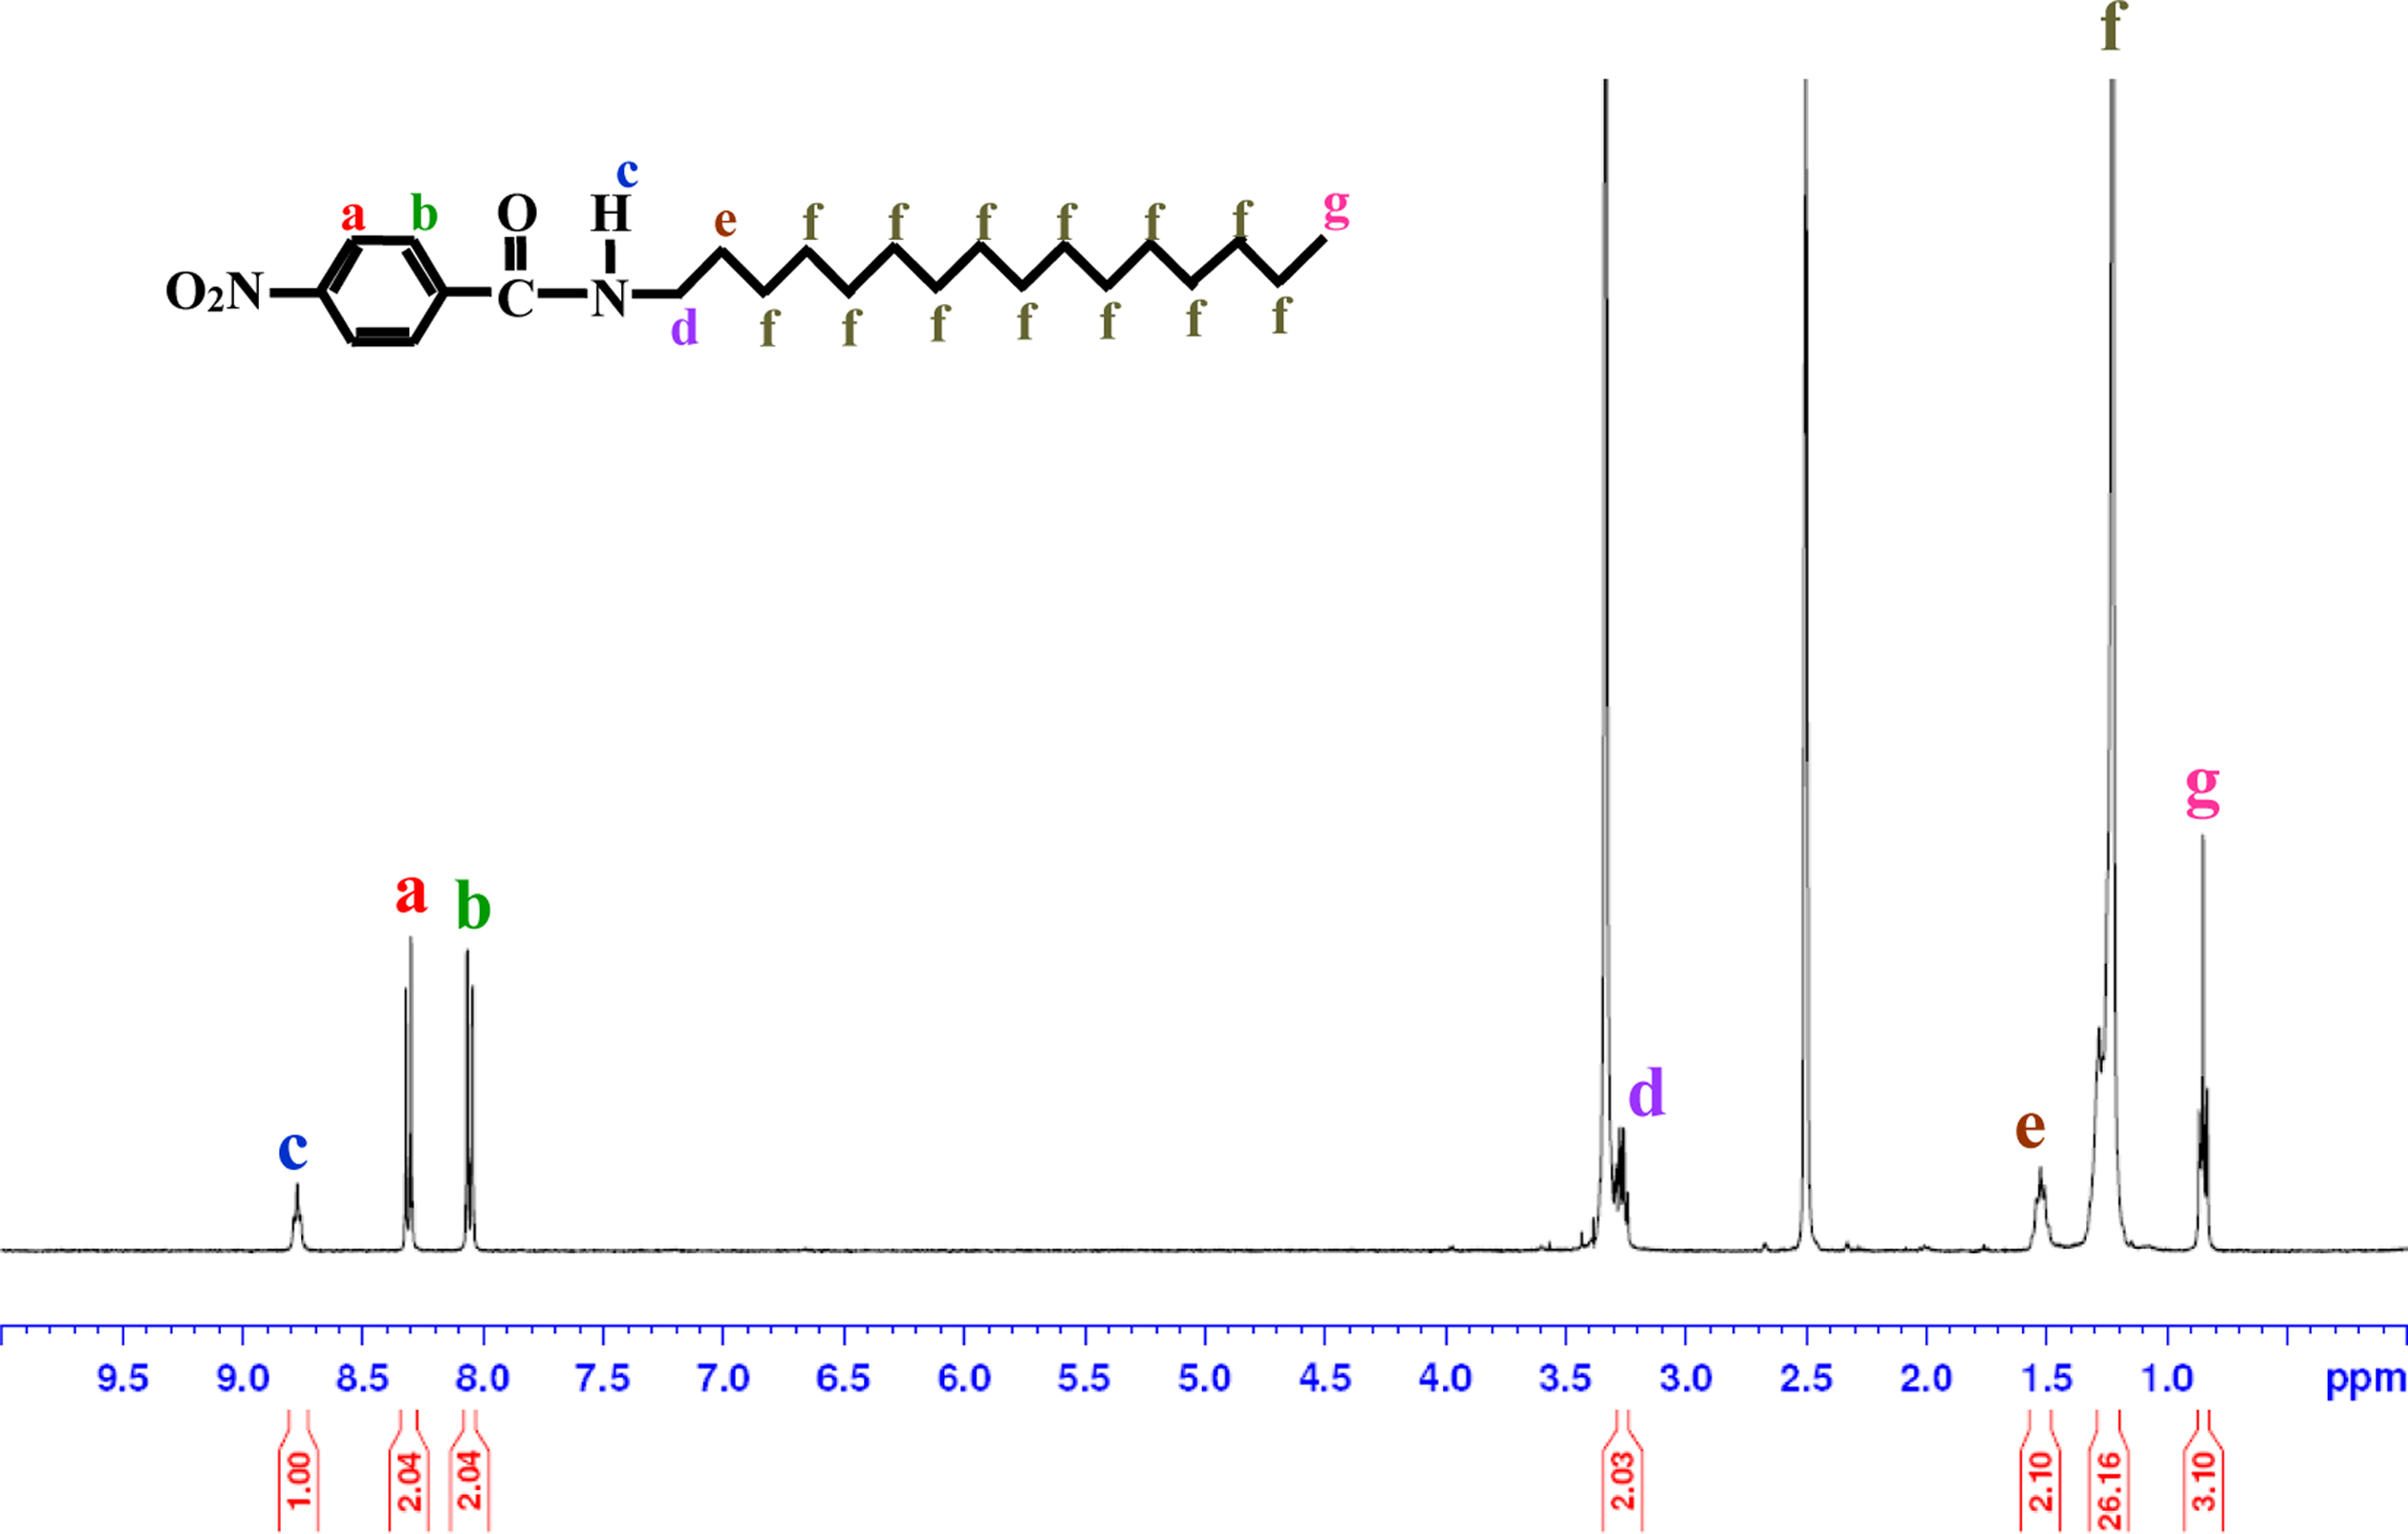
1H-NMR spectrum of HNA. HNA: N-hexadecyl-4-nitrobenzamide; NMR: Nuclear Magnetic Resonance.
FTIR (KBr): ν (cm−1) 3310 (–NH), 2914, 2840 (aliphatic –CH2–), 1640 (–C=O), 1350 (–CN–).
1H-NMR (DMSO–d6): δ (ppm) 8.0–8.5 (m, 4H, Ar–H), 8.5–9.0 (s, 1H, –NH–), 1.0–3.5 (s and l, 30H, –CH2–), 0.5–1.0 (m, 3H, –CH3).
Synthesis of AHB
AHB was synthesized by reducing HNA according to the following procedure: First, HNA (10 g, 2.56 × 10⁻³ mol) was dissolved in THF (1000 mL). Then, Pd/C (10%; 0.27 g, 2.56 × 10⁻² mol) was dissolved in THF (60 mL), after which the resulting solution was added to the HNA/THF mixture, which was stirred vigorously at 25°C for 20 h under hydrogen. The solid product was collected by evaporation. The product was then dried under vacuum at 100°C for 12 h. Formation of the product was confirmed by FTIR (Figure 2(e)) and 1H-NMR (Figure 5) spectroscopies.
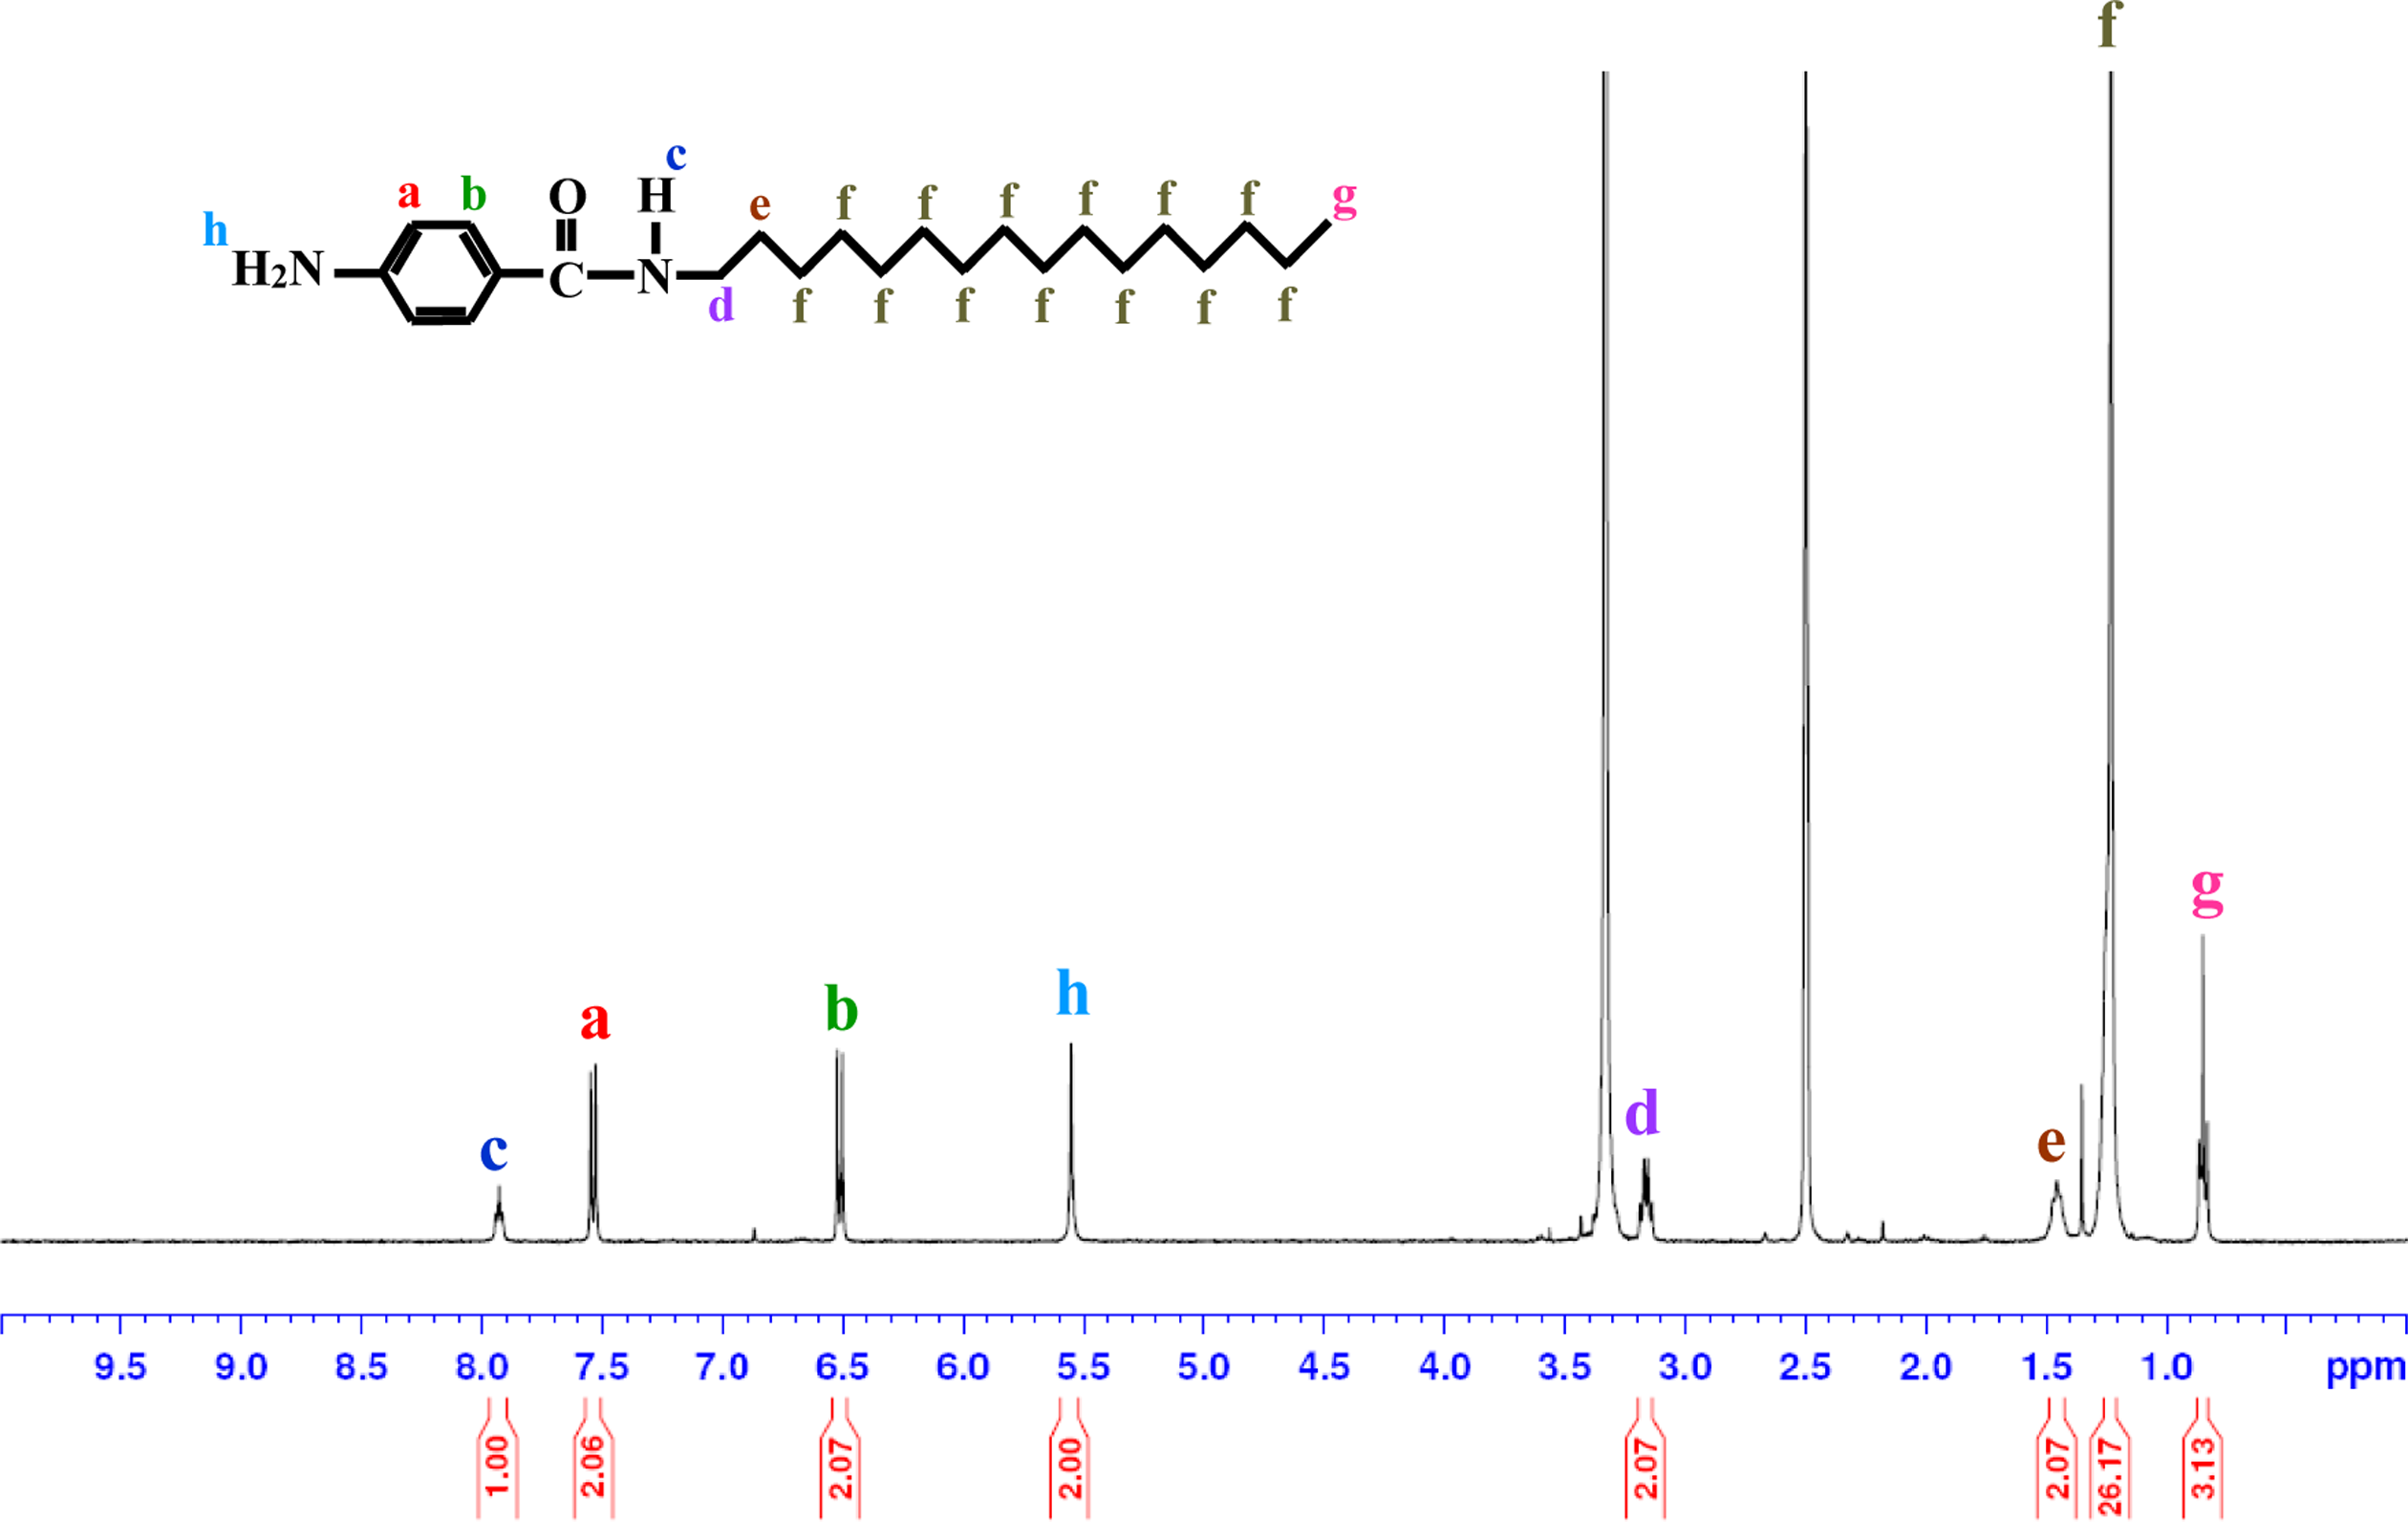
1H-NMR spectrum of AHB. AHB: 4-amino-N-hexadecylbenzamide; NMR: Nuclear Magnetic Resonance.
FTIR (KBr): ν (cm−1) 3440 (–NH2), 3340 (–NH–), 2913, 2850 (aliphatic –CH2–), 1600 (–C=O), 1280 (–CN–).
1H-NMR (DMSO–d6): δ (ppm) 7.5–8.0 (s, 1H, –NH–), 6.5–7.6 (m, 4H, Ar–H), 5.5–6.0 (m, 2H, –NH2), 1.0–3.5 (s and l, 30H, –CH2–), 0.5–1.0 (m, 3H, –CH3).
Synthesis of AHB-GS
AHB-GS was synthesized from AHB and GO according to the following procedure: First, AHB (1.0 g; 2.77 × 10⁻³ mol) was dissolved in ethanol (100 mL), during and after which the mixture was stirred at room temperature under N2. GO (1 g) and phosphotungstic acid (0.5 g) were then dissolved in distilled water (1.5 L) and added to the AHB/ethanol mixture. After the mixture was allowed to react for 12 h at 25°C under N2, it was cooled down to room temperature, washed twice with distilled water and ethanol (v/v = 1:1), and then dried under vacuum at 80°C for 1 day to yield the AHB-GS. Formation of the product was confirmed by FTIR (Figure 2(f)) spectroscopy.
FTIR (KBr): ν (cm−1) 3340 (–NH–), 2910, 2850 (aliphatic –CH2–), 1600 (–C=O), 1266 (–CN–), 1042 (–CO).
Preparation of FGS/PI hybrid films
Poly(amic acid) (PAA) was synthesized from BPA and SDA according to the following procedure: First, BPA (5.79 g, 1.96 × 10⁻² mol) and DMAc (30 mL) were placed in a 250 mL three-necked flask, after which the mixture was stirred at 0°C for 30 min under N2. A solution of SDA (4.21 g, 1.96 × 10⁻² mol) in DMAc (30 mL) was added to the flask, after which the resulting solution was stirred vigorously at 0°C for 1 h, then at 25°C for 23 h, yielding a solution of 16.7 wt% PAA in DMAc.
The PI hybrid films were prepared using the solution intercalation method. The preparation of the hybrid film containing 5 wt% HDA-GS is provided here as a representative example: First, in a 100 mL beaker, PAA (10 g) was added to DMAc to yield a 12 wt% solution. In a separate beaker, HDA-GS (0.52 g) was ultrasonicated in DMAc (100 mL) for 7 h; this mixture was then added to the PAA solution. The resulting mixture was vigorously stirred for 18 h at room temperature under N2 to yield a homogeneous dispersion. The resulting solution was cast onto glass plates, and the solvent was stabilized at 50°C for 1 h. The films were then dried in a vacuum oven, first at 70°C for 1 h and then at 80°C for 1 h. The PAA film was then further imidized by sequential heating at 110, 140, 170, 200, 230, and 250°C for 30 min at each temperature. The resulting films were 60–70 μm thick. Table 1 lists the thermal imidization conditions used in the preparation of the hybrid films. The synthetic route for PI hybrid film synthesis is shown in Figure 6.
Heat treatment conditions for PAA and PI hybrid films.
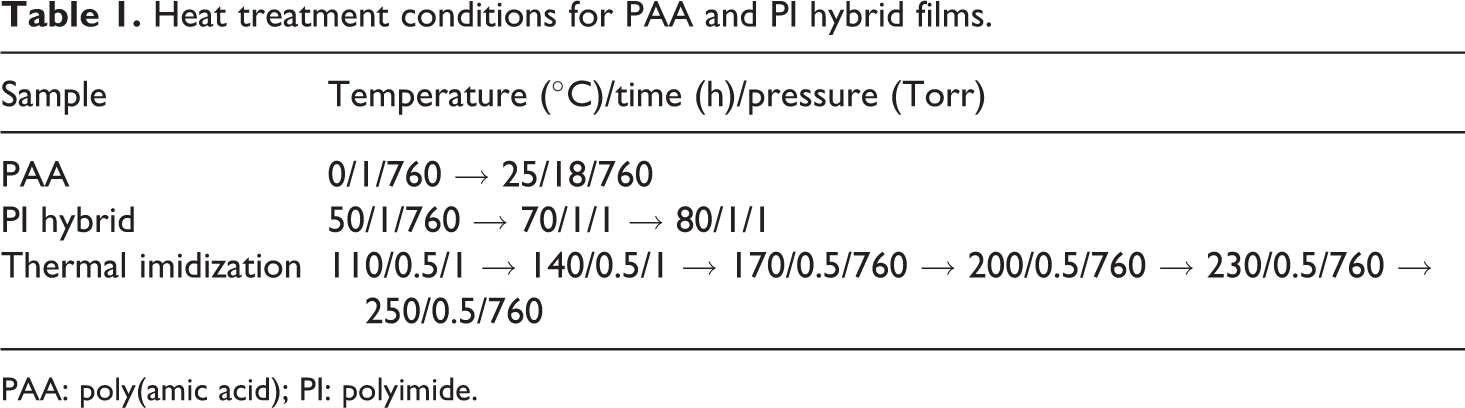
PAA: poly(amic acid); PI: polyimide.
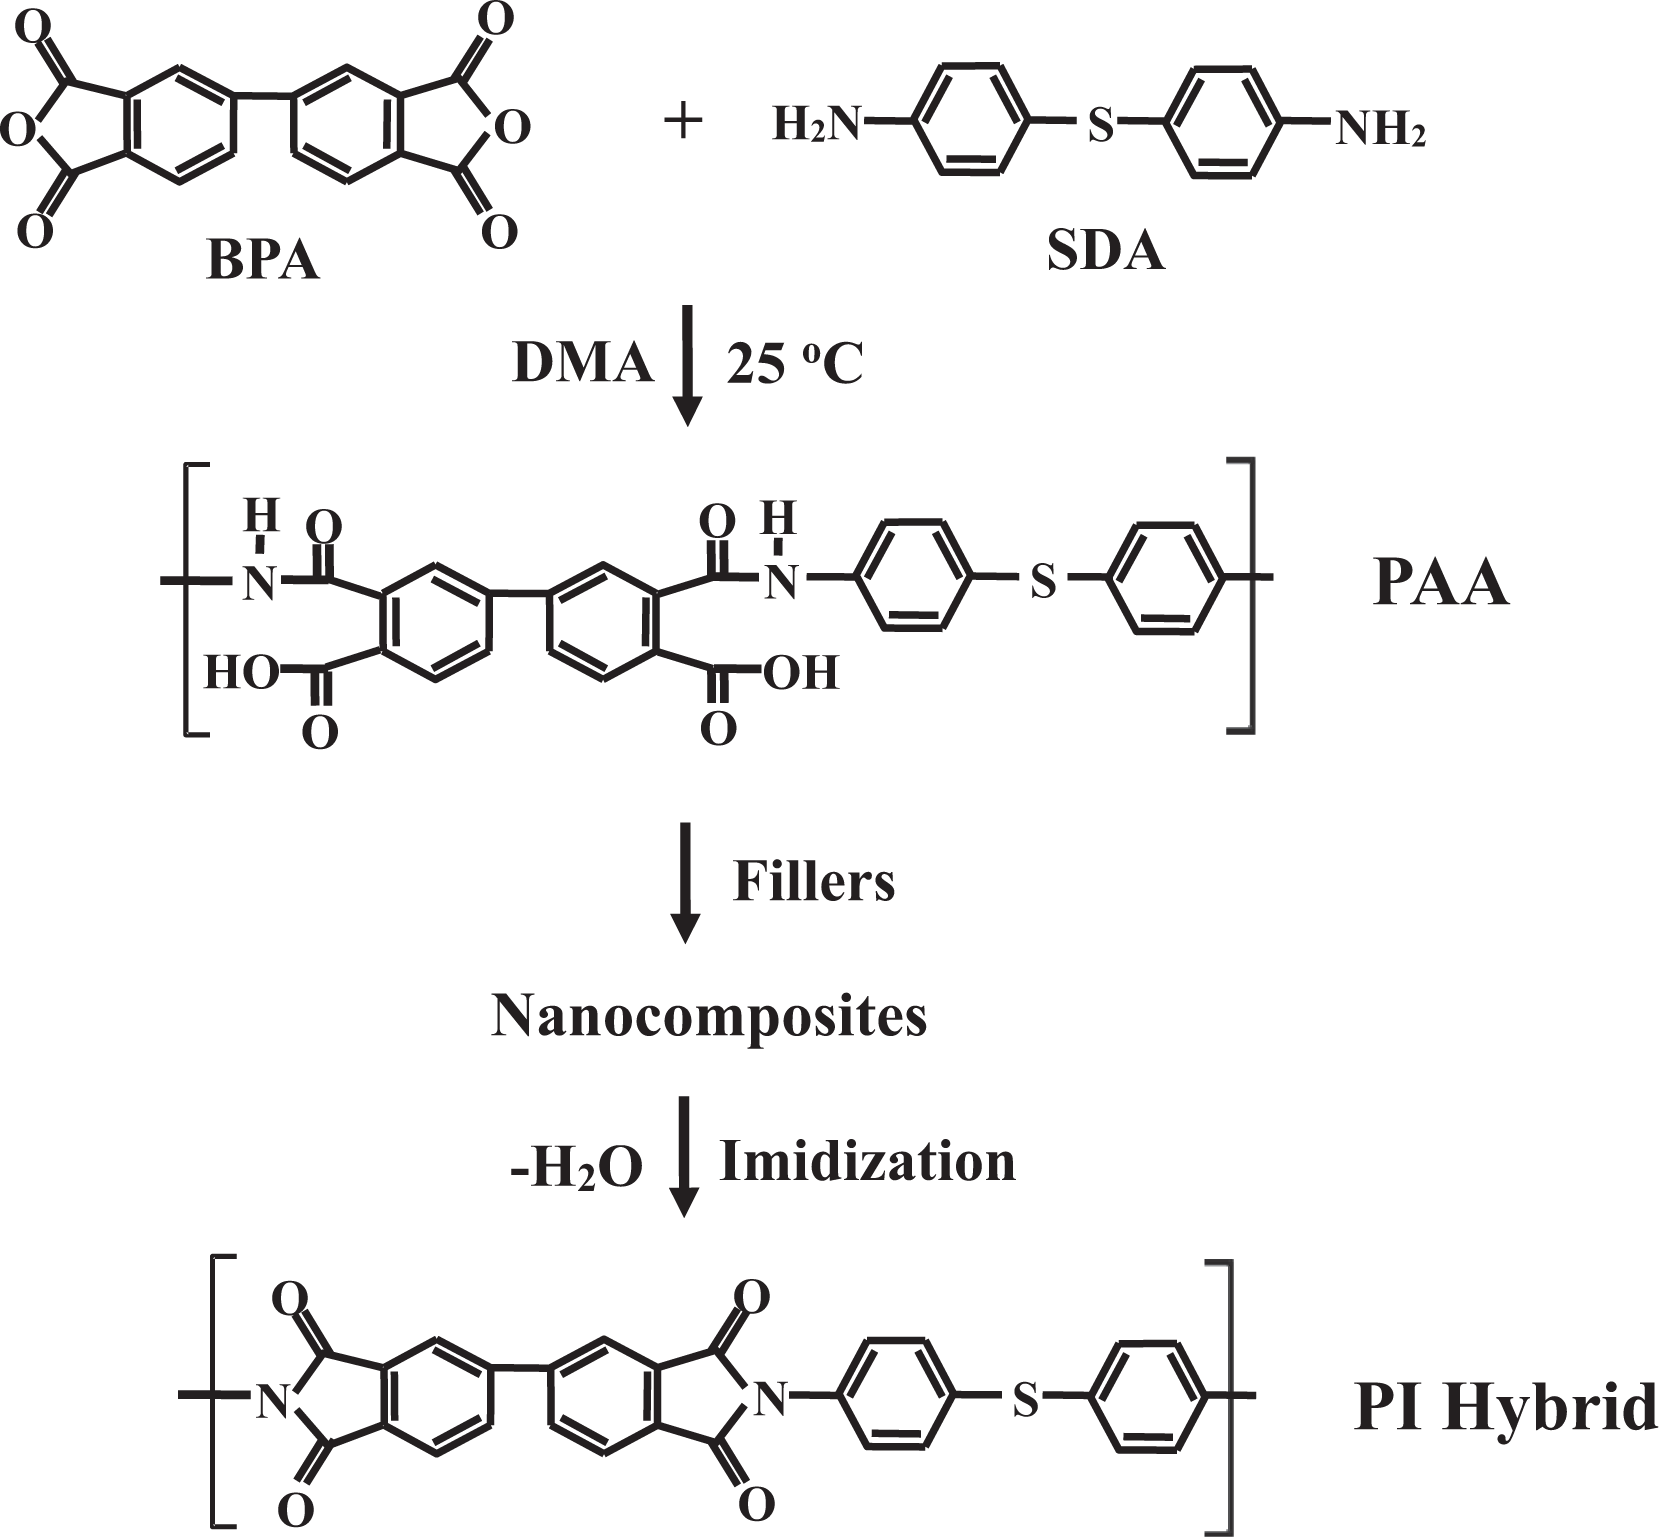
Synthetic route for PI hybrids. PI: polyimide.
We attempted to synthesize a hybrid film containing more than 10 wt% FGS. However, repeated attempts to polymerize the 15 wt% FGS hybrid films failed because of the bubbles produced in the polymerization reactor. No fixing tools were used to orientate the glass plate during heat treatment because orientation is known to influence film characteristics, including thermal properties, gas permeability, and morphology.
Characterization
FTIR spectra were obtained for samples in KBr pellets using an FTIR 460 (JASCO) instrument over a range 4000–600 cm−1. 1H-NMR spectra were obtained using a Bruker DPX 400 MHz NMR spectrometer, referenced to tetramethylsilane. Atomic force microscopy (AFM; Multimode, NanoScope III, Digital Instruments Inc., Milano, Italy) images were taken on an AutoProbe CP/MT scanning probe microscope. GO and FGSs were dispersed in water and toluene, respectively. The suspensions were ultrasonicated for 3 h and then spin-coated at 5000 r/min onto silicon wafers. Wide-angle X-ray diffraction (XRD) measurements were performed at room temperature on a Rigaku (D/Max-IIIB) X-ray diffractometer using Ni-filtered Cu–Kα radiation; the scanning rate was 2°/min for an angle of 2θ = 2°–10°.
The morphologies of the fractured surfaces of the extruded samples were investigated using a Hitachi S-2400 scanning electron microscope (SEM). To enhance their conductivity, the fractured surfaces were sputtered with gold using an SPI sputter coater. The transmission electron microscopy (TEM) images of the ultrathin sections of the hybrid films were obtained on a Leo 912 Omega TEM using an acceleration voltage of 120 kV.
Differential scanning calorimetry (DSC; NETZSCH F3, Munchen, Germany) and thermogravimetric analyses (TGA; TA Q500) were performed at a heating rate of 20°C/min under N2. The coefficients of thermal expansion (CTE) of the samples were measured with a macroexpansion probe (TMA 2940), which was used to apply an expansion force of 0.1 N to the films at a heating rate of 5°C/min over a temperature range 50–200°C.
The O2 transmission rates (O2TRs) of the films were measured according to the ASTM E96 method using a Mocon DL 100 instrument (Minneapolis, USA). The O2TRs were obtained at 23°C, 0% relative humidity, and 1 atm pressure. The electrical conductivities of the hybrid films were measured at room temperature using a four-probe method. The samples were obtained by cutting hot-pressed hybrid films of approximately 1 mm thickness into 40 × 40 mm squares. The results were obtained at 23°C and 1 atm.
Results and discussion
FGS morphology
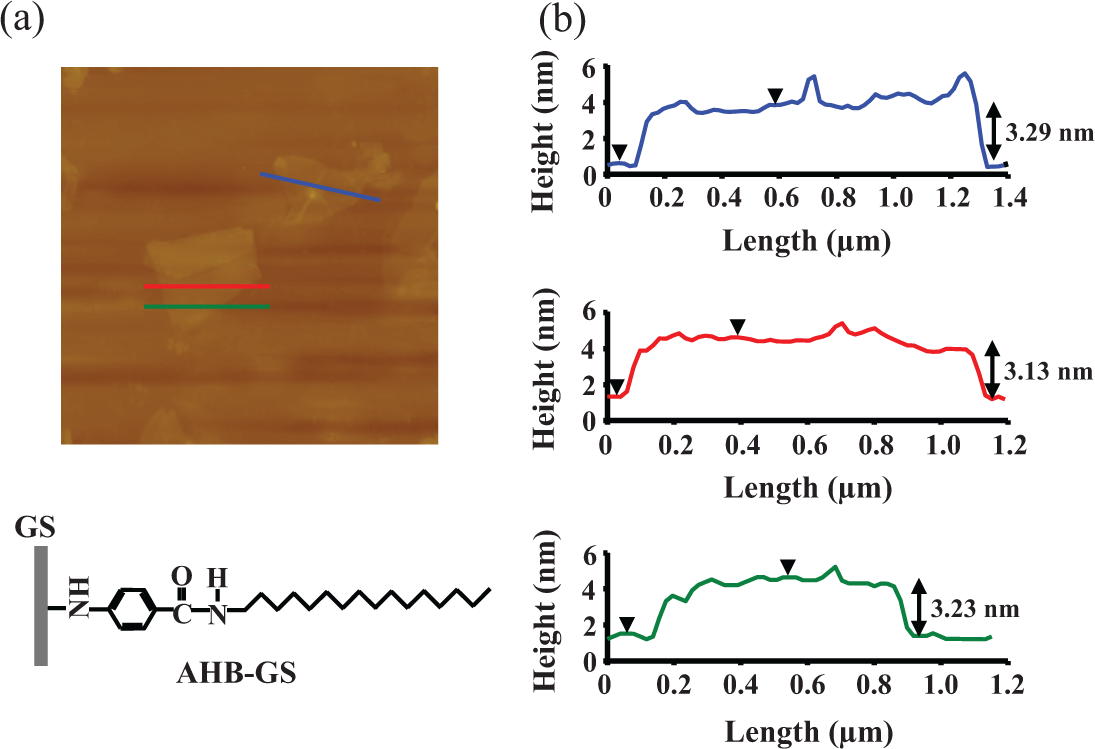
AFM was used to show that the carbon sheets obtained comprised only a single atomic layer. Figure 7 shows the AFM image of an HDA-GS on mica, with accompanying profile plots showing the average sheet thickness to be approximately 1.76 nm. The theoretical thickness of a GS functionalized on both sides is approximately 5.04 nm; this value assumes that the thickness of the bare GS is about 1 nm14 and that one layer of the substituted HDA organic groups is, aligned vertically, about 2.02 nm thick (Figure 8(a)). 17 However, experimental data suggest that the hexadecyl moieties on the HDA groups project at an angle from both sides of the GS, resulting in layers that are only 0.38 nm thick (Figure 8(b)).
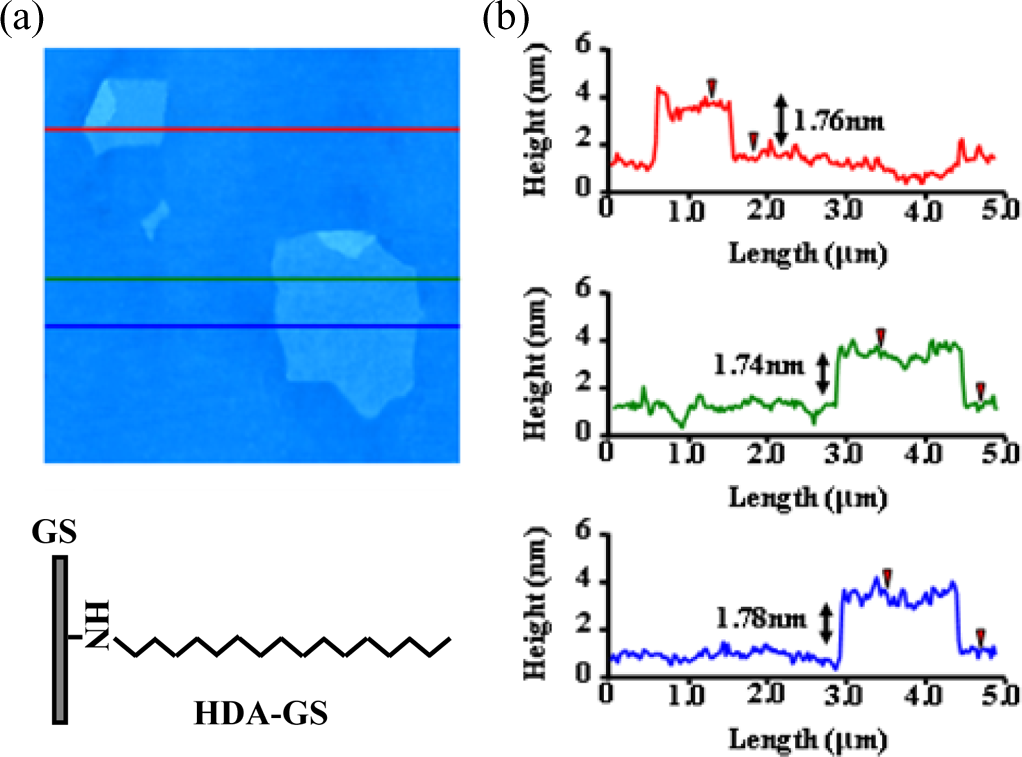
Non-contact-mode AFM image of HDA-GSs with three height profiles obtained at different locations. AFM: atomic force microscopy; HDA-GSs: hexadecylamine–graphene sheets.
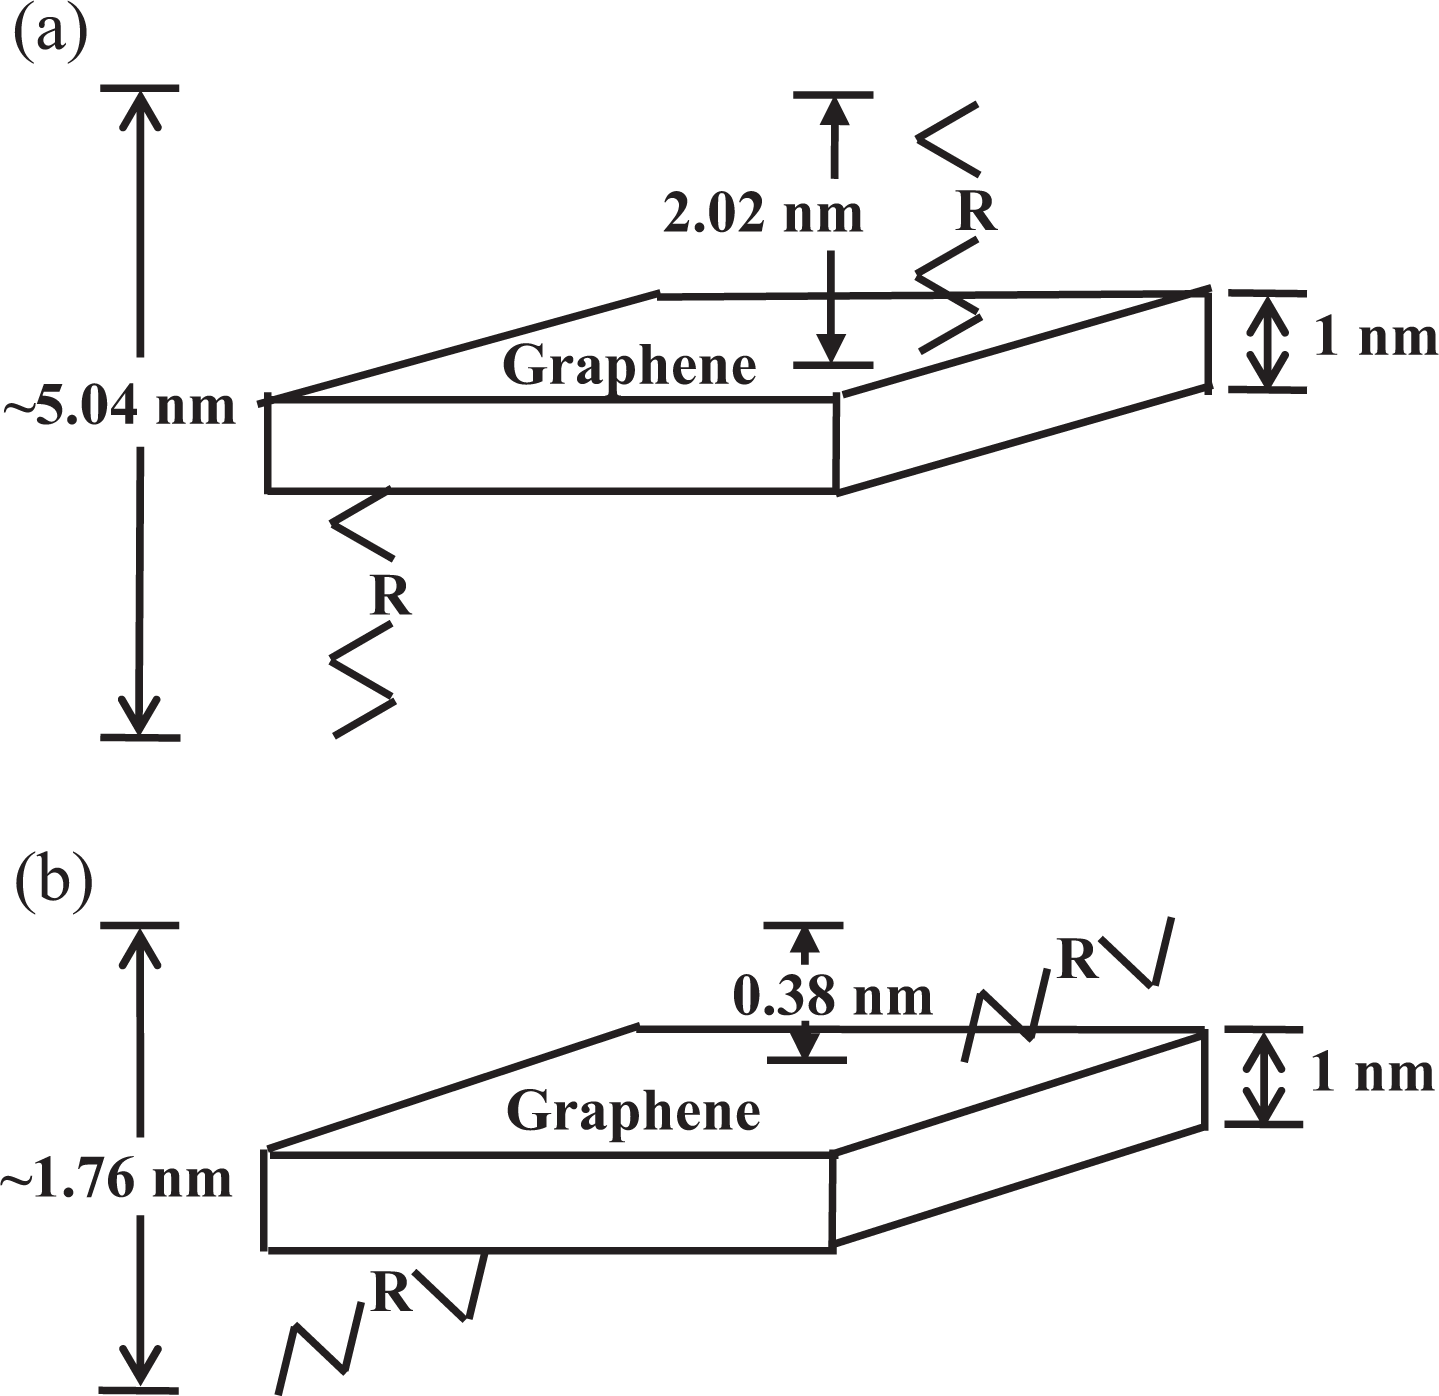
Layers observed in HDA-GSs: (a) theoretical values for R-groups vertically aligned to the GS and (b) experimental values. HDA-GSs: hexadecylamine–graphene sheets; GS: graphene sheet.
Figure 9 shows the AFM image of an AHB-GS on mica, with accompanying profile plots showing the average sheet thickness to be approximately 3.21 nm. The theoretical thickness of a GS functionalized on both sides is approximately 6.24 nm, again assuming a bare GS thickness of about 1 nm and vertically aligned AHB groups, resulting in layers that are about 2.62 nm thick (Figure 10(a)). 17 Experimental data again suggest angular projection of the organic chains, resulting in AHB layers that are only about 1.11 nm thick (Figure 10(b)). The AHB groups likely form thicker layers due to the rigidity of the AHB aromatic amide when compared to the flexible HDA alkyl chains.
Non-contact-mode AFM image of AHB-GSs with three height profiles obtained at different locations. AFM: atomic force microscopy; AHB-GSs: 4-amino-N-hexadecylbenzamide–graphene sheets.
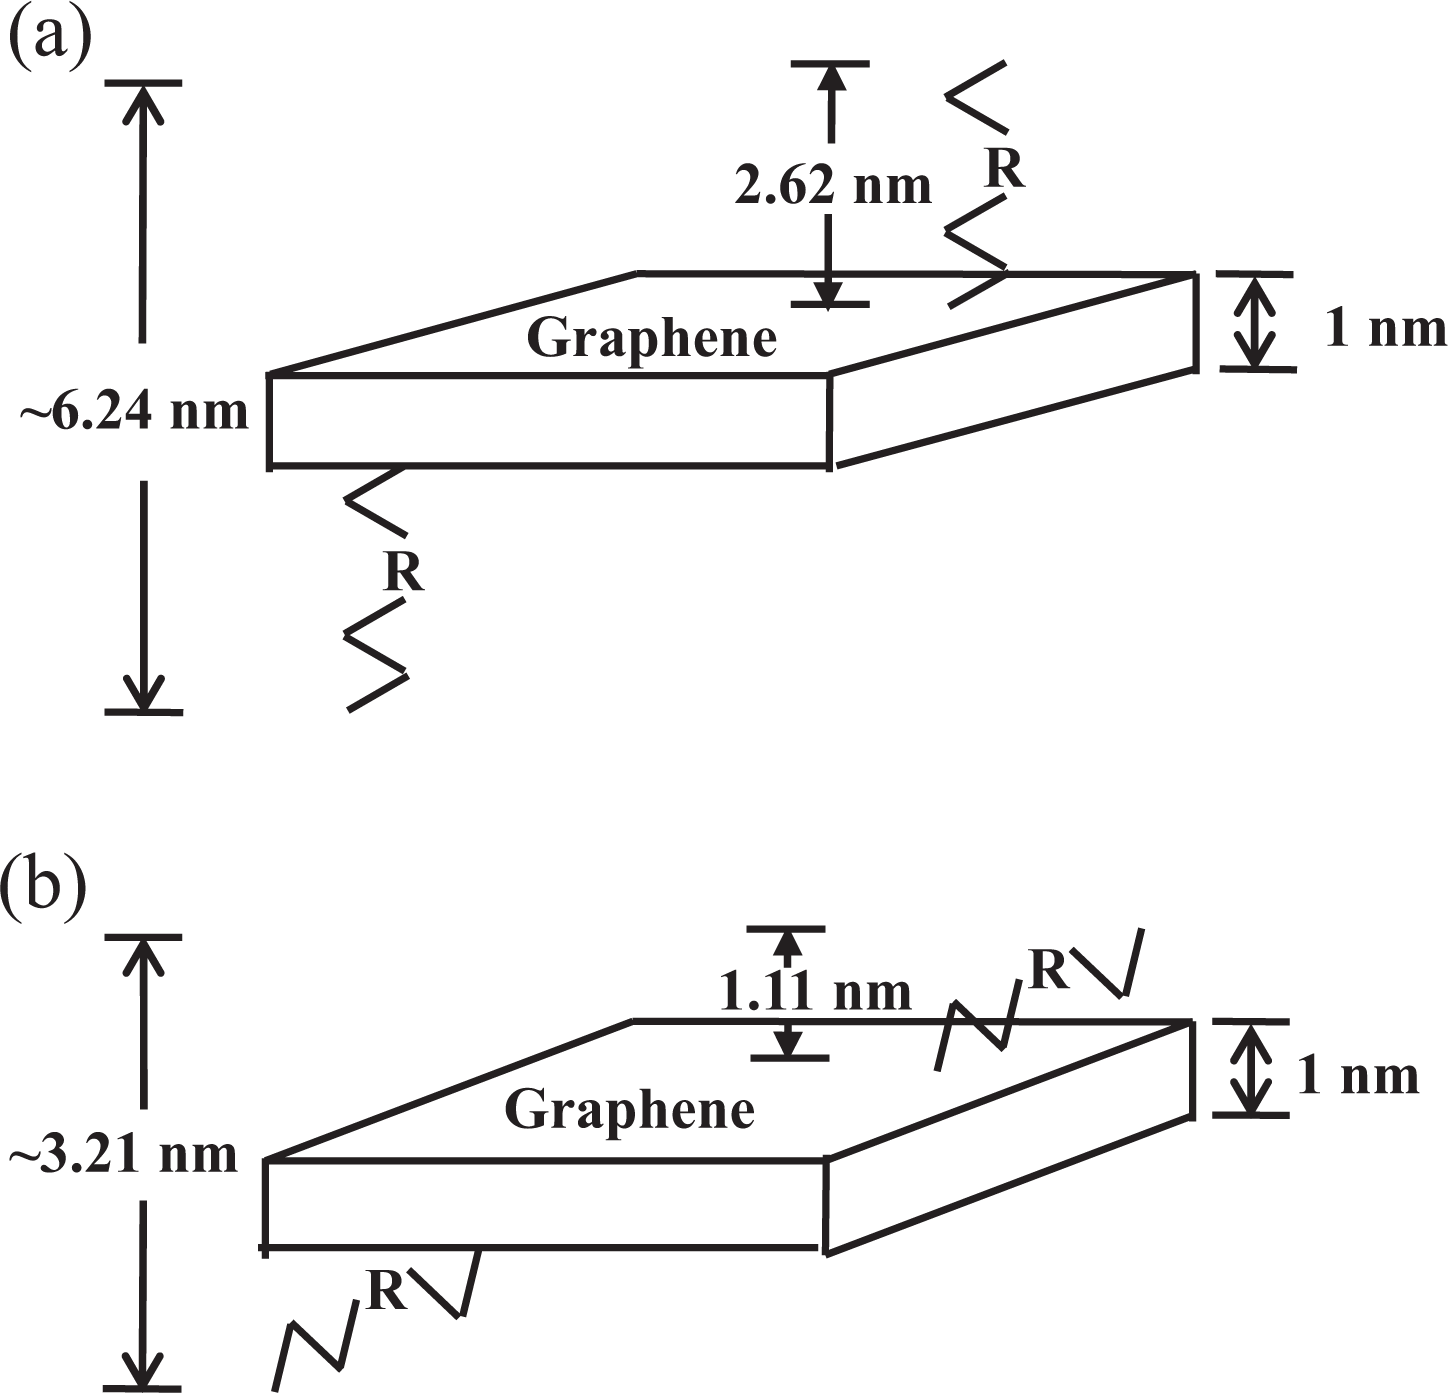
Layers observed in AHB-GSs: (a) theoretical values for R-groups vertically aligned to the GS and (b) experimental values. AHB-GSs: 4-amino-N-hexadecylbenzamide–graphene sheets; GS: graphene sheet.
The SEM images of unmodified natural graphite, GO, and the synthesized FGSs are shown in Figure 11. Natural graphite exhibits a lamellar structure of GSs, with denser stacks when compared to those of the other materials. On the other hand, GO sheets are translucent and are wrinkled and folded over each other. Both HDA-GS and AHB-GS exhibit an entangled, wrinkled morphology with a random distribution.
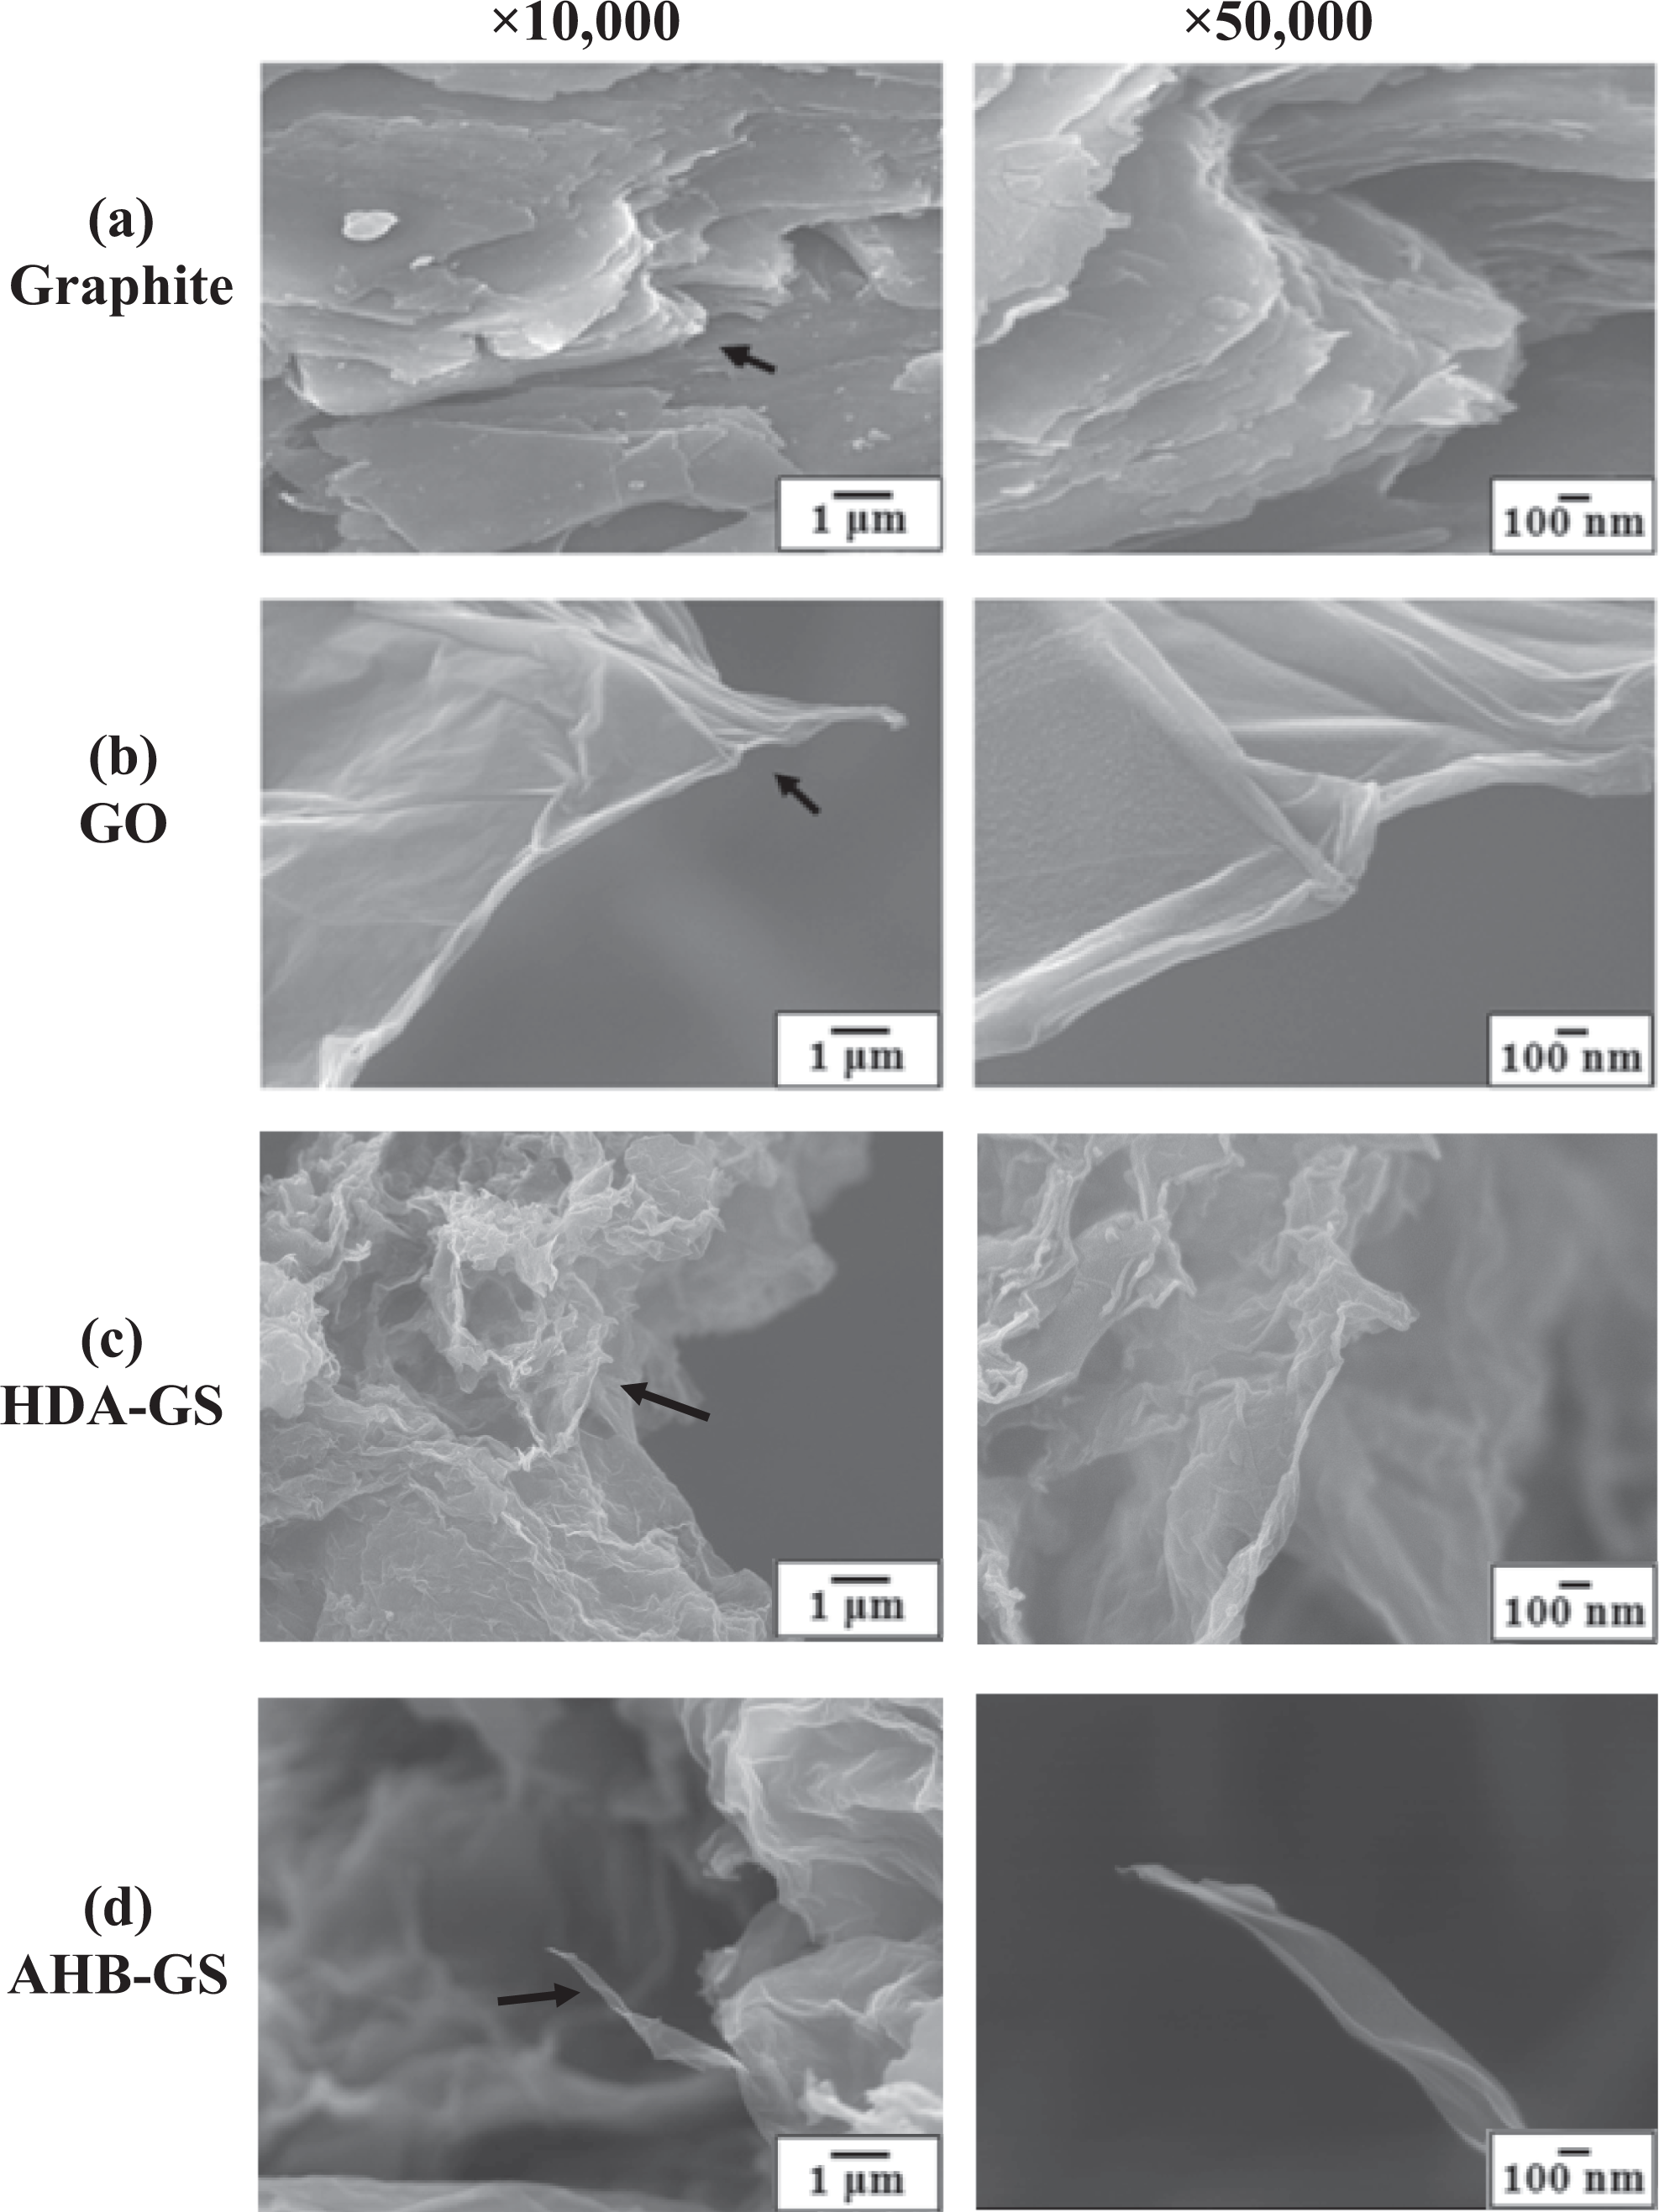
FE-SEM micrographs of (a) graphite, (b) GO, (c) HDA-GS, and (d) AHB-GS at magnifications of ×10,000 and ×50,000. GO: graphene oxide; HDA-GSs: hexadecylamine–graphene sheets; AHB-GSs: 4-amino-N-hexadecylbenzamide–graphene sheets; SEM: scanning electron microscope; FE: Field Emission.
In general, dramatic volume expansion and high porosity were observed in FGS samples, resulting in low FGS bulk densities that caused feed problems during melt compounding. Normally, master batches are required to solve this problem; nonetheless, solution blending was successfully employed here.
FTIR analysis of PI hybrid
The formation of PAA and complete imide formation from amic acid were confirmed using FTIR; the spectra of the obtained PAA and PI are shown in Figure 12. PAA exhibited a broad absorption band around 2800–3400 cm−1, attributed to the O–H stretch of the carboxylic acid. Meanwhile, the C=O stretching peaks at 1711 cm−1 and 1590 cm−1 were attributed to the acid and amide groups, respectively. These peaks shifted to higher frequencies in the imides, specifically to about 1775 cm−1 and 1717 cm−1 for C=O in phase and C=O out of phase, respectively. In addition, the presence of a feature at 1356 cm−1 corresponding to the C–N–C stretch confirmed imide formation.
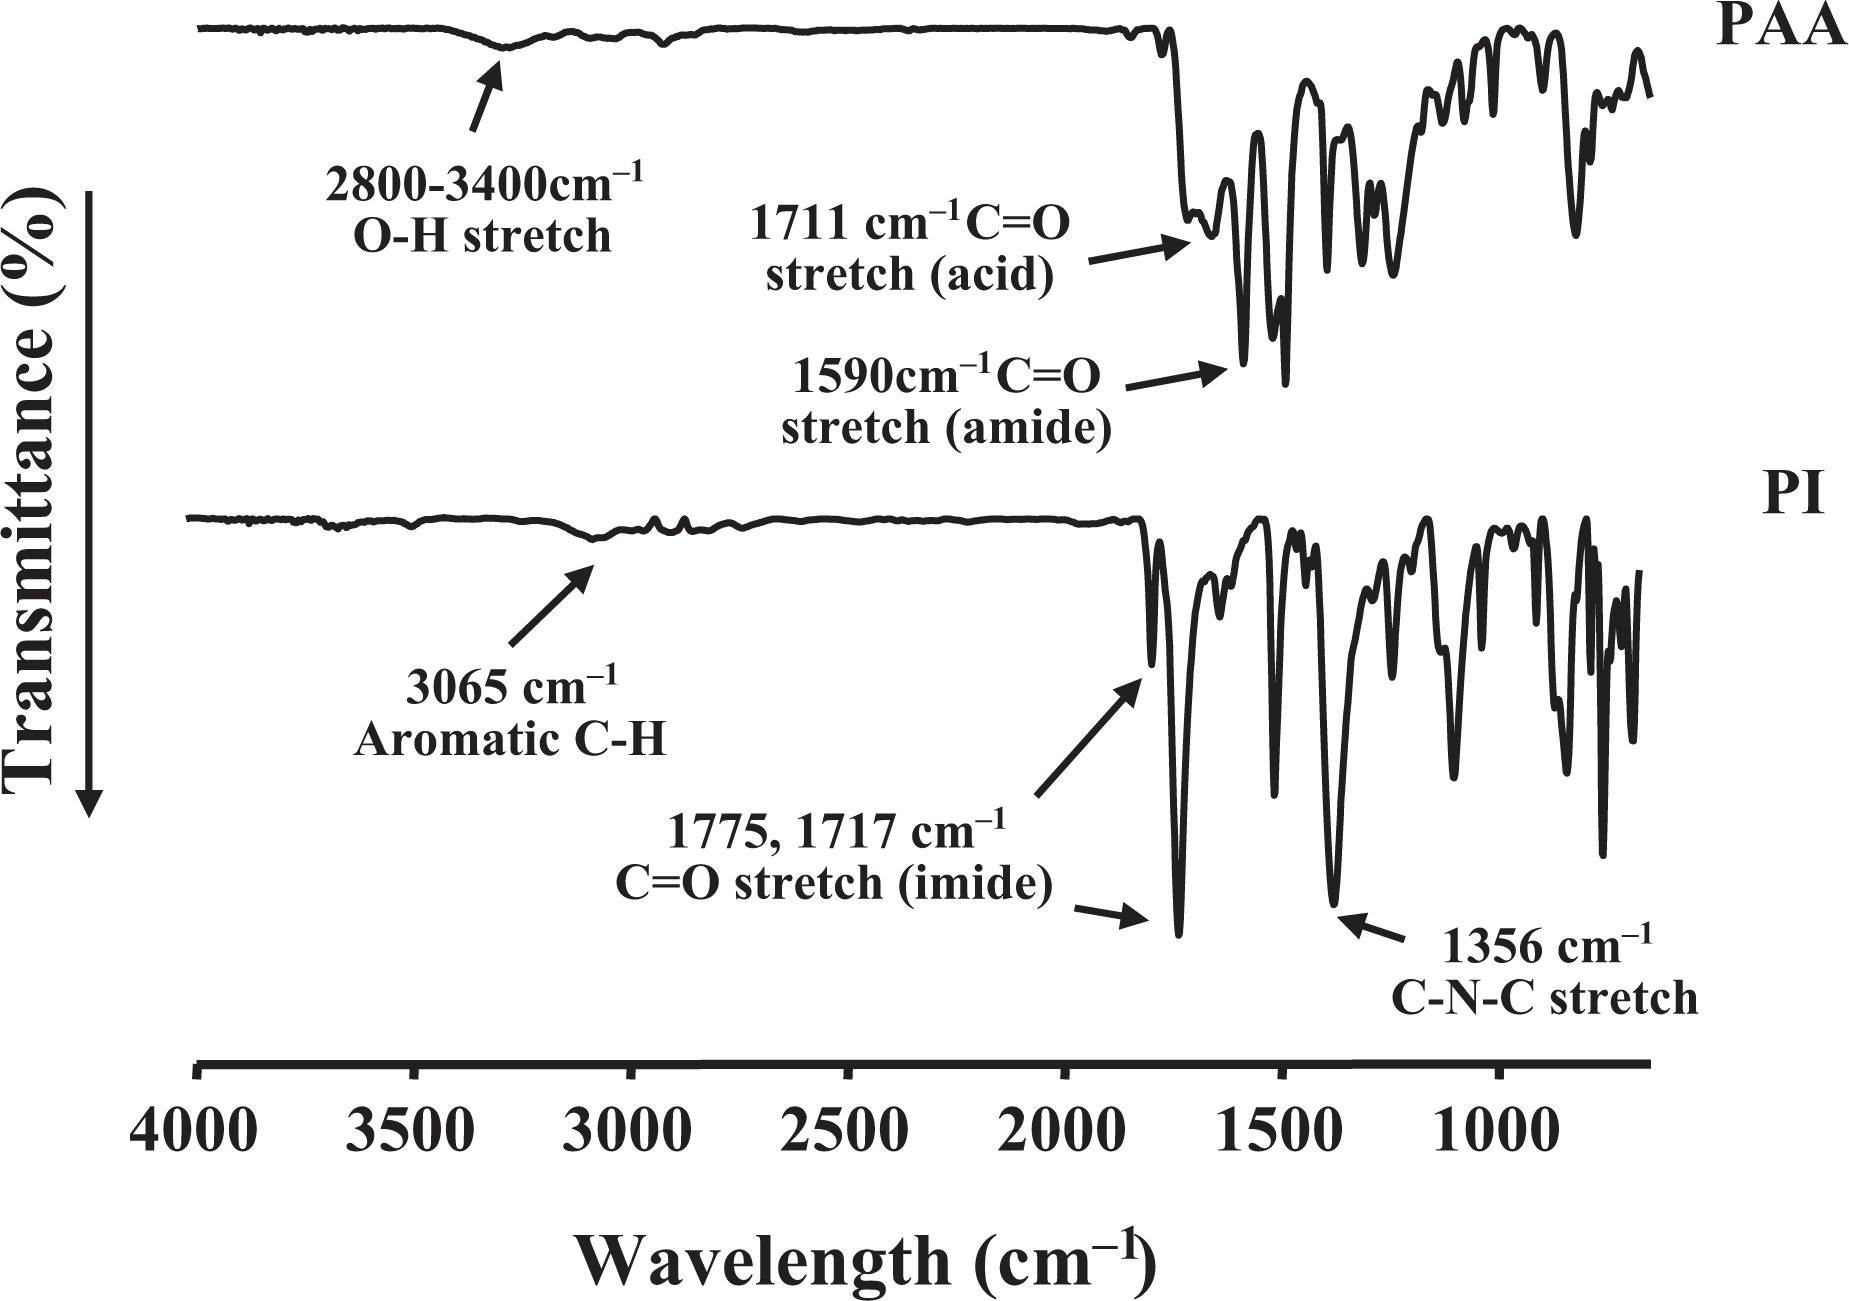
FTIR spectra of PAA and PI. FTIR: Fourier transform infrared; PAA: poly(amic acid); PI: polyimide.
Dispersion
XRD traces of the two FGSs, pure PI, and PI hybrid films for an angle of 2θ = 2°–10° are shown in Figure 13. The d 001 reflection for the HDA-GS sample was observed at 2θ = 2.73°, which corresponds to an interlayer spacing (d) of 32.32 Å. However, the GS peak at 2θ = 2.73° disappeared from the diffraction pattern for all HDA-GS hybrid films tested. This result indicates that the graphene layers were exfoliated and homogeneously dispersed throughout the PI matrix, providing supplementary evidence that the HDA-GS/PI hybrids formed nanocomposites. Meanwhile, the d 001 reflection for the AHB-GS sample was observed at 2θ = 3.40°, 5.10°, and 8.90°, which corresponded to interlayer distances of 26.0 Å, 17.3 Å, and 9.19 Å, respectively. No obvious graphene peaks were present in the XRD curves of any of the hybrids, again suggesting nanocomposite formation.
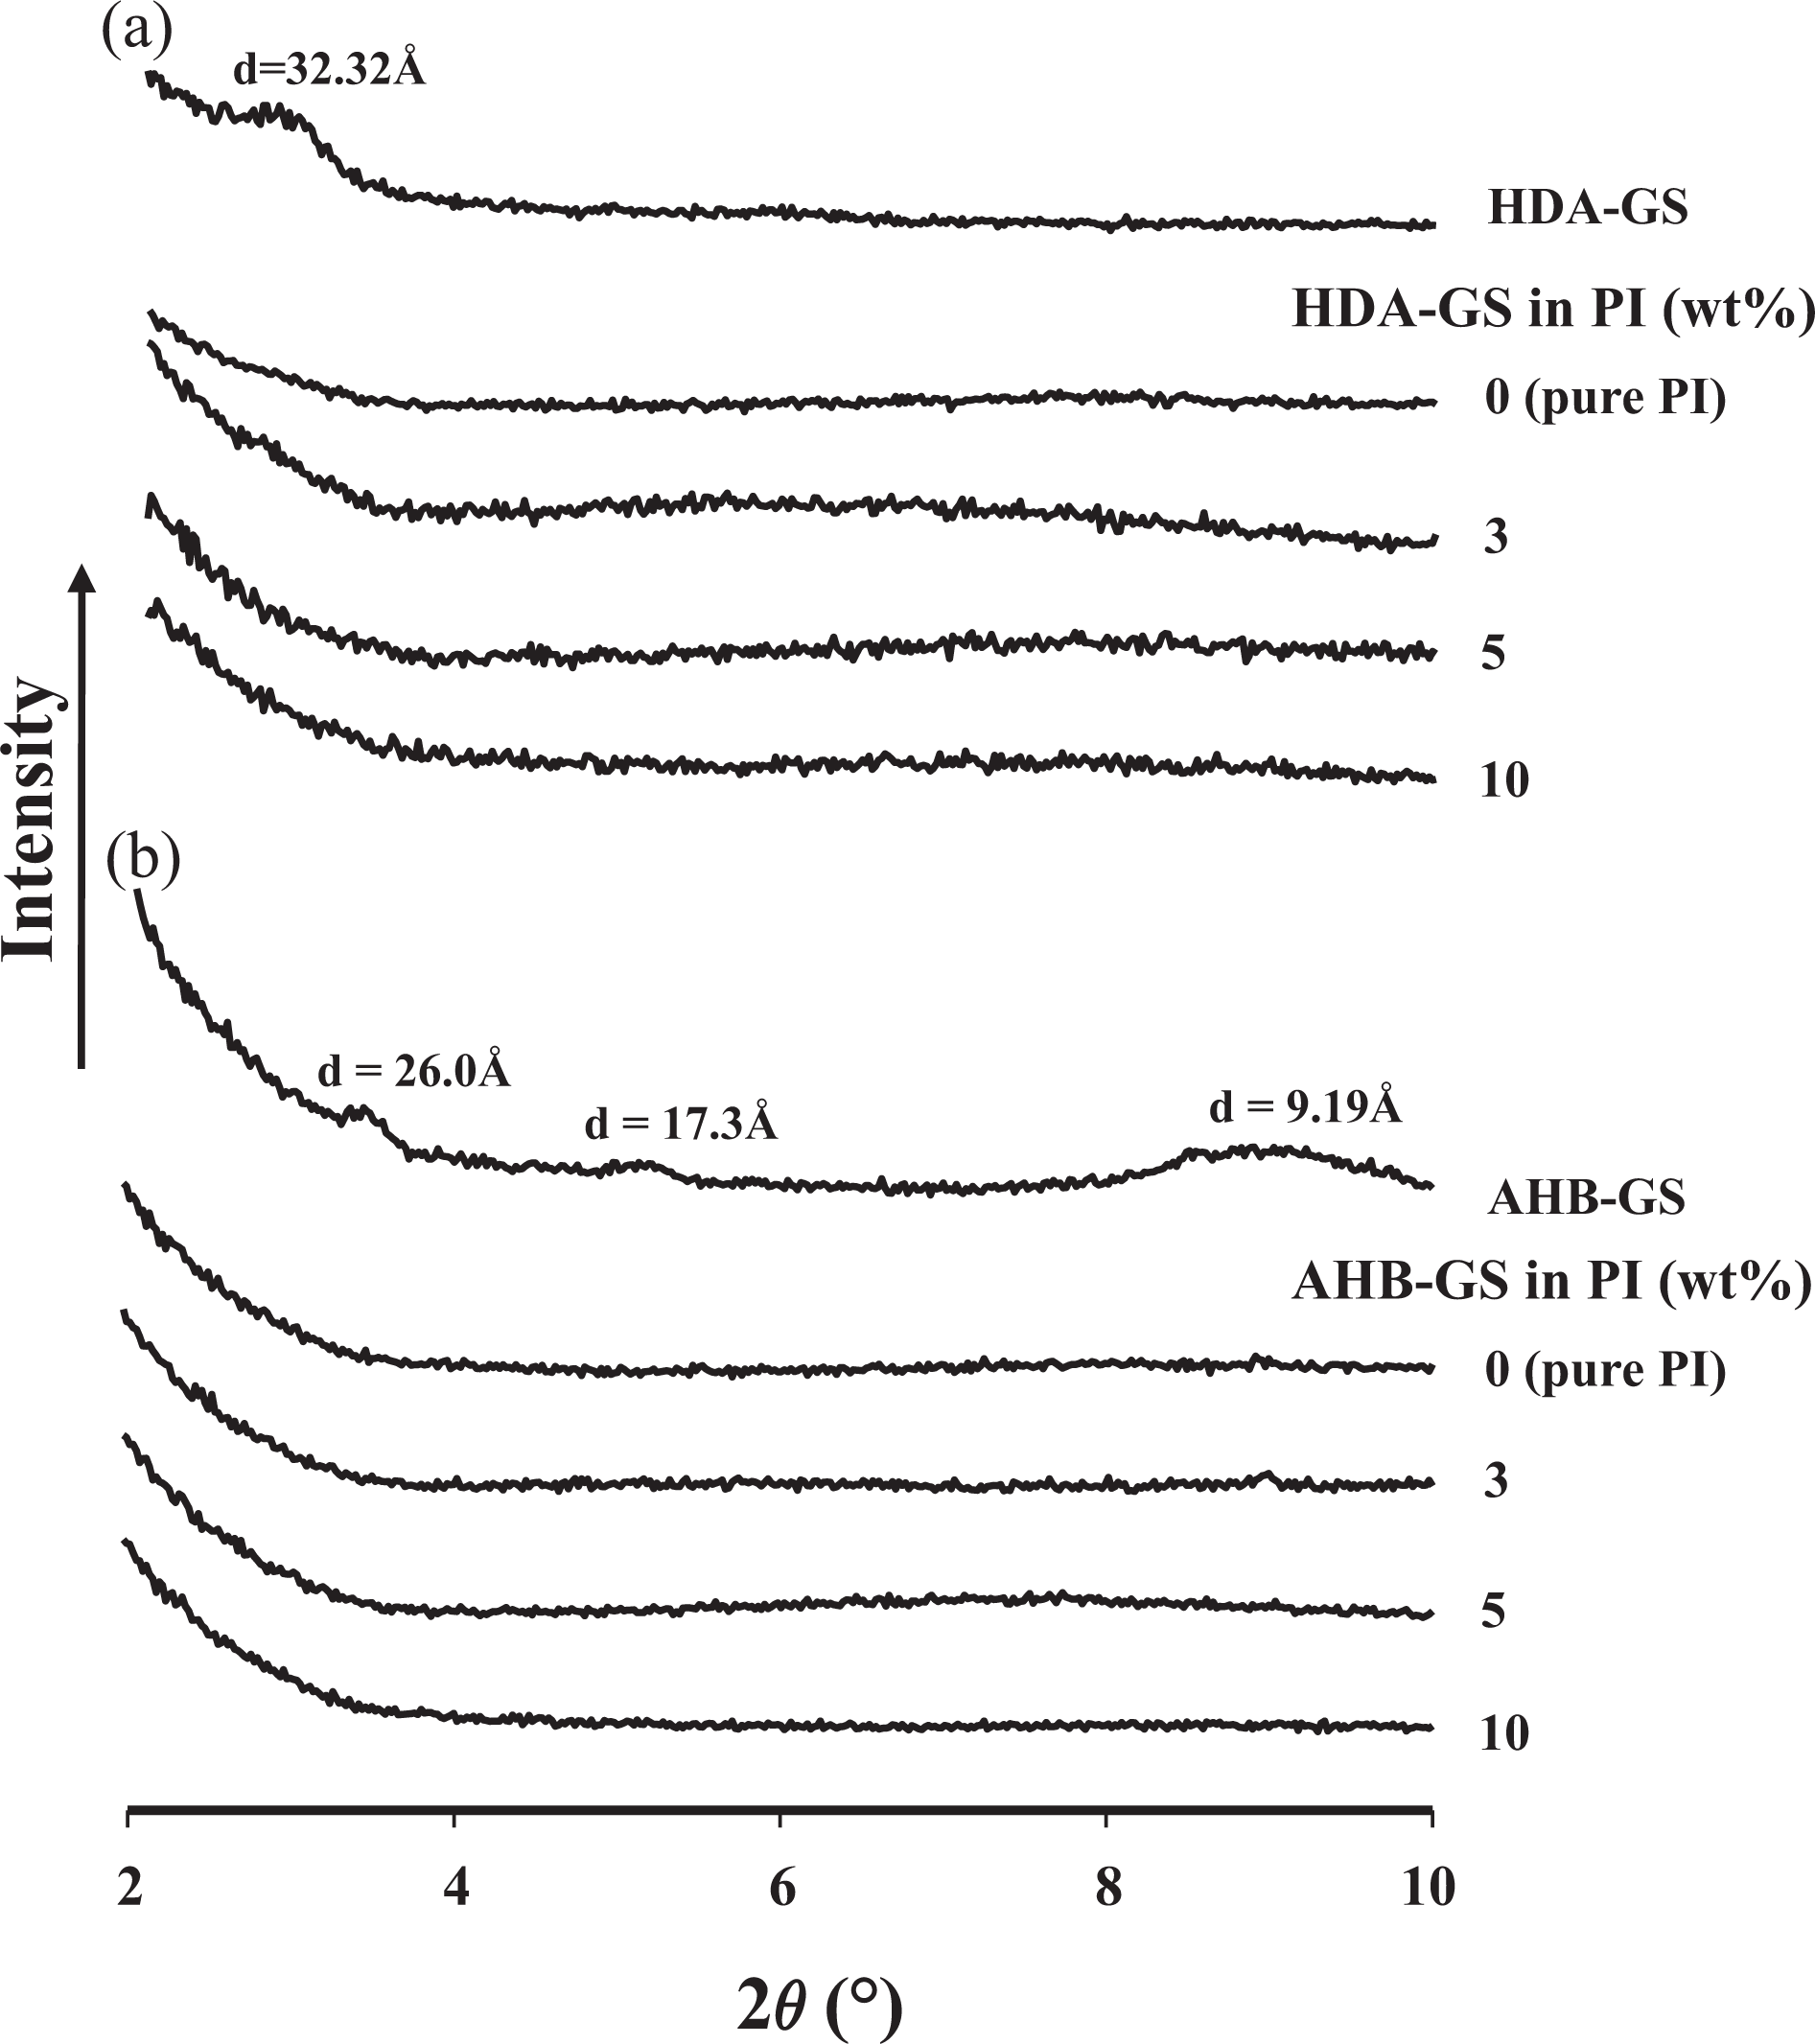
XRD patterns for pure FGSs and PI hybrids with varying FGS content. XRD: X-ray diffraction; FGSs: functionalized graphene sheets; PI: polyimide.
Although XRD enables precise measurement of GS layer spacings, it does not allow for the determination of spatial distributions or for the detection of inhomogeneous sections. Additionally, because some layered GSs do not initially exhibit well-defined basal reflections, peak broadening and reductions in intensity can be difficult to follow systematically. Therefore, conclusions regarding hybrid formation mechanisms and microstructure based solely on XRD results are only tentative.
Morphology
The morphology of the aggregated graphene was characterized using SEM. Figures 14 and 15 show SEM micrographs of PI hybrids with various HDA-GS and AHB-GS content, respectively. These samples exhibited platelet morphology with uniform orientation distribution. Because of the differences between the scattering densities of the graphene and the matrix polymer, graphene dispersion could be readily observed. Unlike the hybrids with lower FGS concentrations, those with 10 wt% FGS formed agglomerates in the polymer matrix larger than 100 nm, making it evident that agglomeration of the dispersed graphene phase increased with increasing FGS content.
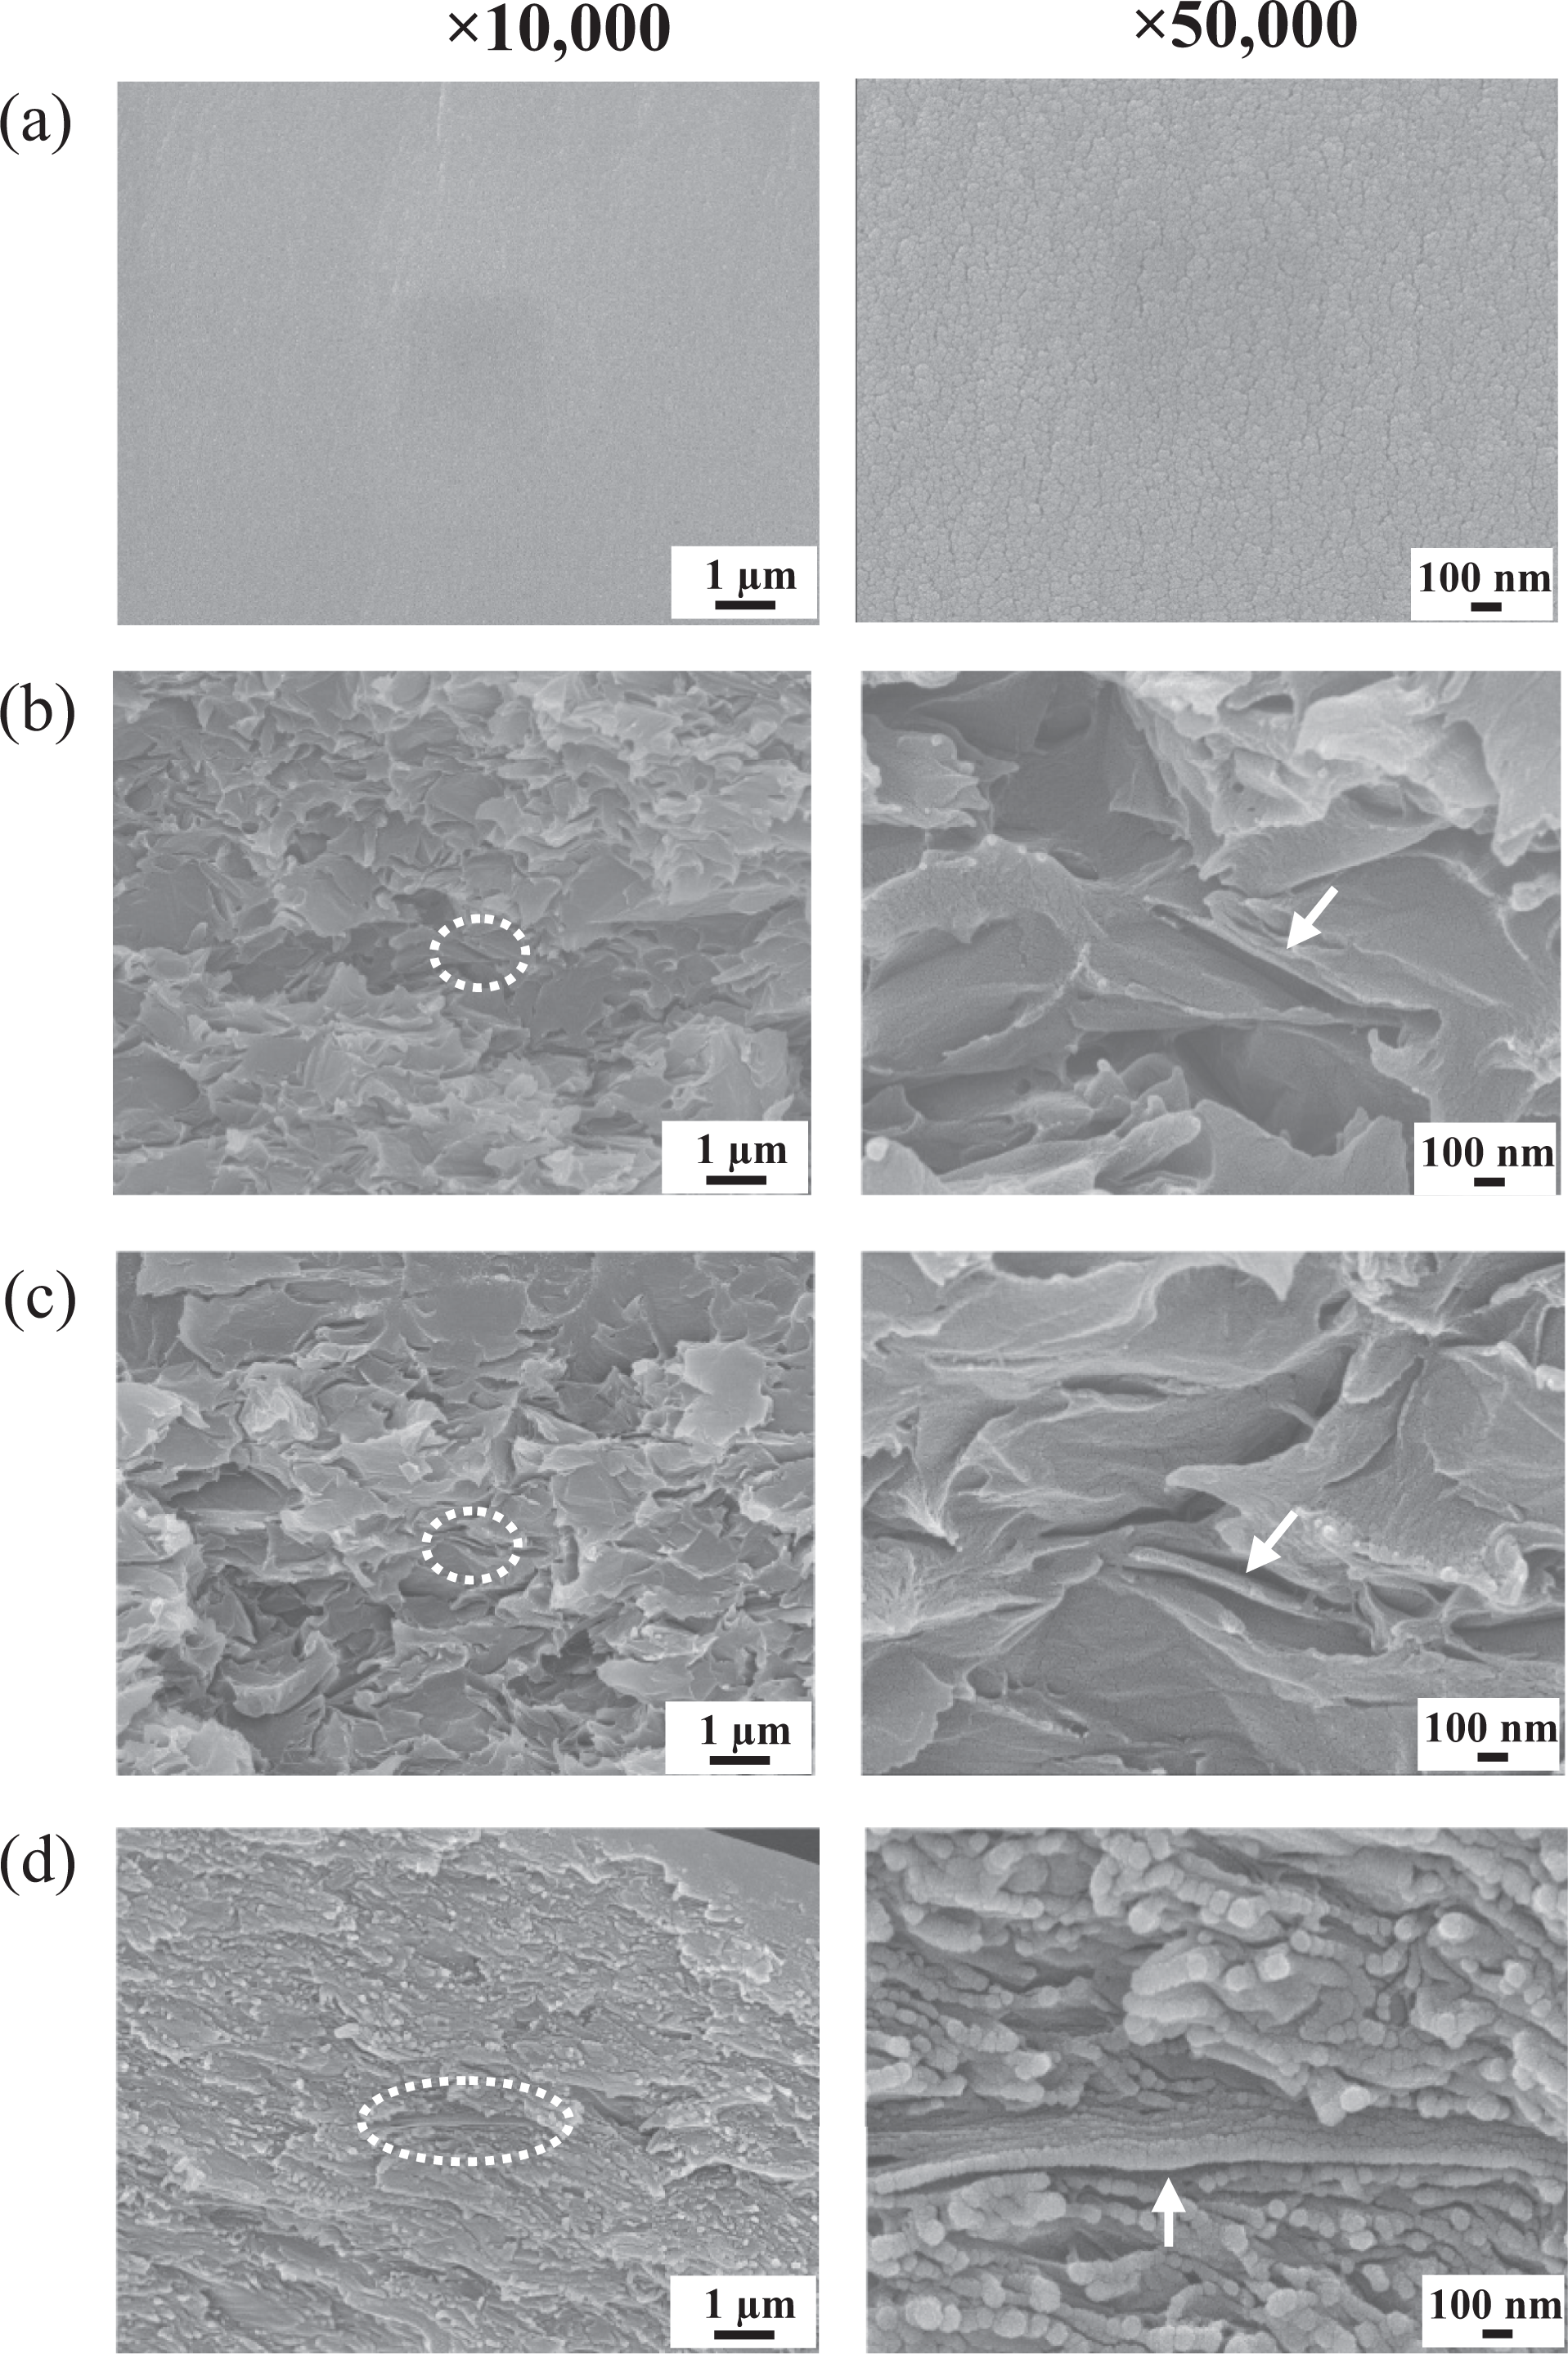
FE-SEM micrographs of PI hybrid films containing (a) 0, (b) 3, (c) 5, and (d) 10 wt% HDA-GS. PI: polyimide; HDA-GS: hexadecylamine–graphene sheet; SEM: scanning electron microscope; FE: Field Emission.
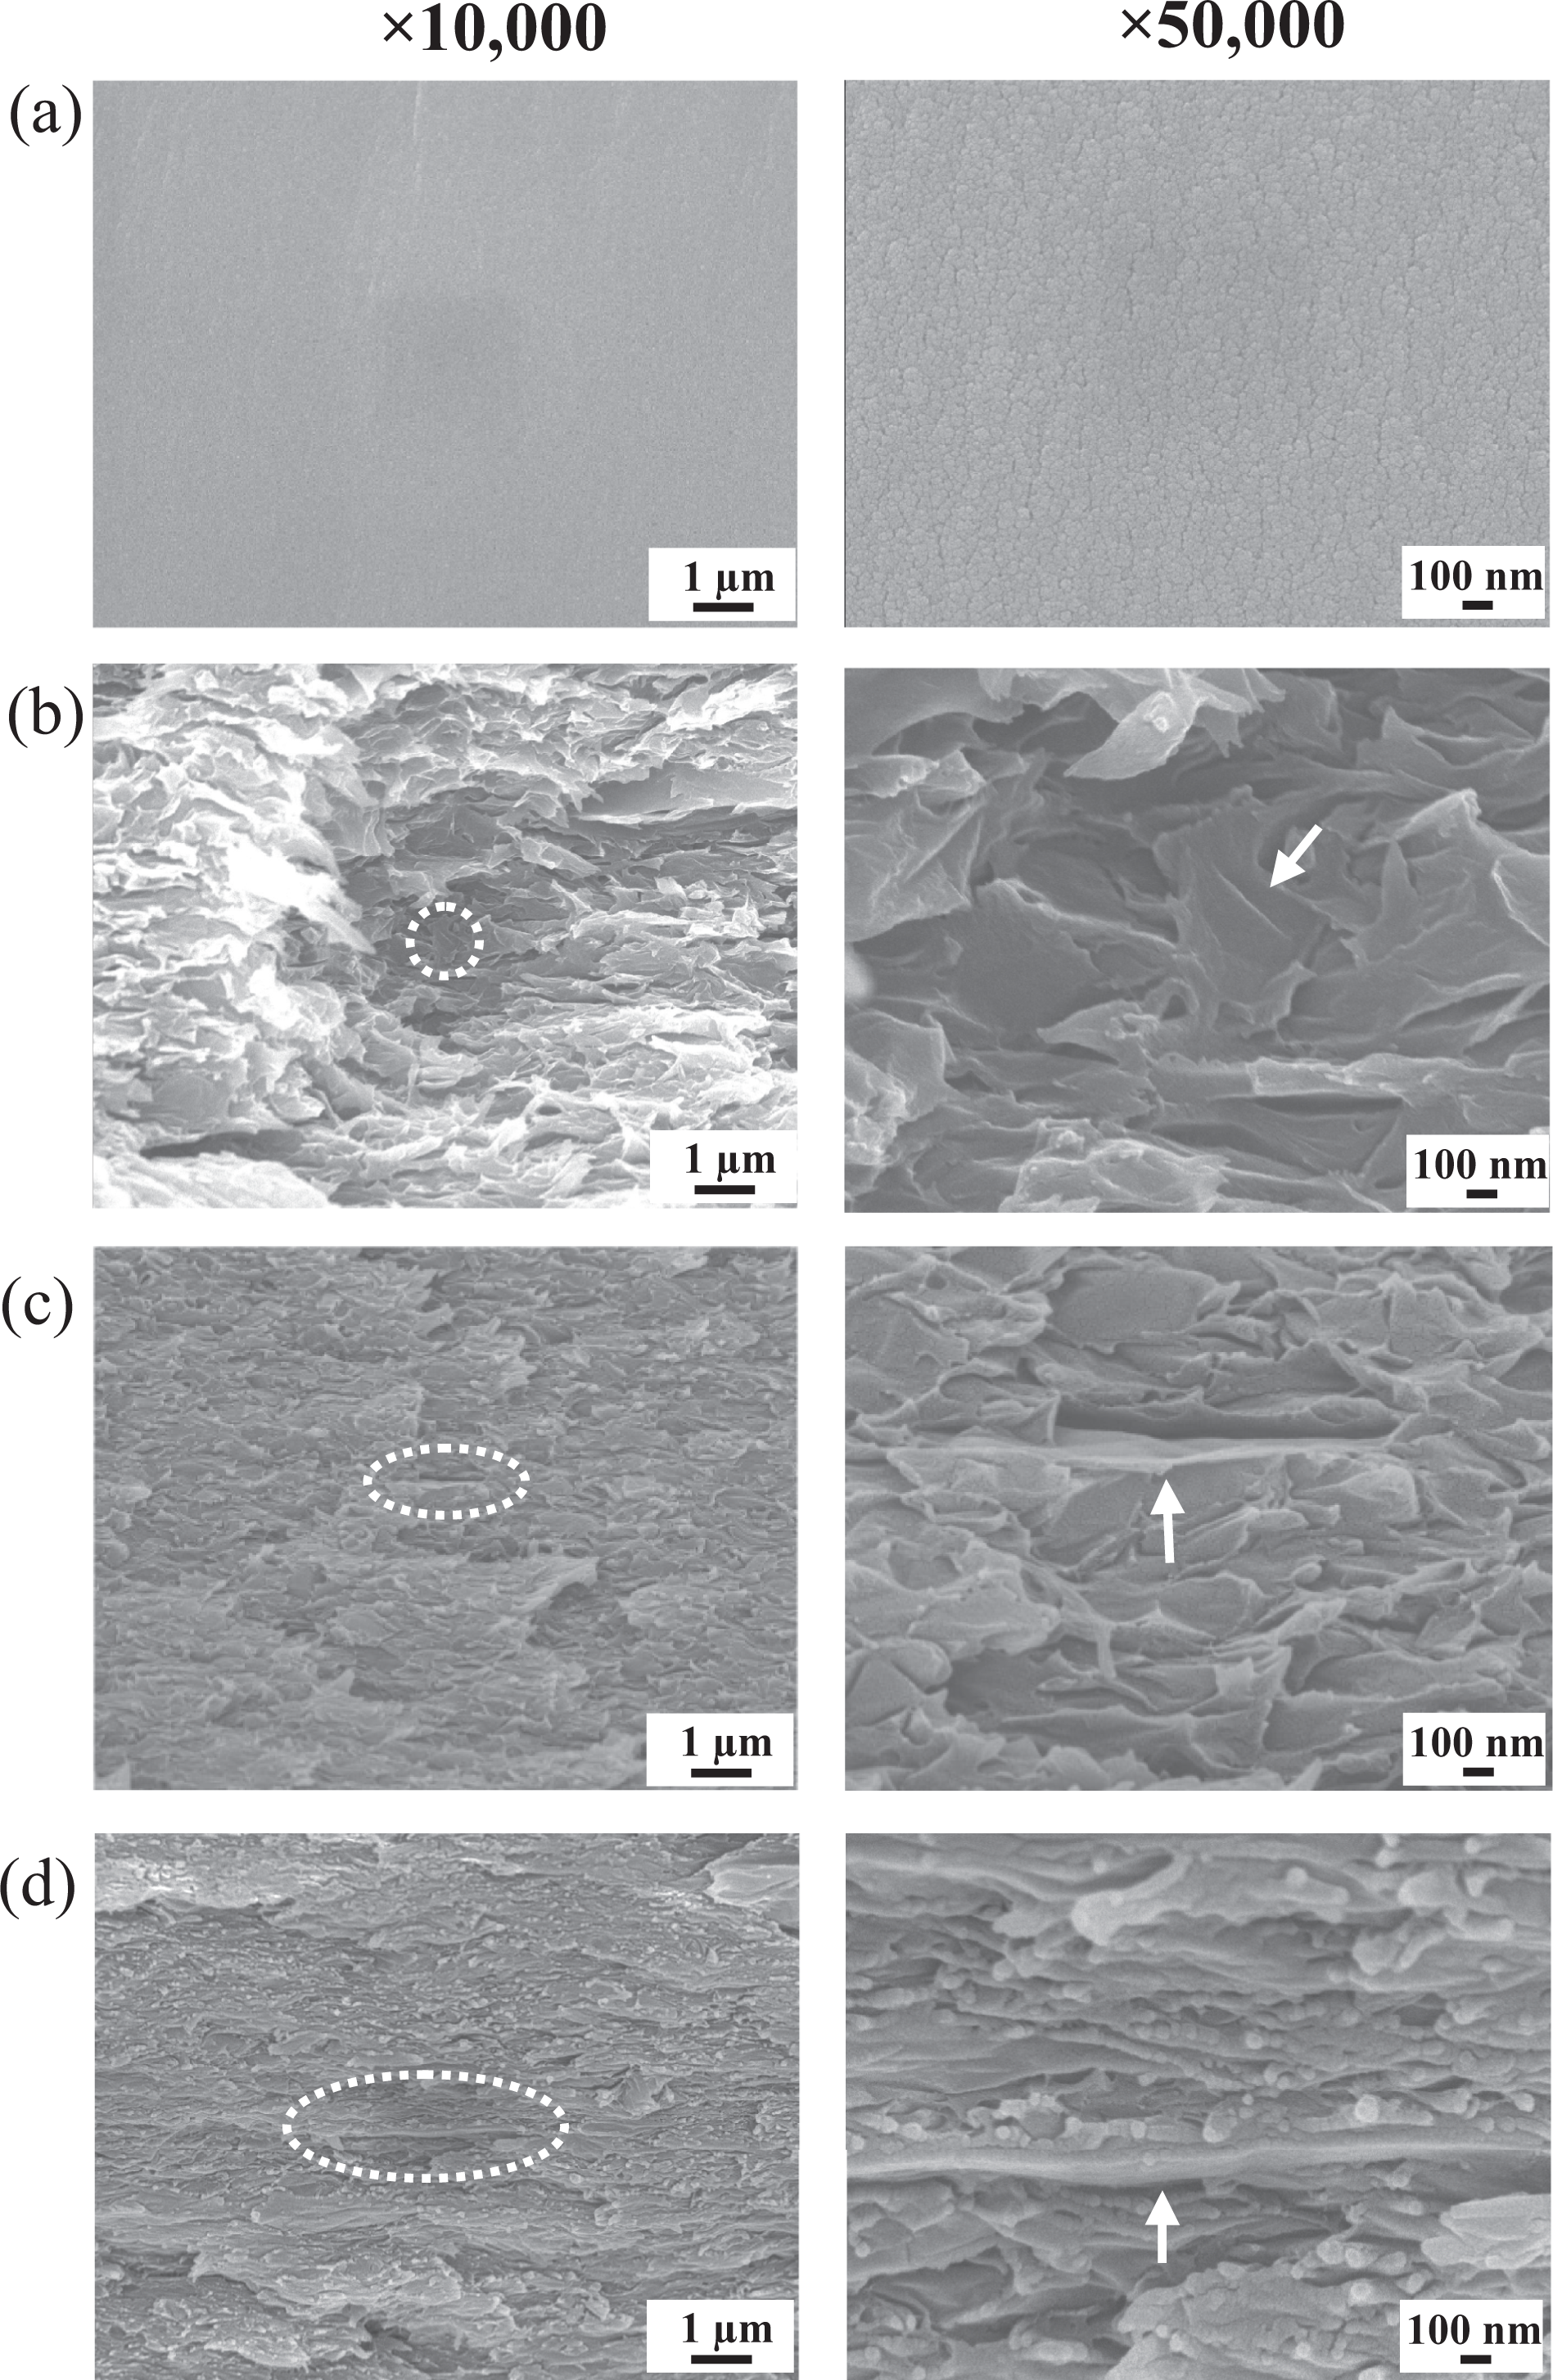
FE-SEM micrographs of PI hybrid films containing (a) 0, (b) 3, (c) 5, and (d) 10 wt% AHB-GS. PI: polyimide; AHB-GS: 4-amino-N-hexadecylbenzamide–graphene sheets; FE: Field Emission.
Interestingly, Figures 14 and 15 show that graphene forms straight, rigid platelets in the composite, indicating that the graphene is extremely stiff. It is well known that solvent processing (including direct casting) of thermally reduced graphene oxide (TRG) composites results in stiffer graphene when compared to that obtained for the melt process. 18 Unlike those in solvent-processed composites, particles in melt-processed composites might reaggregate through extensional flow during melt compounding. 19
TEM of ultramicrotomed sections was also used to further evaluate the degree of intercalation and the amount of aggregation of the graphene clusters. Typical TEM images of PI hybrid films containing 5 and 10 wt% HDA-GS are shown in Figure 16. In the 5 wt% sample, each layer of the polymer matrix consists of well-dispersed individual graphene layers (represented by dark lines), with some of the graphene aggregated to thicknesses of approximately 10 nm. Furthermore, graphene aggregates in the 10 wt% sample, in some cases, approach thicknesses of 20 nm.
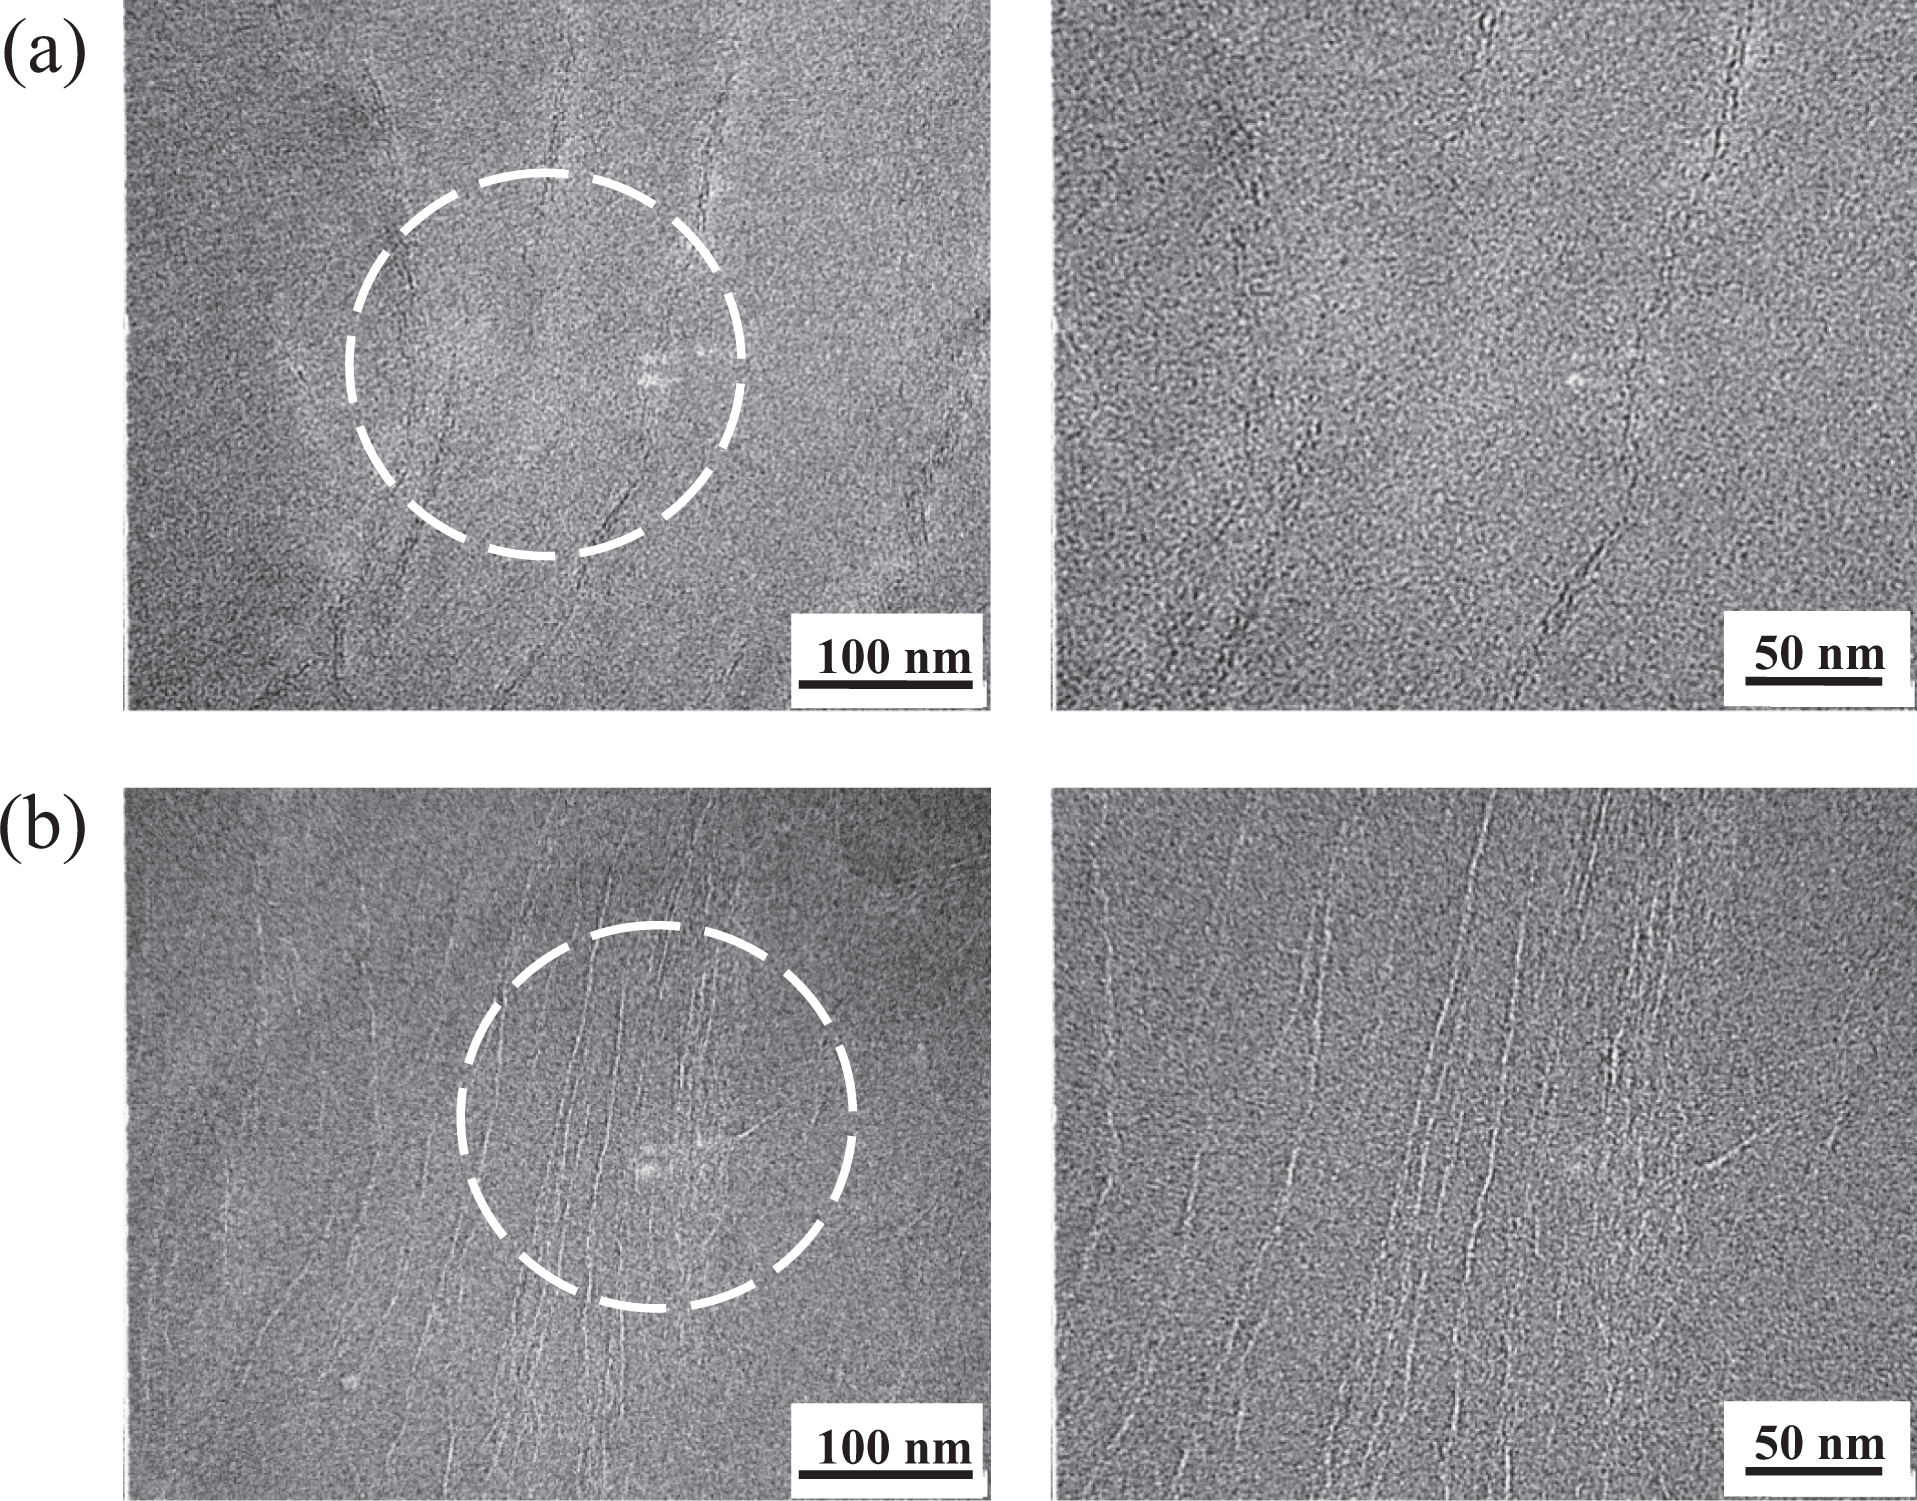
TEM micrographs of PI hybrid films containing (a) 5 wt% and (b) 10 wt% HDA-GS. TEM: transmission electron microscopy; PI: polyimide; HDA-GS: hexadecylamine–graphene sheet.
Figure 17 shows TEM images of PI hybrid films containing 5 and 10 wt% AHB-GS. The graphene aggregates in the 5 wt% sample are, for the most part, well dispersed in the polymer matrix; no micrometer-scale particles are observable. Average particles are less than 10 nm thick, which is consistent with nanocomposite formation. Graphene aggregates in the 10 wt% sample are also well dispersed, though some clusters were detected with sizes in the range 10–20 nm. These data again demonstrate that agglomeration of the dispersed graphene phase clearly increases with an increase in graphene content.
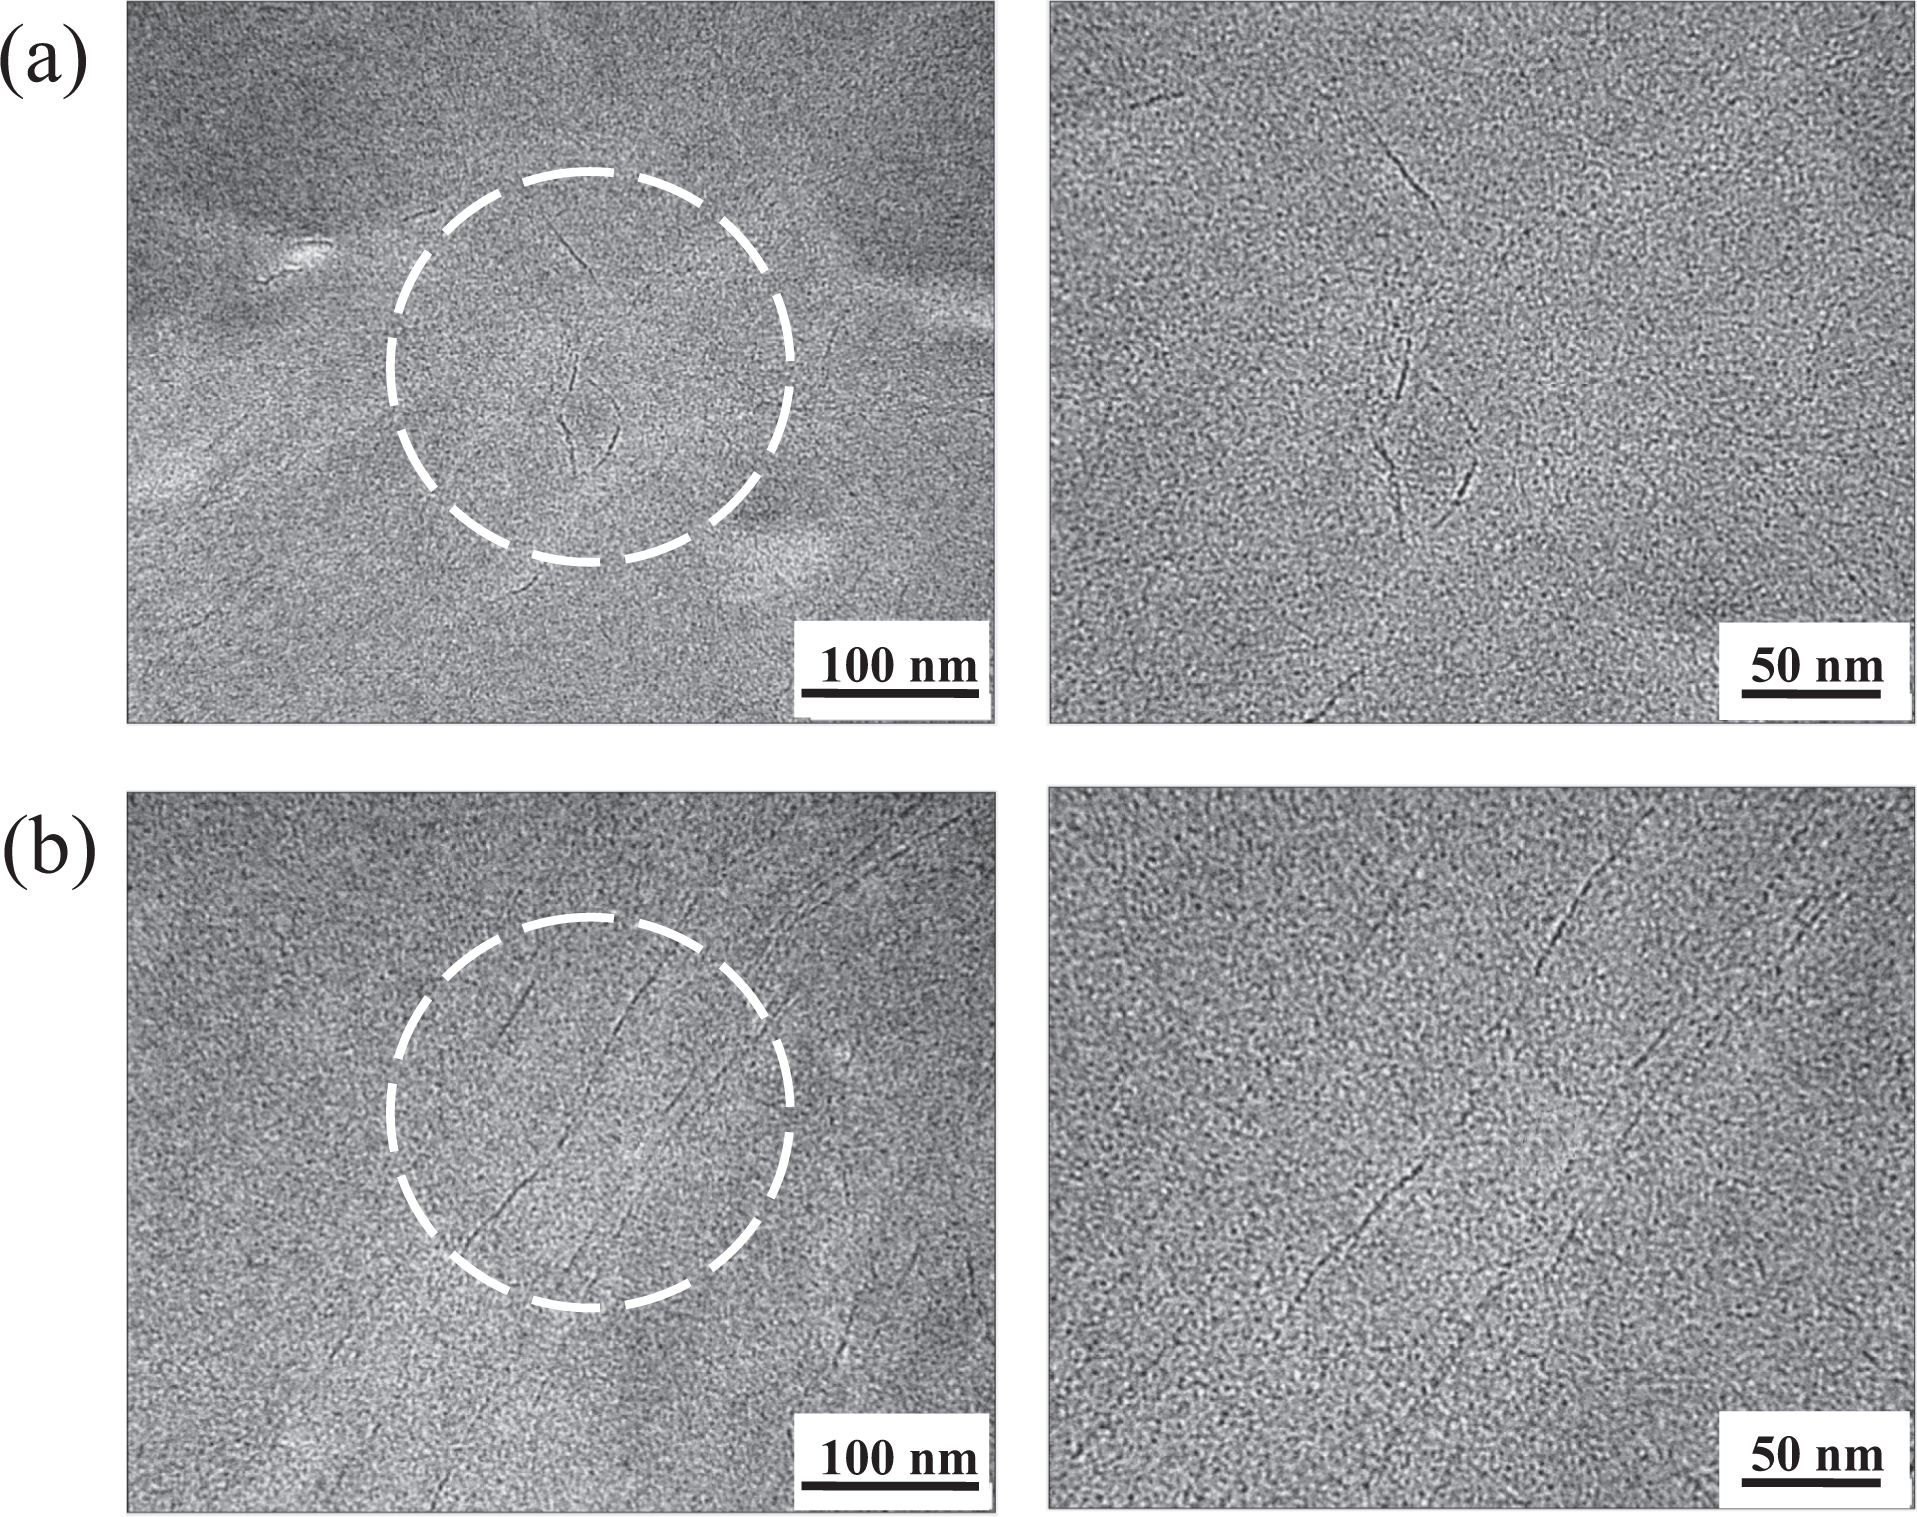
TEM micrographs of PI hybrid films containing (a) 5 wt% and (b) 10 wt% AHB-GS. TEM: transmission electron microscopy; PI: polyimide; AHB-GS: 4-amino-N-hexadecylbenzamide–graphene sheets.
Thermal properties
Comparative DSC results for pure PI and the PI hybrid films are listed in Table 2. The glass transition temperature (T g) values of the hybrid films decreased gradually from 260°C to 210°C for HDA-GS and from 260°C to 221°C for AHB-GS with increasing FGS loading from 0 wt% to 10 wt%. This is likely due to both graphene agglomeration in the polymer matrix, as supported by SEM and TEM results, as well as low heat resistance in the long alkyl chains of the FGSs.
Thermal properties of PI hybrid films.
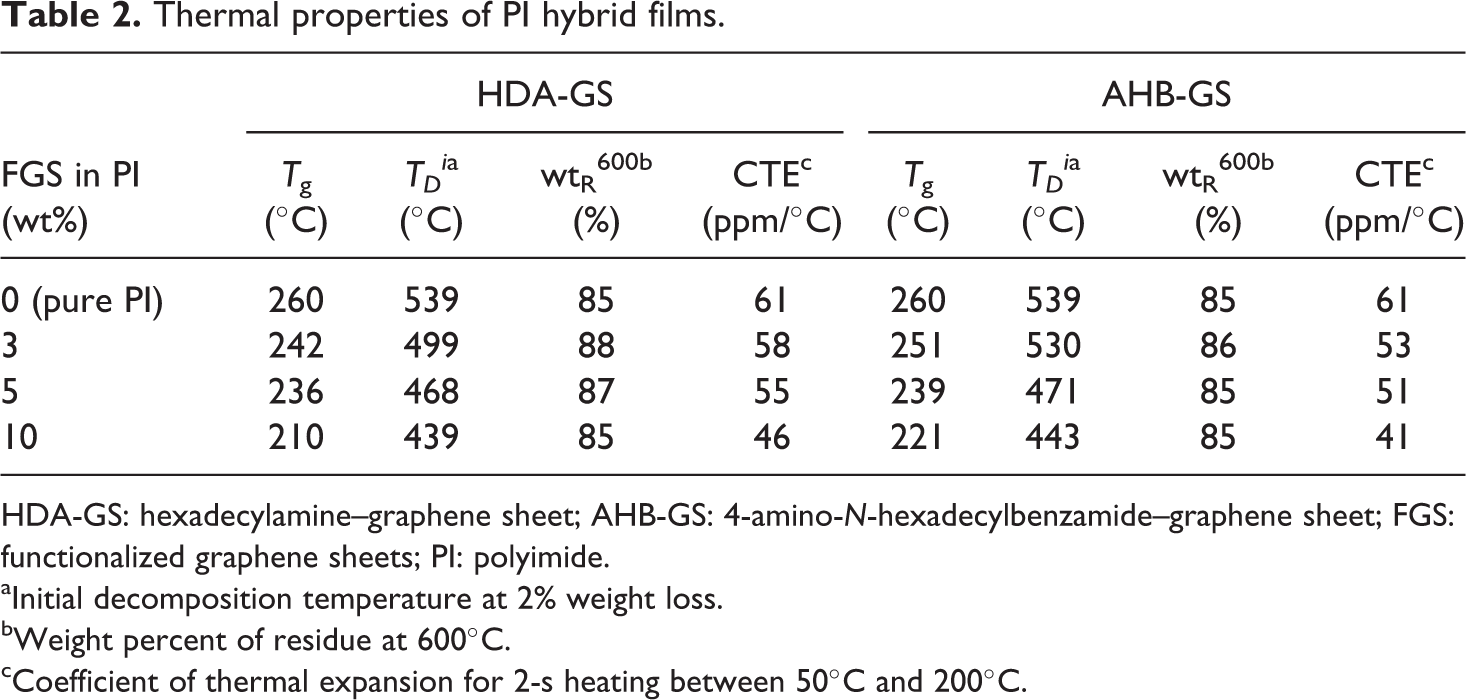
HDA-GS: hexadecylamine–graphene sheet; AHB-GS: 4-amino-N-hexadecylbenzamide–graphene sheet; FGS: functionalized graphene sheets; PI: polyimide.
aInitial decomposition temperature at 2% weight loss.
bWeight percent of residue at 600°C.
cCoefficient of thermal expansion for 2-s heating between 50°C and 200°C.
Comparative TGA results for pure PI and the PI hybrid films are also shown in Table 2. The initial thermal degradation temperature (TD i ) showed a trend similar to that of the T g. It is generally believed that the introduction of graphene into a polymer can improve its thermal stability, seeing how the graphene filler is generally thermally stable. In addition, the filler also increases the initial decomposition temperature because it acts as an insulator as well as a mass-transport barrier to the volatile products generated during decomposition. 20 In our investigation, however, the TD i s of the hybrid films, determined at 2% weight loss, were found to decrease gradually as FGS content increased. Specifically, the TD i decreased from 539°C to 439°C for the HDA-GS sample and from 539°C to 443°C for the AHB-GS sample as FGS content increased from 0 wt% to 10 wt%. As with the T g values, this decrease in TD i is likely due to the low heat resistance of the alkyl chains. 21
The weight of the residue at 600°C (wtR 600) was virtually unchanged when the filler loading was varied, with a range of only 85–88% for all the tested samples (see Table 2). The corresponding TGA thermograms are shown in Figure 18.
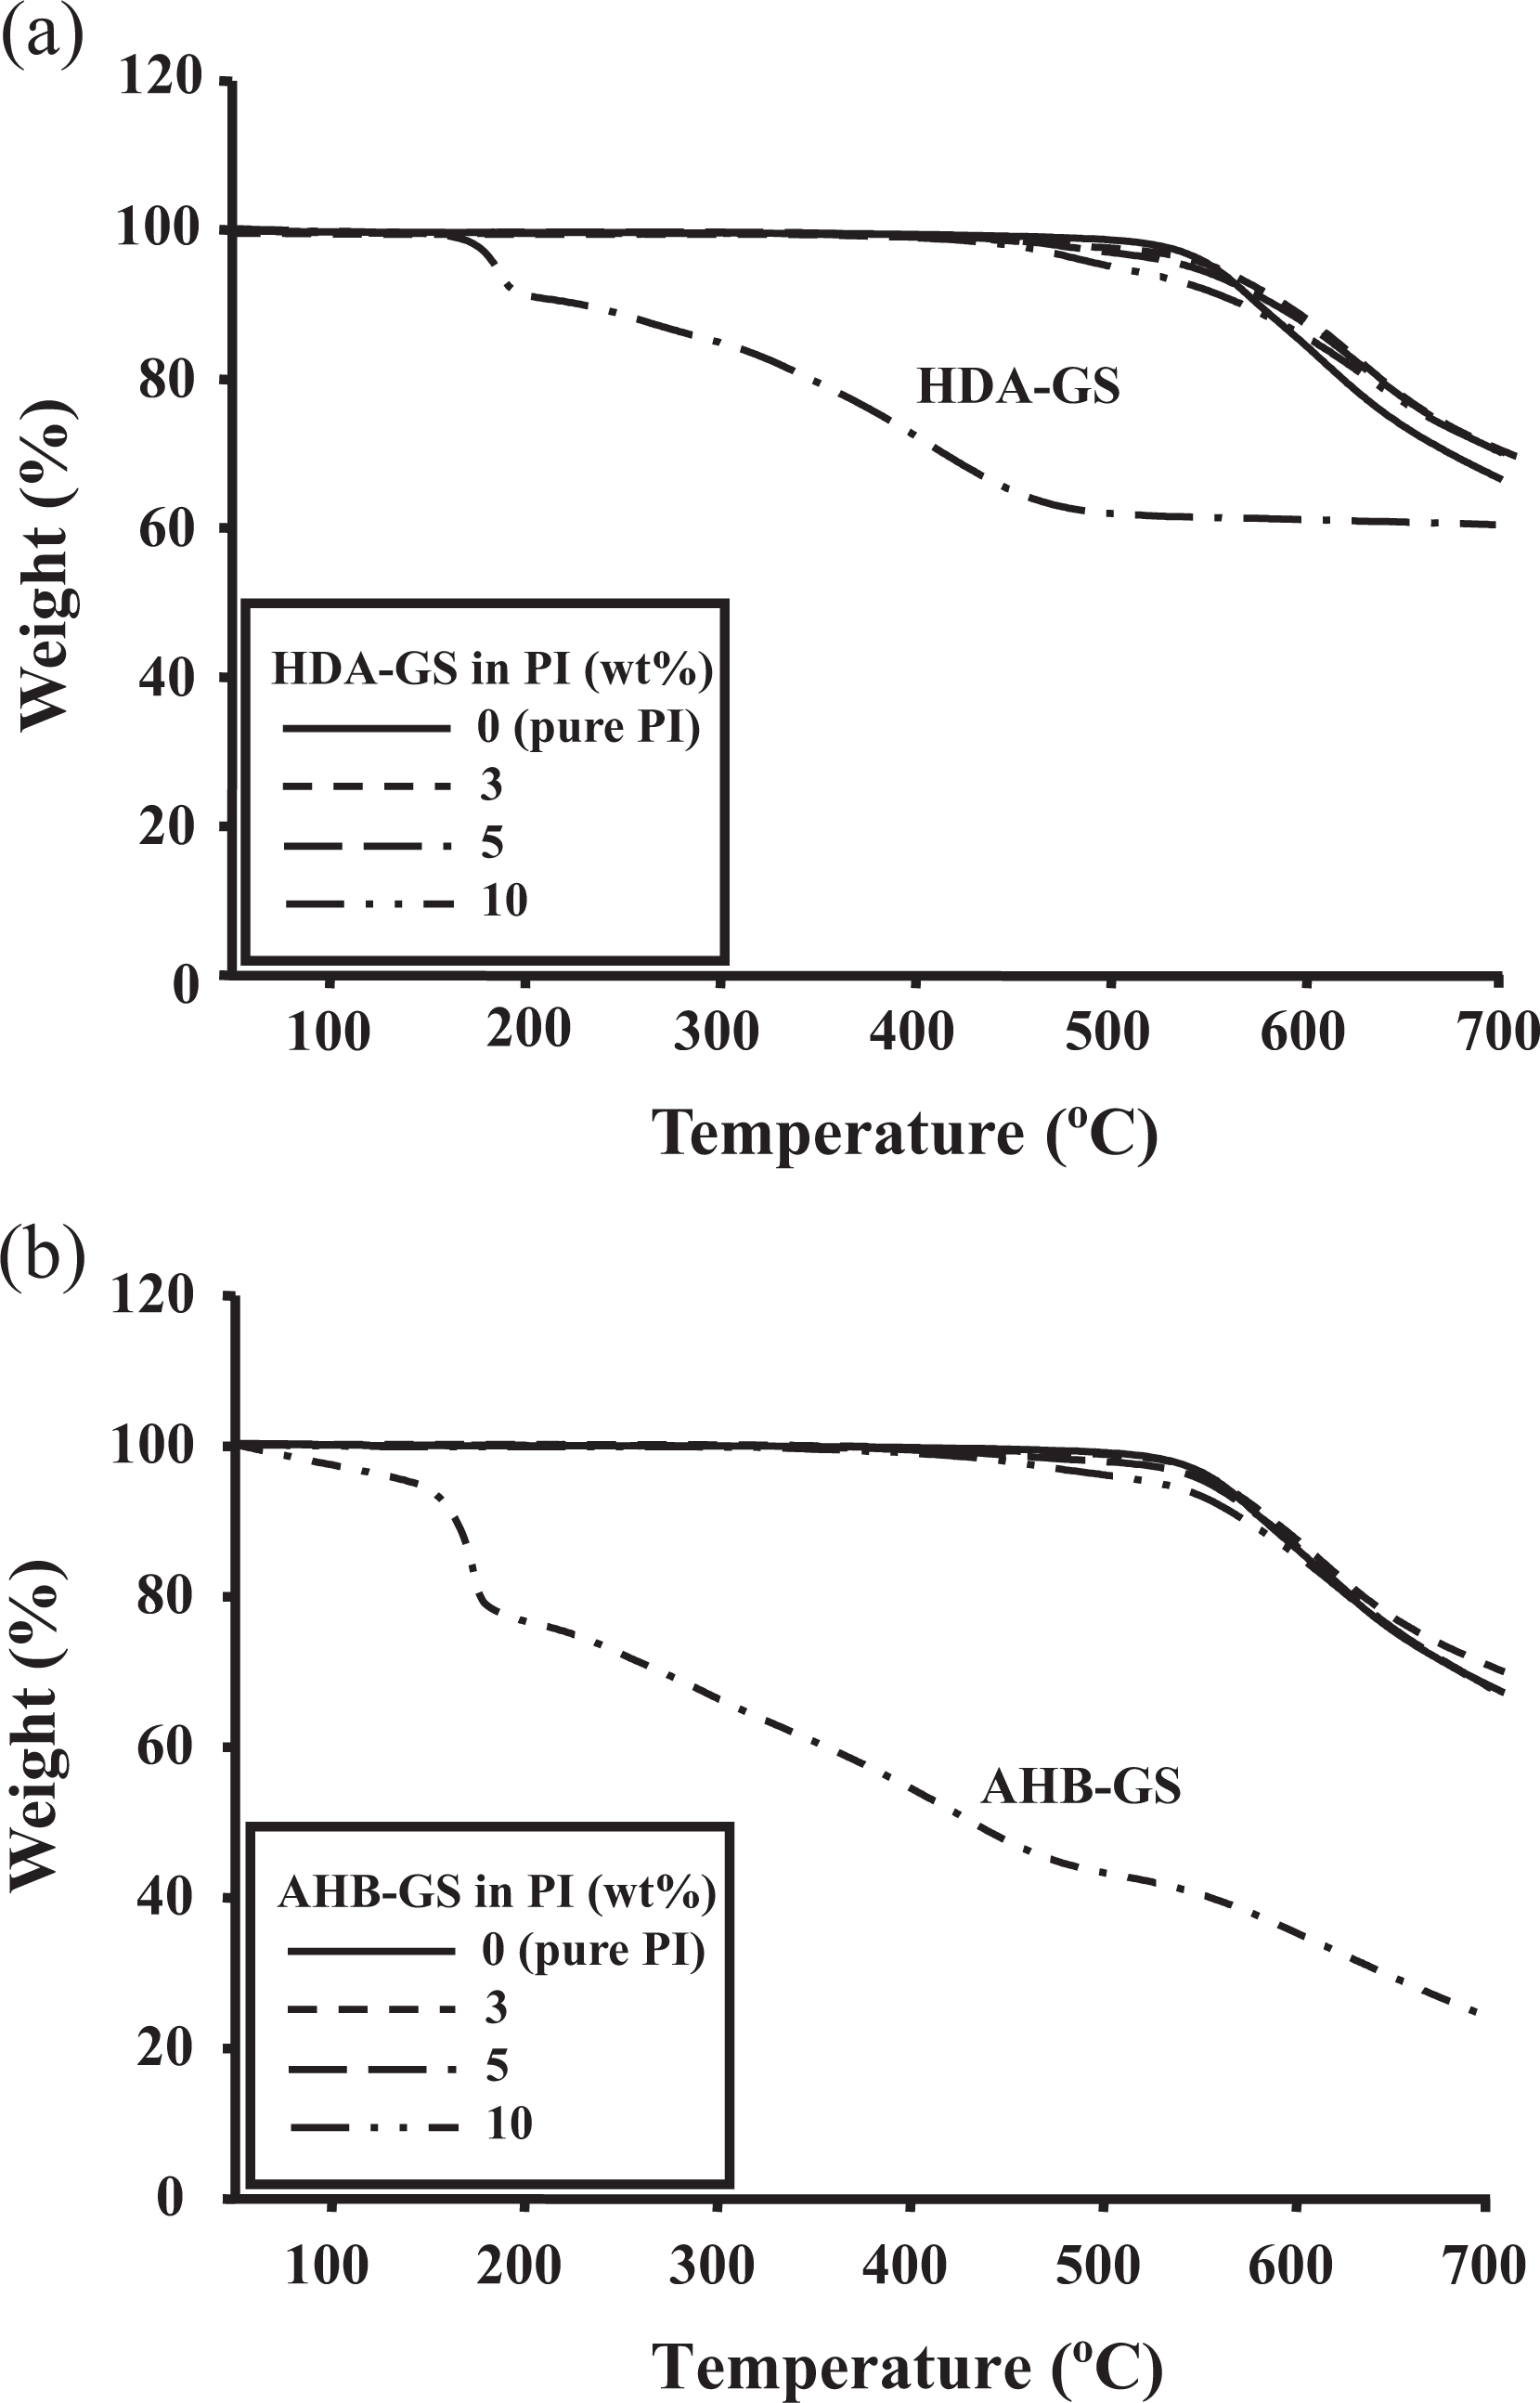
TGA thermograms of (a) HDA-GS and (b) AHB-GS PI hybrids for varying nanofiller concentrations. TGA: thermogravimetric analyses; AHB-GS: 4-amino-N-hexadecylbenzamide–graphene sheets; PI: polyimide; HDA-GS: hexadecylamine–graphene sheet.
The CTE values for pure PI and the PI hybrids over a temperature range 50–200°C are also listed in Table 2. The CTEs of the hybrid films decreased as loading increased. Specifically, as graphene loading was increased from 0 wt% to 10 wt%, the values gradually decreased from 61 ppm/°C to 46 ppm/°C for HDA-GS and from 61 ppm/°C to 41 ppm/°C for AHB-GS, indicating that the magnitude of the reduction depended on the molecular orientation of the PI and the rigid nature of the graphene layers. 22 Upon heating, the in-plane-oriented PI molecules tended to relax in a direction normal to their original, expanding mainly in the out-of-plane direction. Because the graphene layers were much more rigid and did not deform or relax as easily as the PI molecules, they effectively retarded out-of-plane thermal expansion. 2,23 The corresponding TMA thermograms are shown in Figure 19.
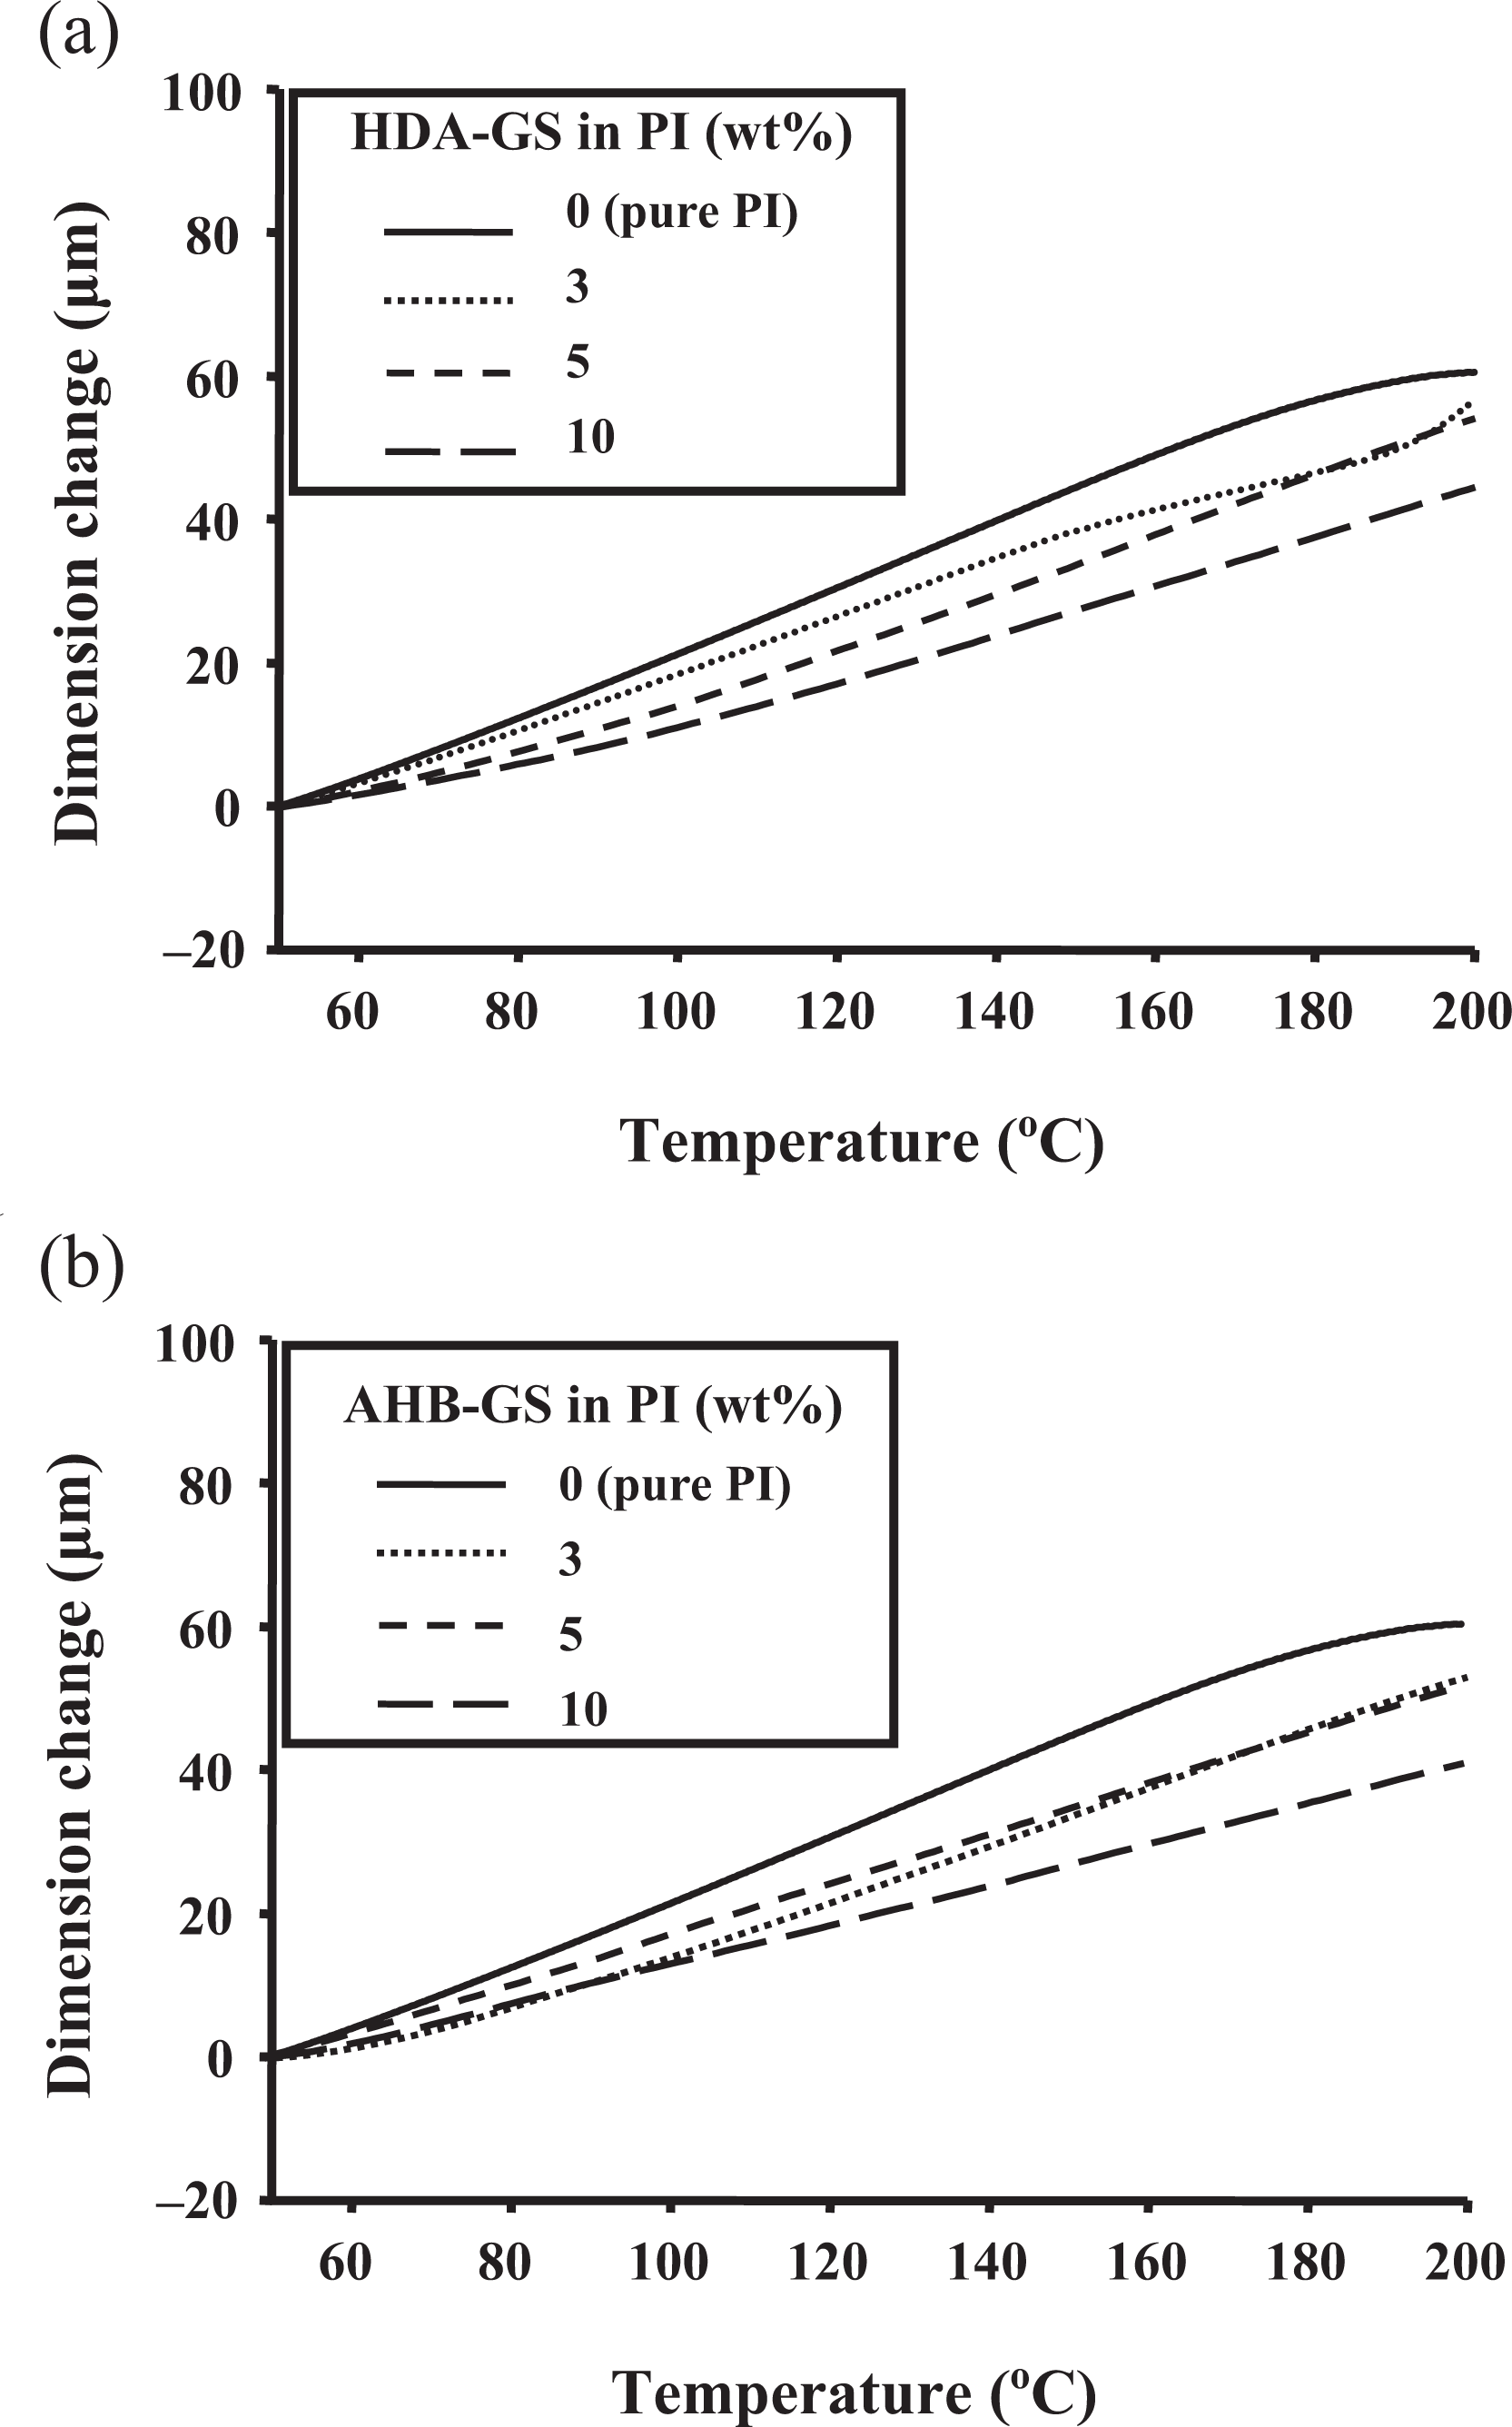
TMA thermograms of (a) HDA-GS and (b) AHB-GS PI hybrids for varying nanofiller concentrations. AHB-GS: 4-amino-N-hexadecylbenzamide–graphene sheets; PI: polyimide; HDA-GS: hexadecylamine–graphene sheet; TMA: Thermomechanical Analyzer.
The above results indicate that the thermal properties of the AHB-GS hybrids are superior to those of the HDA-GS hybrids. This could be a result of existing aromatic phenyl group in AHB-GS, and the aromatic amide functional groups on the surface of the AHB-GS form hydrogen bonds. 24,25
Gas permeation
The mobility of the polymer chain segments in the polymer nanocomposite is clearly different from that of the pure polymer chains because of the confined environment; this in turn affects gas permeability. In addition to chain immobility, gas permeability is also affected by the detour ratio, defined as the ratio of the film thickness in the nominal diffusion flow direction to the average length of the tortuous diffusion distance between the filler layers. 26,27
To further characterize the barrier properties of the PI hybrids, the O2 permeability of the various PI hybrid films was evaluated; the results are summarized in Table 3. The thickness values of all films tested for gas permeation were in the range 63–69 μm. We discuss our results in terms of relative permeability, Pc/Pp , where Pp is the permeability of the pure polymer and Pc is the permeability of the composite.
Gas permeations of PI hybrid films.
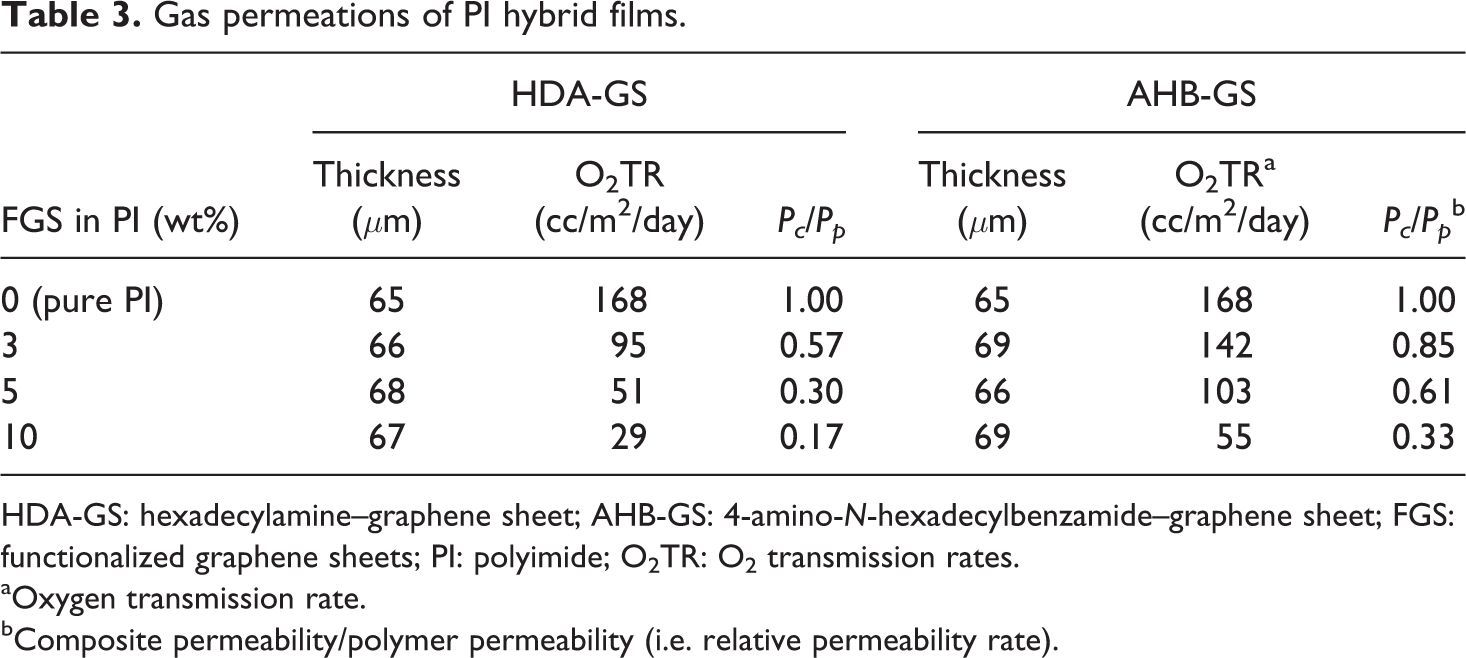
HDA-GS: hexadecylamine–graphene sheet; AHB-GS: 4-amino-N-hexadecylbenzamide–graphene sheet; FGS: functionalized graphene sheets; PI: polyimide; O2TR: O2 transmission rates.
aOxygen transmission rate.
bComposite permeability/polymer permeability (i.e. relative permeability rate).
These results confirm that mass transfer for this penetrant is highly dependent on graphene loading level. For example, the presence of only 10 wt% HDA-GS resulted in an O2TR of 29 cc/m2/day, an 83% reduction from the measured 168 cc/m2/day of the pure PI film. Similarly, the 10 wt% AHB-GS sample showed an O2TR of 55 cc/m2/day, a 67% reduction from that of the pure PI film.
In conclusion, HDA-GS produces a stronger gas barrier effect than AHB-GS with respect to the O2TR. Again, this difference likely results from the longer, more flexible alkyl chains in HDA; such increased flexibility allows for the reinforcement of chain packing in the hybrid films, significantly reducing gas permeability.
Electrical conductivity
Like other conductive carbon fillers such as carbon black, carbon nanofibers, and expanded graphite, pristine GSs provide percolated pathways for electron transfer which impart electrical conductivity to the composites. 28,29 However, for graphene, the insulator-to-conductor transition occurs at very low loading, making it comparable to the electrical percolation thresholds obtained for carbon tubes.
Although FGSs can be readily dispersed in PI, FGSs are electrically insulating and thermally unstable and must be at least partially reduced in order to restore electrical conductivity. Because of their enormous surface area (700–1500 m2/g), high surface polarity, and high electrical conductivity, TRG sheets can be used to produce polymer composites with excellent electrical properties. 30
The deformation of the planar structure resulting from pyrolysis prevents restacking, improving the ability of TRGs to decrease the electrical percolation threshold. 30 Thermal reduction also restores electrical conductivity; the conductivity of a compacted film has been reported to be between 10 S/cm and 20 S/cm compared to 6000 S/cm for defect-free single-sheet graphene. 31,32
The electrical conductivities of the hybrid films are shown in Table 4. Conductivity increased rapidly from 1.0 × 10⁻¹⁰ to 8.6 × 10⁻⁵ S/cm for HDA-GS and from 1.0 × 10⁻¹⁰ to 2.8 × 10⁻² S/cm for AHB-GS as graphene loading increased from 0 wt% to 10 wt%. This result is due to the percolation density and higher aspect ratio of the GSs. Apparently, heating FGS in PI hybrid films during the thermal imidization of PAA reduces FGS to yield TRG sheets. Hence, the partial transformation from sp 3 - to sp 2 -hybridized carbon restores the electrical conductivity because TRG maintains residual oxygen on its surface. 6,33,34
Electrical conductivities of PI hybrid films.
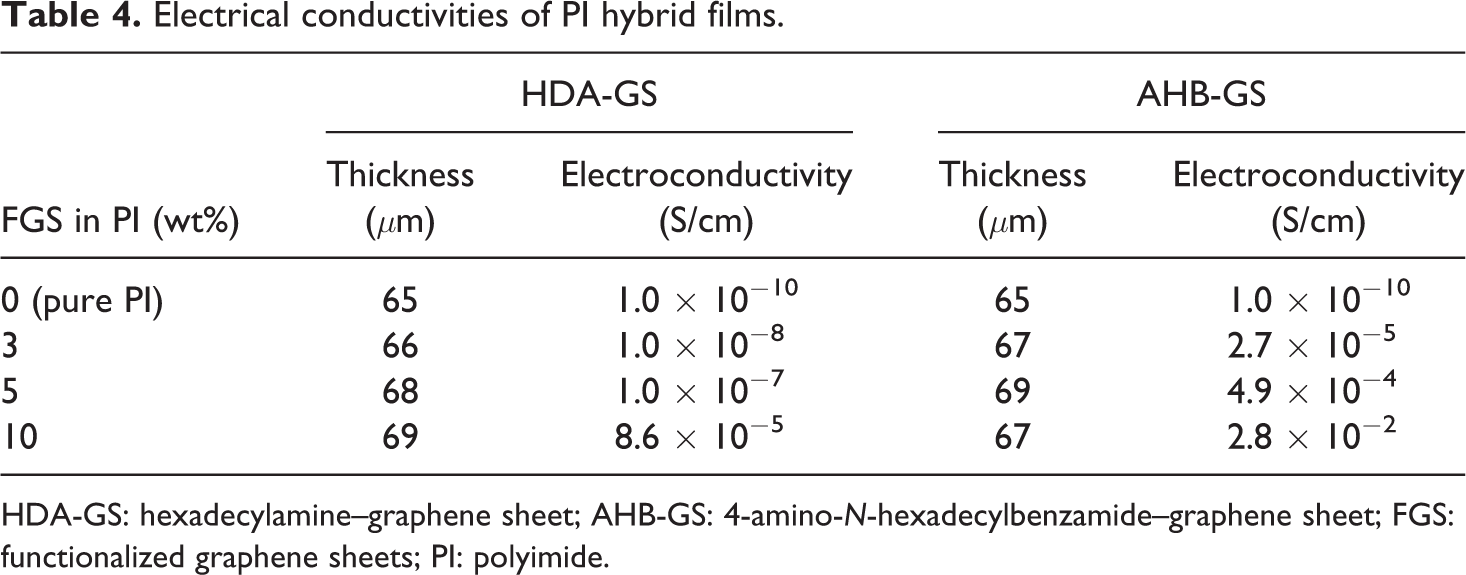
HDA-GS: hexadecylamine–graphene sheet; AHB-GS: 4-amino-N-hexadecylbenzamide–graphene sheet; FGS: functionalized graphene sheets; PI: polyimide.
The PI hybrid films reach the percolation threshold at ∼3 wt%. We propose that the lower percolation threshold in our system is due to the higher aspect ratio of FGSs (HDA-GS and AHB-GS), which increases the connectivity and improves the conductivity (see Table 4). Ansari and Giannelis 35 reported on hybrid films with FGS as a filler and found that the electrical percolation threshold of poly(vinylidene fluoride) was in the range 3–8 wt% FGS. Xing et al. 36 also reported that perfect conductive network was shown in the composite with higher RGO loading at 4 wt% in nylon-6 nanocomposite.
This effect could be a result of the greater percolation density and higher aspect ratio of the GSs. Apparently, the heating of the FGSs during the thermal imidization of PAA reduced some of the FGSs to TRG sheets, with the partial transformation from sp 3 - to sp 2 -hybridized carbons resulting in the restored conductivity observed. 37
The aromatic amide AHB-GS hybrids exhibited superior conductivity when compared to the alkyl HDA-GS hybrids. Again, the formation of hydrogen bonds with PAA during the in situ polymerization enhances the dispersion and interfacial interaction between the AHB-GS and the PI matrix; these results suggest that the improved dispersion and formation of a loose network through this mechanism results in an effective conductive pathway, making the AHB-GS hybrid a more effective conductor than the HDA-GS.
Conclusion
Novel FGSs, HDA-GS and AHB-GS, were designed and synthesized to improve the various properties of the PI hybrid films. This study focused specifically on the synthesis of these films by solution intercalation, resulting in hybrid films with FGS content ranging from 0 wt% to 10 wt%. We then analyzed the effects of the two FGSs and of the change in filler content on the thermal properties, morphologies, gas permeabilities, and electrical conductivities of the hybrid films. Our results confirm that these properties are dependent on the types of FGSs incorporated into the polymer, as well as the amount of those FGSs present within the PI polymer matrix.
We additionally used TEM to evaluate the degree of intercalation and the amount of aggregation of the graphene clusters. The graphene, for the most part, was well dispersed in the polymer matrix; while some agglomeration was present, micrometer-scale particles were not detected. The average particle thickness was less than 10 nm, an observation that was consistent with the formation of the nanocomposites.
Overall, we have found that HDA-GS is more effective at improving O2TR than AHB-GS. On the other hand, AHB-GS hybrids exhibit superior thermal properties and electrical conductivity when compared to HDA-GS hybrids.
Footnotes
Declaration of Conflicting Interests
The author(s) declared no potential conflicts of interest with respect to the research, authorship, and/or publication of this article.
Funding
The author(s) disclosed receipt of the following financial support for the research, authorship, and/or publication of this article: This research was supported by the Research Fund of Kumoh National Institute of Technology.