
Abstract
A glass-mat-reinforced thermoplastic (GMT) material is widely used in the automotive industry for components such as underbody shields, seat structures, front/rear bumper, and front-end modulus. Due to the higher residual length of the glass strands, GMT usually offers better mechanical properties than injection-molded fiber-reinforced thermoplastics. The GMT material is typically manufactured by compression molding (CM) of preimpregnated fibers–reinforced resin sheets called mat. Two types of mats, one with discontinuous random (RD) fibers and other with aligned continuous fibers, are considered in this study. A stack of such mats with different combinations is used to tailor the mechanical properties of the final part. During the CM, the fibers in the mat flow with the resin and change the alignment. In this study, we are presenting an approach to account for the initial condition, such as fiber length, orientation and concentration of the fibers in the mat, and process conditions used, to develop a material model for the finished part. First, a stack of mat with known fiber orientation, length, and concentration as initial conditions is simulated for CM to predict the fiber orientation in the finished part. Next, the material model for the finished parts is developed using a Mori–Tanaka homogenization approach. The fiber orientation in the finished part is mapped from the CM simulation. For the fiber concentration and fiber length distribution, we used an empirical approach. The cross section of the finished part is investigated under optical microscope, and the fiber length and concentration are estimated based on the microstructure and initial stacking of mats. The predicted fiber orientation tensor is verified with orientations measured using computerized tomography (CT) scan on actual parts. The material model is verified by comparing the predicted performance with the actual tensile and bending test results.
Introduction
Glass-mat-reinforced thermoplastic (GMT) has been commercially available since 1970s. 1 –3 The short molding time and higher mechanical properties make the process attractive for use in the automotive industry. 4,5 Although GMTs can be produced with various polymeric matrices, the market is dominated by GMT polypropylene (GMT-PP)-based systems. Preimpregnated reinforcement fiber sheets are composed of unidirectional (UD) or RD long fibers. The difference in the mechanical response of GMT-PP with the various types of reinforcing material has been documented in several studies. 6 –8
During the molding process, a combination of such preheated GMT sheets is stacked and squeezed out to fill the mold cavity. The structural properties of the finished parts depend on the combination of GMT sheets used in the initial stack and process conditions. It is highly desired to predict the material properties for such compression-molded GMT components. However, there is little published research in this field. In this study, we are presenting a novel semi-empirical approach to estimate the material properties for the finished part. The fiber conditions, that is, the fiber length, orientation, and concentration, in the finished part are estimated and then using the Mori–Tanaka homogenization, 9 –11 the material properties for the finished part are predicted. The variation in the fiber conditions cross the thickness is also accounted. It is assumed that the fiber condition is the major contributor to the material properties. The resin is assumed to be nonliner but isotropic material with constant properties through the part.
It is well-known that fiber orientation has a strong effect on the physical properties of fiber-reinforced composite materials. 12 The resin flow during the compression molding (CM) causes the fibers to rearrange from their original pattern into a different fiber orientation. 13,14 While simulation of injection molding process to fill mold cavity has been practiced for many years, the simulation of CM process is still a new and developing field as well. 15,16 We used Moldex3D CM module 17 to simulate the CM of GMT sheets. The knowledge of stacking and the detailed arrangement of fibers in each layer of the GMT sheets are used to define known initial conditions for the mold fill process simulation. The estimation of fiber orientation in the finished part is obtained from the simulation results. Also the estimated fiber orientations are verified with the actual measurements at selected locations.
The fiber length and concentration in the finished part are estimated using the semi-empirical approach. The finished part is studied under optical microscope to identify the fiber condition such as orientation and fiber length through thickness. It was observed that the fibers are still in layers defining specific zones, that is, area of similar fiber length and concentration, which is typical for GMT sheets. These observations along with knowledge of initial conditions in the GMT sheets are used to empirically define the fiber length and concentration through the thickness in the final part.
This work makes unique contribution in two areas. First, the effect of different initial stacking of GMT sheets on the final properties of the finished parts is investigated. Five different samples using a different stacking order of GMT sheets are built and tested for bending and tensile loading conditions. Second, a method to develop the material model for a compression-molded part from GMT sheets is demonstrated. The semi-empirical method presented here accounts for fiber orientation, fiber length, and fiber concentration in the material model. The resin is assumed to be a nonlinear elastic–plastic material. Finally, the predicted material properties are used in the finite element (FE) model for tensile and bending loads, and the results are compared with the measured results to verify the accuracy of the predicted material models.
Experimental
In our experiment, two types of resin prepreg sheets, called mats, are used for the compression stack. Figure 1 shows two types of initial GMT sheet material configuration for RD and UD GMT sheets.
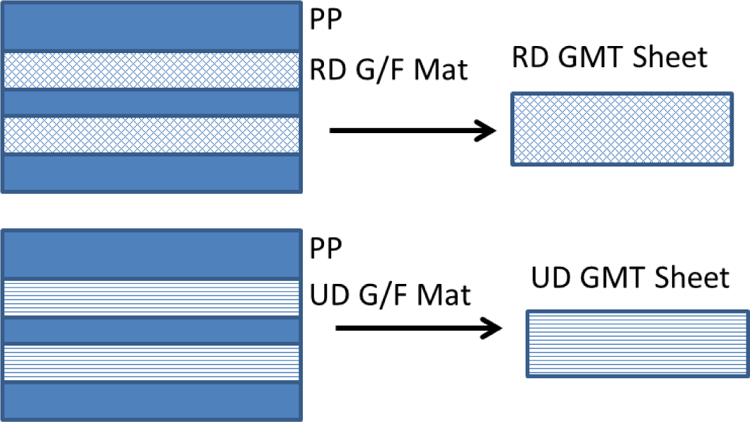
Two types of initial GMT sheet material configuration (RD and UD GMT sheets). GMT: glass-mat-reinforced thermoplastic; RD: random; UD: unidirectional.
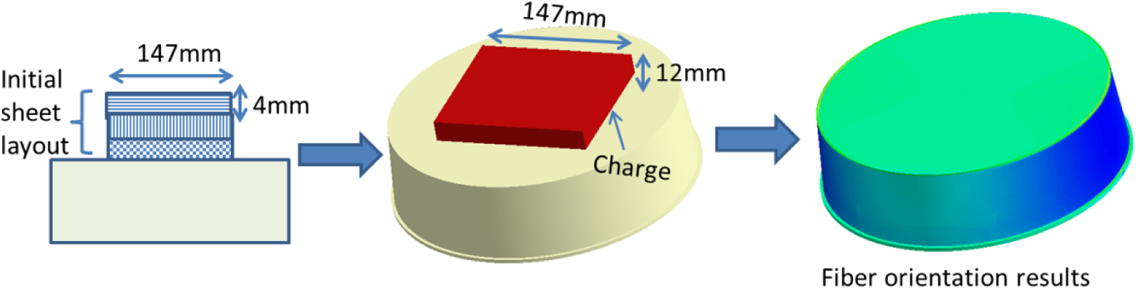
In order to study the effect of initial fiber alignment on the material properties of the final part, we used a tub-shaped part as an example. The part is made by CM of three sheets. We considered five different initial lay-up configurations, consisting different combinations of three sheets of two types, that is, UD and RD types. The details are presented in Table 1. The stacks consisting three sheets are preheated to 400°C and then compressed in tub-shaped mold cavity at pressure 150 ton for 40 s. A mark in the upper surface of the tool is used as reference to place the GMT sheets in the mold consistently with the desired alignment of the fibers in GMT sheets (The general manufacturing process is shown in Figure 2). After the CM, the initial fiber alignment of the GMT sheets is recorded and marked on the top surface of the finished part.
Sample preparation scenarios (five cases) for different GMT sheets initial lay-up configurations.
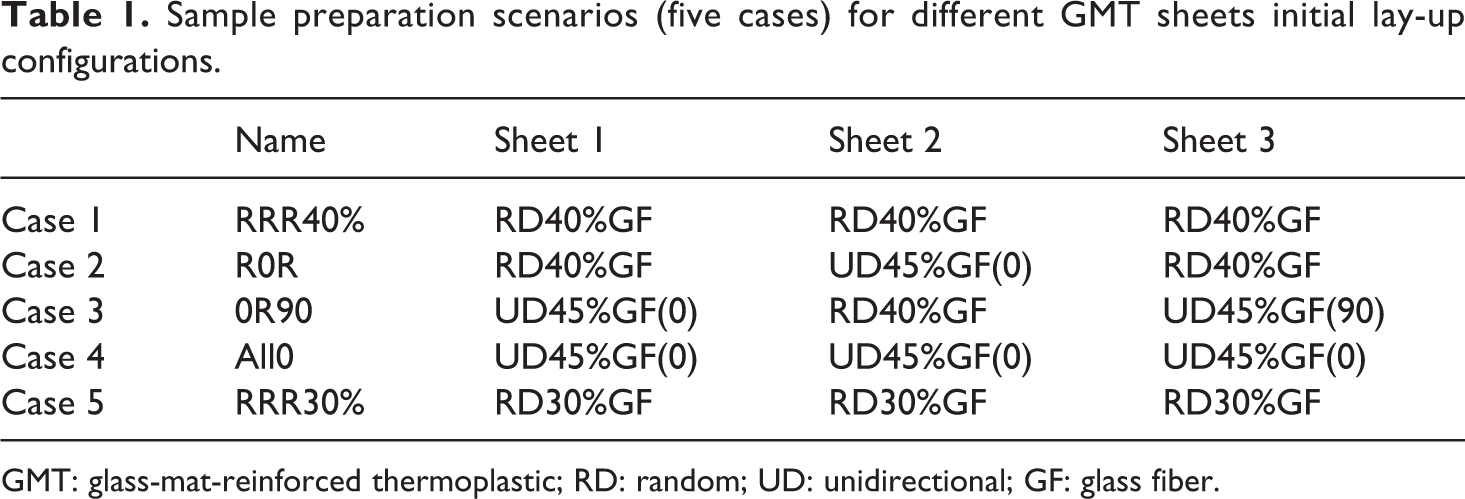
GMT: glass-mat-reinforced thermoplastic; RD: random; UD: unidirectional; GF: glass fiber.
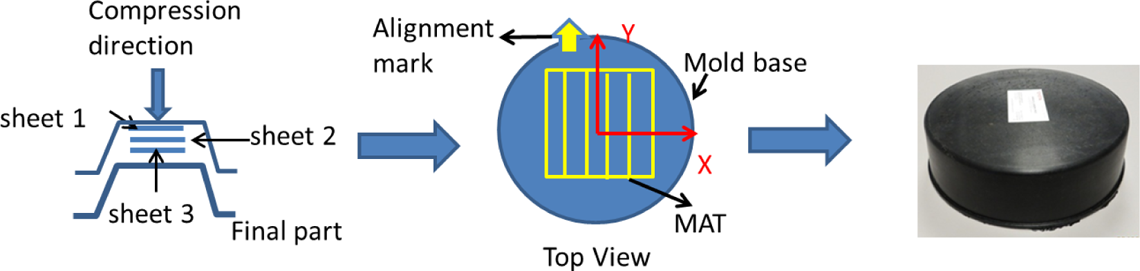
GMT material manufacturing process and the shape of the final part. GMT: glass-mat-reinforced thermoplastic.
Tensile and bending samples are cut using a water-jet cutting technique from the top surface of the tub-shaped part. The detailed location of the samples is presented in Figure 3. It is intended to account for the initial alignment of the fiber in the stack of the GMT sheets. Therefore, when the test samples are cut for tensile and bending test, from the finished part, appropriate marking is made on the samples. The test samples aligned along the UD fibers in the initial GMT sheets are called longitudinal, and test samples cut aligned perpendicular to the UD fibers in the initial GMT sheets are called transverse. In the cases where all the three GMT sheets used are RD (i.e. cases 1 and 5), the samples are still called longitudinal and transverse for consistency with the other tests; it is understood that material properties are similar in both the directions.
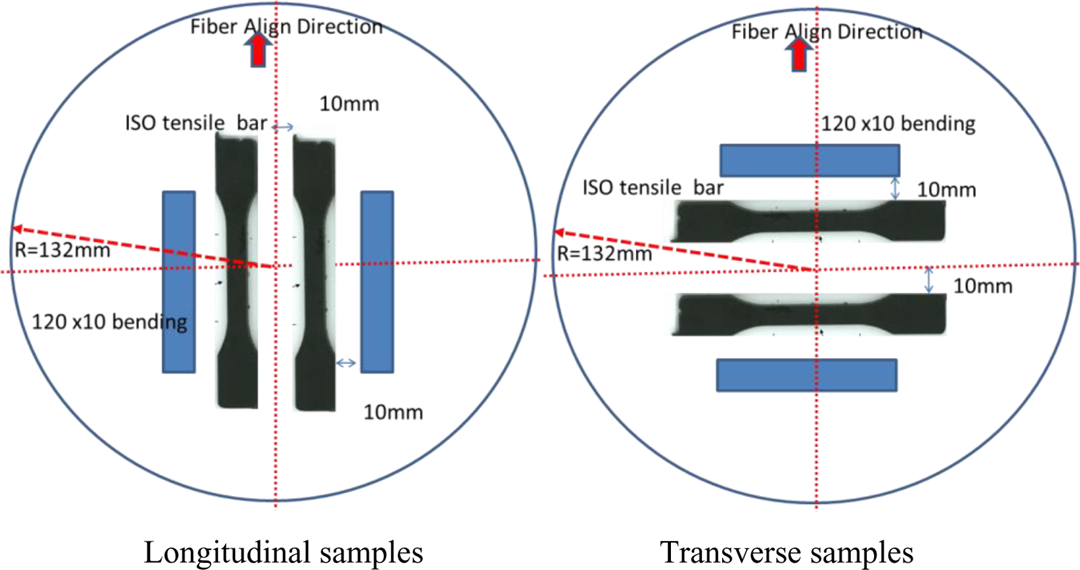
Tensile/bending coupon test sample at longitude direction in the final part.
The strength and stiffness evaluation, for the tensile and bending bar samples, is done using Instron machine (series 5900 from Universal Testing Systems). We investigated five different stacking conditions, and the results of the tensile tests are presented in Figures 4 and 5. The details of the bending tests are presented in Figures 6 and 7.
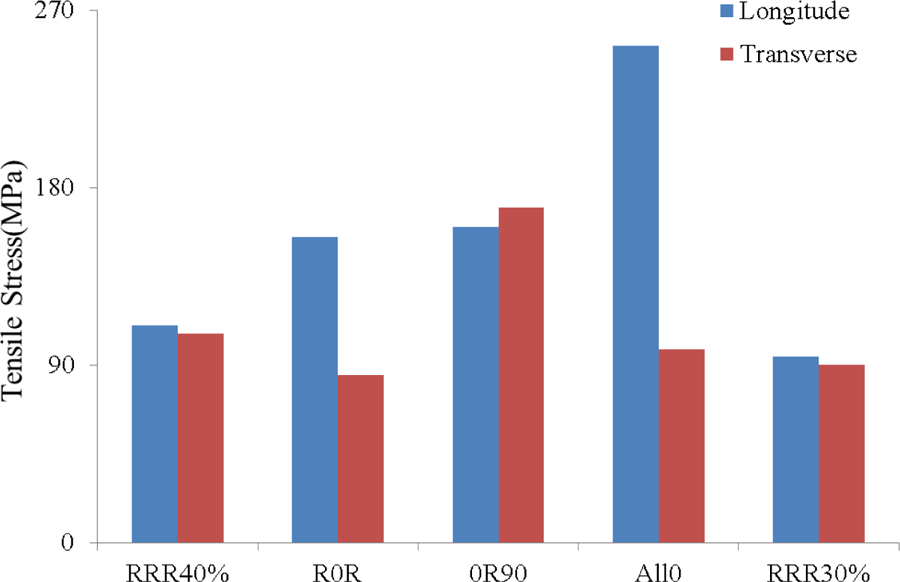
Tensile stress results for longitudinal and transverse samples for cases 1–5.
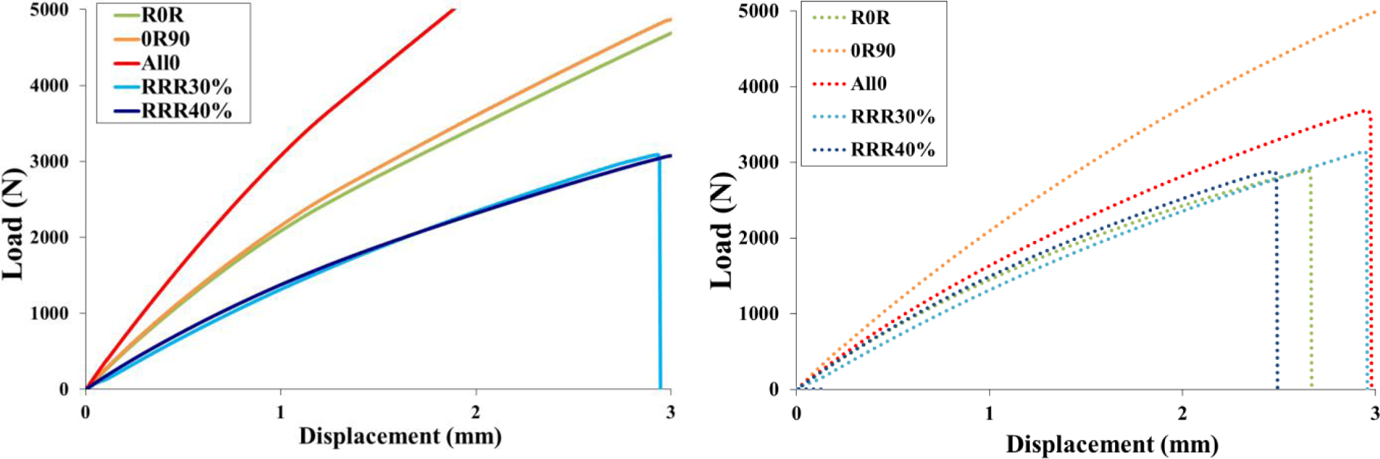
Load–displacement curve from tensile test for longitudinal and transverse samples for cases 1–5.
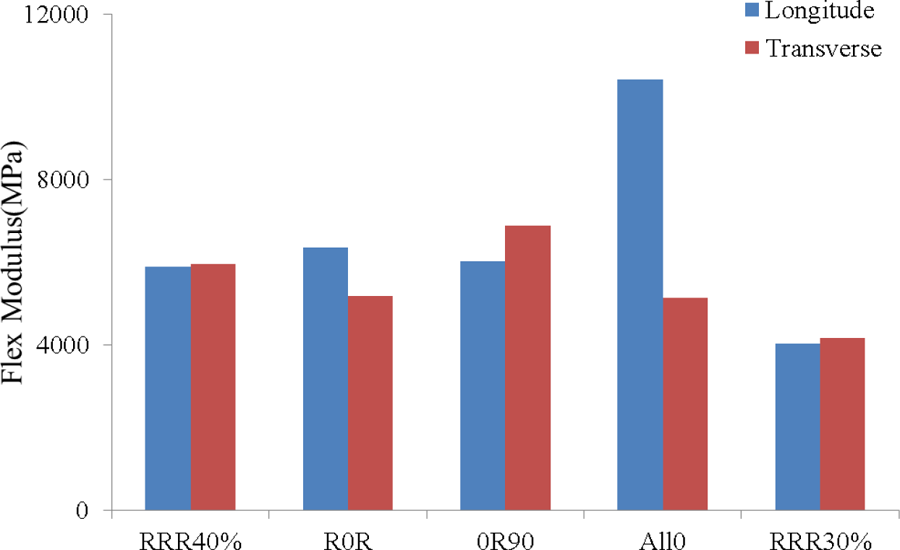
Bending results for longitudinal and transverse samples for cases 1–5.
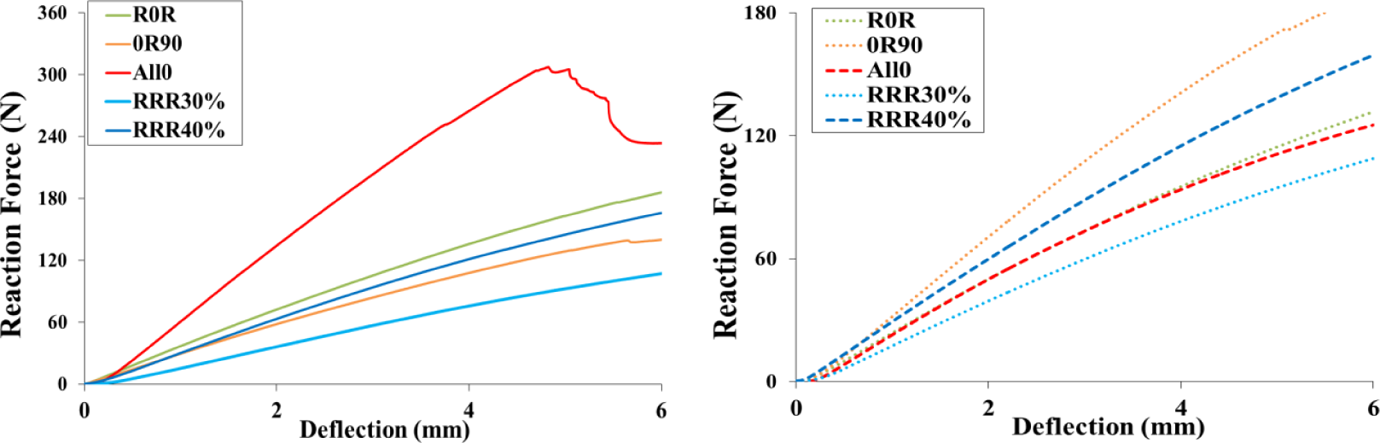
Force–deflection curve from bending test for longitudinal and transverse samples for cases 1–5.
The tensile test strength and flex modulus show similar trends. The sample from initial sheets with most fibers aligned in one direction (case 4) shows the highest anisotropy and also the highest load capacity, along the fibers. Also, we see that in the cases 1 and 5, the anisotropy is nonexistent as all the fibers we started with are RD. It is interesting to observe case 3 which shows good load capability in both the directions. Essentially the fibers in the finished part retain the directional trends that existed in the initial stack of sheets before compression. It is observed that since the flow of material from the initial GMT sheet to the part is short, the fiber orientation trends are maintained through the thickness, while the thickness of each layer might be altered due to diffusion.
FEA
CM process simulation
Injection modeling of glass fiber (GF)–reinforced thermoplastic composite in particular is a well-established field and simulation packages such as Moldex3D 17 or Moldflow 18 in the industry in practice for many years. However, simulation of CM of such a material, in which a heated material is compressed at high pressure to fill the mold cavity, is still a developing field. This is mainly because when the heated charge is squeezed, the flow of material is a combination of deformation of the solids and flow of viscous fluids. Taking the advantage of recent advances, 17 Moldex3D R12 added capability to simulate CM of a charge compressed on a solid surface. Moldex3D R14, developed by CoreTech System Co., Ltd. in Taiwan, the latest version, has fine-tuned the solver to improve simulation formulations. The following section describes how flow behavior of the resin is numerically captured in Moldex3Ds CM module.
The CM process has several main stages, including preheat, compression, cooling, and warpage. The true three-dimensional (3D) finite volume method (FVM)-based algorithm to simulate the process has been developed in previous studies. 19,20 The compression action is modeled by a novel moving mesh boundary technique, where the computational domain will dynamically deform with time. Through the whole analysis, the polymer melt is assumed to behave as generalized Newtonian fluid with compressibility. Hence the non-isothermal 3D flow motion can be mathematically described by the following conservation laws for mass, momentum, and energy:


where
A volume fraction function

A high-resolution interface capturing scheme differencing method 21 is applied to avoid interface being blurred.
The collocated cell-centered FVM proposed by Chang and Yang 19 was modified to discrete the governing equations (1)–(3). The numerical method is basically a SIMPLE-like FVM with improved numerical stability and convergence for non-isothermal and non-Newtonian flow. Pressure, velocity, and temperature fields are segregated in the solver, so that the efficiency can be achieved even for the 3D calculation. Special numerical techniques are incorporated in the flow solver, so that the numerical convergence and accuracy can be achieved for the highly nonlinear system.
The following second-order orientation tensor is introduced to describe the fiber orientation of a group of fiber:
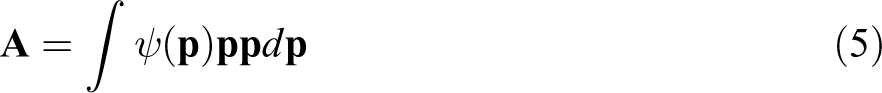
where
Moldex3D developed the improved anisotropic rotary diffusion (iARD)-retarding principal rate (RPR) model
23
to predict the fiber orientation change over time during the filling and compression phase. This is an improvement over the ARD model.
24
The RPR model is indicative of RPR to slow down the fast transient orientation rate. The iARD-RPR model uses three parameters to define fiber orientations as follows: Ci: Fiber–fiber interaction parameter, Cm: Fiber–matrix interaction parameter, Alpha: Slow down transient fiber response.
The other challenge is the initial fiber orientation in the initial charge. It has been observed that the initial condition can have significant impact of the final fiber orientations. In the experiment, we have used different configurations in the stack of GMT sheets (Figure 8) to get different final properties. Therefore, it is important to have the capability to define the fiber orientation in the initial charge, used in the simulation and to account for GMT sheets orientations in the stack.
CM process in Moldex3D. CM: compression molding.
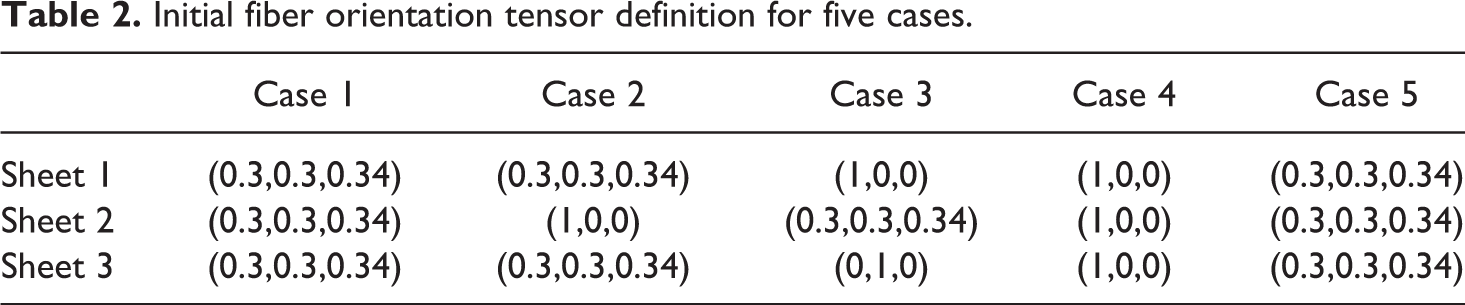
In the CM simulation, the initial fiber orientation tensor (1, 0, 0) is used as a representative of UD sheet, while the initial fiber orientation tensor (0.33, 0.33, 0.34) is used as a representative of the RD sheet. This fiber orientation tensor based on the type of sheets used in the sheet enables to define the initial condition of the charge for CM. The fiber orientation used for each case is presented in Table 2.
Initial fiber orientation tensor definition for five cases.
The material properties used for the CM simulation are shown in Table 3. The basic CM simulation parameters are shown in Table 4.
Material properties used for the simulation.
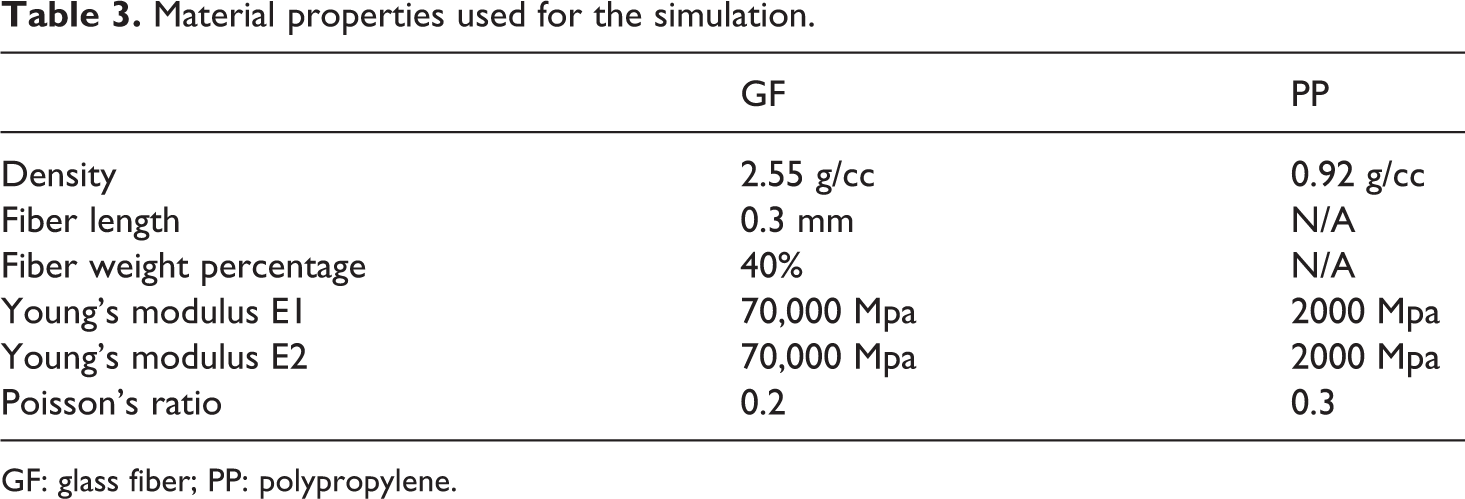
GF: glass fiber; PP: polypropylene.
CM parameters used for the simulation.
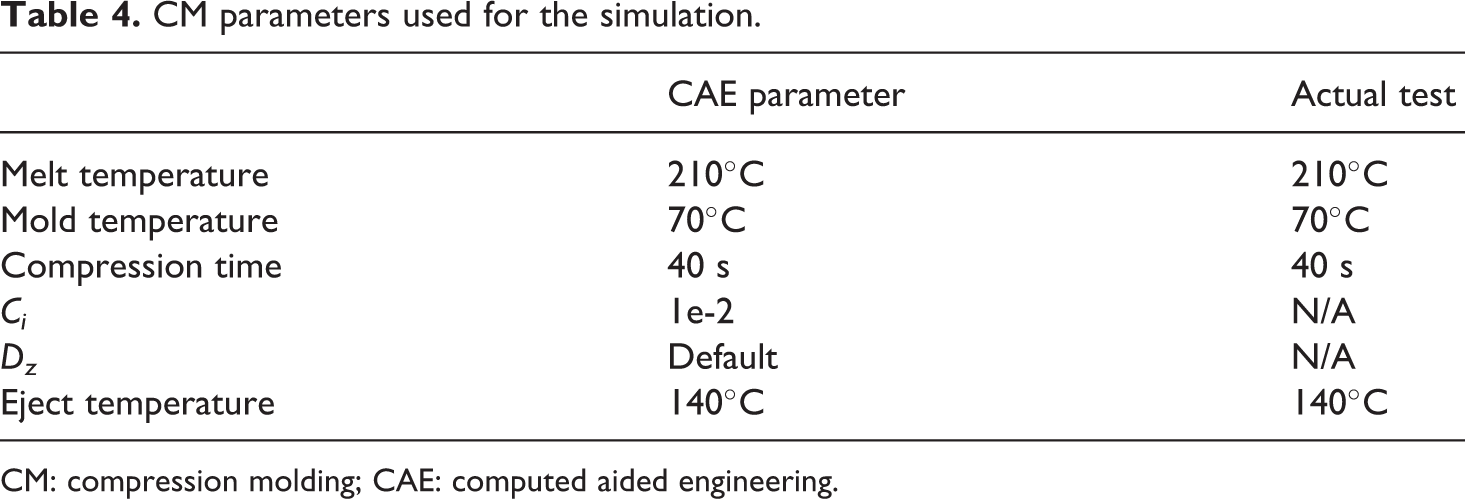
CM: compression molding; CAE: computed aided engineering.
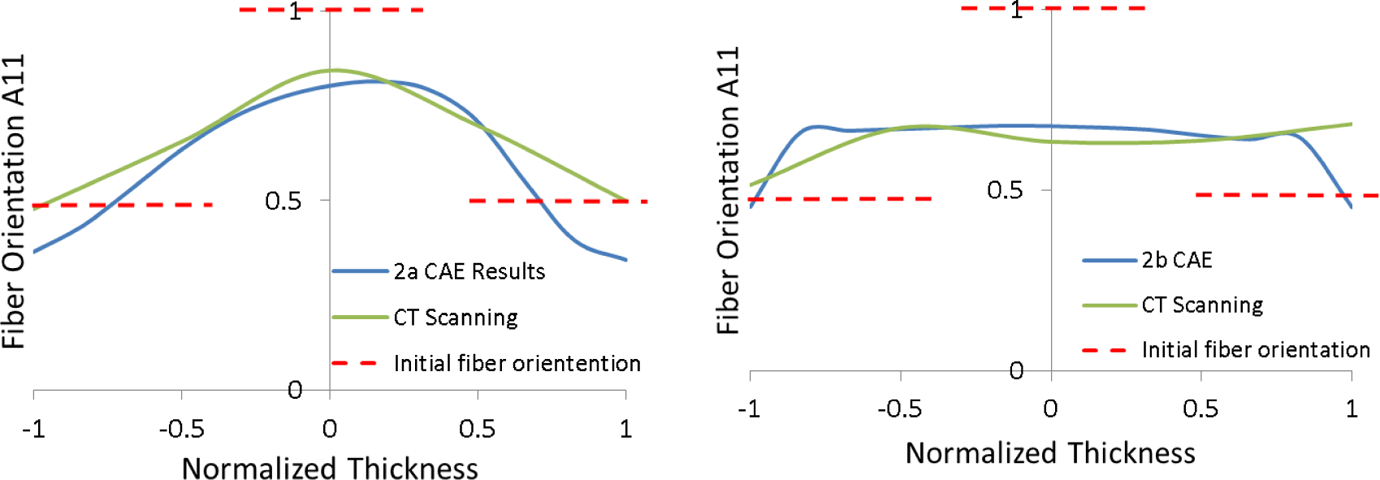
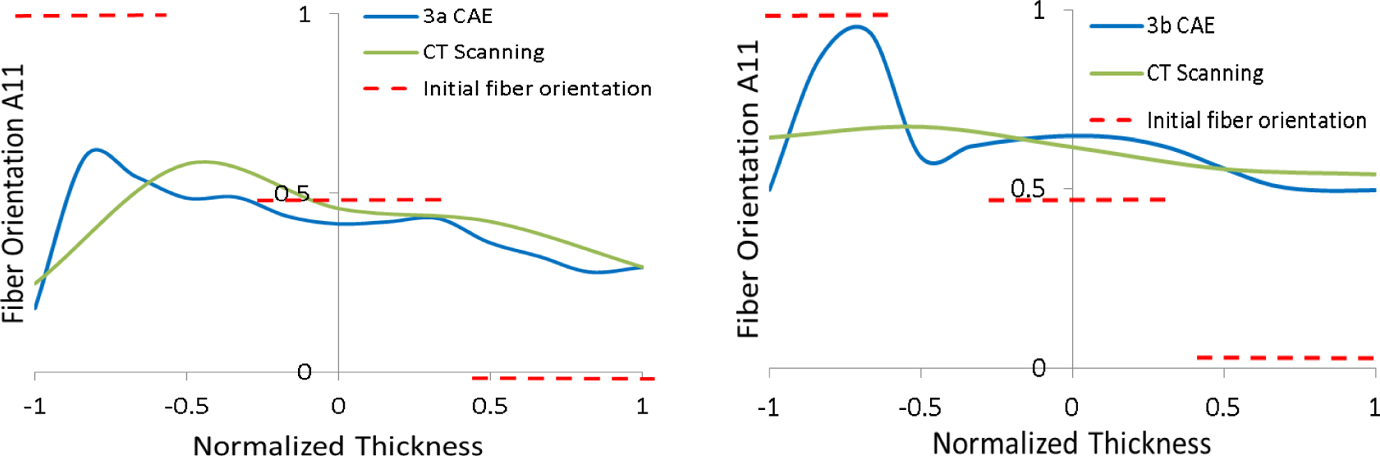
To validate the predicted fiber orientation, representative samples such as sample “A”, located at the top surface of the part, and sample “B”, from the wall of the tub were cut and analyzed to measure the fiber orientation tensor in the part. Detail locations of samples A and B are shown in Figure 9. Cross-sectional images with resolution of 3 μm were obtained, using Skyscan μCT1172 Micro-CT apparatus at various depths, 3 μm apart, to capture the fiber orientation through the thickness. The images obtained from Micro-CT were then analyzed using Mimics® Innovation Suite (Materialise NV, Belgium) 25 and then analyzed using our in-house orientation tensor measurement approach. 26 The measured fiber orientation for cases 1, 2, 3, and 5 is presented in Figures 10 to 13, respectively (case 4 was not measured as all the fibers are in one direction only and it was considered not important for verification). The results show that the measured and computed fiber orientation in A11 direction at both locations, that is, A and B is similar in trends. Also, we observe that as the material flows the initial orientation of the fiber changes and moves such that more and more fibers are aligned in the flow direction. Since the material at location B has longer history of flow, the orientation at those location moves and aligns more with flow direction. This is consistent with the previous study. 27 Also, we observe that the fiber near skin shows very little tendency to change the initial orientation, and we believe this is the result of friction and resistance to flow near the mold surface (skin), which means less flow and less alignment of the fiber along the flow.
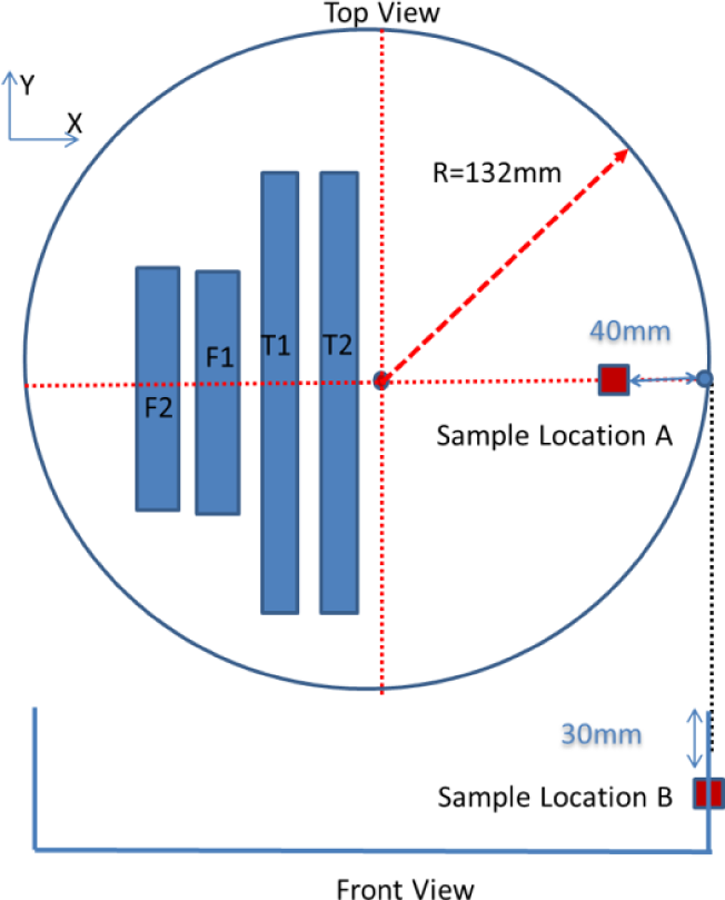
Locations of fiber orientation tensor measurement at A and B.
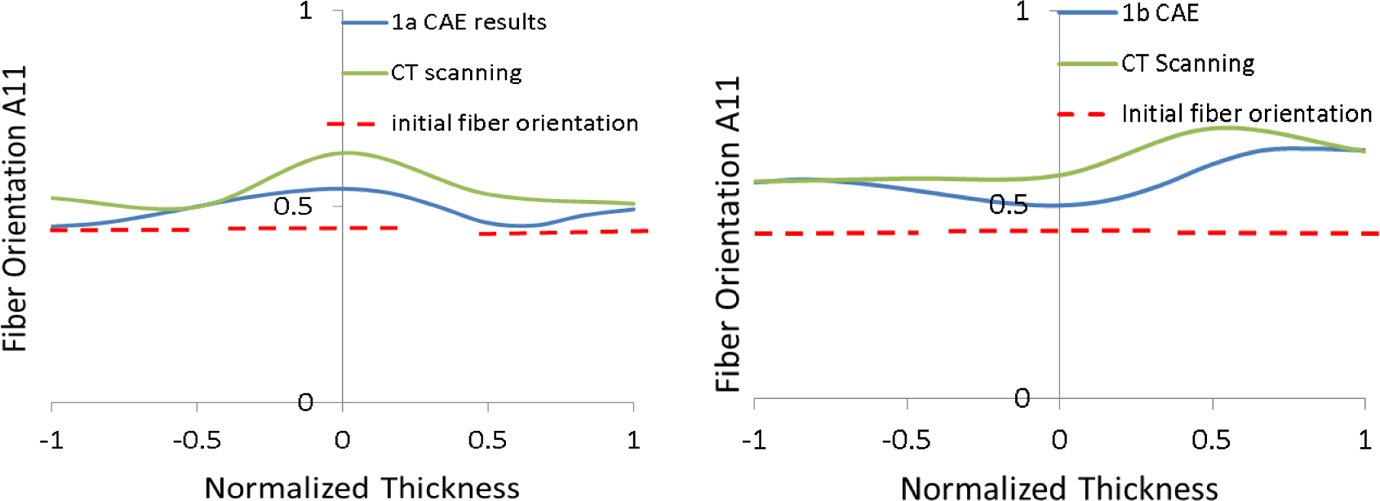
Comparison of the fiber orientation tensor at X-direction between simulation and test at locations A and B for case 1 (RRR40%).
Comparison of the fiber orientation tensor at X-direction between simulation and test at locations A and B for case 2 (R0R).
Comparison of the fiber orientation tensor at X-direction between simulation and test at locations a and b for case 3 (0R90).
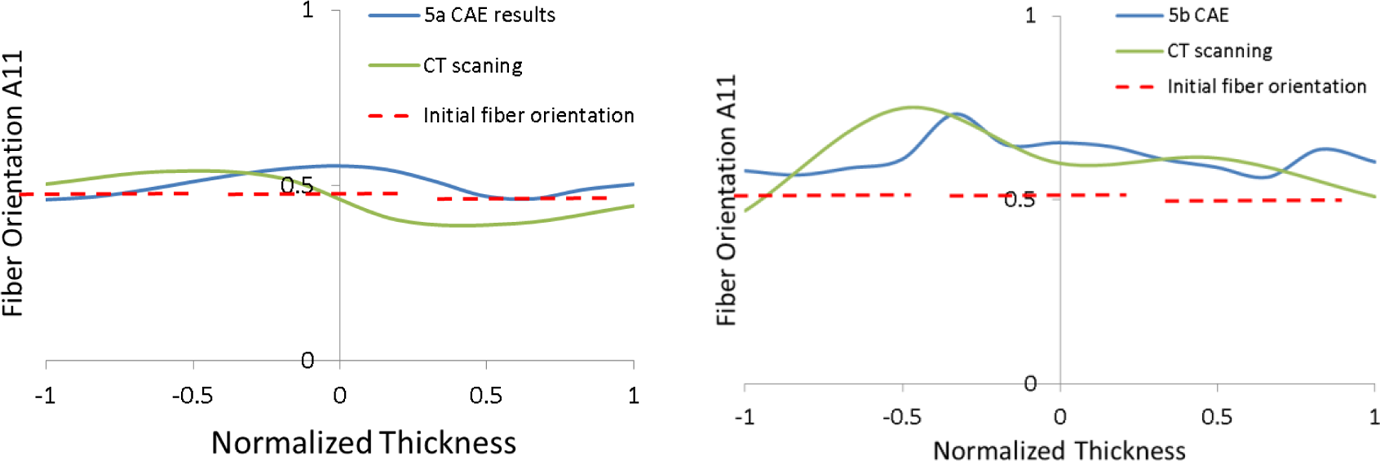
Comparison of the fiber orientation tensor at X-direction between simulation and test at locations A and B for case 5 (RRR30%).
Nonlinear structural FEA simulation for the tensile and bending test
The multiscale structural FE models for the tensile and bending test samples are built, and the results of the simulation are compared with the actual test to validate the modeling approach. The material properties of the finished part depend on the fiber length, fiber orientation, and fiber concentration. The traditional approach is to estimate the fiber orientation in the part at each location and develop material model using the homogenization approach to get the material properties for use in the structural FE analysis (FEA). The fiber orientation in the finished part can be estimated through the CM simulation discussed in the previous section. Method to predict the fiber length has appeared for the injection molding 28 in the recent years. Their usage in the CM is not established yet. Method to predict the fiber concentration through the part is not available yet. In most cases, current practice in the industry is to use the predicted orientation, while the fiber length and concentration are assumed based on the measurement at few location and known information.
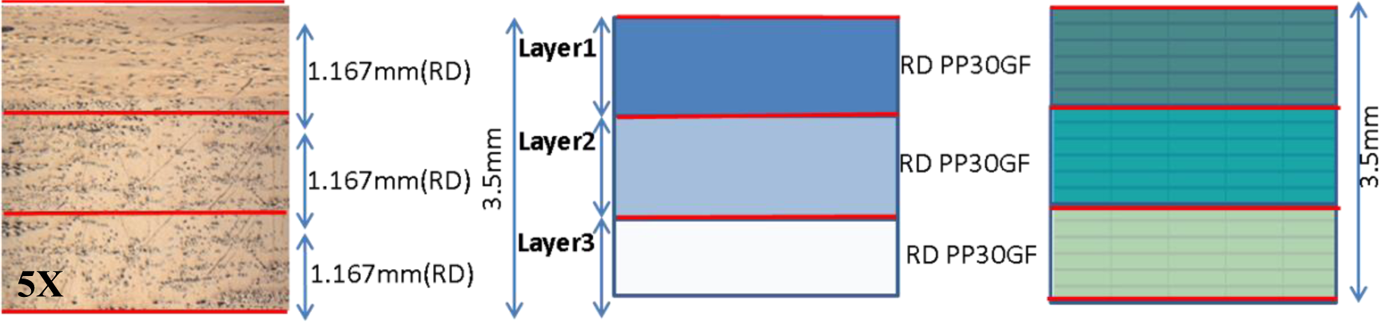
In this study, we are using a unique semi-empirical approach to estimate the fiber length and concentration. The cross section of finished parts for each type of sample (cases 1–5 in Table 1) is examined under optical microscope to study the microstructure. The sample is cut from location A as shown in Figure 14, and the typical optical microscopic image is also presented. As seen in Figure 15(a), it is observed that there are many distinct layers in the cross section. It is also observed that the layers in the finished part can be loosely correlated with the layers of fibers in the initial stack of GMT sheets used to make the part. Since the condition of the layer in the initial stack of GMT sheets is known, it is postulated that the fiber length and concentration in each layer in the finished part can be estimated.
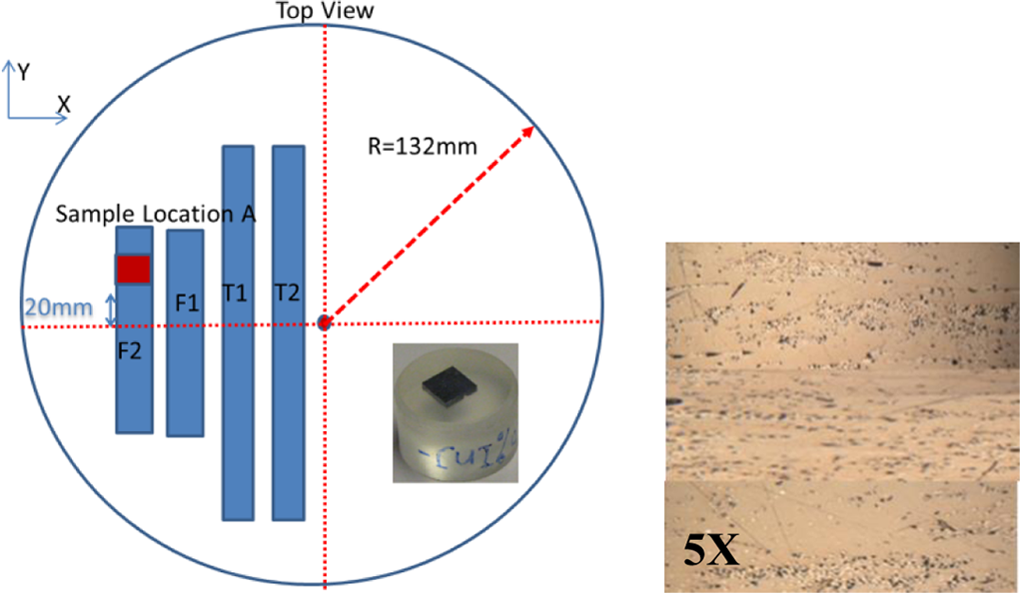
Location of the sample for optical metallography analysis and its typical optical images.
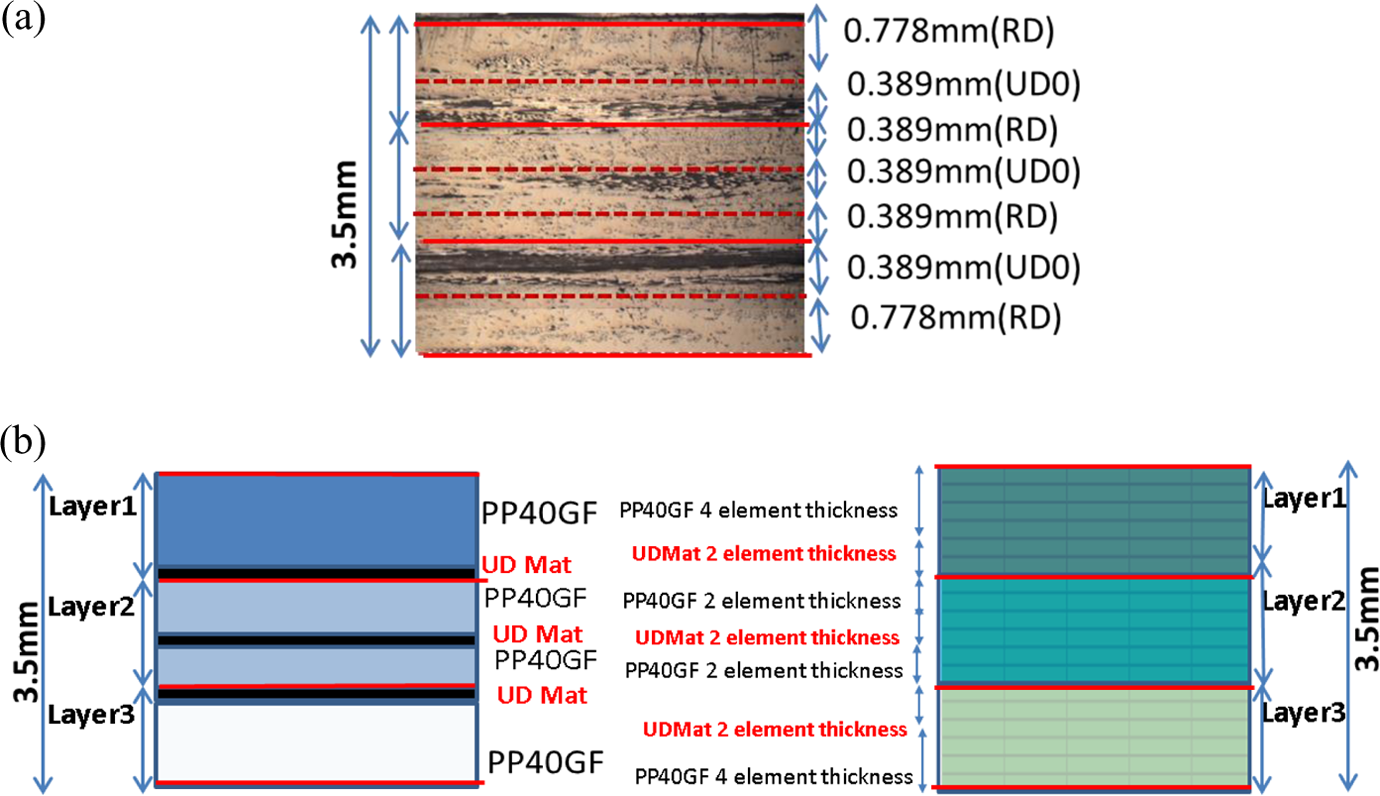
(a) Optical microscopic image of the cross thickness sample cut for case 4. (b) The corresponding FEA model details (cross-sectional view) to model the part in case 4. FEA: finite element analysis.
Figure 16 shows the basic ABAQUS model for the tensile and bending simulations. There are 18 layers of brick elements through the thickness for both tensile and bending samples used in the simulation. The main purpose of using such dense mesh is to capture the microstructure detail varying through the thickness in the material. Figure 15(a) indicates that the optical image of microstructure for case 4. It has detailed information about the fiber alignment and the surrounding resin. The thickness of each layer in the finished part is estimated from the microstructure image and then the empirically estimated fiber length and concentration are mapped on the FE model on layer-to-layer basis. For example, for case 4, presented in Figure 15(b), the first layer is estimated to be PP40GF, thickness = 0.778 mm, and is mapped on the first four layer of elements in the FE model. The fiber concentration for this layers is assumed to be 40%, the fiber orientation is mapped from CM simulation, and fiber length is used based on the past experience of such materials. Next layer is considered to be made of UD tape, thickness = 0.389 mm, and it is mapped on the two consecutive layers of elements in the FE model. The fiber is assumed to be continuous (aspect ratio = 999), aligned in one direction, and a fiber concentration of 45%. Similarly, each distinct layer from the image of the cross section is mapped in the FE model.
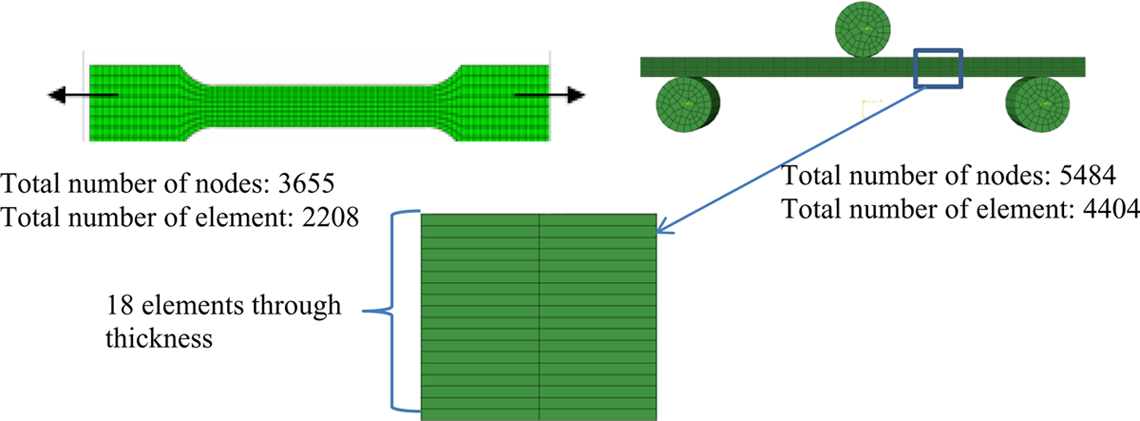
FEA model for the tensile and bending and the cross-sectional view through the thickness for the sample. FEA: finite element analysis.
Figures 17 to 20 show the similar optical microscopic analysis for cross section of the part for all other cases (cases 1, 2, 3, and 5). Based on the optical image analysis, the FEA model is developed for each of the five cases.
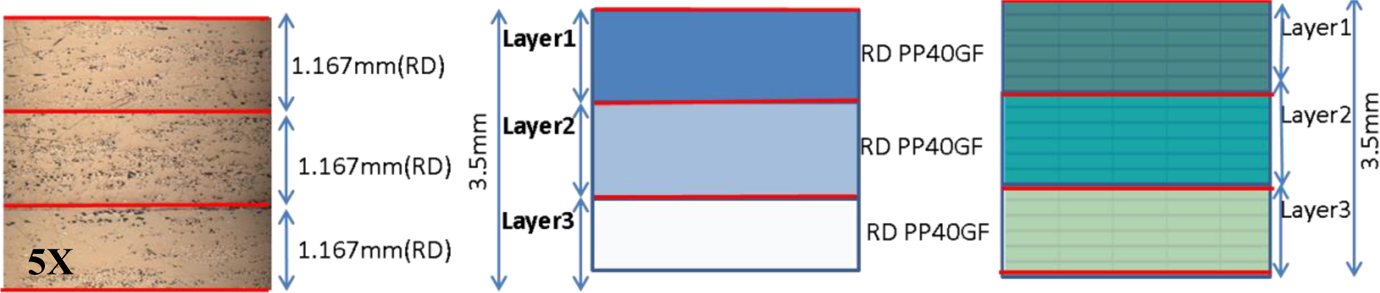
Optical microscopic image and corresponding FEA model information for case 1 (RRR40%). FEA: finite element analysis.
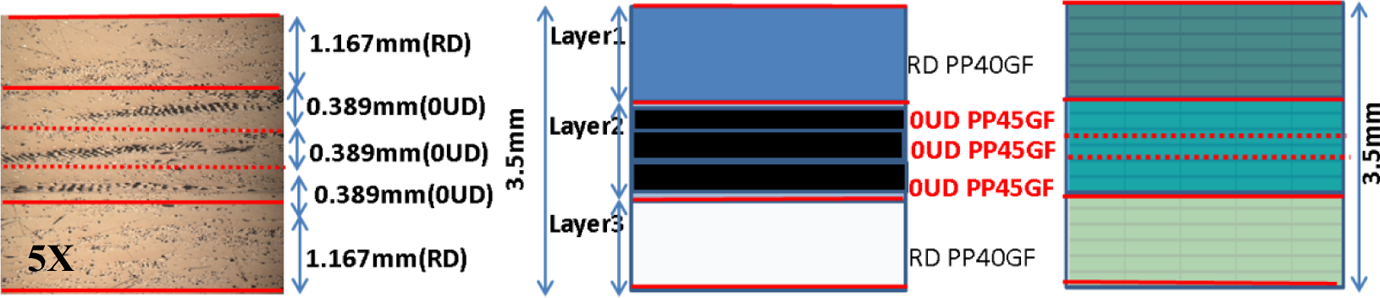
Optical microscopic image and corresponding FEA model information for case 2( R0R). FEA: finite element analysis.
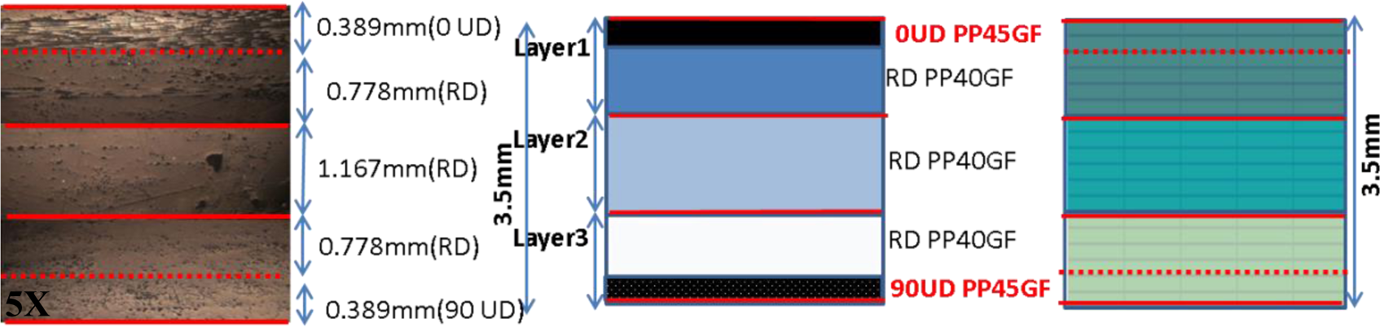
Optical microscopic image and corresponding FEA model information for case 3 (0R90). FEA: finite element analysis.
Optical microscopic image and corresponding FEA model information for case 5(RRR30%). FEA: finite element analysis.
Once the fiber condition in the finished part, that is, length, orientation, and concentrations is estimated, the material properties in the finished part are calculated using the Mori–Tanaka mean field homogenization approach. 14 The purpose of mean field homogenization is to compute approximate, estimates of the volume averages of the stress and strain fields, both at the representative volume element level (macro stresses and strains) and in each phase (fiber and matrix). The length and concentration are assumed to be constant in a given layer of test sample. The fiber orientation is assumed to be varying and is mapped from the compression-molded part to the test sample of FE model for each element. In Moldex3D, the fiber orientation can be exported using its FEA interface. Figure 21 showed the basic scenarios for ABAQUS–Digimat coupled analysis for tensile and bending bar. 29 –31
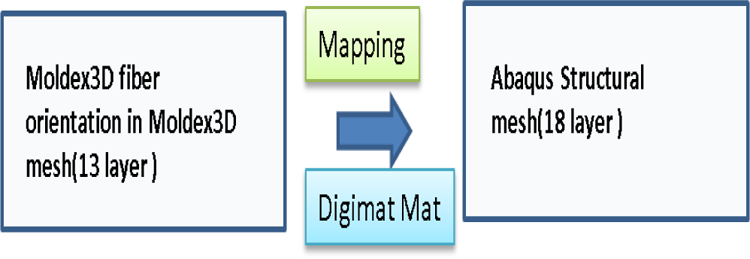
Scenarios for ABAQUS–Digimat coupled analysis.
Based on the proposed modeling approach, the material model was developed, and simulation was carried out using ABAQUS and Digimat. Figure 22 shows the comparison of the mechanical properties between test and CAE for case 4. The comparison shows a close match between the test and the FEA. The von Mises stress from Figure 23 also shows the detailed stress contour for tensile and bending samples in case 4. It illustrates the effect of the fiber orientation for the structural properties. Using a similar approach, the FEA can be performed in other four cases. Figures 24 to 27 show the comparison of the load and displacement curves for the remaining four cases.
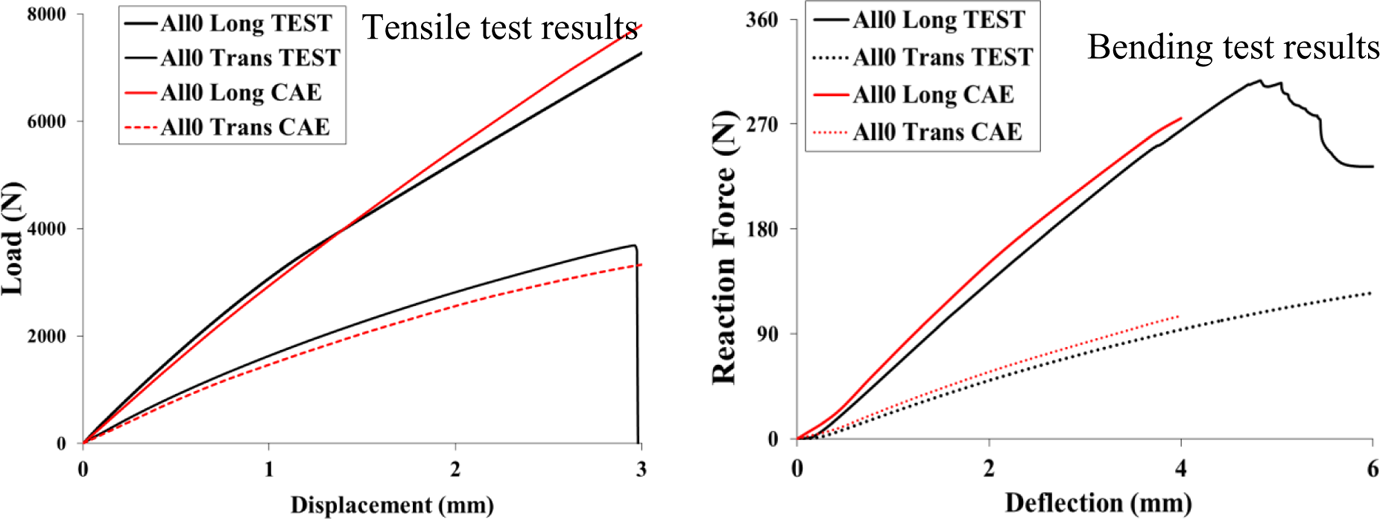
Comparison of the mechanical properties between test and CAE for case 4.
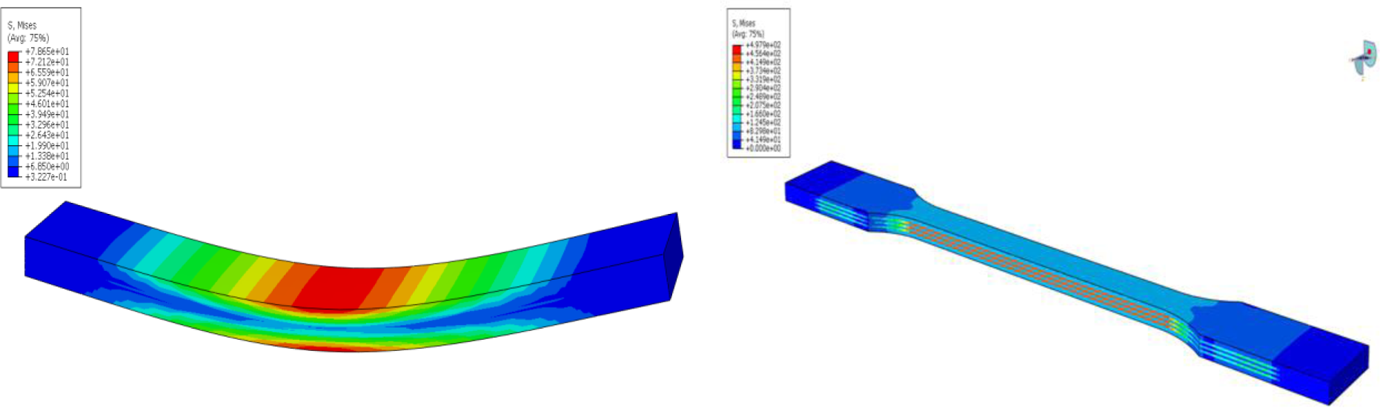
von Mises stresses (megapascal) contour for the bending and tensile test for case 4 in longitude direction.
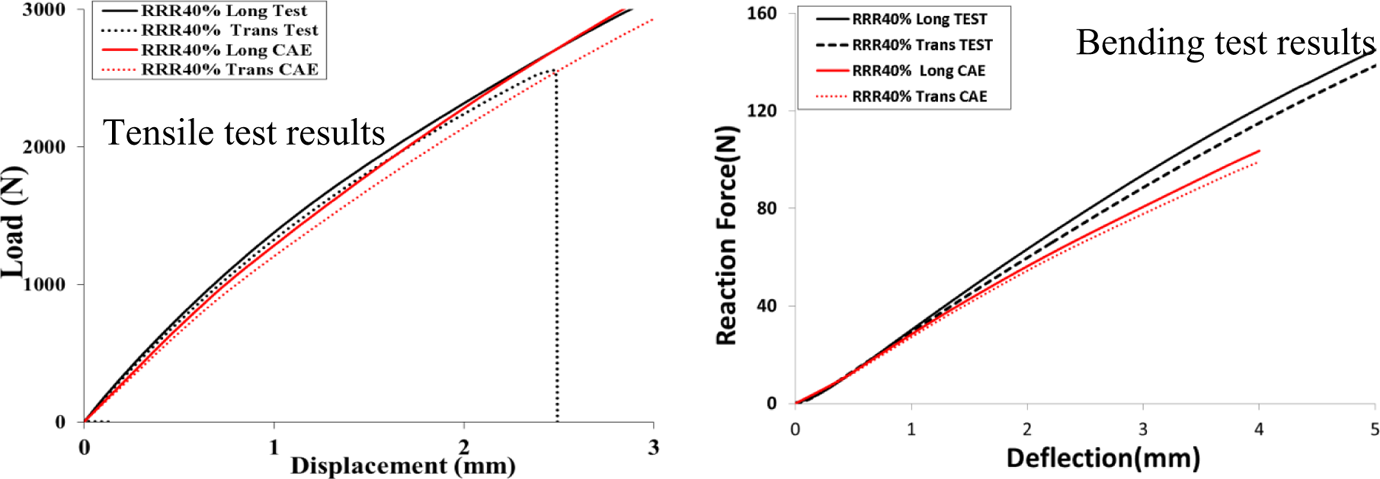
Comparison of the mechanical properties between test and CAE for case 1.
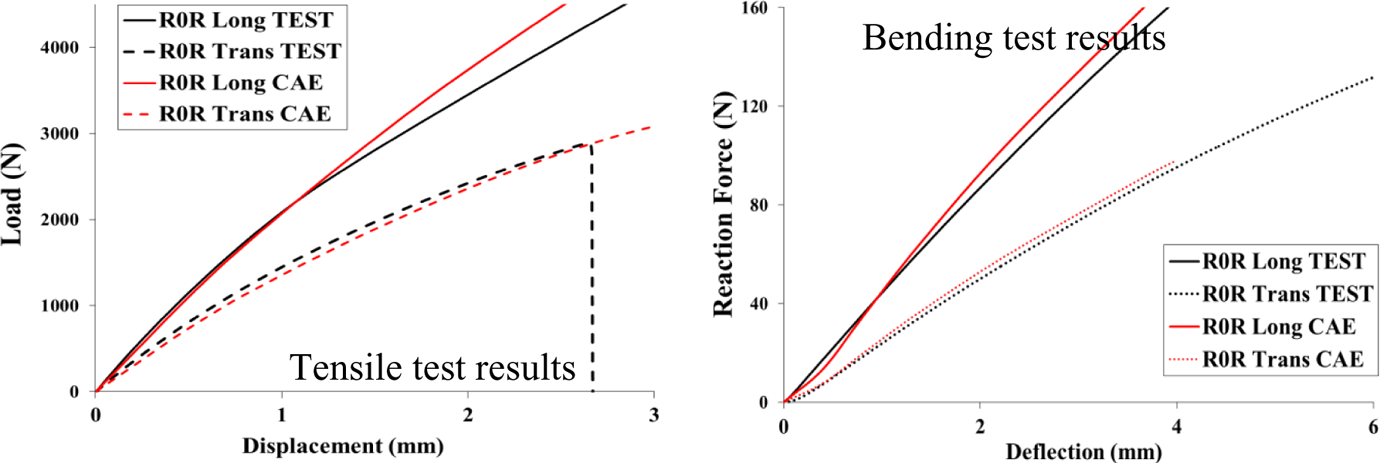
Comparison of the mechanical properties between test and CAE for case 2.
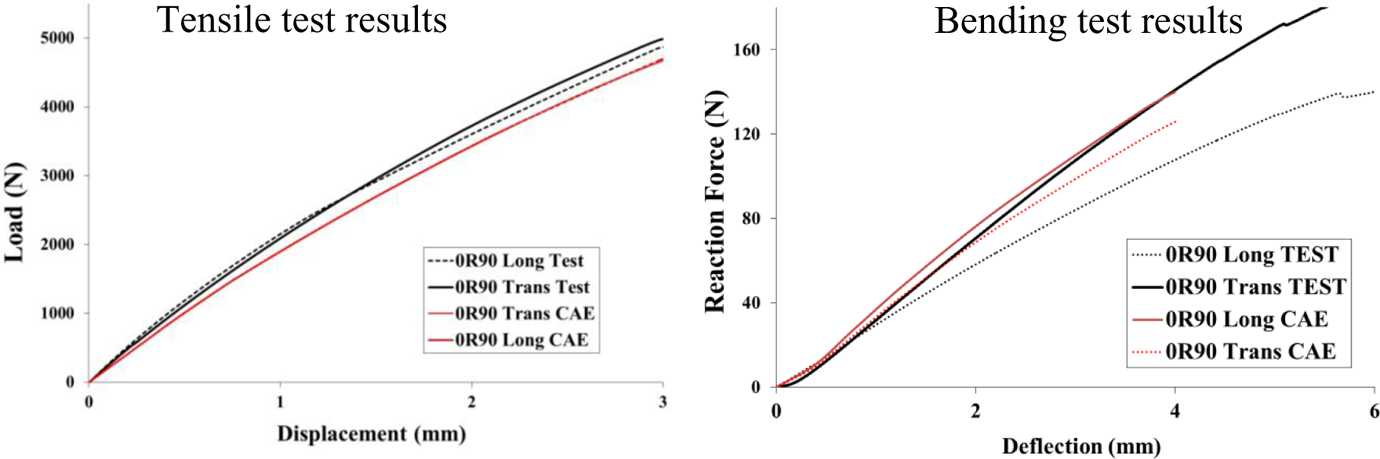
Comparison of the mechanical properties between test and CAE for case 3.
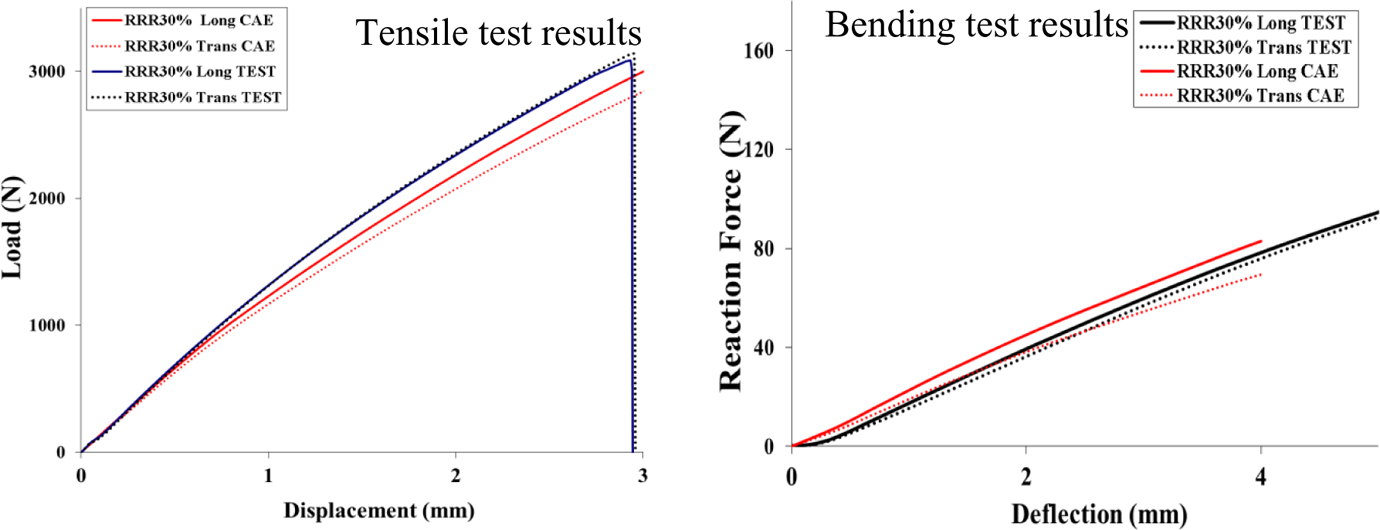
Comparison of the mechanical properties between test and CAE for case 5.
Conclusion
Effect of different stacking and initial orientation of GMT sheets on the structural properties of the finished tub-shaped part is investigated. The results show that the initial alignment of the fibers in the initial GMT sheets plays a significant role in the structural properties of the finished part. The CM of the GMT sheets is simulated using Moldex3D to estimate the fiber orientation is demonstrated and the predicted fiber conditions are compared with the measured values to validate the simulation. Finally, a unique empirical approach to estimate the fiber condition such as length and concentration for the compression molded part is proposed. The fiber condition is used to estimate the material model in the finished part. The prediction approach is validated through physical tests of tensile and bending coupons.
Footnotes
Acknowledgements
The authors gratefully acknowledge the support provided by Hanwha Advanced Materials America and Moldex3D Northern America, Inc. The initial preimpregnated sheet materials were supplied by Hanwha Advanced Materials America, and the final glass-mat-reinforced thermoplastic part was built at its Fenton facility in Michigan.
Declaration of conflicting interests
The author(s) declared no potential conflicts of interest with respect to the research, authorship, and/or publication of this article.
Funding
The author(s) received no financial support for the research, authorship, and/or publication of this article.