
Abstract
In the present study, polypropylene/nanoclay (PP/NC) and polypropylene/nano-calcium carbonate (PP/CC) nanocomposites with different weight percentages of filler were prepared using a twin-screw extruder. The effects of nanoparticles content on the nanocomposite were studied using the hardness measured under the applied loads in the range of 10–100 gf. It was observed that the microhardness increases with an increase in the nanofiller weight percentage. The hardness reaches its maximum for 1 wt% and 3 wt% for PP/NC and PP/CC, respectively. The results of the present study are evaluated by analytical methods proposed by Marsh and Tabor. For this purpose, mechanical properties of PP nanocomposites were obtained by uniaxial tensile and compression tests. The results were incorporated in Tabor and Marsh formula. According to the analytical methods, the results obtained from compression test were more accurate than those obtained from tensile test. In addition, variation of H/Y ratio (H and Y are microhardness and yield stress, respectively) versus the filler content under different applied loads was obtained. Finally, the Marsh model is modified in this work. The modified model proves more accurate in prediction of microhardness and H/Y ratio of PP nanocomposite at different applied loadings. The new proposed model correlates the yield stress, elastic modulus, and the applied load to microhardness.
Keywords
Introduction
Over the past decade, nanocomposite materials have found wide applications in diverse areas such as automobile, appliance, and electrical industries and due to their high strength/weight ratio have been the subject of many investigations. 1,2 Because of excellent mechanical properties and their reasonable cost, polypropylene (PP) has widely been used as the matrix for different nanoparticles-reinforced nanocomposites. The effect of adding inorganic nanofiller such as nanoclay (NC), nano-calcium carbonate (CC), and talc on the mechanical properties of PP has been the subject of many investigations over the past recent years. 3 –7
Mechanical properties of nanocomposite such as the elastic modulus and the yield stress are difficult to be obtained by tensile and compression test for small specimens. 8 Alternatively, the properties can be characterized by microhardness test as a fast, inexpensive, and nondestructive method that needs only a small amount of material to be tested. 8 –10 It must be mentioned that there are various formulations in the literature, which relate the hardness to other mechanical properties such as yield stress. Another advantage of microhardness test is that the morphology and microstructure of polymer-based composites can also be studied by this method. 11
Tabor 12 proposed a relation to obtain the conventional mechanical properties, particularly yield stress, from hardness measurement for metals by assuming a rigid-ideal plastic behavior for the materials. He found that the H/Y ratio, where H and Y are hardness and yield stress, respectively, is approximately 3 for metals. Because of the difference between tensile and compression yield stresses of polymer owing to hydrostatic stress, H/Y ratio is strongly dependent on the type of yielding. Flores et al. 13 investigated the relation between microhardness and yield stress of polyethylene (PE) samples having different morphologies by tensile and compression test. He fitted a straight line to the experimental data and found H/Yt = 3 and H/Yc = 2 where Yt and Yc are tensile and compressive yield stresses of material, respectively. Baltá-Calleja et al. 14 and Suwanprateeb 15 considered the viscoplastic effect on the yield stress of PE and reported the values of H/Y ratio for PE and calcium carbonate–PE composite. A number of models considering the role of elasticity in indentation were presented by Marsh and Johnson. 13 Kozlov et al. 16 used Marsh’s relation for PE with ultrahigh molecular weight bauxite and reported a good agreement between the experimental results and Marsh formula. Marsh and Johnson’s models were verified using the hardness of PE samples obtained by Flores et al. 13
Most of the studies in the field of polymer hardness have focused only on neat polymer and less attention has been paid to the study of the hardness of reinforced thermoplastic composites particularly nanocomposite materials. Moreover, microhardness is very sensitive to the applied force. The sensitivity is due to the strain softening of polymer, which may occur in large deformations. 17 Therefore, the correlation between indenter force and mechanical properties is a critical point that must carefully be dealt with in polymer hardness measurement. In this work, H/Y ratio of nanofiller-reinforced PP for different applied loadings is obtained and the results are compared with analytical approaches. Finally, the effects of weight percentage and type of nanofiller, which strongly influence the hardness and yield stress, on H/Y ratio are investigated. Moreover, a modified model is presented to correlate yield stress, elastic modulus, and applied load to microhardness.
Experiments
Specimens fabrication
PP with the density of 0.91 g cm−3 and the melt flow index of 6 g/10 min was used in this study. In order to obtain a better dispersion of NC in the matrix, the NC (montmorillonite (MMT)), the PP-g-MA as compatibilizer, and PP were initially mixed to obtain a master batch of 15 wt% in a corotating twin extruder. The master batch was diluted in the extruder with neat PP to produce 0.5, 1, 3, and 6 wt% nanocomposites. The temperature of extruder changed from 170°C in the first zone to 190°C in the die.
The nanocomposite pellets were dried in a vacuum oven at 80°C for 24 h before injection. The specimens for tensile and impact strength tests were prepared according to ASTM D638 and ASTM D6110 standards, respectively. The samples were fabricated using the injection molding within the temperature range of 190–210°C and at the molding temperature of 80°C.
Microhardness samples were 20 × 10 × 5 mm3 in dimension and were cut from the Charpy impact test specimens. The compression test samples had a disc-type shape with 10 mm diameter and 5 mm thickness and were cut out from the Charpy test specimens. Prior to hardness testing and to ensure a reliable microhardness measurement, the two surfaces of the samples were polished using a series of polishing cloths to obtain quite parallel and smooth surfaces. The above procedure was repeated to produce PP/CC nanocomposite specimens without using compatibilizer. The type and the weight percentage of filler of PP composite samples are given in Table 1.
The composition details of samples.
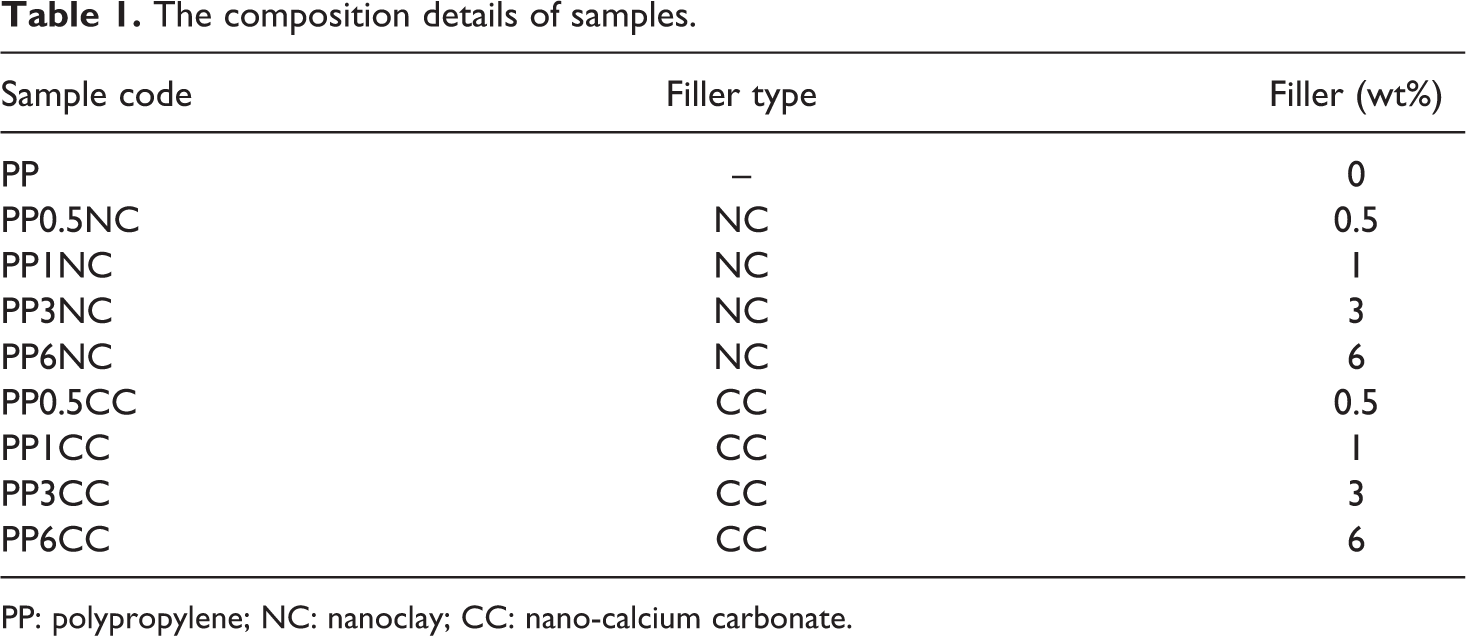
PP: polypropylene; NC: nanoclay; CC: nano-calcium carbonate.
Tests procedure
Tensile tests were accomplished on Amsler, HCT25 (Zwick/Roel, Germany) in accordance with ASTM D638 standard. The specimens had a gauge length of 50 mm and were pulled at a velocity of 0.05 mm s−1. Young’s modulus of the composite was taken as the slope of engineering stress–strain curve at the origin and was obtained using an extensometer. The yield stress was computed at the point of nominal stress–strain curve where the slope of the curve reaches zero. 18
Compression tests were also conducted on Amsler, HCT25 (Zwick/Roel) at the speed of 0.005 mm s−1 and for the maximum strain of 60%. Nominal strain rate was 0.001 s−1 for both of the tensile and the compression tests. Because of using grease as the lubricant for reducing friction between specimen and crosshead, no barreling was observed in the compression tests. The stress–strain curves in tensile and compression tests are depicted in Figures 1 and 2, respectively. As the figure indicates, no specific point can be recognized as the yield stress on the figure. Therefore, the yield stress was taken as the stress where the two tangents to the initial and the final parts of the nominal strain–stress curve intersect. 18
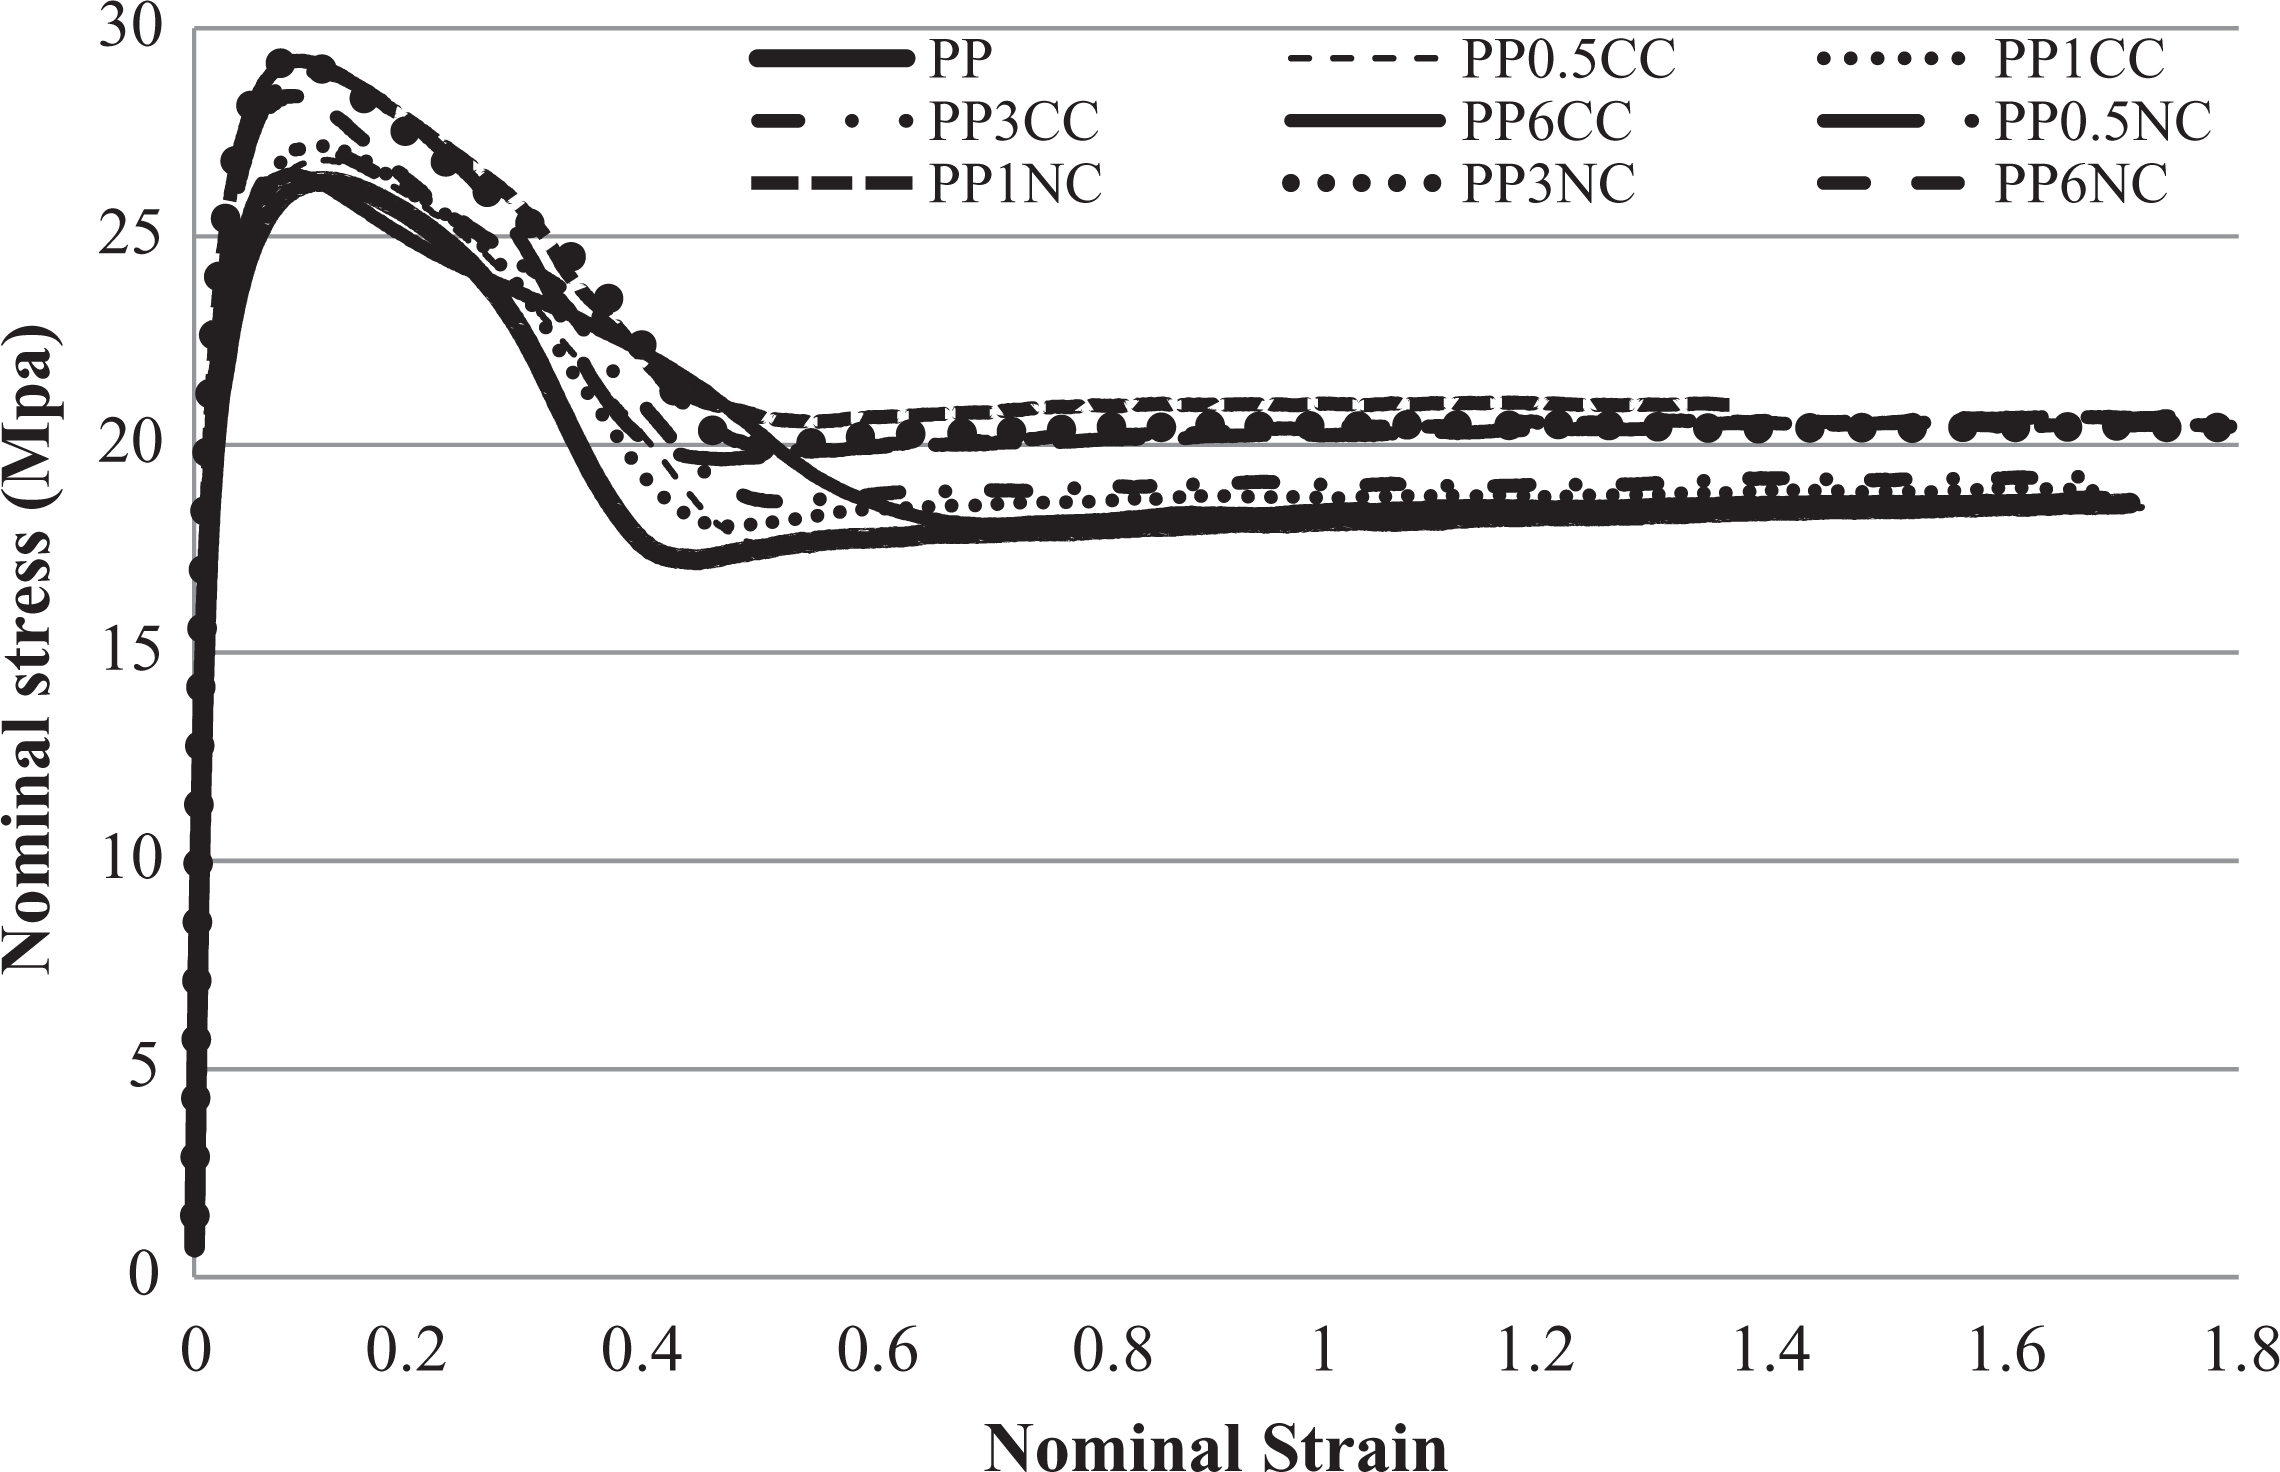
Tensile stress–strain curves for polypropylene nanocomposite.
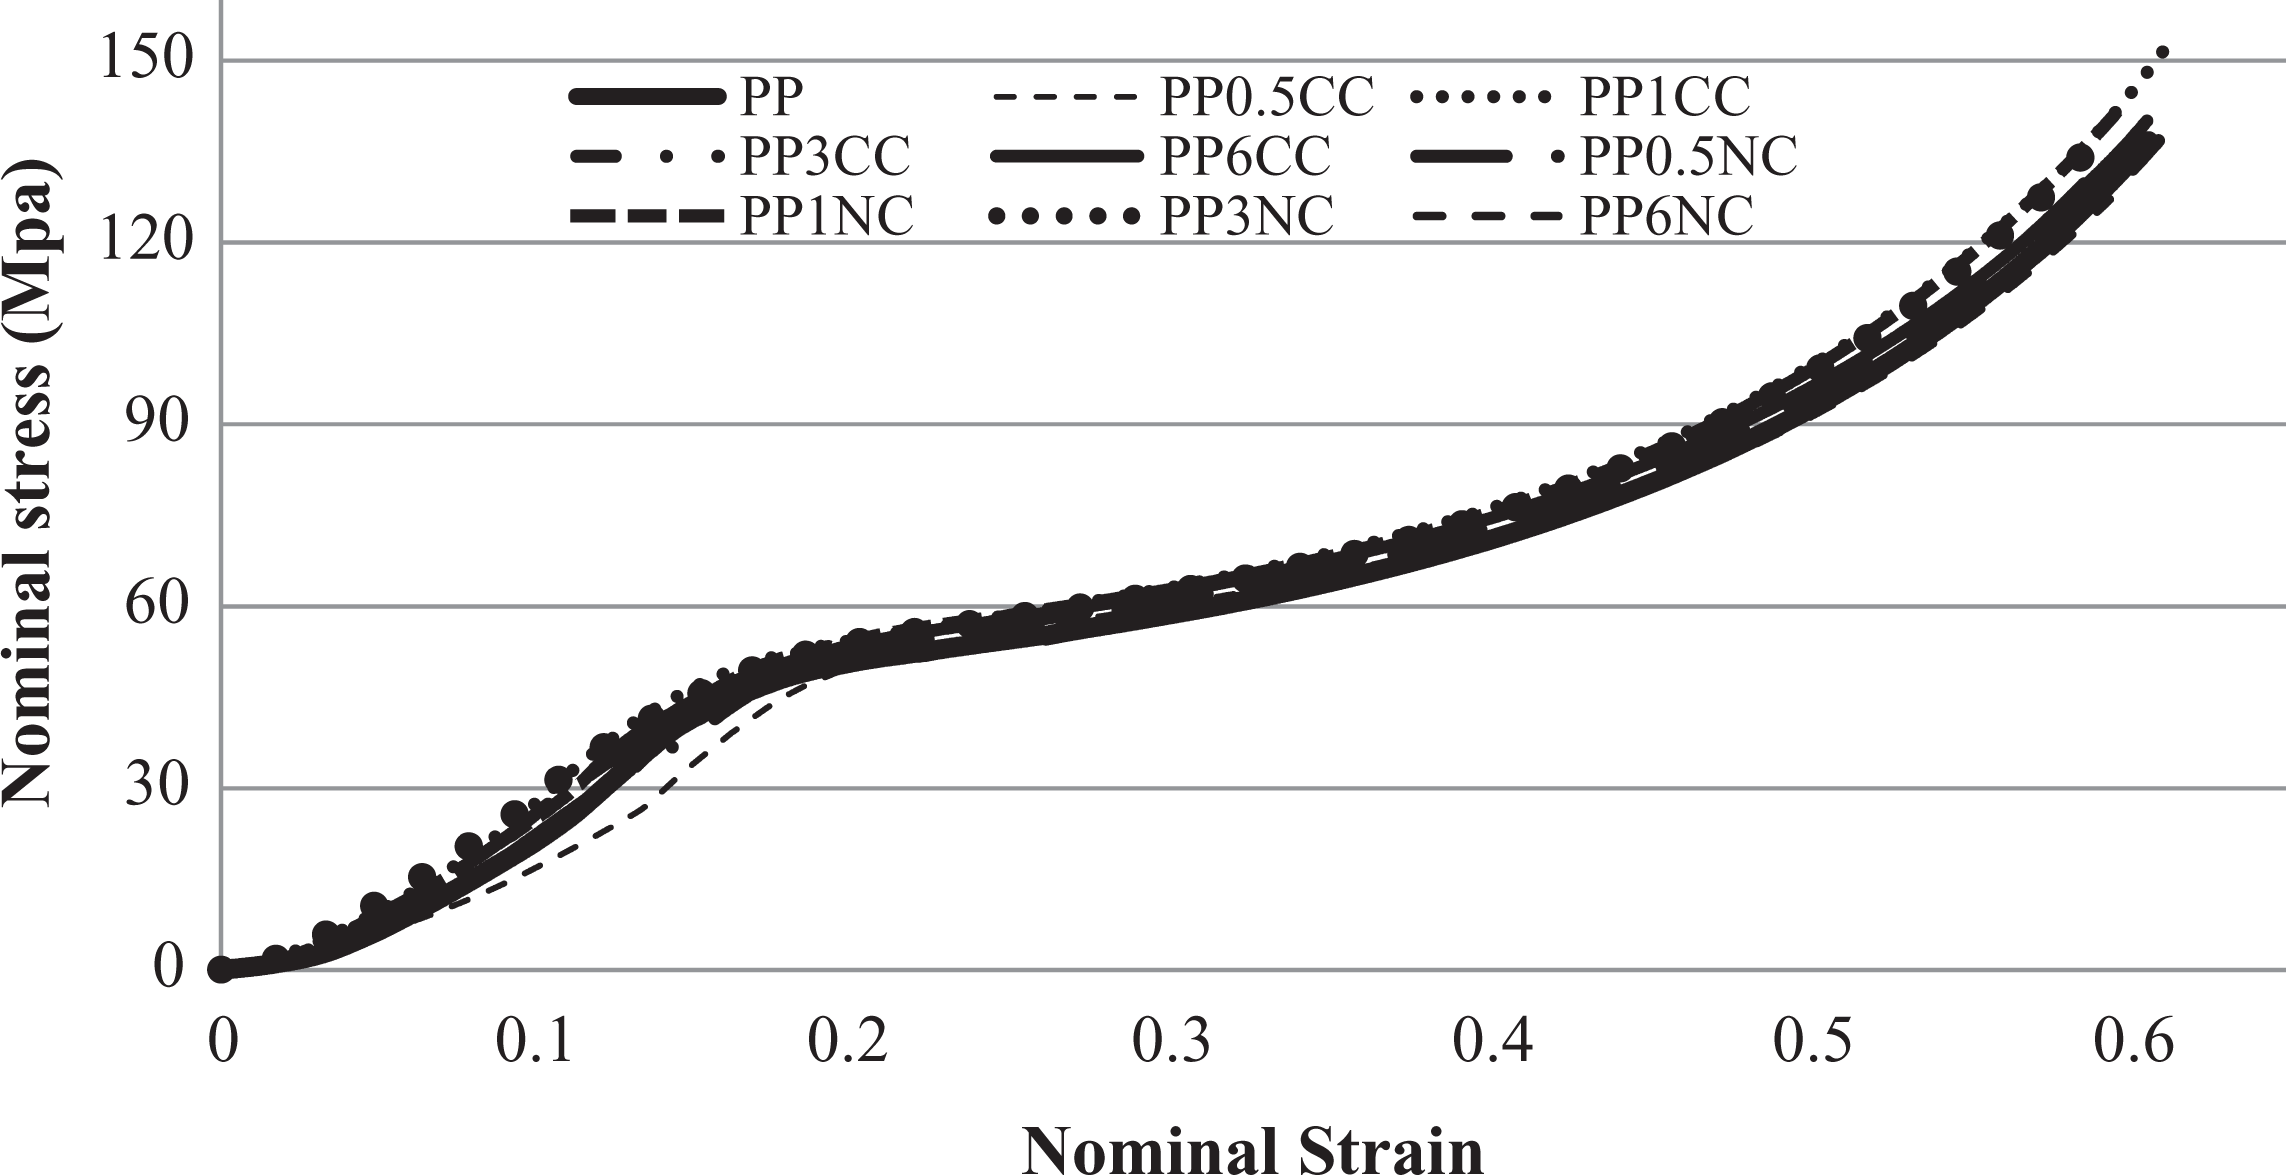
Compression stress–strain curves for PP nanocomposite. PP: polypropylene.
Microhardness tester (Buehler, Lake Bluff, Illinois, USA) was used to measure the Vickers hardness. The effect of loading on microhardness of nanocomposite was investigated by applying 10, 25, 50, and 100 gf for a duration of 30 s. The Vickers hardness was calculated from the following relation 13 :
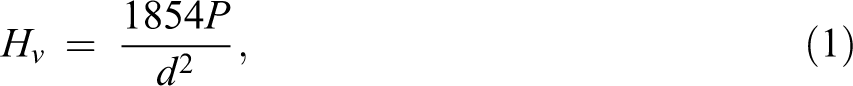
where Hv is microhardness (kg f mm−2), P is applied force (gf), and d (µm) is the average length of the two diagonals of indentation, which are measured by the optical microscope attached to the microhardness tester. At least, five different parts of samples were designated for hardness measurement and the average hardness was computed. It should be mentioned that all the tests were conducted and all measurements were made at room temperature.
Analytical model
The hardness of polymer was determined using some analytical relations. In Tabor’s approach, hardness is related only to the yield stress as follows 12 :
where σyield is the yield stress. In Marsh’s formula, hardness not only depends on yield stress but also is related to elastic modulus through the following equation:
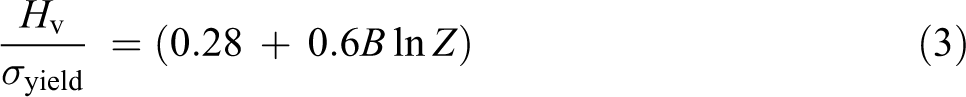
where we have:


where

where f is the applied load and A, B, C, and n are the constants which can be determined by four-dimensional curve fitting technique for both types of composites (PP/CC and PP/NC). The new aspects in the proposed model is that the coupled effects of load ( f ) and elasticity modulus (E), and additional linear term for the modulus are considered in the model. It must be mentioned that the previous models the either effect of load ( f n) or the ratio of elasticity modulus to yield stress (lnE/σyield) have been considered separately.
Results and discussion
Elastic modulus and yield stress
Variation of the yield stress and the elastic modulus of the nanocomposites versus NC and CC concentration for different filler contents are shown in Figures 3 and 4, respectively. The results shown in Figure 3 indicate that the compressive and tensile yield stresses increase with an increase in the NC content. The maximum increase in yield stress occurs for the composite containing 3 wt% in tension and 1 wt% in compression. Further increase in the NC content would result in a slight decrease in the yield stress, although still it remains higher than that of the polymer. In contrast to the tensile yield stress, the compression yield stress for the filler contents greater than 3 wt% is less than that of the PP. The main reason for the yield stress improvement is that the spherulite size of PP nanocomposite reduces owing to the dispersed filler particles acting as a nucleation agent. 21,22 However, the opposite effect of agglomeration, which may occur for higher percentage of filler content, can lead to the decrease in yield stress. 5,23
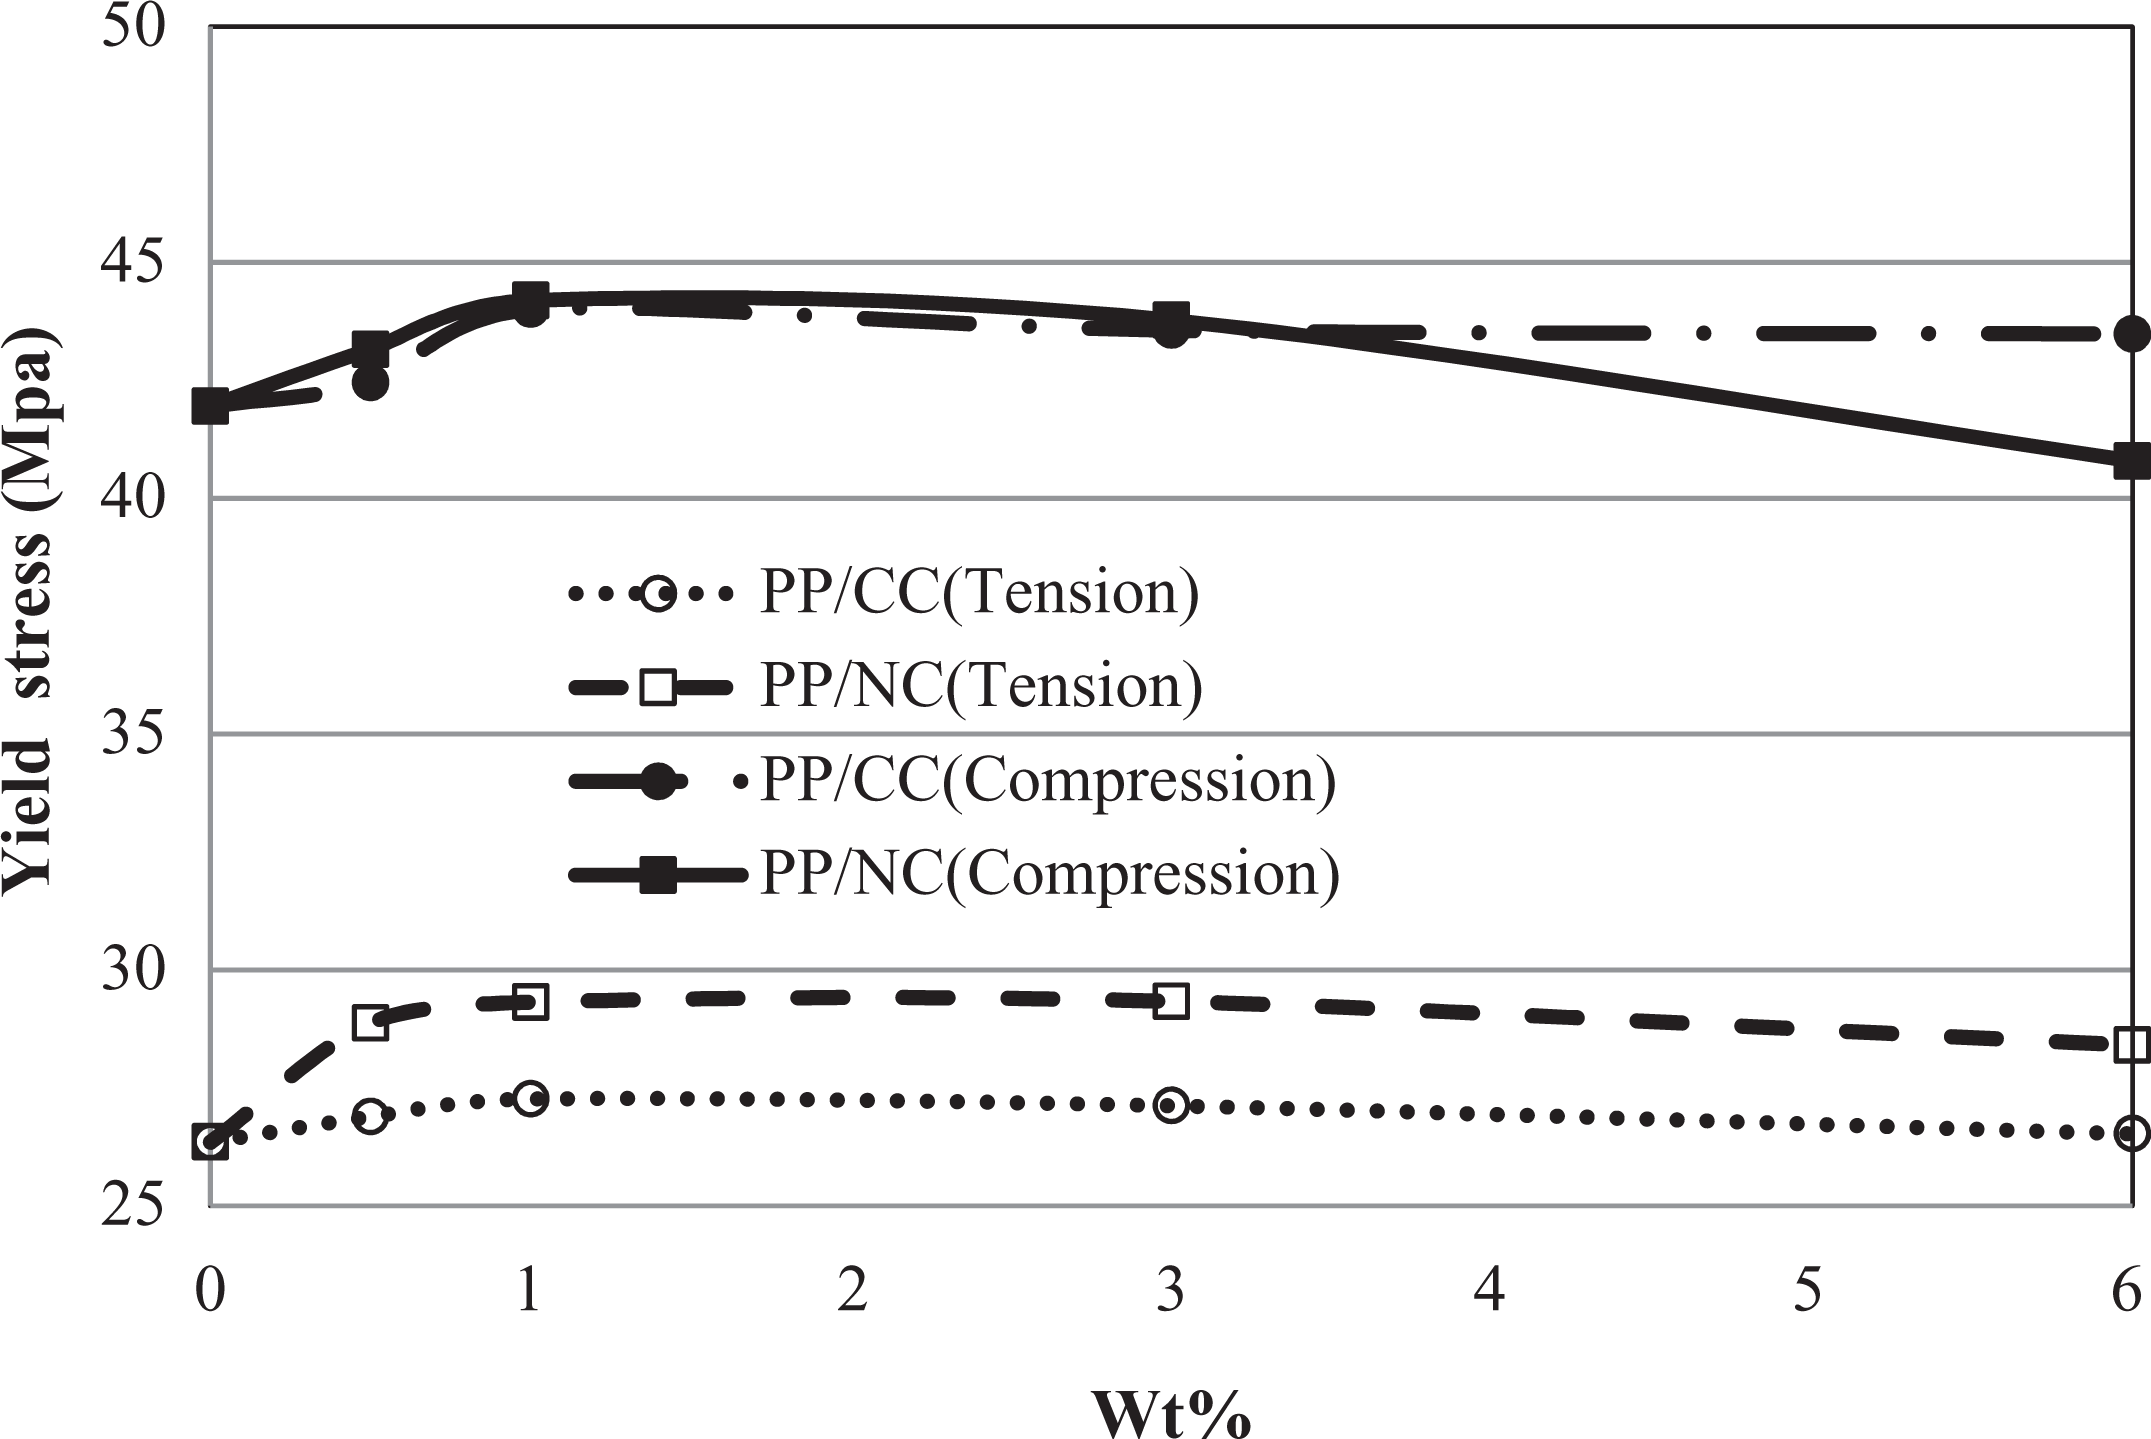
Variation of compressive and tensile yield stresses of PP/CC and PP/NC versus nanofillers content. PP/CC: polypropylene/nano-calcium carbonate; PP/NC: polypropylene/nanoclay.
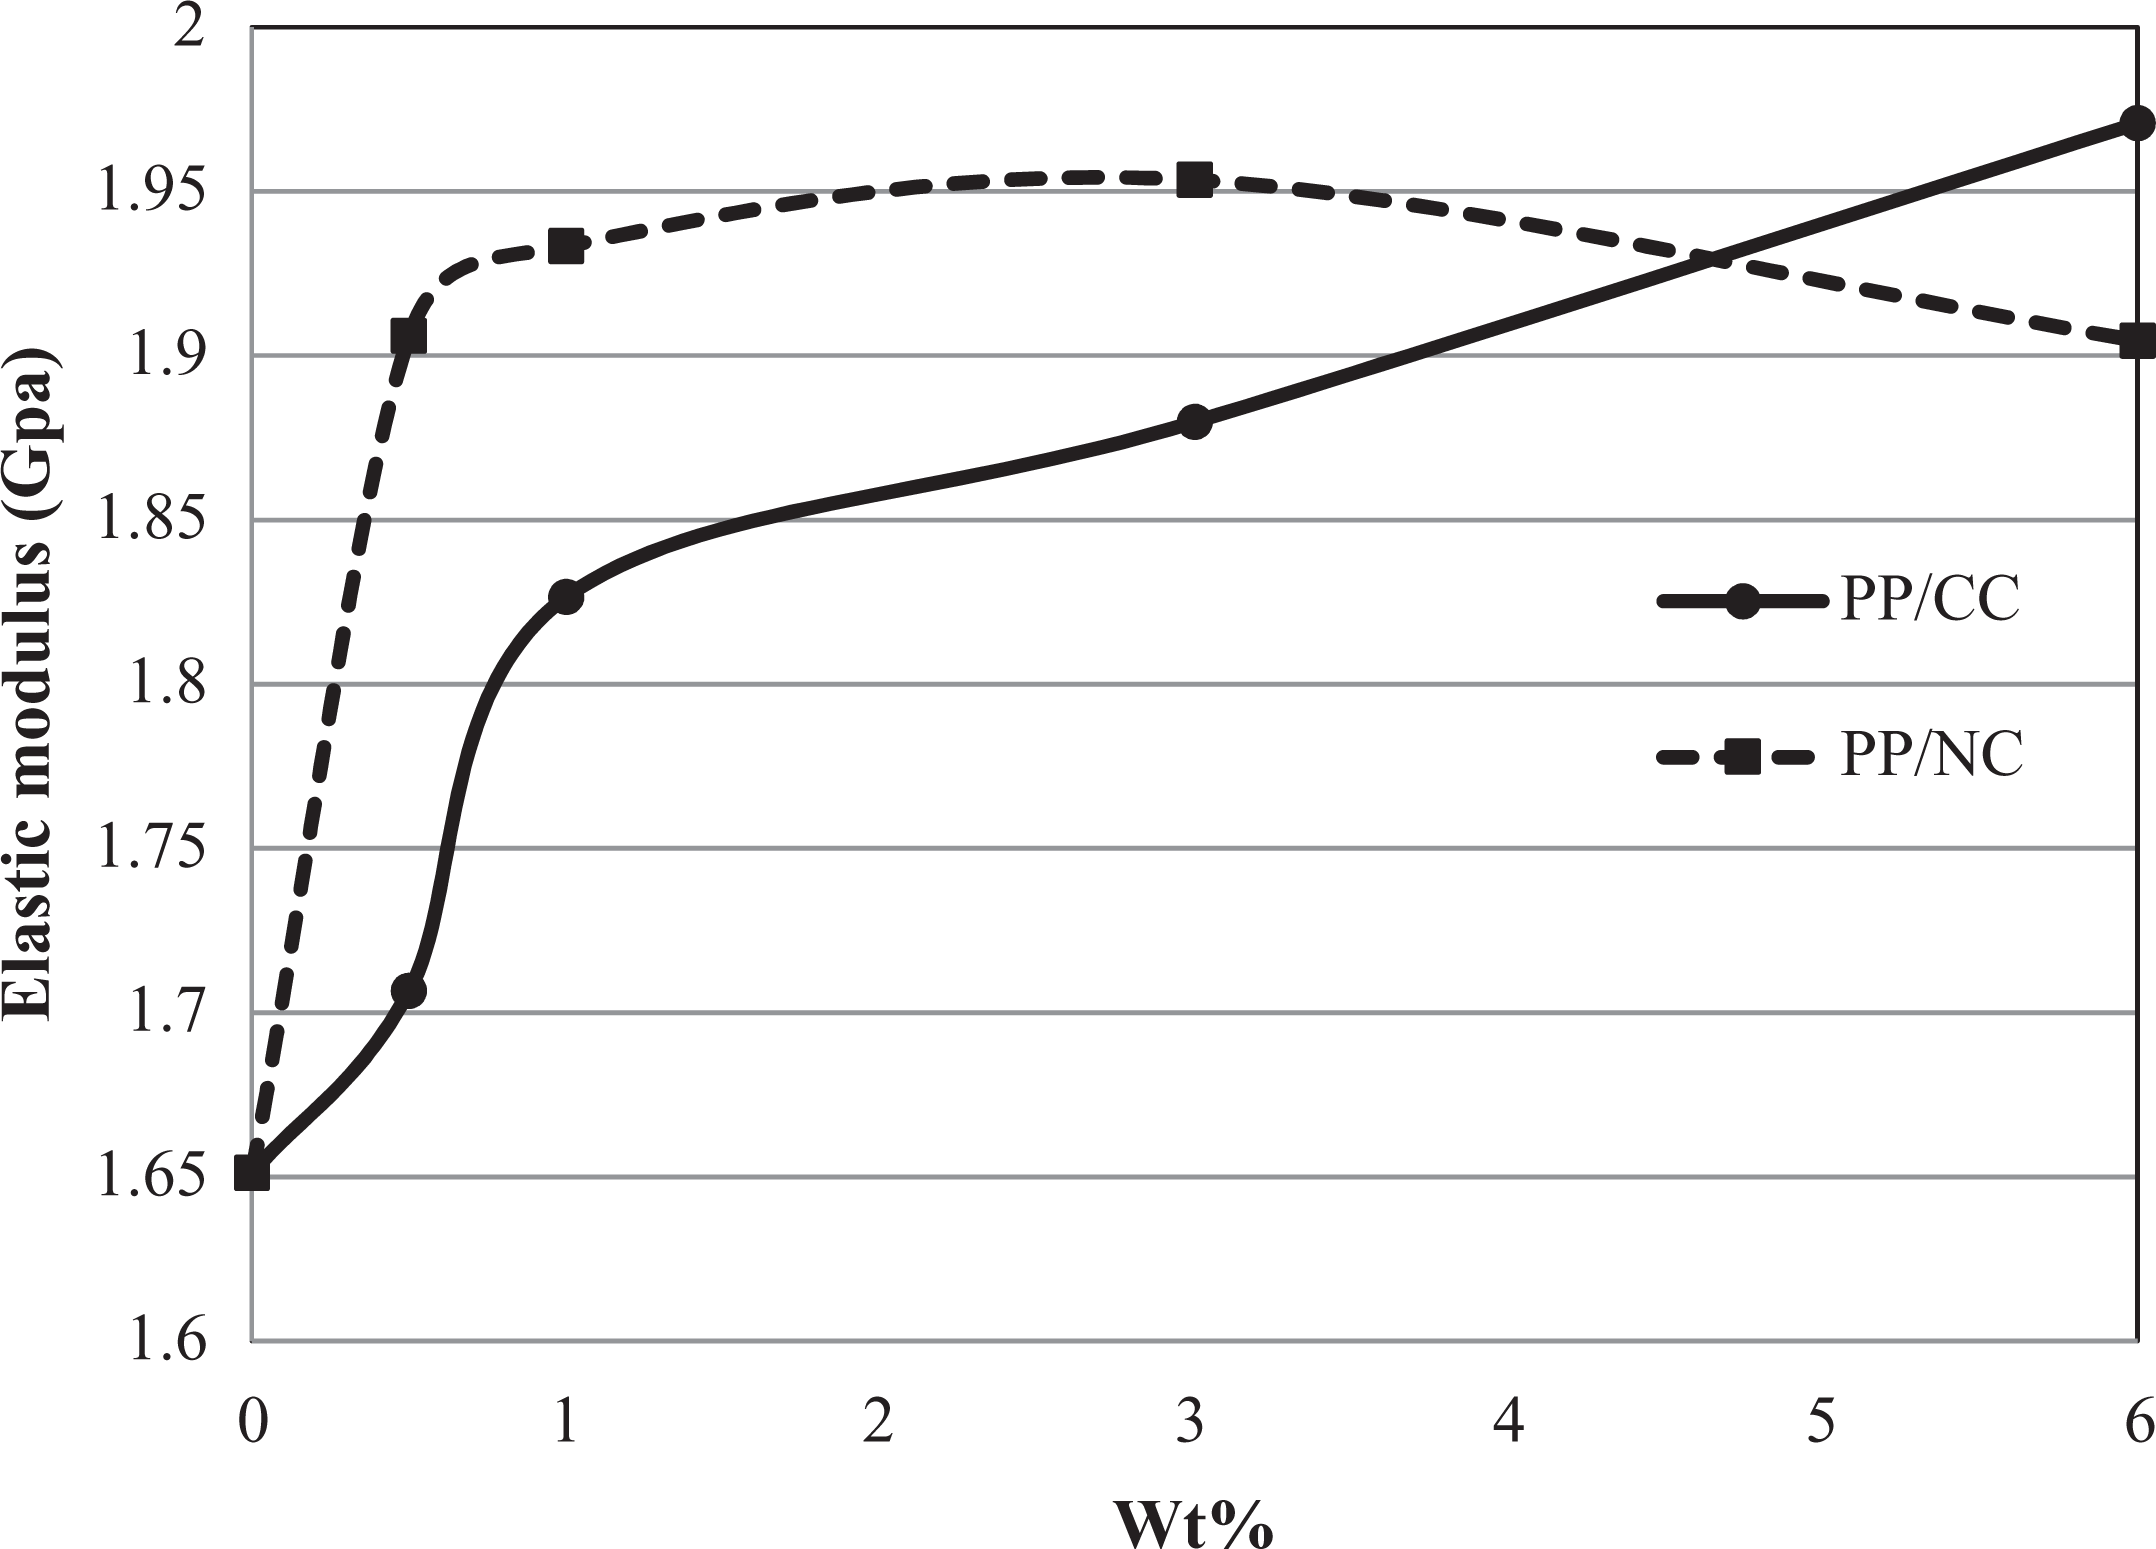
Variation of PP/CC and PP/NC elastic modulus versus the nanofillers content. PP/CC: polypropylene/nano-calcium carbonate; PP/NC: polypropylene/nanoclay.
As Figure 3 shows, the yield stress of PP/NC is higher than that of PP/CC. This difference is very significant and confirms the compatibilizer rule in improving the mechanical properties of PP/NC, particularly in tensile loading. 24 However, the yield stress of PP/NC in compression test is less than that of PP/CC. Figure 3 also suggests that compressive yield stress of the polymer is significantly higher than the tensile yield stress. The reason is presumed to be due to the effect of hydrostatic pressure in compression test. 18
Figure 4 illustrates the same trend of variation for elastic modulus versus NC content for PP/NC as observed for the tensile yield stress in Figure 3. However, elastic modulus of PP/NC reaches its maximum for the 3 wt% and then begins to decrease. This is presumably due to the reduction in intercalated structure fraction that occurs at the increased NC contents. 25,26
In contrast to PP/NC elastic modulus, the elastic modulus of PP/CC has no maximum and keeps rising approximately in a linear fashion with the increase in calcium carbonate content. The improvement in the yield stress and the elastic modulus of PP/CC and PP/NC agrees well with those reported in the literature. 27 –30
Microhardness
Variations of Vickers hardness versus the applied load (used for hardness measurement) for different contents of the filler PP/NC and PP/CC are depicted in Figures 5 and 6, respectively. The figures clearly illustrate the severe dependence of hardness on the applied load of the microhardness test. As the figures suggest, Vickers microhardness decreases at a considerable rate for all cases. This is believed to be due to the strain-softening effect in tensile and compression stress–strain curves. 31,32 An exponential trend can be seen between the hardness and the applied load for the two types of the nanocomposite. This trend has also been reported by Crawford 20 for thermoplastic materials. The maximum microhardness of PP/NC and PP/CC is the same as they contain different contents. The PP/NC specimens contains 1 wt% NC, while the PP/CC samples contain 3 wt% calcium carbonate. The results for PP/NC are similar to those reported in the literatures. 30,33 Nevertheless, a significant difference is observed between the hardness of the PP nanocomposite and those of the PP. This can be explained by the change in the nanocomposite morphology that may occur due to addition of nanoparticles to the polymer. 22,34 Therefore, microhardness is affected by morphological changes in polymer. 14,35 Microscopic examination was used to study the morphology evolution of the nanocomposite. Typical images (using an Olympus DP12 optical microscope; Japan) of spherulite structure of PP and nanocomposite are shown in Figure 7. Owing to the nucleation effect of nanoparticles, spherulite sizes of PP clearly reduce with respect to both types of nanocomposites. 34 In fact, during the solidification phase of the polymer and due to its reduced number of nucleation sites (with respect to the nanocomposites), the number of spherulites is reduced. This is because each spherulite has enough time to grow enough to touch the borders of the adjacent spherulites. In this case, the spherulites are large as indicated in Figure 7(a). In nanocomposites, however, the number of nucleation sites increases and consequently the number of spherulites also increases. Therefore, and as a result of the spherulites growth, their borders come into contact with each other faster compared to that in polymer solidification phase. The borders then become barrier to further growth of the spherulites. This is the reason why the spherulites are more refined in the nanocomposites illustrated in Figure 7(b) and (d) compared to that of the polymer shown in Figure 7(a). As it is shown in Figure 7(c) and (e), the refining process of spherulites continues for higher weight% of the nanoparticles. Typical borders of spherulites for PP, PP1NC, and PP1CC are highlighted by bold black circles in Figure 7. As it is seen and because of spherulites refinement, the borders of PP3NC and PP3CC, which have higher weight% of nanoparticles, are not well recognizable.
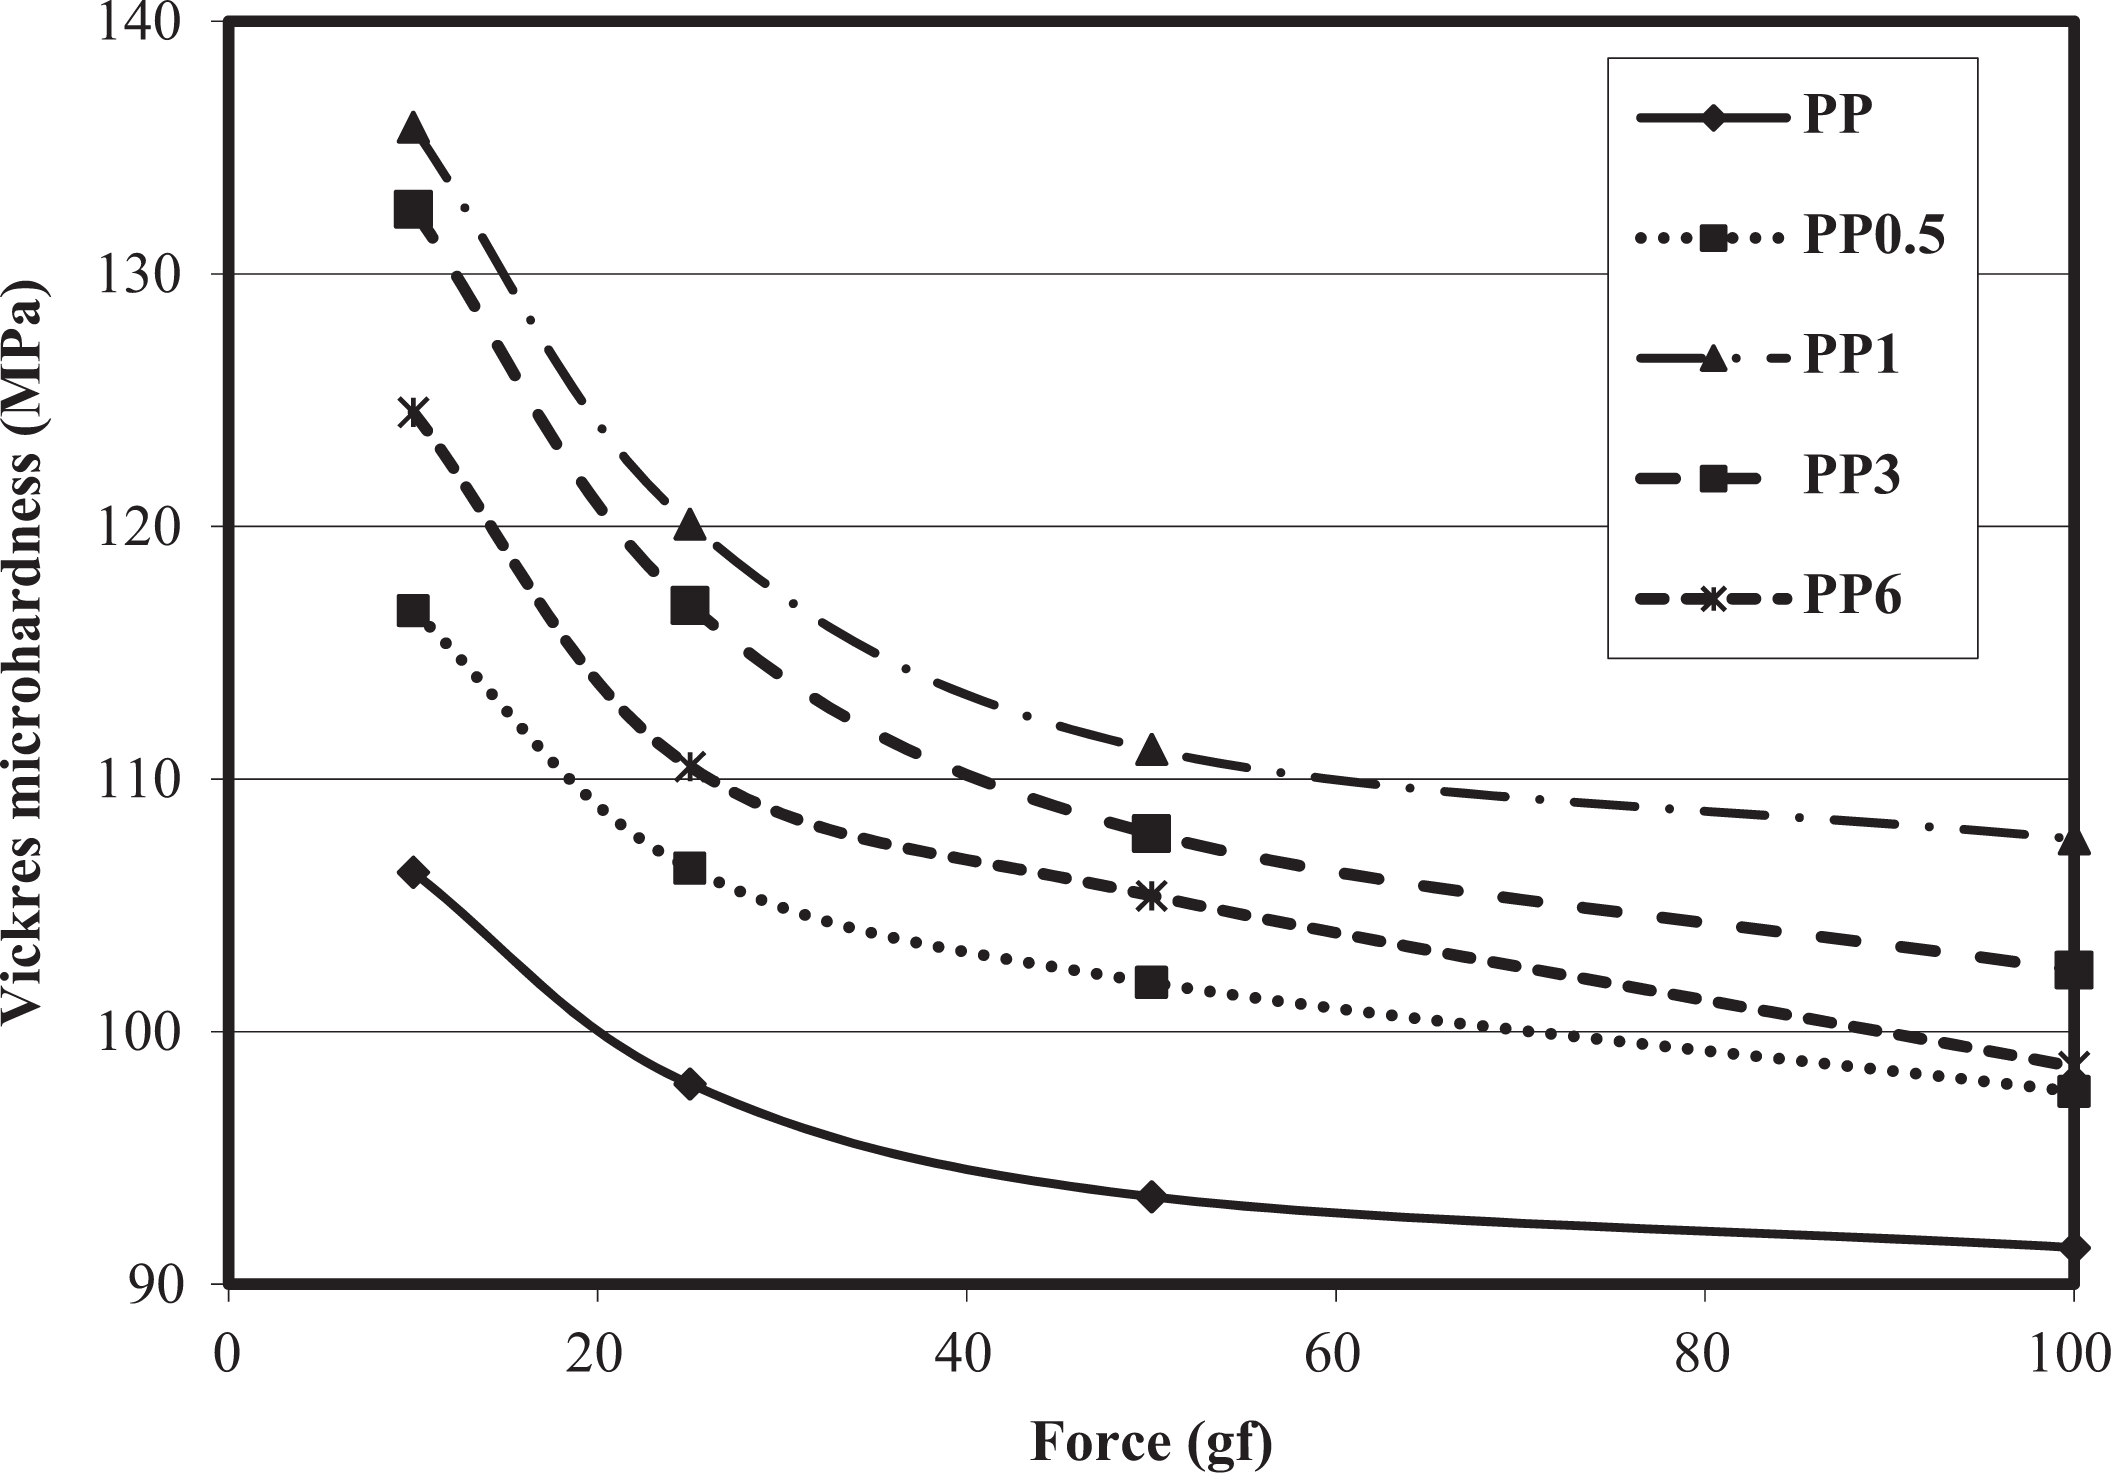
Dependence of PP/NC microhardness on the applied load for different nanofillers content. PP/NC: polypropylene/nanoclay.
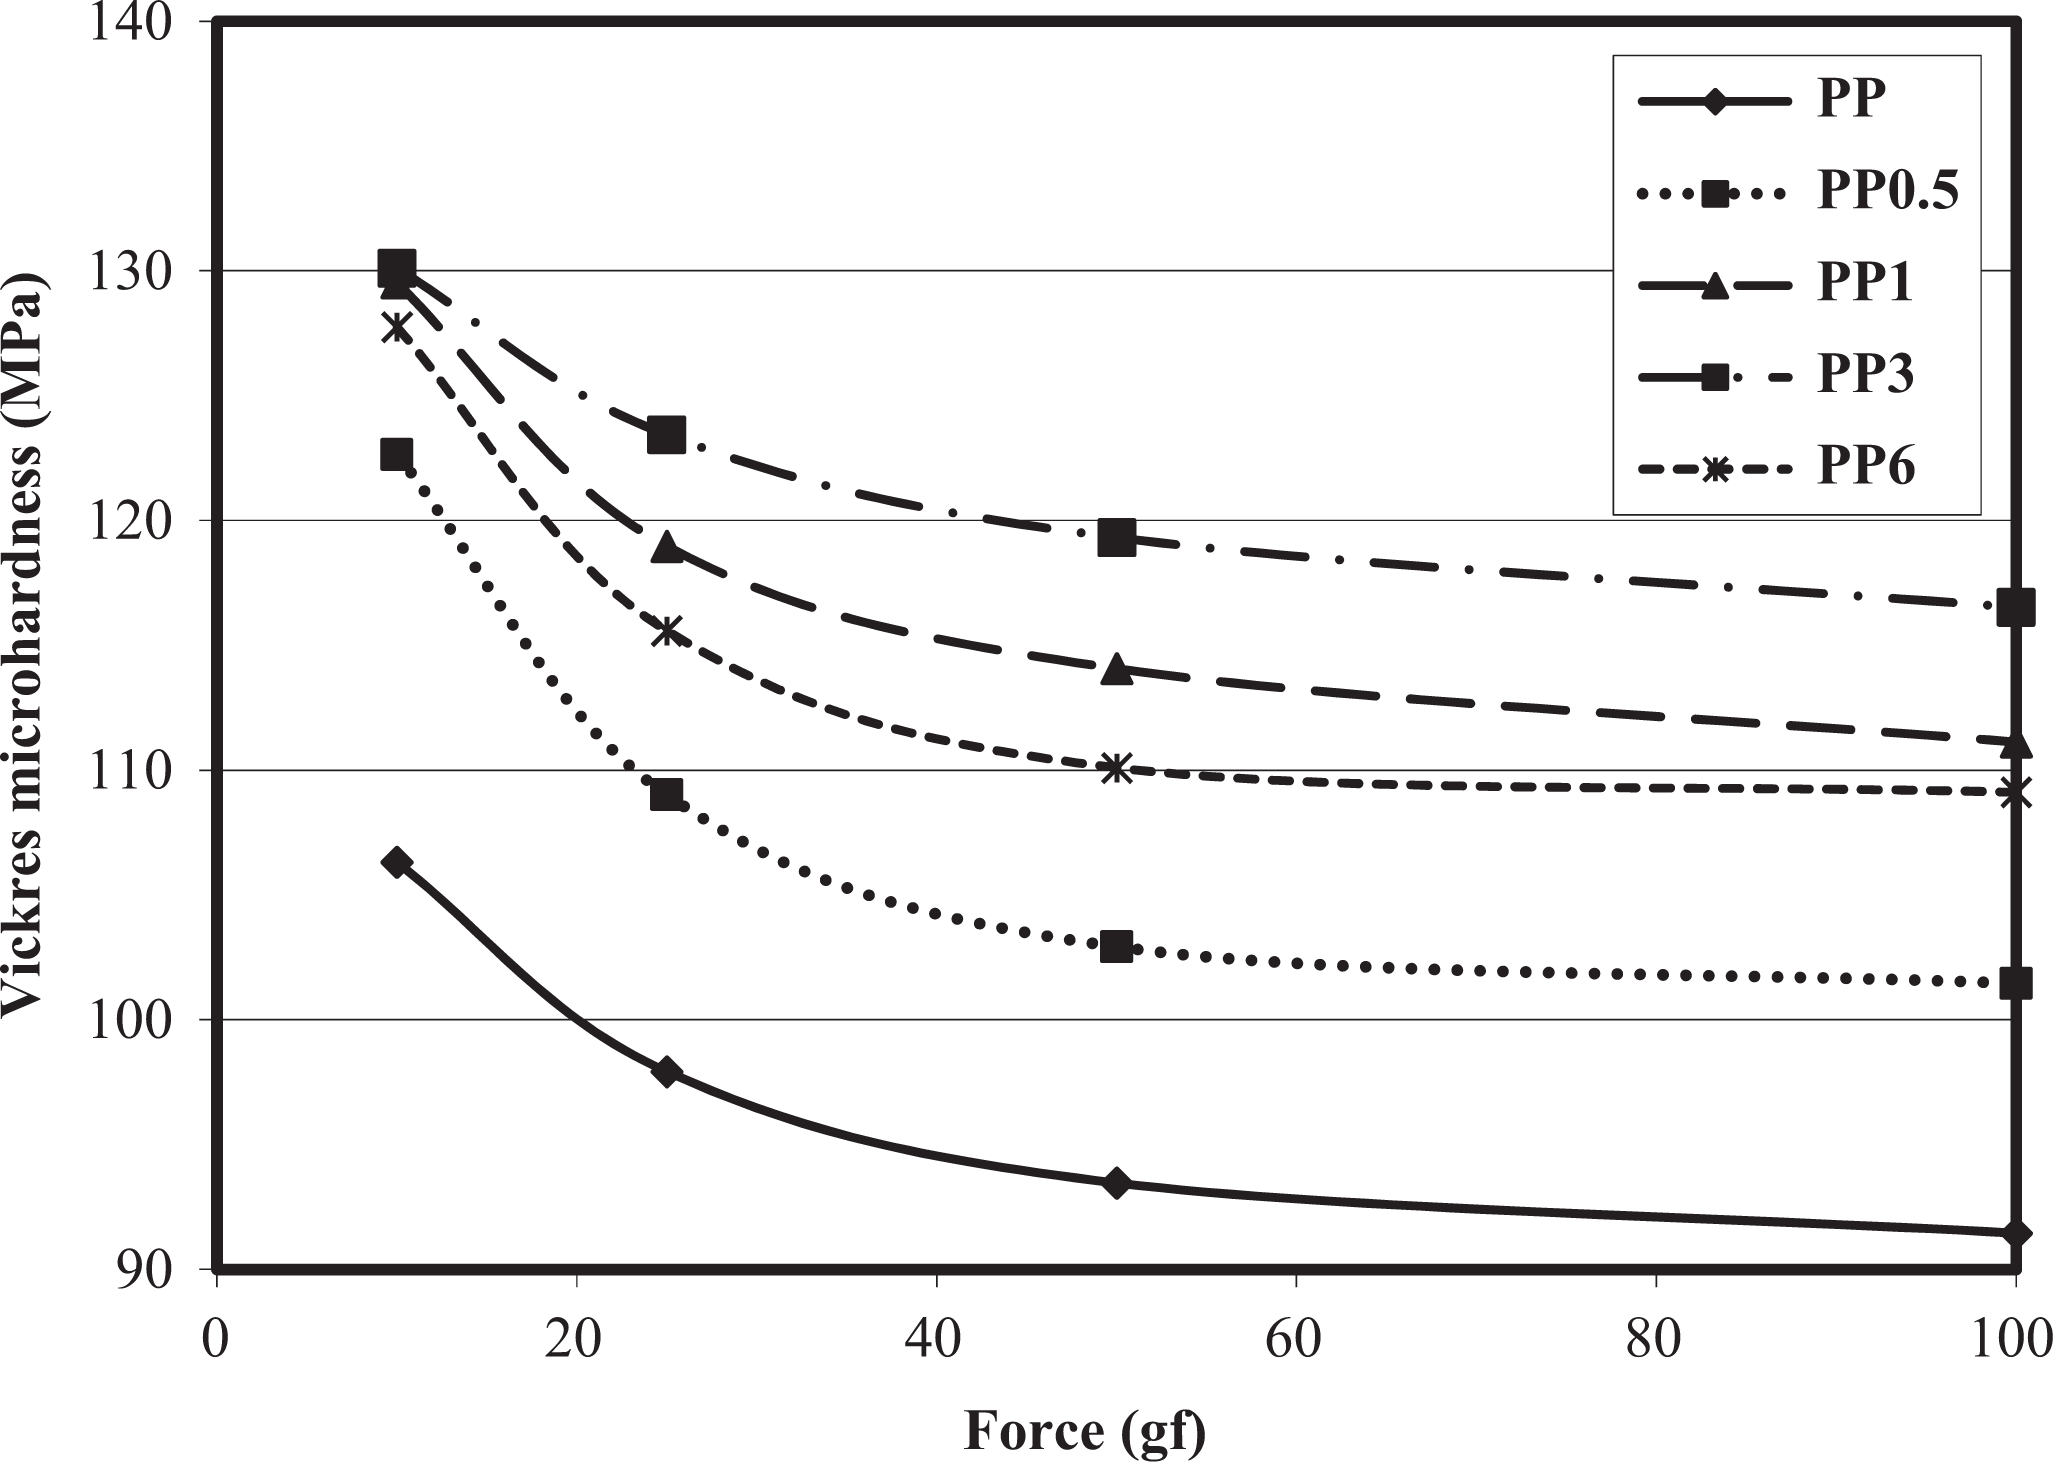
Dependence of PP/CC microhardness on the applied load for different nanofillers content. PP/CC: polypropylene/nano-calcium carbonate.
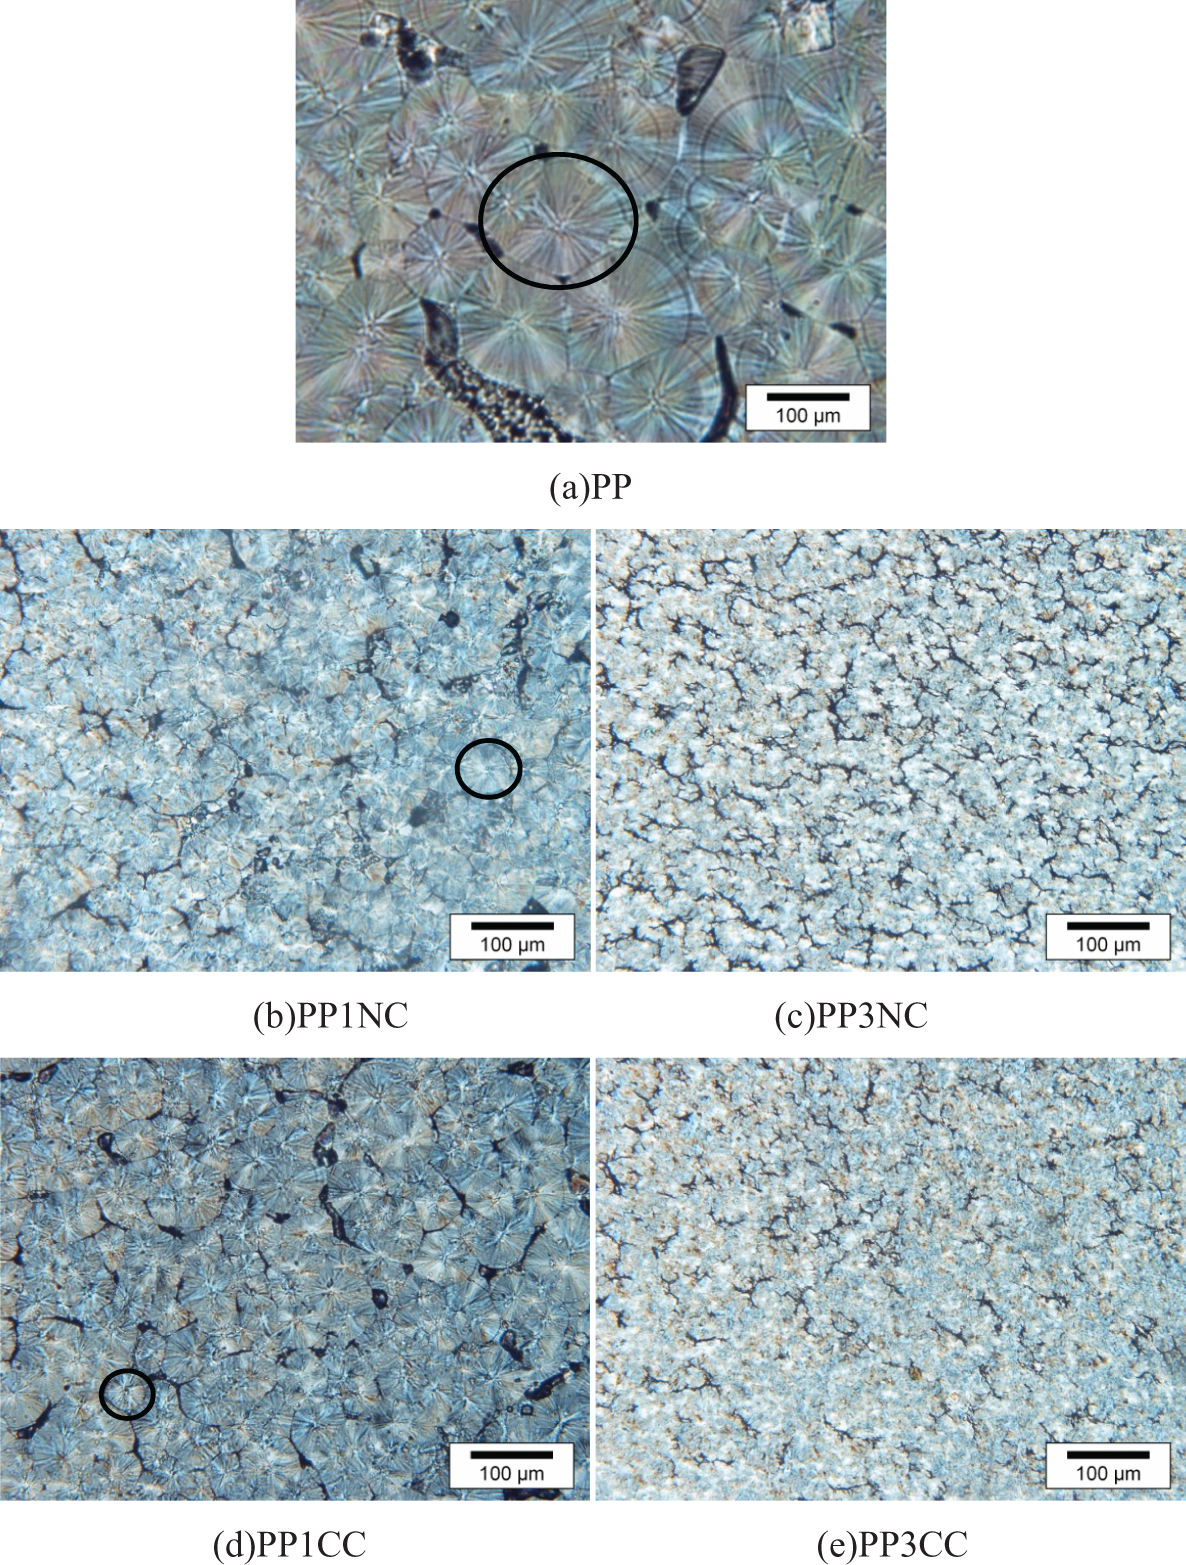
PP and nanocomposite crystalline morphology. PP: polypropylene.
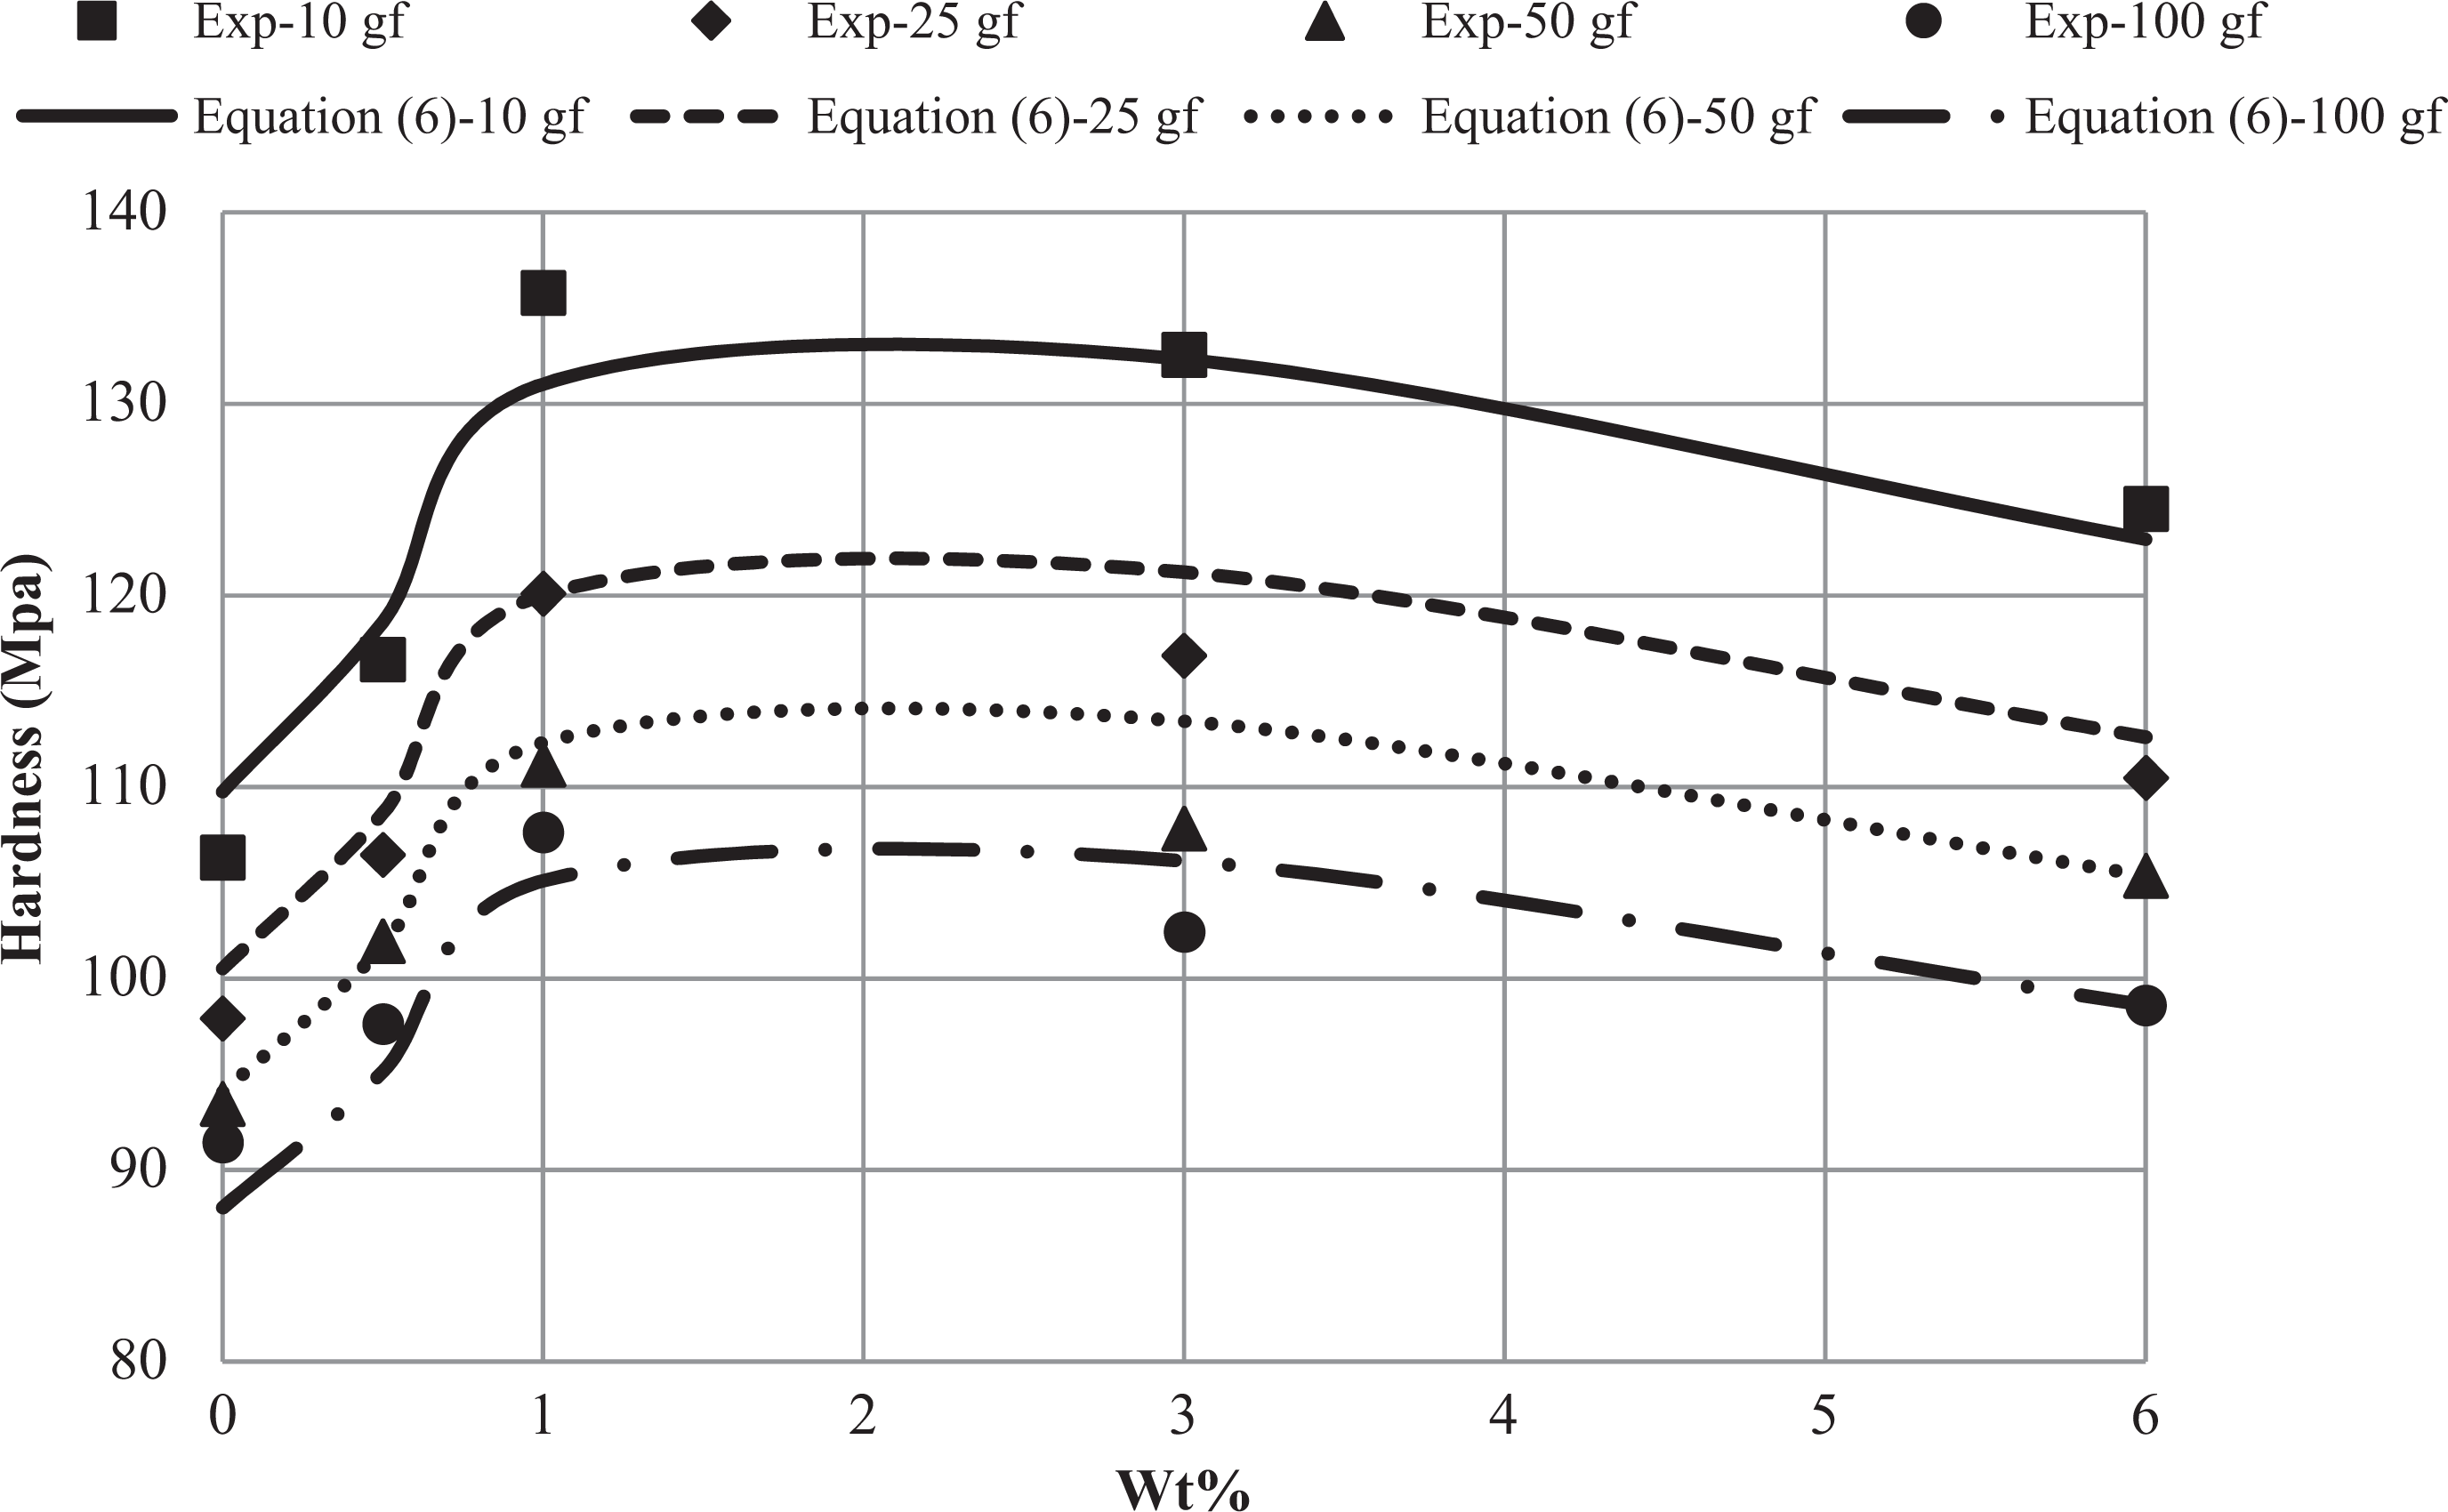
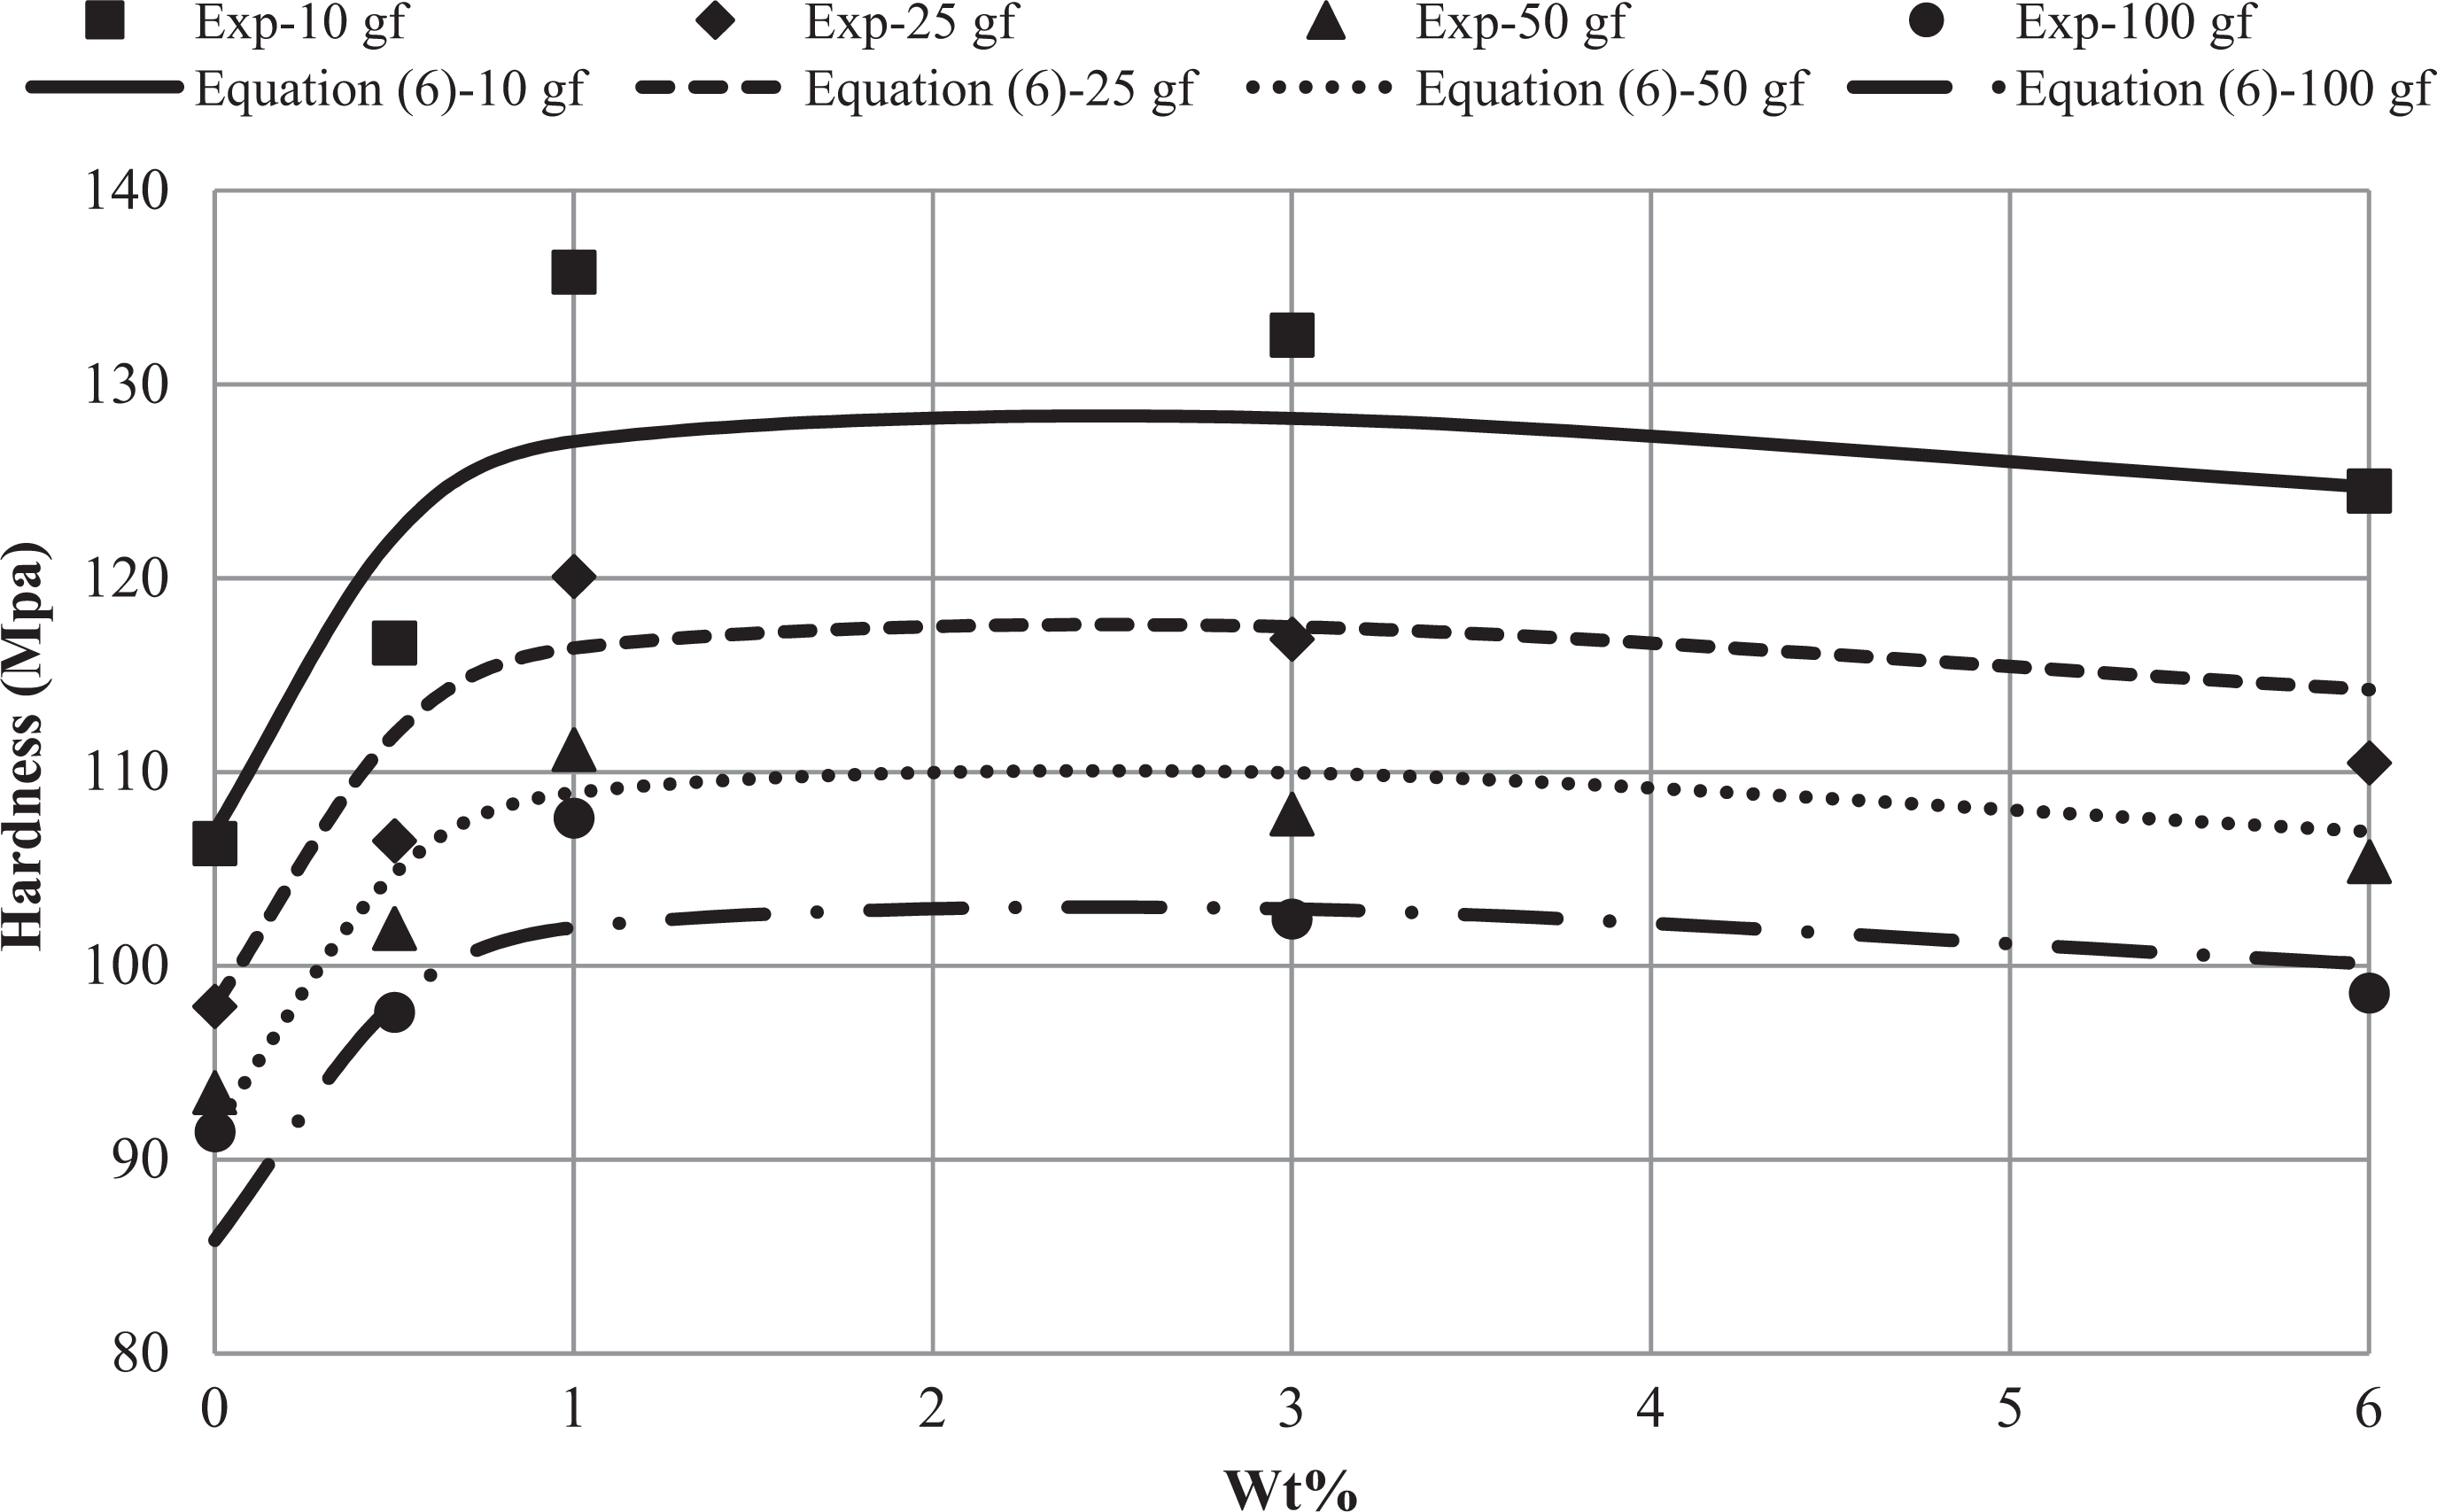
The graphs in Figures 8 and 9 show the improvement of nanocomposite hardness with respect to the polymer (Hc/Hp). The variation of microhardness versus the filler content for PP/NC and PP/CC are presented in Figures 10 and 11, respectively. As mentioned earlier, PP/NC with 1 wt% MMT and PP/CC with 3 wt% have the maximum hardness. Moreover, the results computed from Tabor and Marsh’s relations using the experimental hardness of specimens obtained from tensile and compression tests are superposed on the experimental graphs in Figures 10 and 11. Both figures clearly indicate that Tabor and Marsh’s results estimated from the compression tests are more accurate than the tensile ones. The reason is that in both figures the variation of microhardness versus load for compressive specimens are bounded by the two theories, Marsh and Tabor, while the tensile curves are considerably underestimated by tensile test hardness measurements. For the small force (10 gf) the experimental hardness measured from compressive tests are close to Tabor’s predictions. By increasing the applied force to 100 gf, the microhardness approaches Marsh’s formula. The trends of the results for both composites are the same.
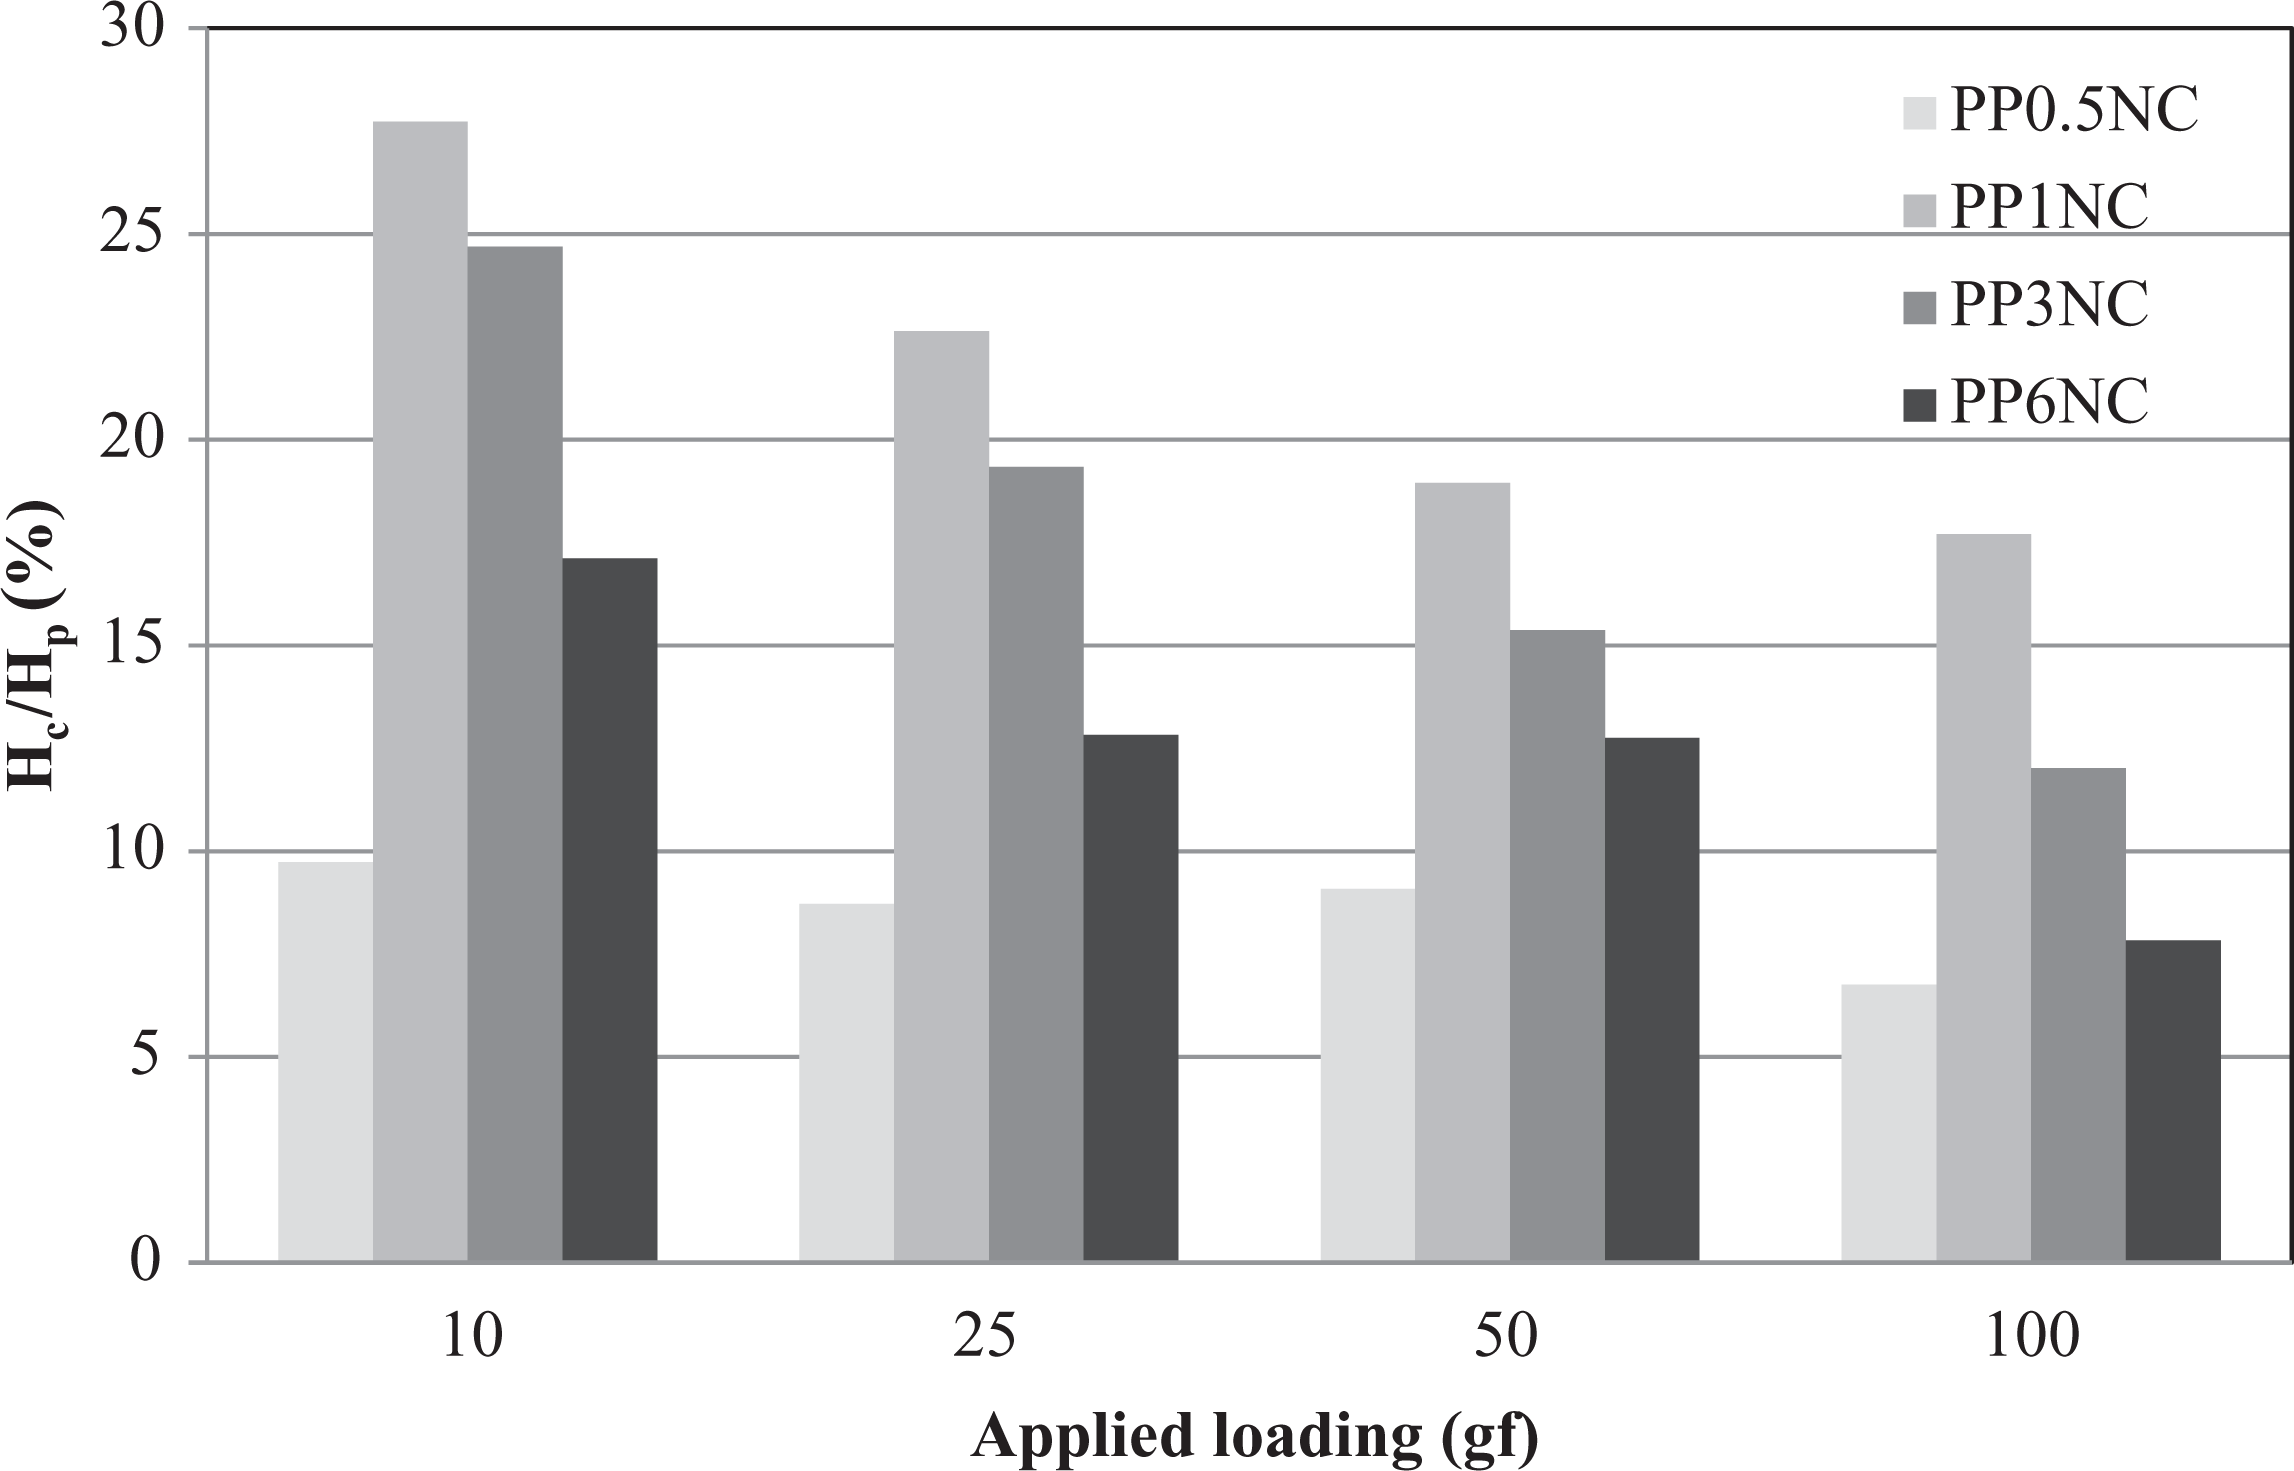
Variation of Hc/Hp ratio of PP/NC versus the applied load for different nanofillers content. PP/NC: polypropylene/nanoclay.
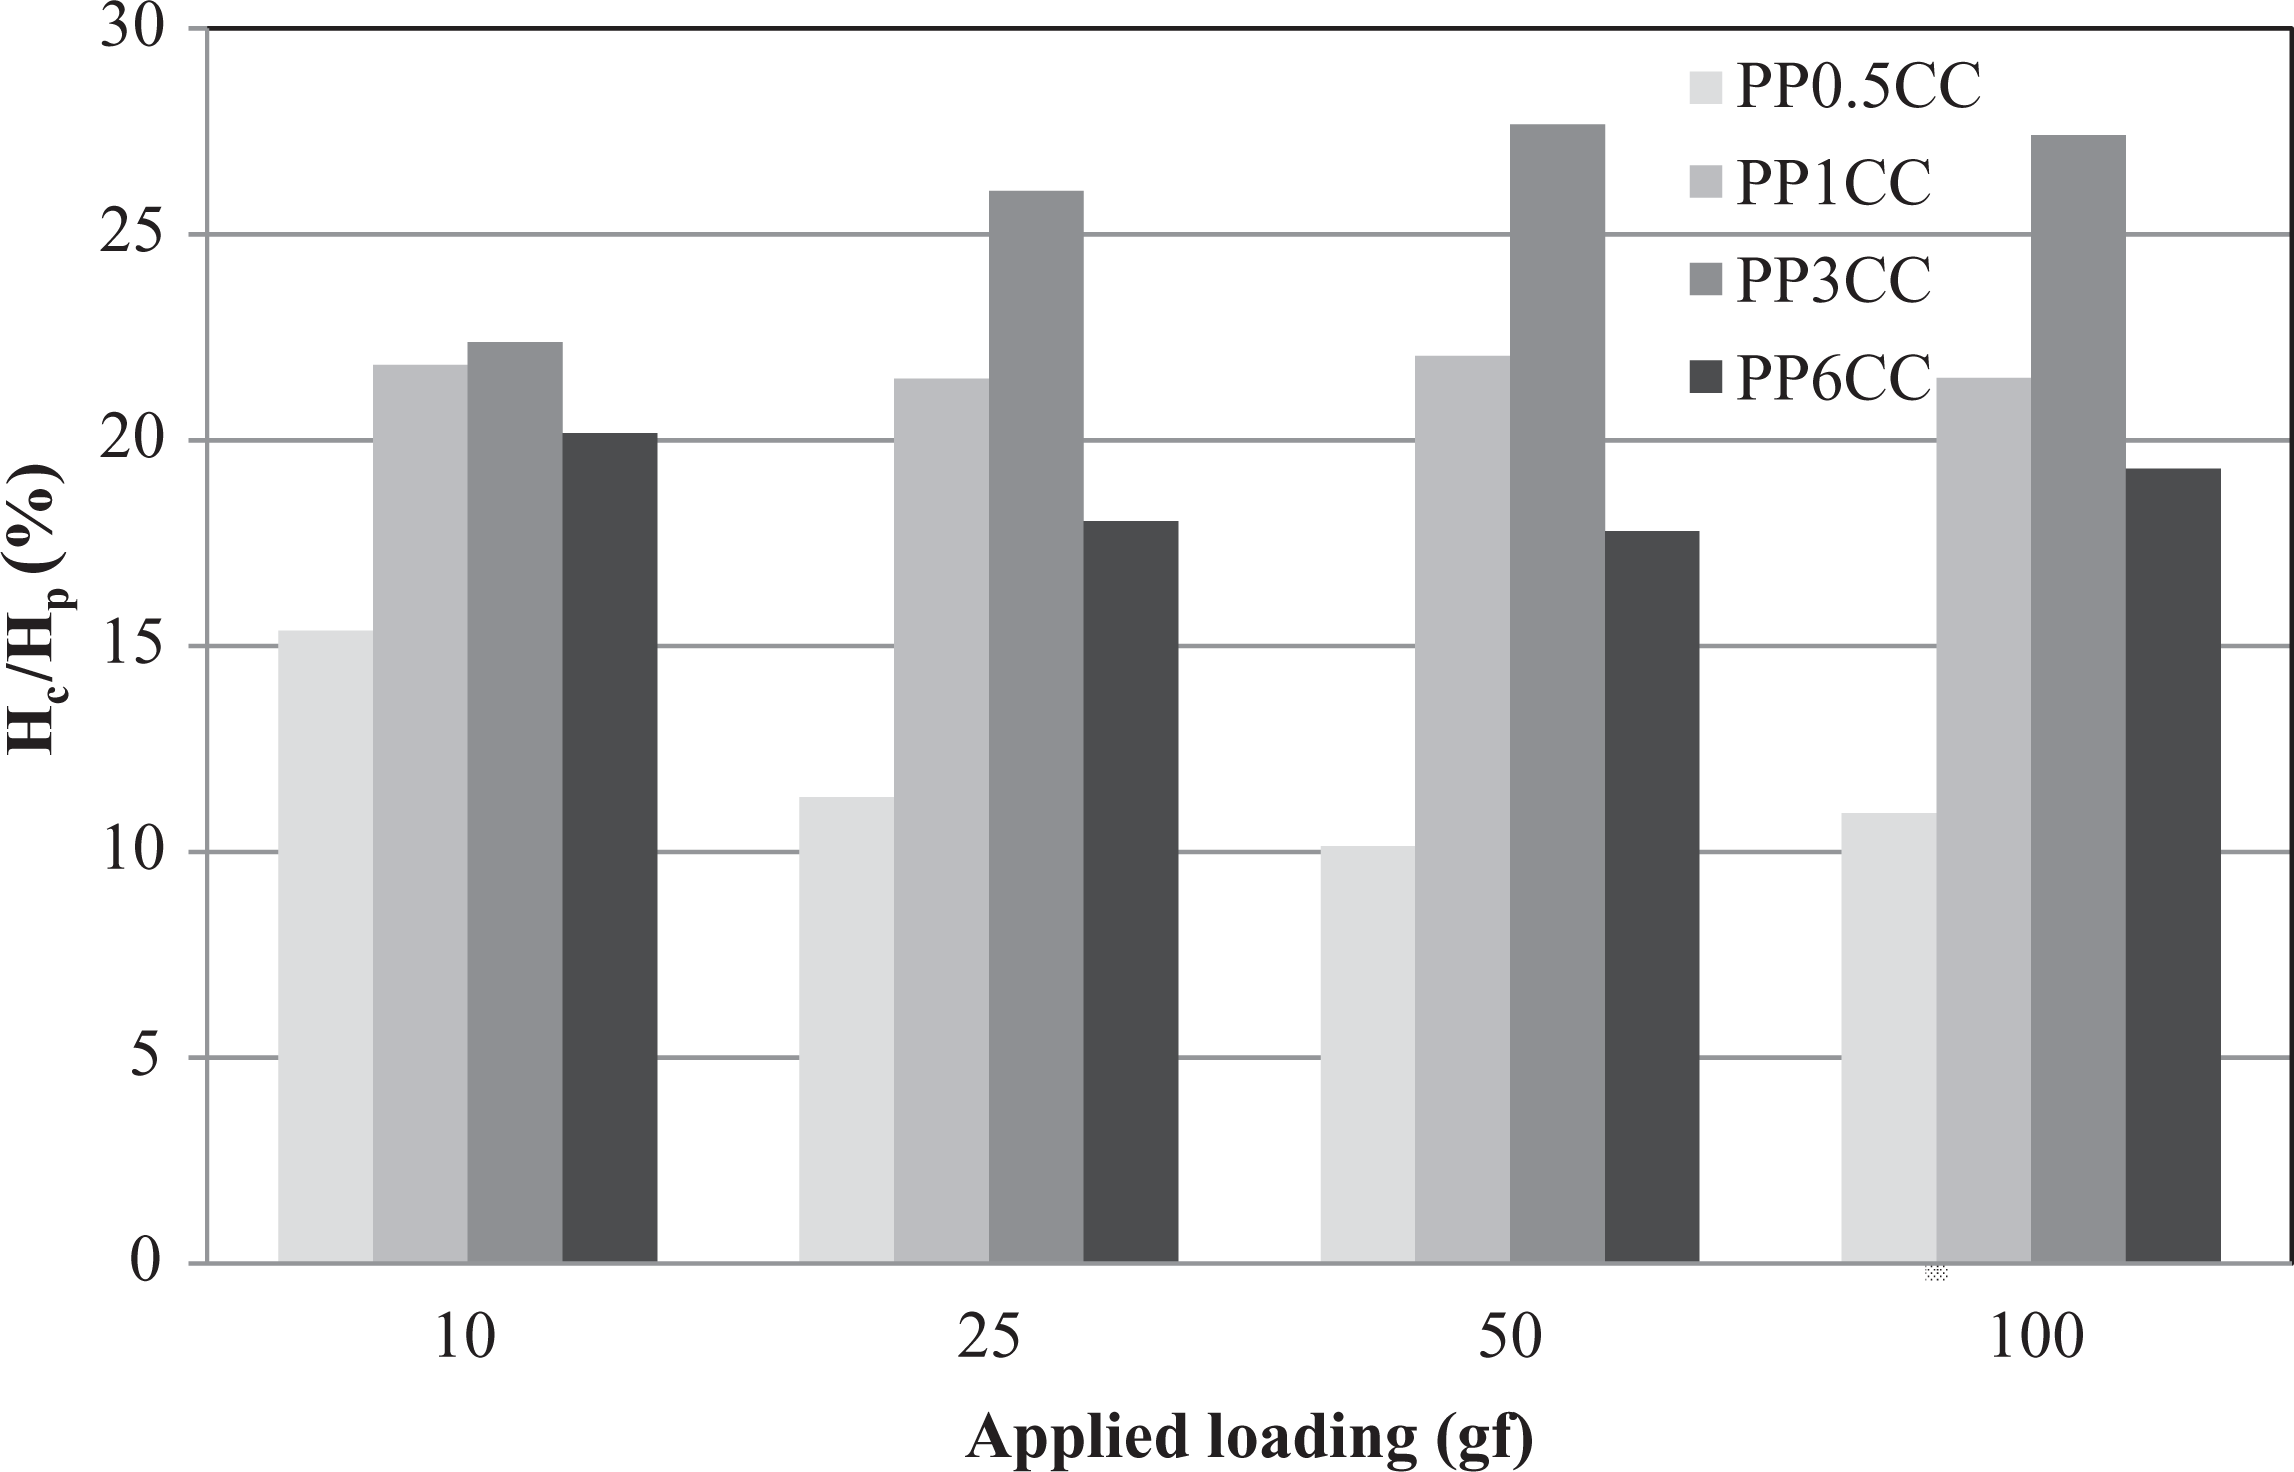
Variation of Hc/Hp ratio of PP/CC versus the applied load for different nanofillers content. PP/CC: polypropylene/nano-calcium carbonate.
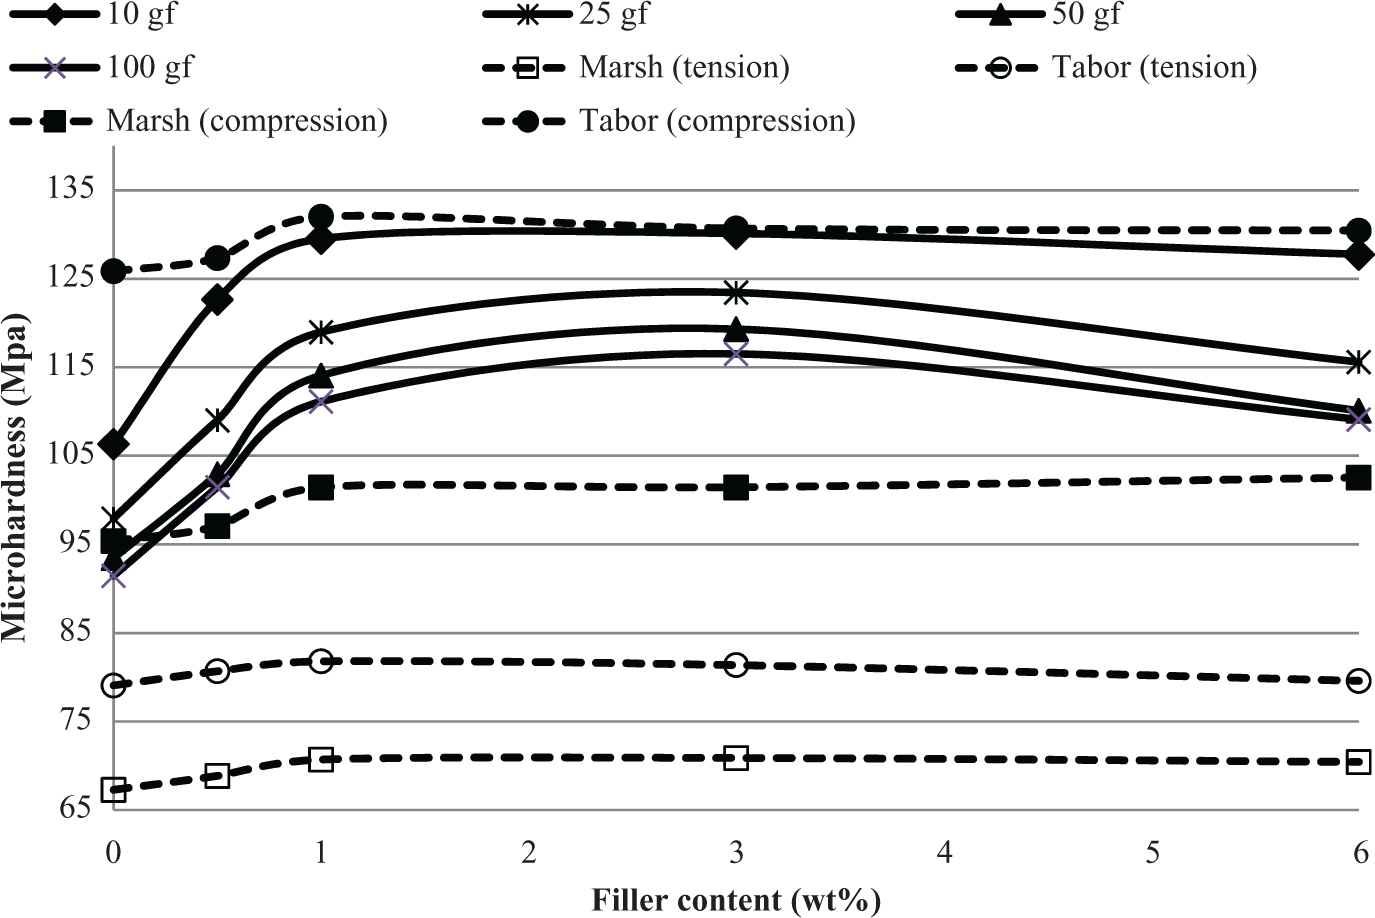
A comparison between the PP/CC microhardness obtained using analytical relations and experiment. PP/CC: polypropylene/nano-calcium carbonate.
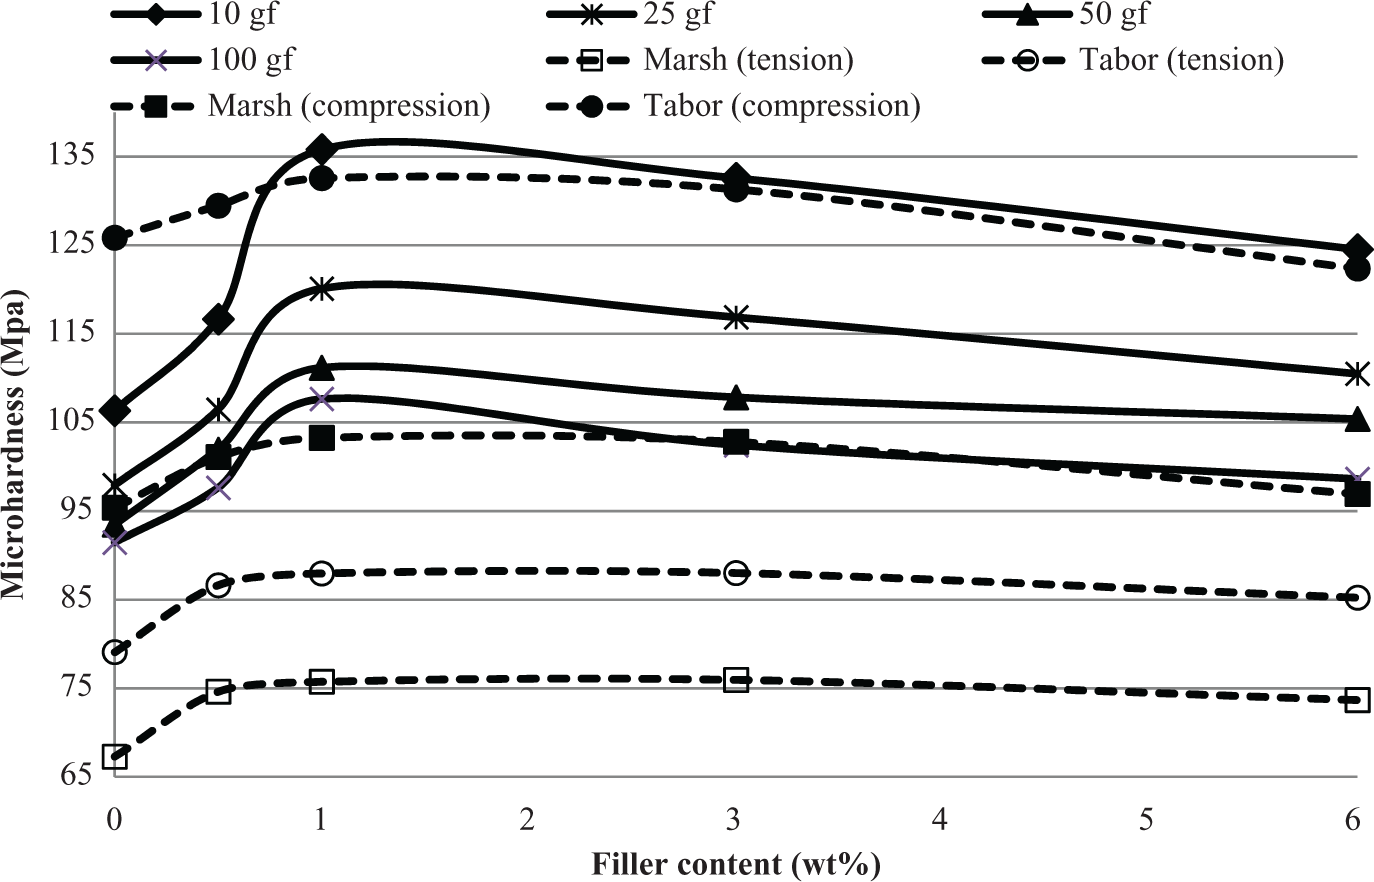
A comparison between the PP/NC microhardness obtained using analytical relations and experiment. PP/NC: polypropylene/nanoclay.
The coefficients of the proposed model (equation 6) as determined from the experimental data and discussed in the previous section using a curve-fitting technique are given in Table 2. The results suggest that the constant n depends on the composite filler type but is the same for the tensile and compression yield stress. Also, n for PP/NC is more than that for PP/CC. On the other hand and as can be seen in Figures 6 and 7, the hardness of PP/NC is more significantly affected by the applied loading with respect to PP/CC.
The coefficients of the proposed model (equation (6)) for PP composite.
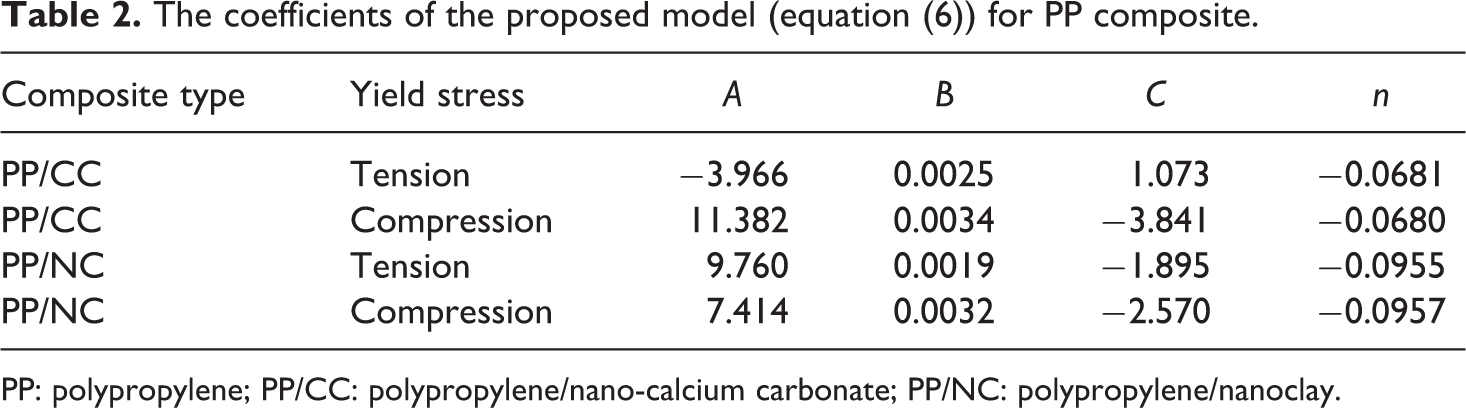
PP: polypropylene; PP/CC: polypropylene/nano-calcium carbonate; PP/NC: polypropylene/nanoclay.
The experimental hardness measurements are compared with those predicted by the proposed model for PP/NC and PP/CC under tension and compression loadings in Figures 12 to 15. As the figures suggest, the proposed model agrees quite well with the experiments for the compressive loadings for both types of the composites. The agreement, however, reduces for tensile loadings but still remains reasonable.
A comparison between the experiment and the proposed model for PP/NC in compression. PP/NC: polypropylene/nanoclay.
A comparison between the experiment and the proposed model for PP/NC in tension. PP/NC: polypropylene/nanoclay.
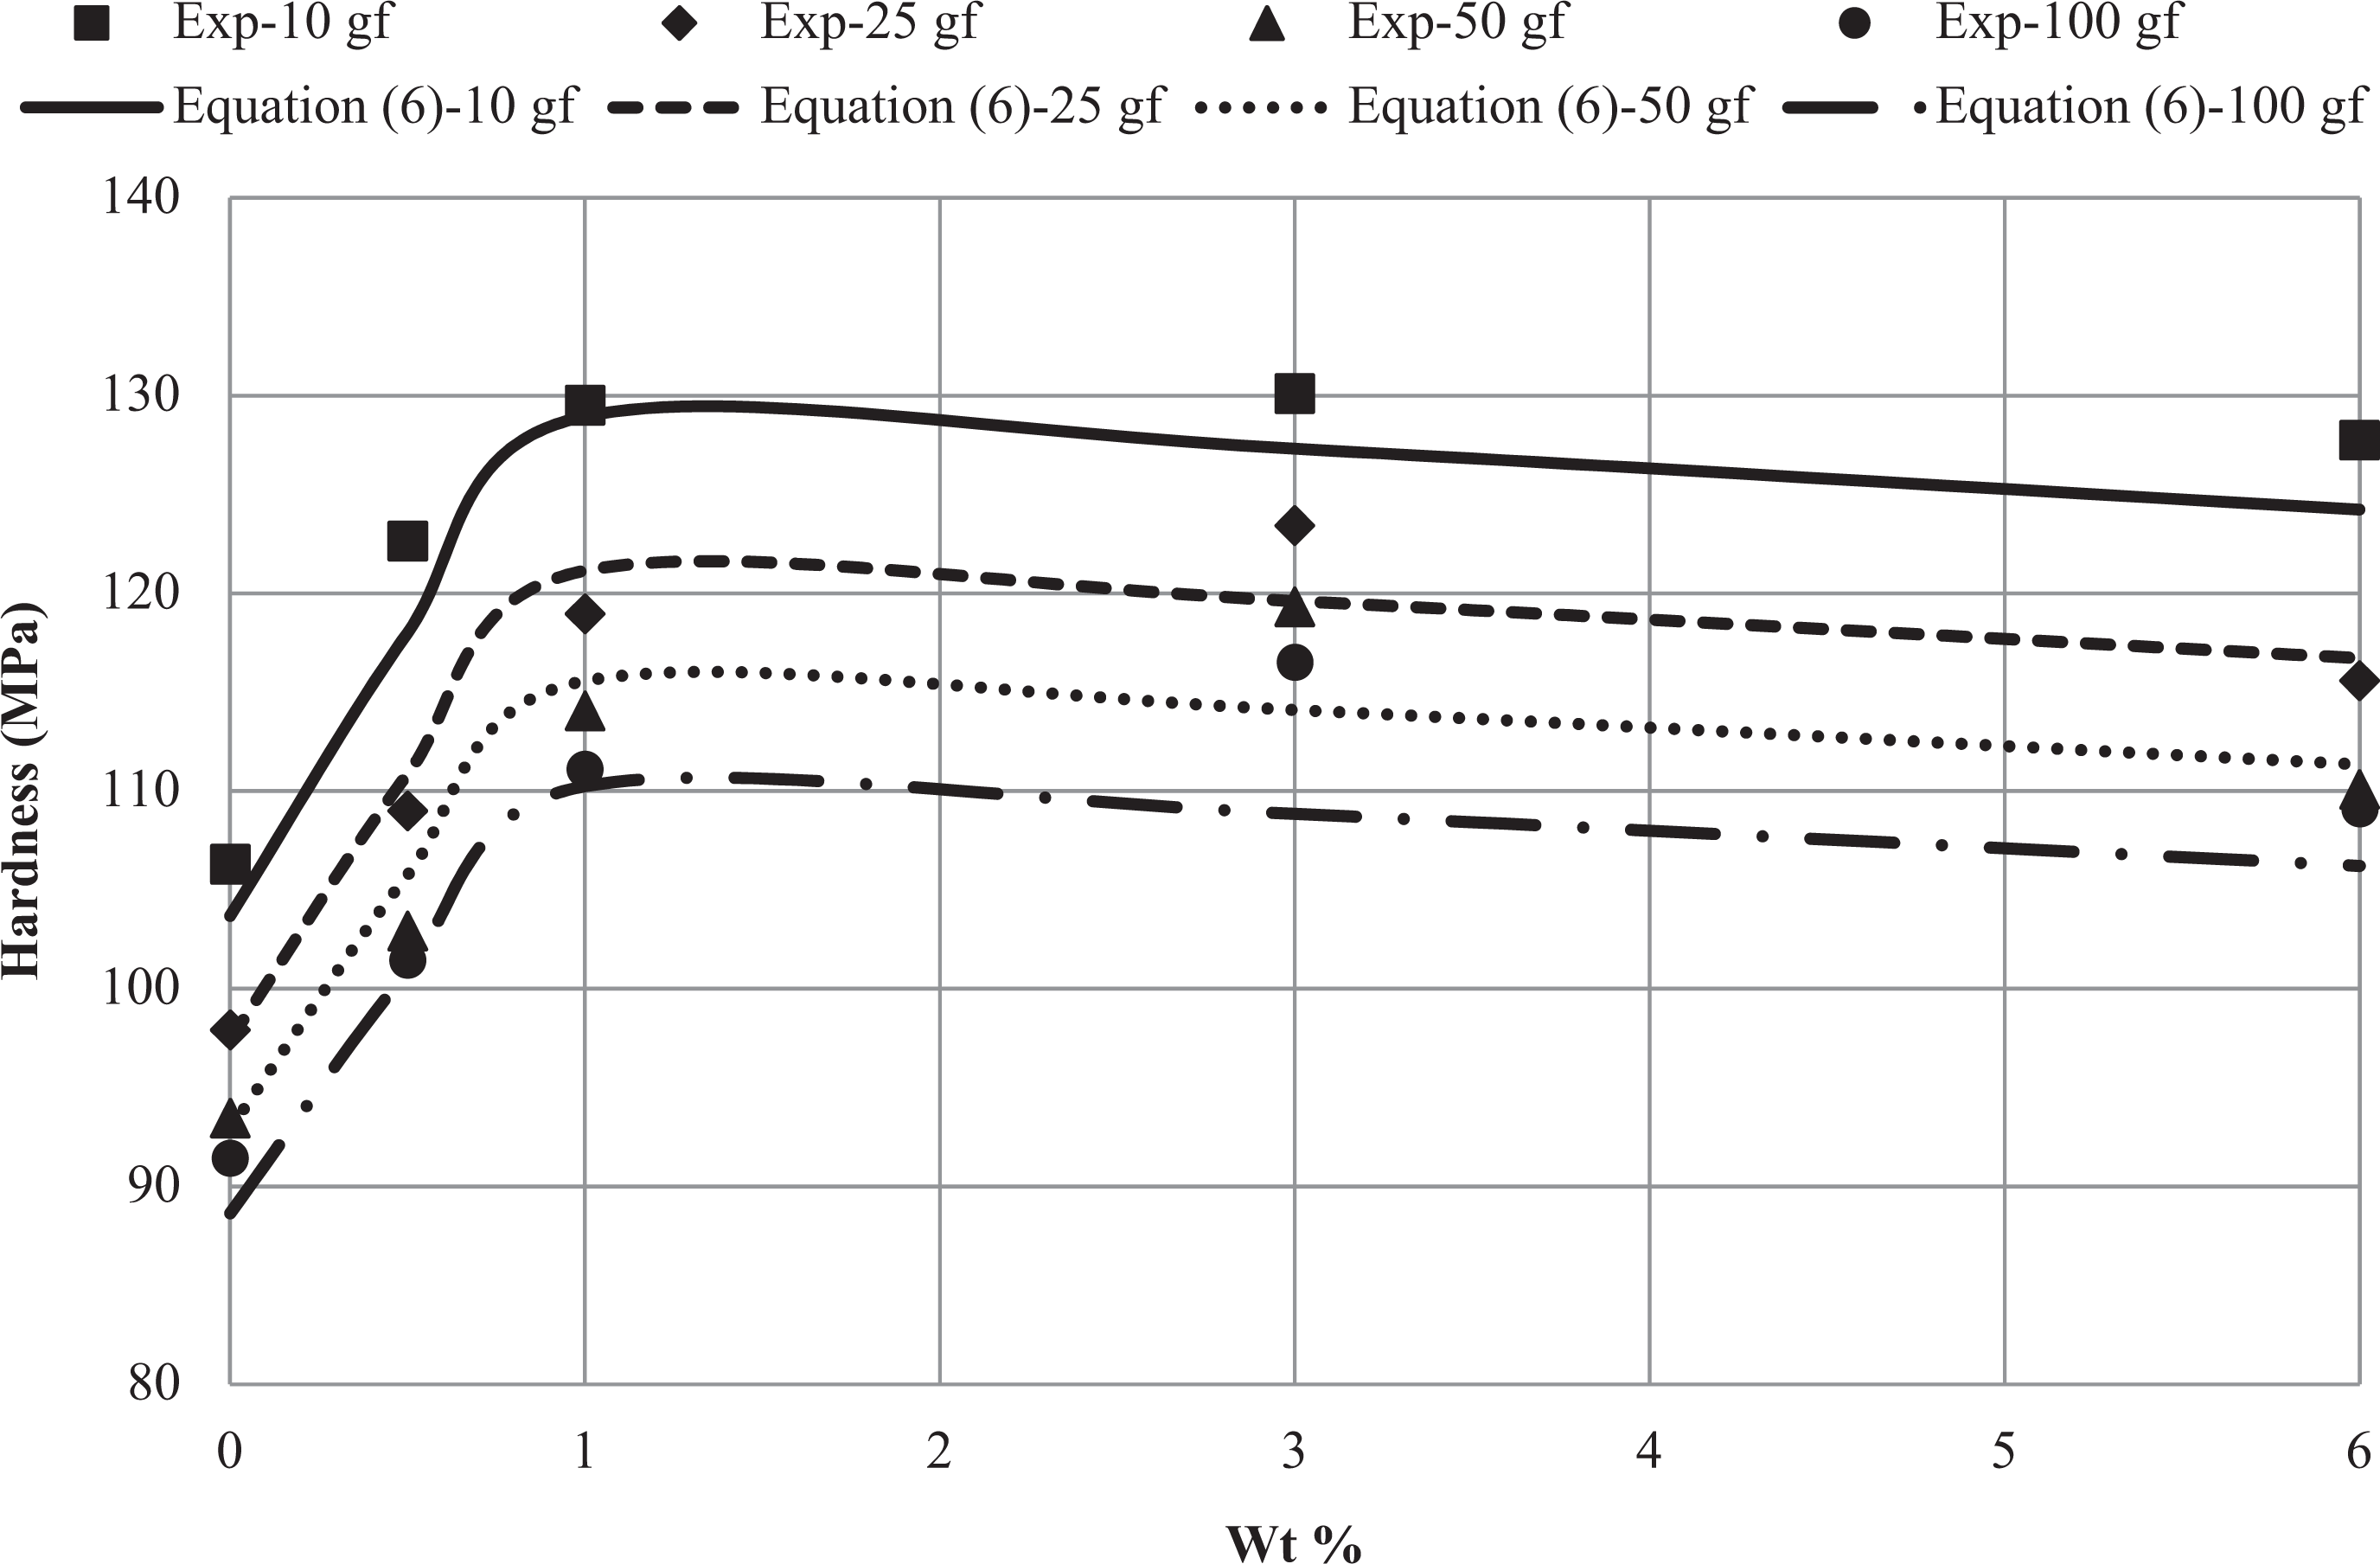
A comparison between the experiment and the proposed model for PP/CC in compression. PP/CC: polypropylene/nano-calcium carbonate.
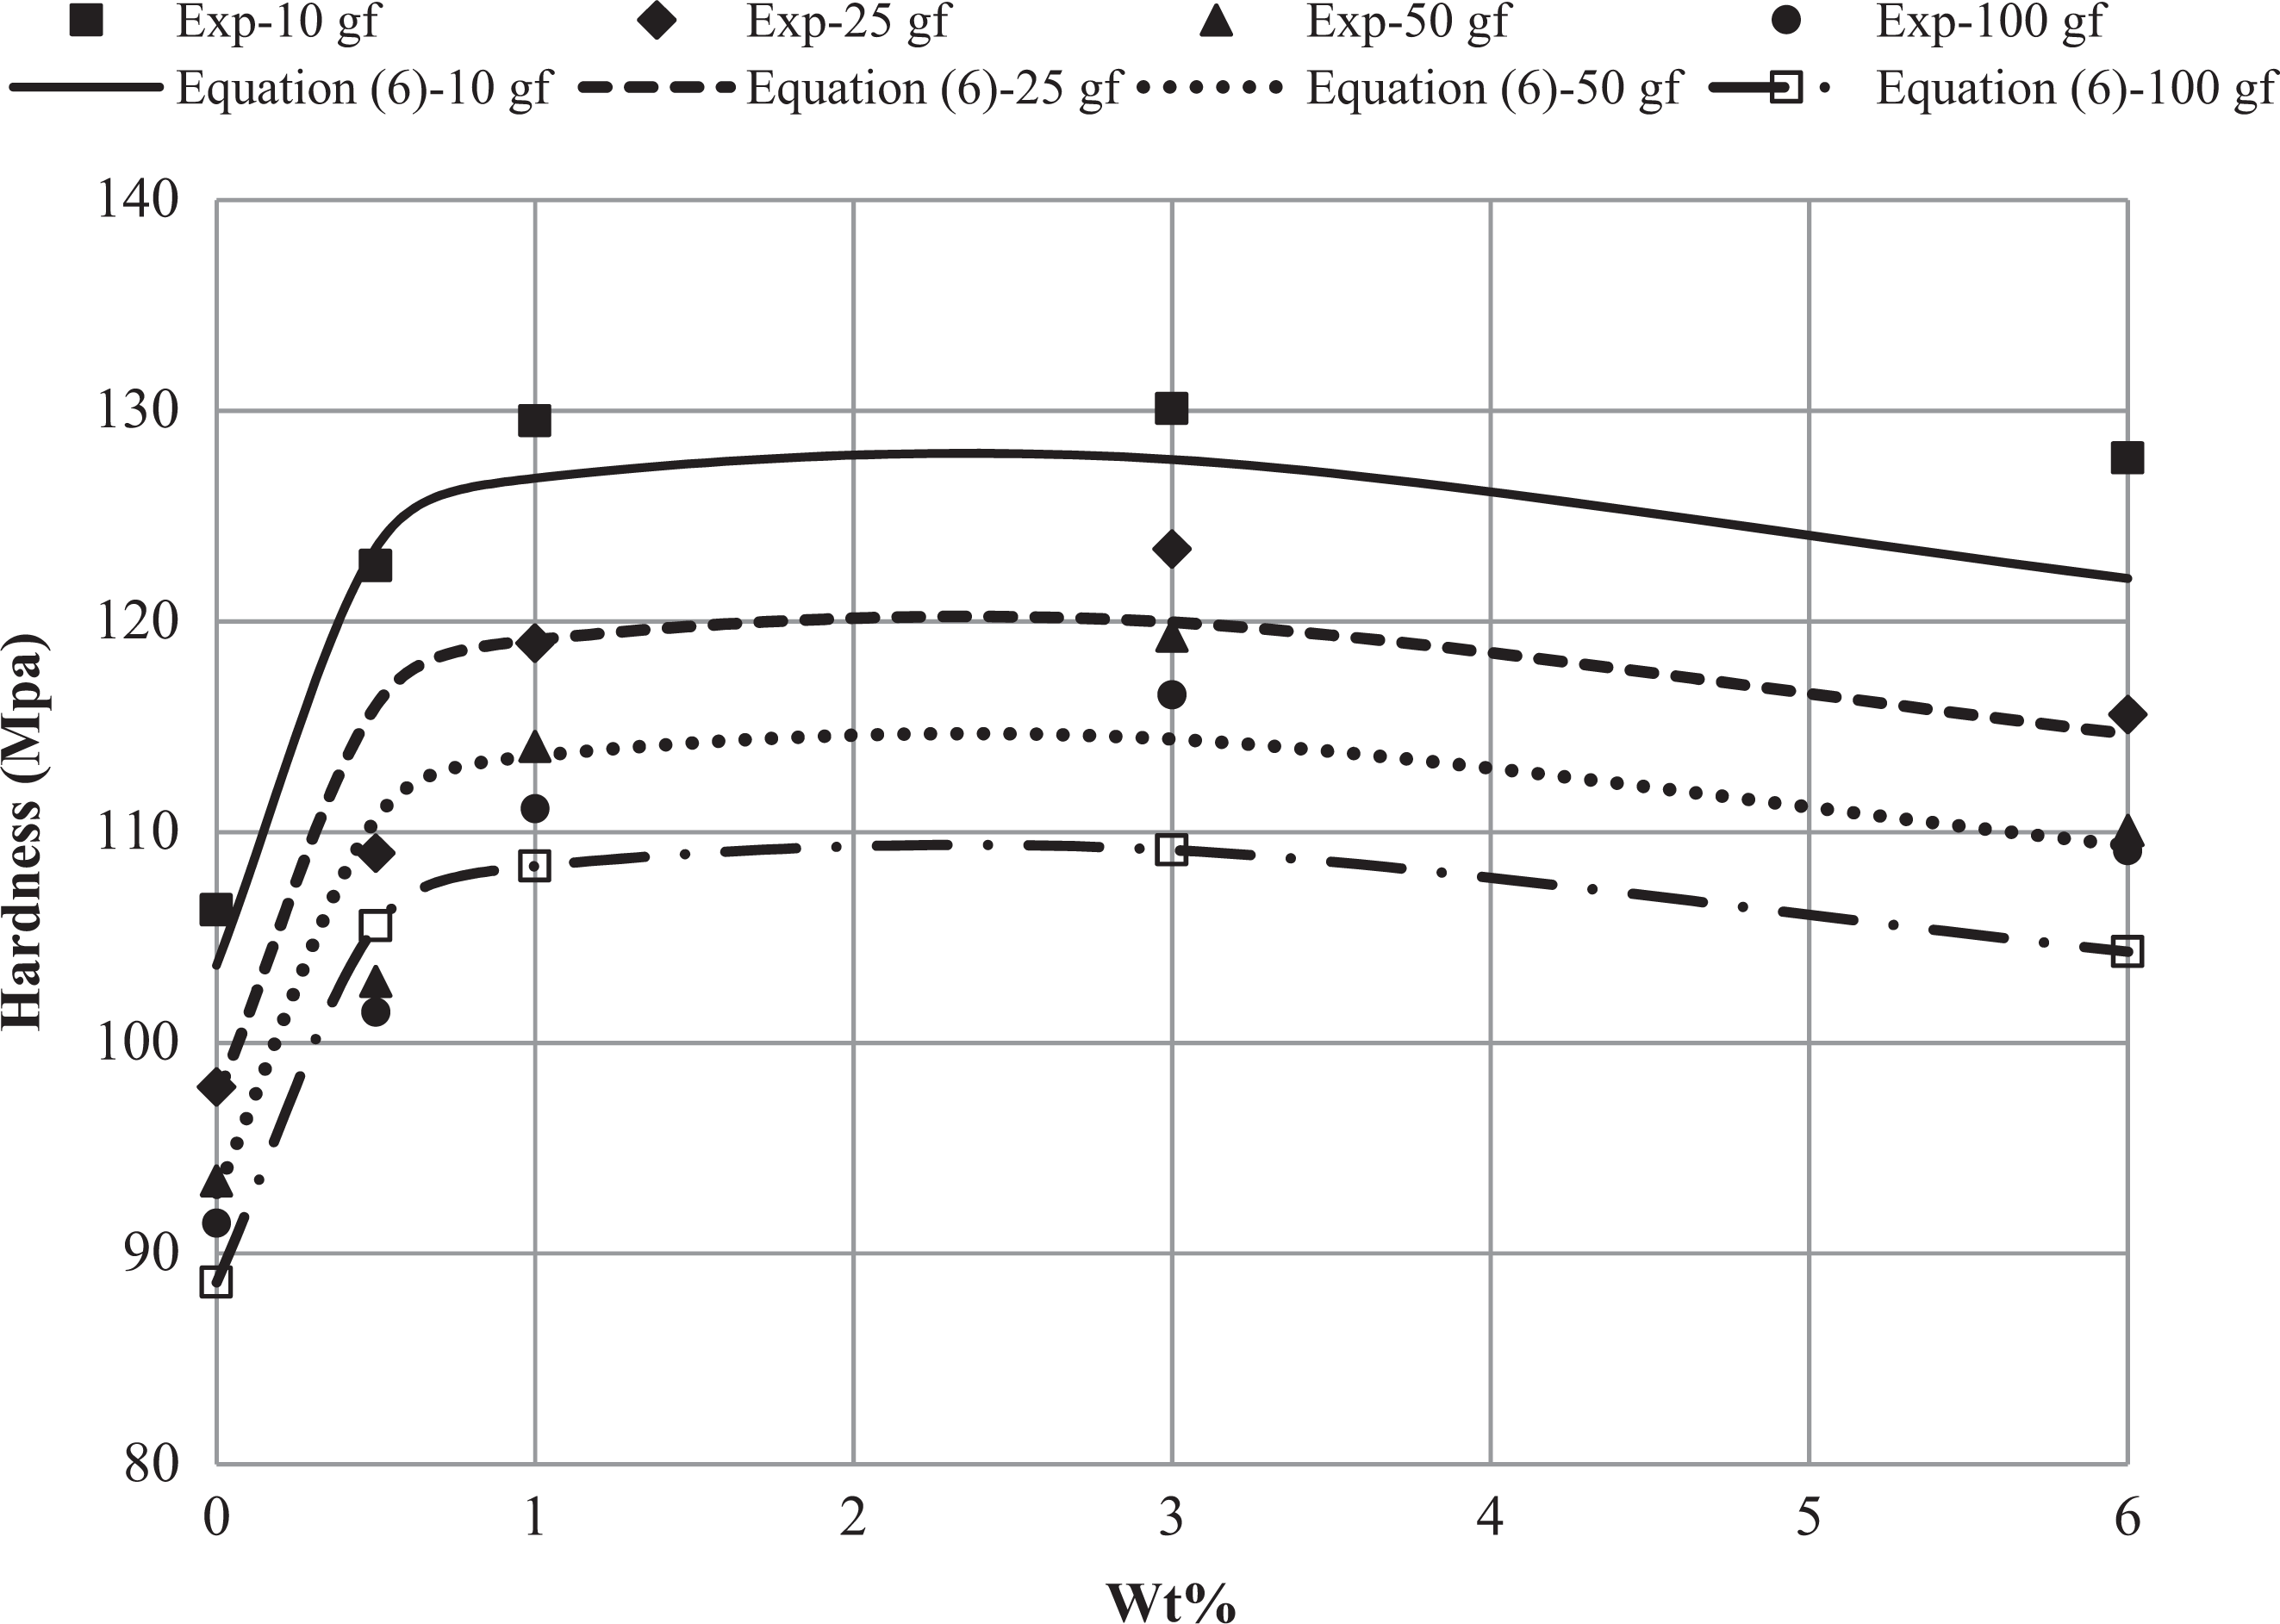
A comparison between the experiment and the proposed model for PP/CC in tension. PP/CC: polypropylene/nano-calcium carbonate.
Correlation between yield stress and microhardness
Variation of the H/Y ratio versus the filler content obtained from Vickers test for different applied loads are compared with the proposed model in Figures 16 and 17 for PP/NC and PP/CC, respectively. Figure 16 reveals that the H/Y ratio for PP/CC varies from 3.5 to 4.8 for tensile yield stress and 2.2 to 3.0 for compressive yield stress. Similarly, for PP/NC, the results shown in Figure 17 indicate a variation of 3.4–4.6 and 2.2–3.10 for tensile and compressive yield stresses, respectively. As previously stated, because Yc is greater than Yt, H/Yt is clearly greater than H/Yc for all cases. Flores et.al. 13 reported H/Yt = 3 and H/Yc = 3 for PE with different morphologies. This phenomenon divides the Figures 16 and 17 to two distinct compressive and tensile zones. Again, the figures exhibit a reasonable agreement between the proposed model and the experiments.
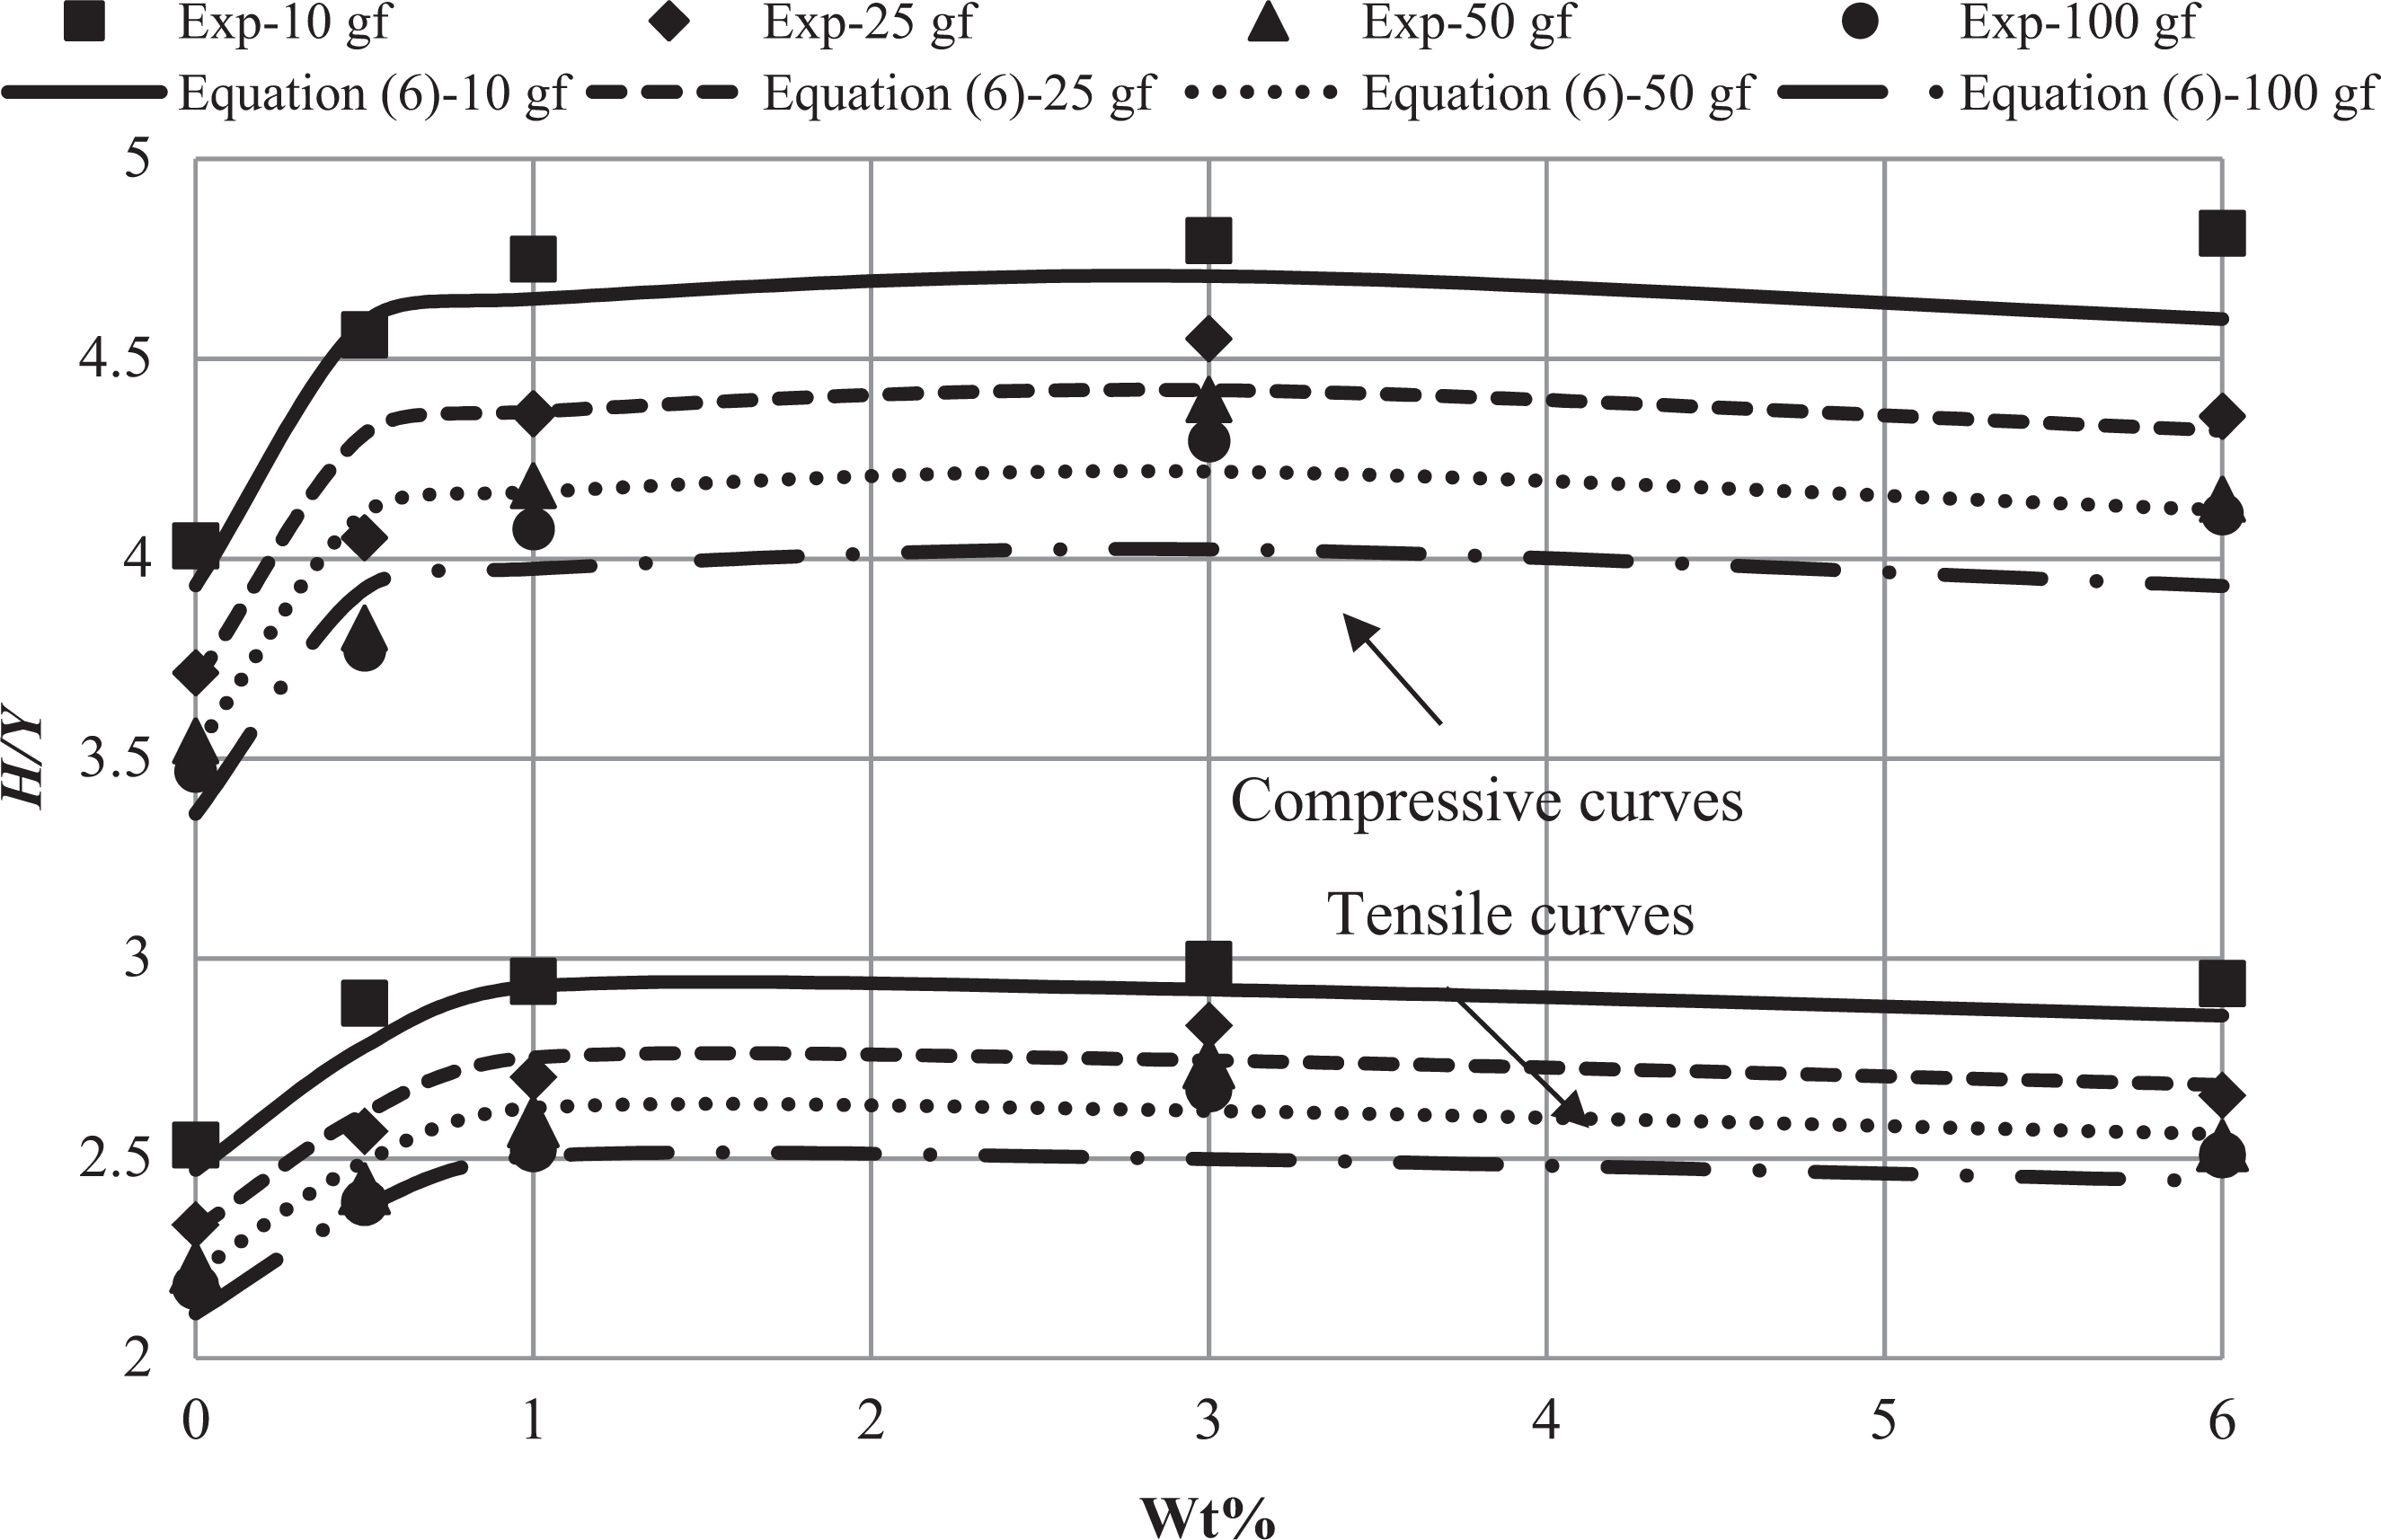
Plots of H/Y versus CC for different applied loads in tension and compression. CC: nano-calcium carbonate; H: microhardness; Y: yield stress.
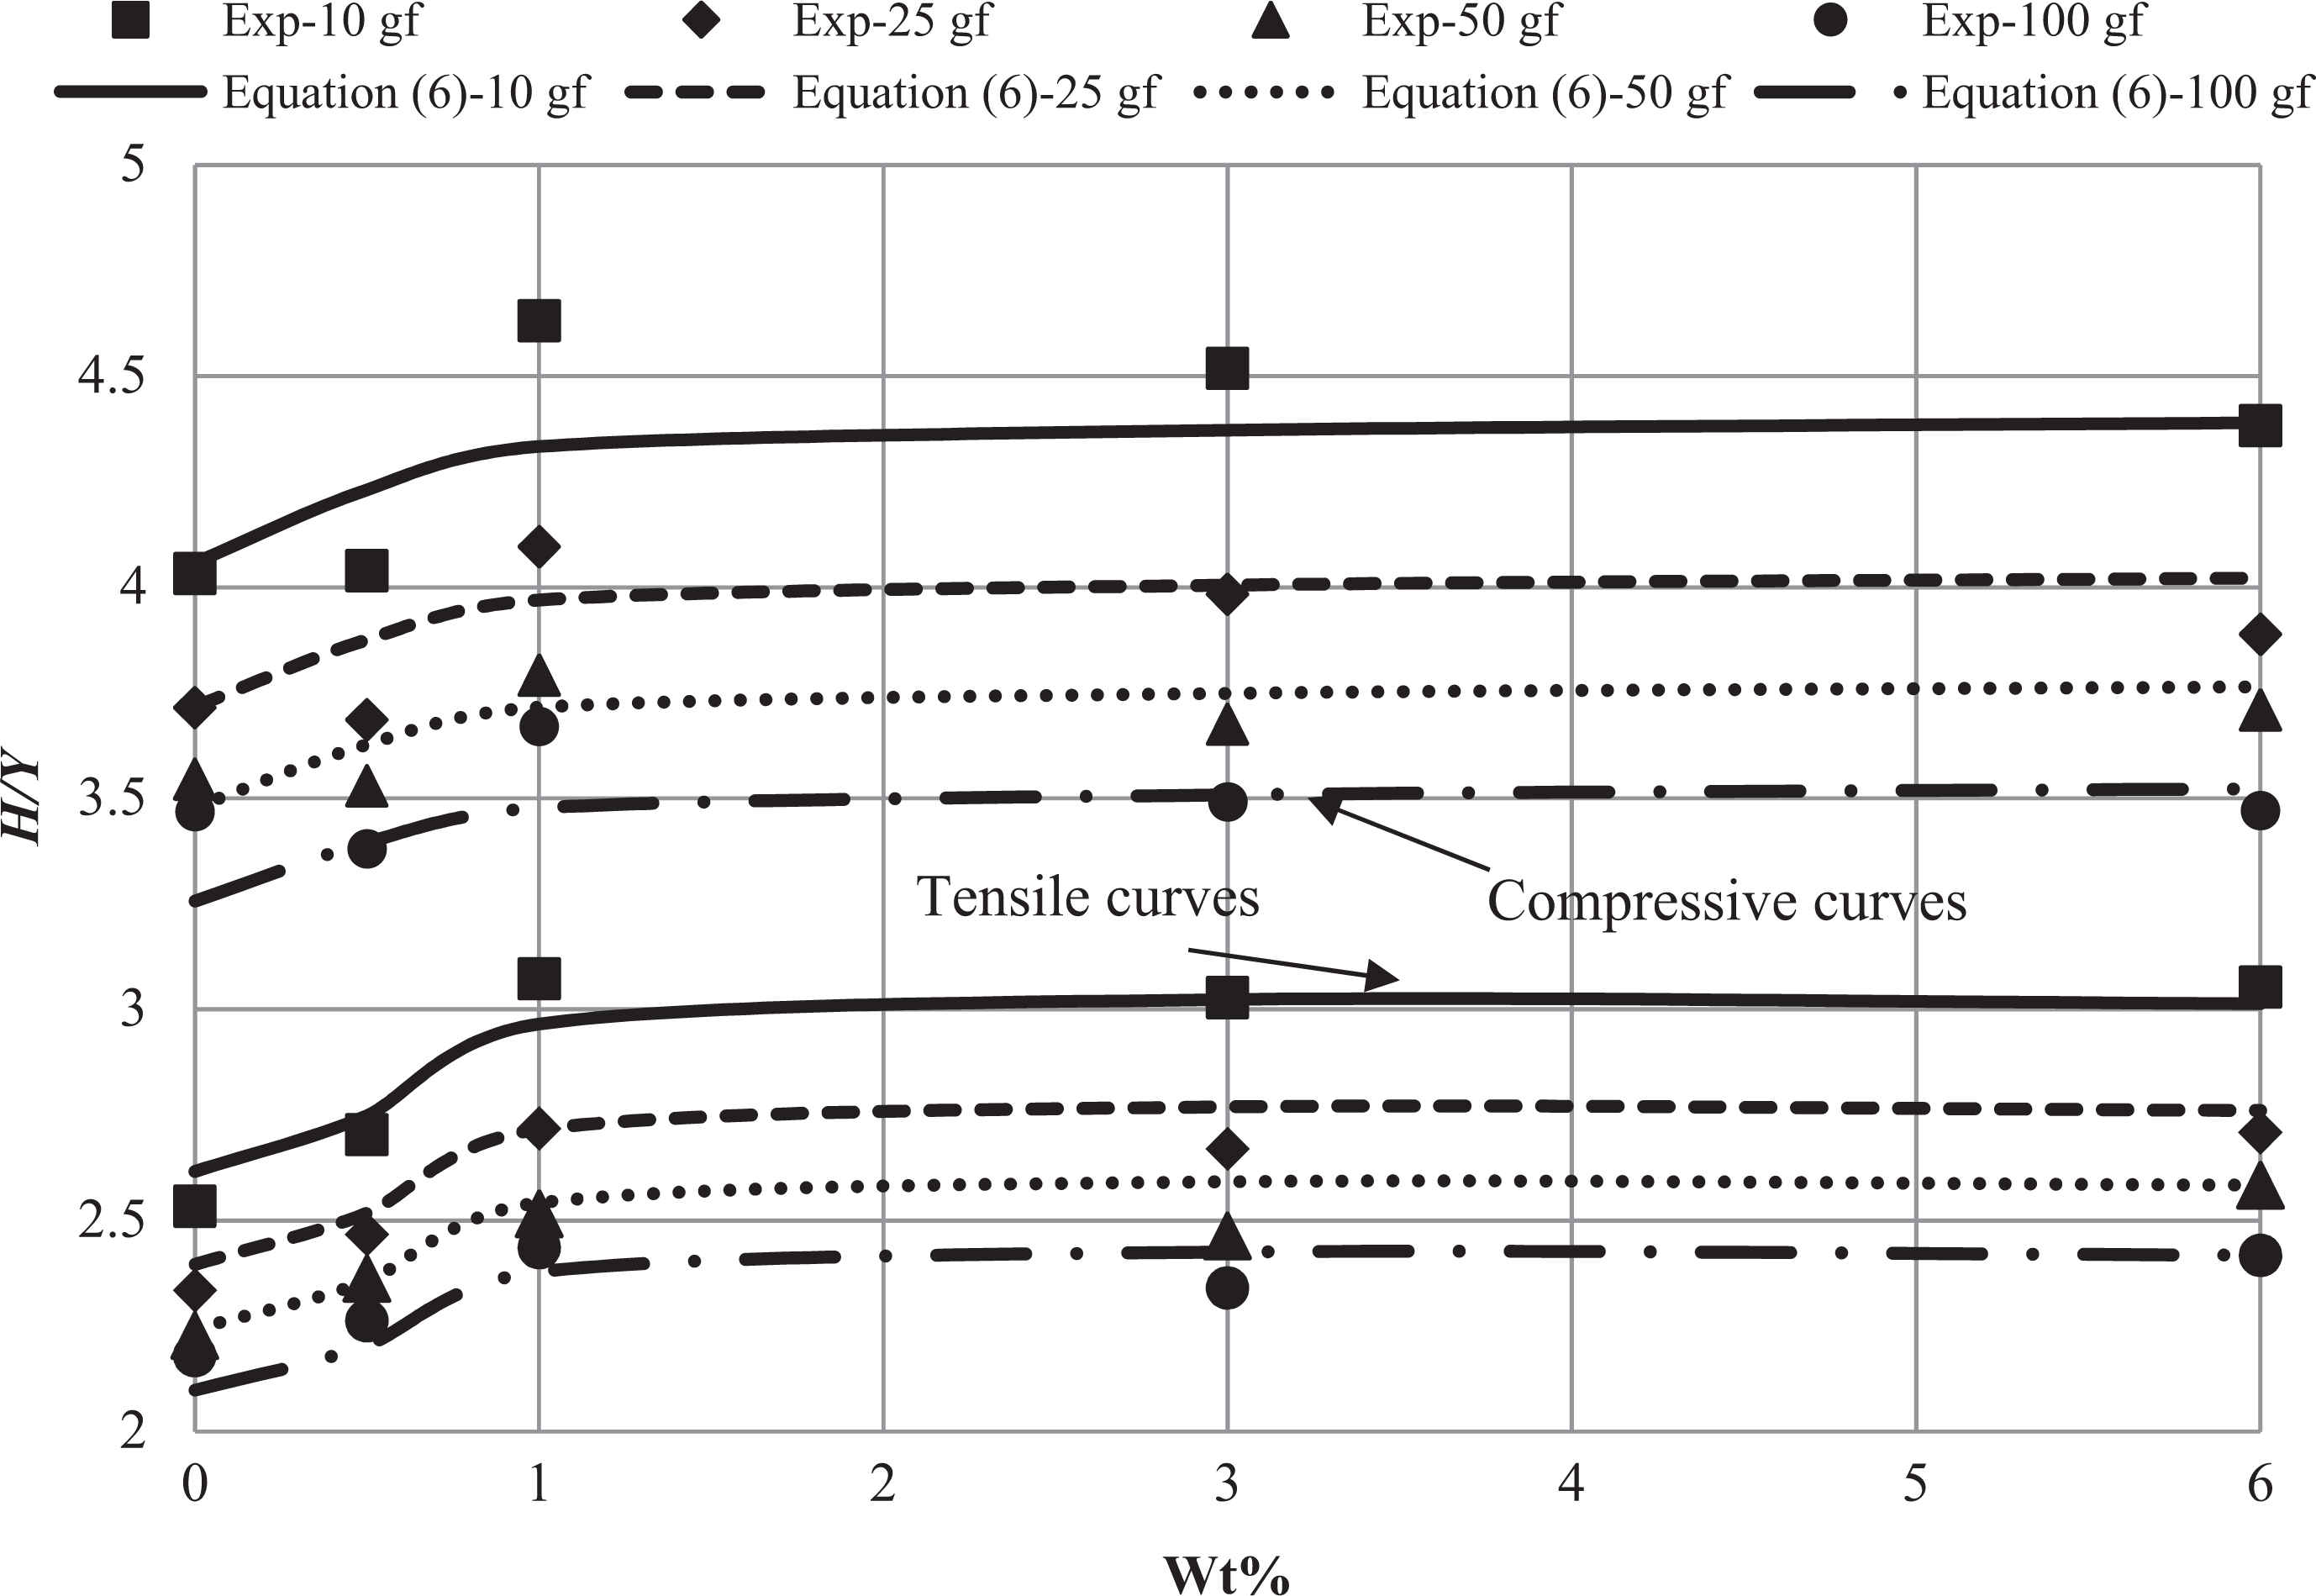
Plots of H/Y versus NC for the different applied loads in tension and compression. NC: nanoclay; H: microhardness; Y: yield stress.
The interesting point in Figures 16 and 17 is that all curves converge to a constant level of H/Y when the content of the filler exceeds 1 wt% for PP/CC and PP/NC composites.
The increase in H/Y ratio, in both compressive and tensile curves, that occurs with an increase in the filler content shows that the microhardness of PP/NC and PP/CC composites improves more with respect to their yield stress. The improvement in compression, however, is higher for PP/CC than that for PP/NC.
Conclusion
Reinforcing polymeric matrices with nanoparticles gives rise to considerable increase in their hardness, elasticity modulus, tensile, and compressive yield stresses. The reason is thought to be the change in morphology of the polymer which in turn is caused by spherulite refinement. This increase approaches 27% in 1 wt% filler-reinforced PP/NC composites for the applied load of 10 gf. The increase, however, reduces to 10% for the applied load of 100 gf. The maximum increase in the hardness of the 3 wt% reinforced PP/CC composites approaches 22% for the applied load of 25 gf. The increase in the hardness of PP/CC composites and the polymer is nearly the same regardless of the applied load level. The increase in hardness for PP/NC composites reduces with an increase in the applied load.
Marsh and Tabor analytical relations predict the compressive yield stress of the composites much more accurately than its tensile yield stress. The Vickers hardness for different load levels is bounded by these two analytical relations. Marsh and Tabor relations are more accurate for larger and smaller loads, respectively. This issue holds for both of PP/CC and PP/NC composites. The ratio H/Y is higher in compression than that in tension and reduces with an increase in the applied load. This ratio is higher in tension for PP/CC than that for PP/NC composites but is similar in compression.
The model proposed in this work reasonably predicts this ratio in tension and compression for both of the composites at various applied load levels and therefore, it may be more efficient than the previous models.
The proposed model is an appropriate model for the polymeric composites, the yield stress of which is different in tension and compression and exhibit different hardness behaviors that may occur due to strain softening under different loading conditions.
The new aspects in the proposed model is that the coupled effects of load (f), elasticity modulus (E), and additional linear term for the modulus are considered in the model.
Footnotes
Declaration of Conflicting Interests
The author(s) declared no potential conflicts of interest with respect to the research, authorship, and/or publication of this article.
Funding
The author(s) disclosed receipt of the following financial support for the research, authorship, and/or publication of this article: This research has been supported by Iran Nanotechnology Initiative Council (INIC), Grant no. 52389.