
Abstract
Nitrile butadiene rubber (NBR) samples filled with cobalt–zinc (Co-Zn) ferrite nanoparticles (Co1−xZn x Fe2O4, where x = 0, 0.2, 0.4, 0.6, 0.8, 0.9, 0.95 and 1) were prepared. The structure and morphology of Co-Zn ferrite nanoparticles were investigated using X-ray diffraction, transmission electron microscopy, and Fourier transform infrared (FTIR) spectroscopy, while the structure of the Co-Zn nanoferrite-filled NBR composites was studied using scanning electron microscopy and FTIR spectroscopy. The influence of ferrite composition on cure characteristics, mechanical properties and hardness showed an improvement up to x = 0.8. Dielectric parameters showed an enhancement with ferrite composition.
Introduction
Nowadays, nanocomposites have an increasing trend in studying their properties, especially for those with unique properties. Rubber ferrite composites (RFCs) are examples of those materials that have outstanding properties. Composites are derived from the incorporation of ferrite fillers in both natural and synthetic rubber matrices. 1,2 Ferrites are a class of magnetic materials that own a wide range of technological applications as memory storage devices, transformer cores, circulators, and variety of other modern devices, which cannot be easily replaced by any other materials because of its stability, economy, high electrical resistivity, and so on. 3 –6 Ferrites are classified into two groups, namely, spinel ferrites and hexagonal ferrites. Spinel ferrites can be represented by the chemical formula MFe2O4, where M = divalent cation (cobalt (Co), manganese, nickel, zinc (Zn), etc.). Co-Zn ferrite belongs to spinel ferrite group. It could be synthesized by many methods such as the sol–gel, 7 precipitation, 8,9 mechanochemical, 10 hydrothermal, 11,12 combustion, 13 –15 and microemulsion methods. 16 Co-Zn ferrite attracts great research interest due to their potential application in ferrofluids, magnetic fluids, magnetic recording media, and magnetic resonance image. When ferrite fillers are added to rubber matrix, they modify its mechanical, dielectric, and other physical properties of the elastomer. The essential criterion of using RFC as a microwave absorber and an electromagnetic interference (EMI) shielding material is flexibility and moldability. 17 When an appropriate polymer matrix is selected, ferrite filler can be incorporated to form a composite of required magnetic, dielectric and mechanical properties. Various rubbers are being widely used for the preparation of such RFCs, for example, natural rubber, styrene butadiene rubber, nitrile butadiene rubber (NBR) 18,19 and ethylene propylene diene monomer. In the present study, we chose NBR, which belongs to a complex family of unsaturated copolymers of acrylonitrile and butadiene is selected as a host matrix for ferrite filler. It is related to a class of rubbers that has low temperature flexibility; aging resistance; and resists oils, solvents, and water. Hence, we synthesized composites of different Co-Zn ferrite filler composition with NBR and investigated the physicomechanical properties, aiming to improve the mechanical and dielectric properties.
Experimental procedure
Materials preparation
Co-Zn ferrite preparation
Spinel ferrites having the composition Co1−xZn x Fe2O4, where x = 0, 0.2, 0.4, 0.6, 0.8, 0.9, 0.95 and 1, were synthesized by sol–gel citrate method. 20,21 Analytical-grade cobalt nitrate (Co (NO3)2·6H2O, with molecular weight (Mw) = 291.04 g mol−1; purity = 99.5% supplied by NTL, UK), zinc nitrate (Zn(NO3)2·6H2O, with Mw = 297.47 g mol−1; purity 99% supplied by CDH, New Delhi, India), and ferric nitrate (Fe(NO3)3·9H2O, with Mw = 404 g mol−1; purity 99%, supplied by CDH) were taken in stoichiometric proportion and were dissolved in distilled water with subsequent addition of citric acid (C6H8O7·H2O, with Mw = 210.10 g mol−1; purity 99% supplied by Fine Chemicals, Canada). The ratio of citric acid to total metal nitrates was 1:1. The produced magnetic phase, by sol–gel citrate process, may follow the chemical reaction:

Synthesis of RFCs
NBR containing 32% acrylonitrile content with specific gravity 1.17 ± 0.005 was supplied from Bayer AG (Germany).
N-Cyclohexyl-2-benzothiazole sulfenamide (CBS), a pale gray powder, with specific gravity of 1.27–1.31 at room temperature (25 ± 1°C) and melting point (95–100°C).
Zinc oxide and stearic acid were utilized as activators with specific gravity at 15°C of 5.55–5.61 and 0.90–0.97, respectively.
Elemental sulfur, fine pale yellow powder, with specific gravity of 2.04–2.06 at room temperature was used as a vulcanizing agent.
Dioctyl phthalate (DOP) was used as a plasticizer with specific gravity 0.991 and boiling point 384°C. All the rubber ingredients were of commercial grades, purchased from Aldrich Co. (Germany).
The elastomer was masticated by two roll mixing mills, with outside diameter 470 mm, working distance 300 mm, speed of slow roll 24 rpm, and fraction ratio of 1:1.4 in accordance with ASTM: D3182-07 standard. The rubber compounds were vulcanized in an electrically heated hydraulic press at 162 ± 1°C and a pressure of about 4 MPa for the optimum cure time (tc90) as determined for each compound by using Monsanto rheometer model 100 (Akron, Ohio, USA). The results are presented in Table 1.
Interpretations of NBR composites.
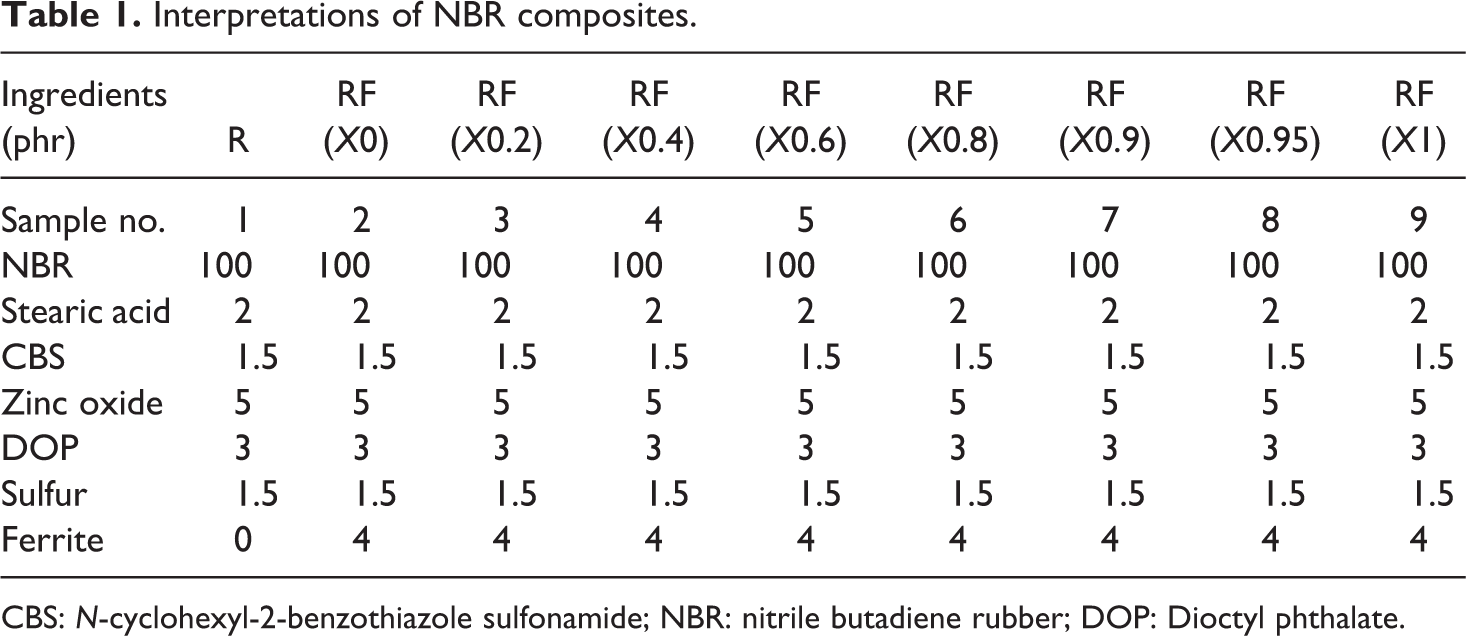
CBS: N-cyclohexyl-2-benzothiazole sulfonamide; NBR: nitrile butadiene rubber; DOP: Dioctyl phthalate.
Characterization
Structure analysis
X-Ray analysis
X-ray diffraction (XRD) patterns were obtained using a diffractometer of type (X’Pert Graphics, Germany) with copper Kα radiation (λ = 1.54056 Å). The data recorded from 2θ = 10° to 2θ = 80° were used to identify the crystal structure of the ferrite samples.
FTIR analysis
Fourier transform infrared (FTIR) spectroscopy was performed (Spectrum One-B; PerkinElmer, Waltham, Massachusetts, USA) in the range of 200–4000 cm−1 at room temperature in transmission mode, which indicates absorption of electromagnetic waves at certain frequencies.
SEM and TEM
Scanning electron microscopy (SEM) analysis was performed using a Quanta instrument (model FEG250, FEI, Hillsboro, Oregon, USA). The samples were gold coated, and the electron microscope was operated at 10 kV of excitation potential.
The particle sizes of different ferrite samples were investigated using transmission electron microscopy (TEM, JEOL JEM-2100, Japan) with an accelerating voltage up to 160 kV.
Rheometric characteristics
The rheometric behavior of the rubber compounds was determined using an oscillating disk Monsanto rheometer (model 100), according to ASTM D2084 standard.
Mechanical characteristics
Tensile strength, elongation at break, and Young’s modulus of the rubber compounds were determined according to the standard methods using an electronic Zwick tensile testing machine (model 1425, Germany), in accordance with ASTM D412 standard, where the specimen is hanged between two grips, with a movable upper grip and the other one is fixed.
Hardness measurements
Hardness was measured using the Shore A durometer (Bareiss-Oberdischingen-Germany), according to ASTM D 2240 standard.
Electrical measurements
The rubber sample’s surfaces were rubbed with silver paste as a contact material for the dielectric measurements. The parameters real part of dielectric constant (ε′), imaginary part of dielectric constant (ε″), and alternating current (AC) resistivity (ρac) were determined as a function of frequency using LCR meter model (TEGEM 3550 LCR meter, Cleveland, Ohio, USA) at room temperature. The frequency ranges from 45 Hz to 5 MHz.
Results and discussion
Structure analysis
X-Ray analysis
The XRD patterns for the prepared Co-Zn ferrites are illustrated in Figure 1. They show that the samples are formed in a single-spinel phase belonging to Fd3m space group. 22 The broadening of diffraction peaks indicates the formation of the crystallites in the nanometer size.
Lattice parameter and crystallite size calculations. The lattice parameter (a) for all investigated samples was calculated using the following equation:

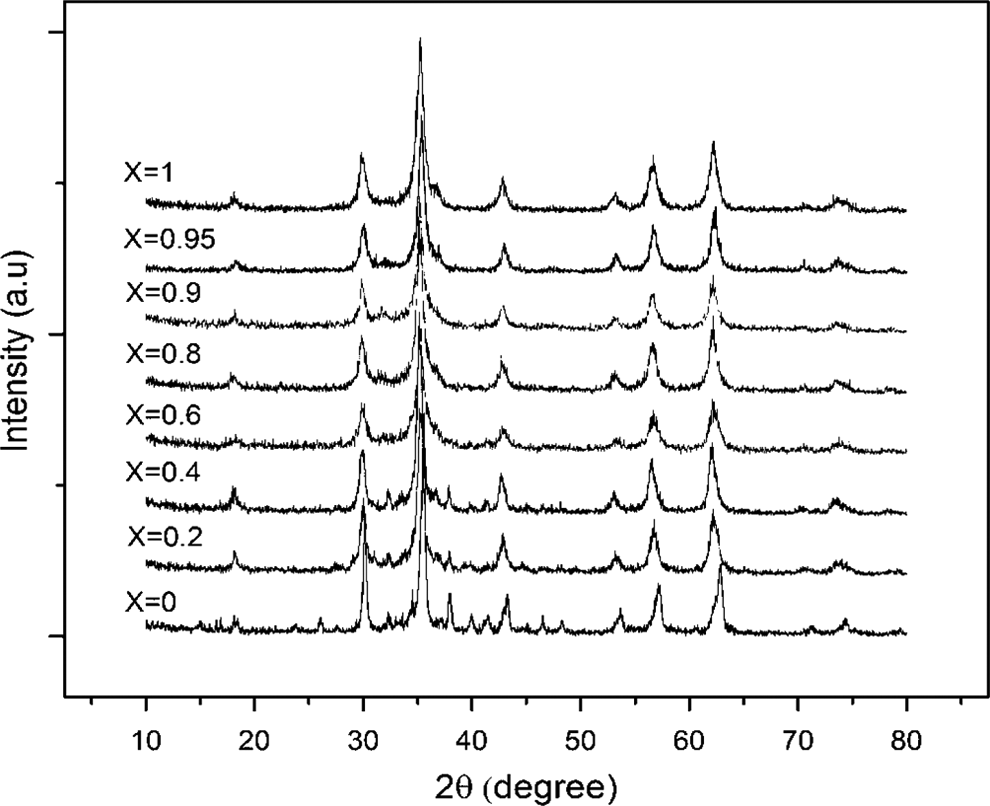
X-Ray diffraction patterns for prepared ferrite series (Co1−xZn x Fe2O4).
where dhkl is the interplanar spacing (recorded automatically) and h, k, and l are the Miller indices of each plane.
The composition dependence of the lattice parameter (a) and crystallite size (D) is shown in Figure 2. It can be seen that the lattice parameter (a) increases slightly with increasing Zn content up to x = 0.4, then a constant value is recorded up to x = 1.
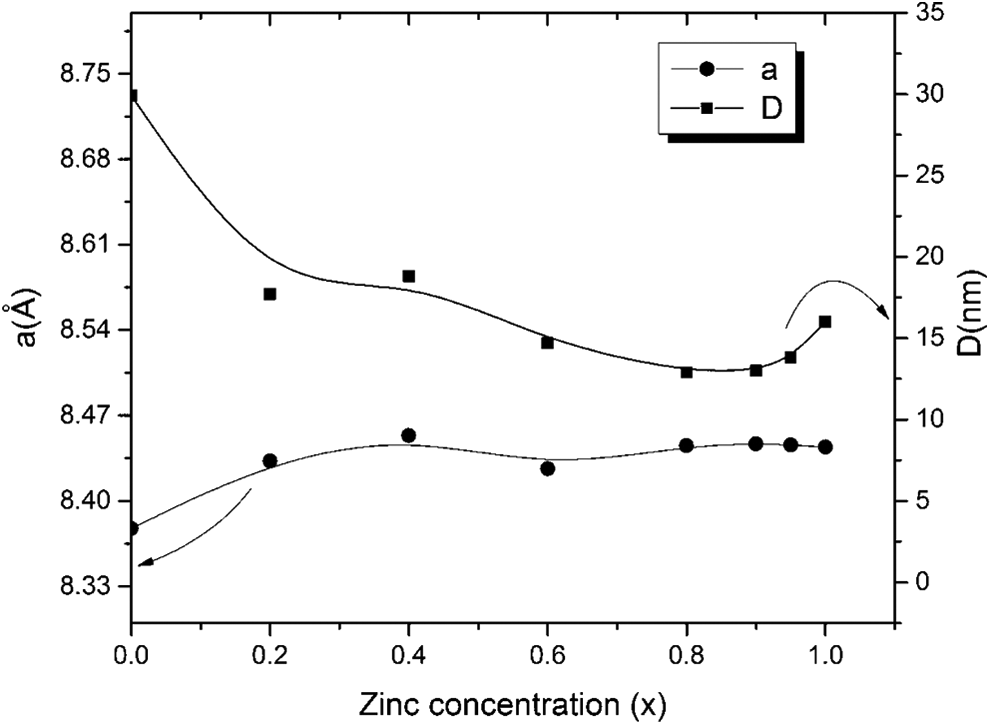
Variation of lattice parameter a (Å) and crystallite size D (nm) with zinc concentration.
As the lattice parameter of CoFe2O4 is (8.3775 Å) while that of ZnFe2O4 (8.444 Å), it is expected to find a slight increase in the lattice parameter. Moreover, Zn2+ ion has a radius of (0.82 Å), which is larger than the radius of Co2+ ion (0.78 Å). This leads to an increase in the cell edge (a) in agreement with Vegard’s law. 23 The calculated values for Co-ferrite and Zn-ferrite lattice parameters were found to agree with previously reported values. 20,24
The crystallite size (D) was calculated from the X-ray line broadening analysis, employing Rietveld method used in Materials Analysis Using Diffraction (MAUD) program (version 2.33, Luca Lutterotti). 25 The Rietveld method is more reliable than Debye–Scherrer method in calculating the crystallite size of the samples. 26
Crystallite size (D) recorded a remarkable decrease up to Zn concentration x = 0.8, followed by an increase up to x = 1, as illustrated in Figure 2. The higher specific heat particle means that high energy is required to raise the temperature of one grain of particle to a certain temperature, that is, Q = mcΔT, where Q is the amount of energy, m is mass of sample, and ΔT is temperature difference. Moreover, the high-temperature seeds will be active and react with other seeds leading to a larger particle size. Hence, in our experiment, Q and m are constants, and c is inversely proportional to ΔT. It was reported that c = 143 J K−1 mol−1 for ZnFe2O4 27 and c = 123 J K−1 mol−1 for CoFe2O4. 28 Then ΔT will be higher for CoFe2O4 sample of lower specific heat. The decreasing behavior may be due to the surface temperature. 29 Higher concentration of Zn2+(x > 0.8) favors the growth of the crystallite size at the nucleation centers, which resulted in higher crystallite size. 30
Moreover, the crystallite size is about 12.9 nm for Co0.2Zn0.8Fe2O4 sample ferrite. 2. Specific surface area. Specific surface area for all investigated samples was calculated using the following relation
31
:
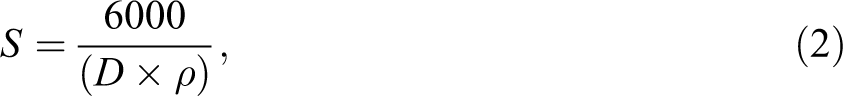
where S is specific surface area, D is particle diameter, and ρ is density of the particle.
Density was calculated using the following equation:
where M is the molecular weight of composition, NA is the Avogadro number, and a is lattice parameter.
The calculation of specific surface area showed an increasing behavior up to x = 0.8, followed by a decrease up to x = 1, as illustrated in Figure 3.
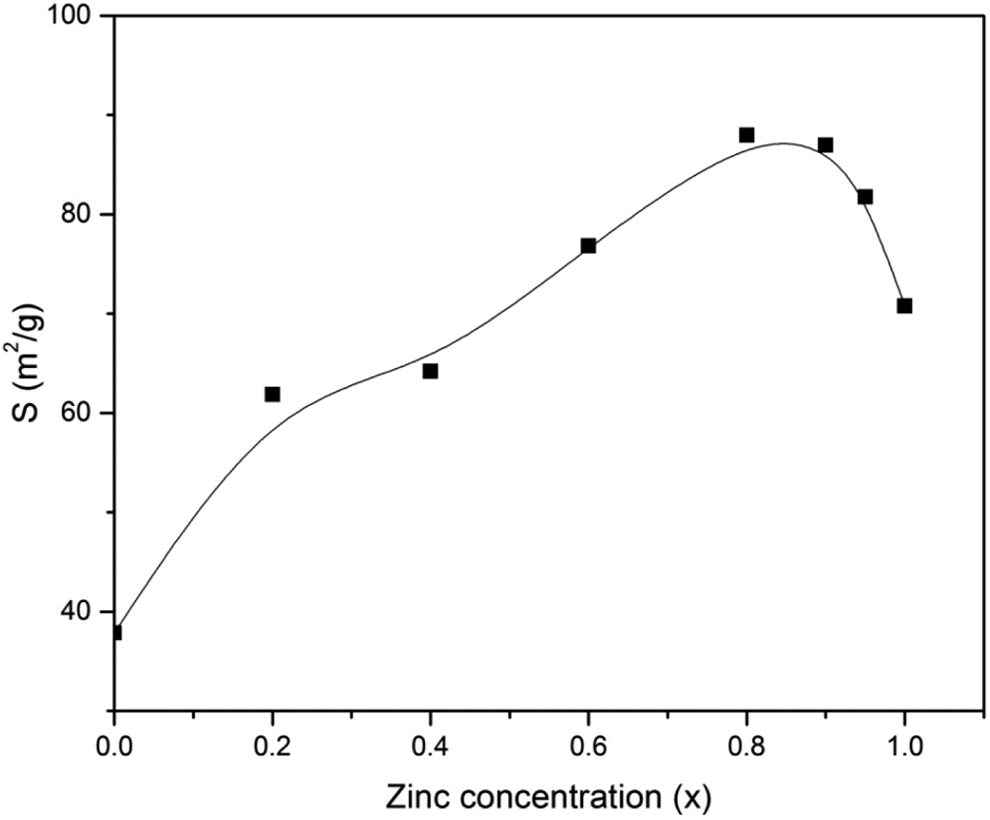
Variation of specific surface area with zinc concentration.
This behavior could be related to the behavior of crystallite size, as the crystallite size is inversely proportional to the specific surface area.
FTIR analysis
The spinel ferrite has four IR bands representing four fundamental vibrations. 32 It is known that ν1 is mainly due to the tetrahedral complexes that appear in the range of 540–630 cm−1. Also, ν2 appears in the range of 390–490 cm−1 and is mainly attributed to the vibrations of the high valence cation(s) occupying octahedral site such as (Co3+–O and Fe3+–O)bonds. Meanwhile, ν3 band appears in the near equal range of 310–360 cm−1 and is mainly attributed to the vibrations of the low valence cation(s) occupying octahedral site such as (Co2+–O and Fe2+–O)bonds. Finally, ν4 is a result of the lattice vibrations as a whole. 33 The FTIR spectrum for Co0.2Zn0.8Fe2O4 was investigated from 200 cm−1 to 700 cm−1, which is shown in Figure 4. The choice of this sample will be declared later.
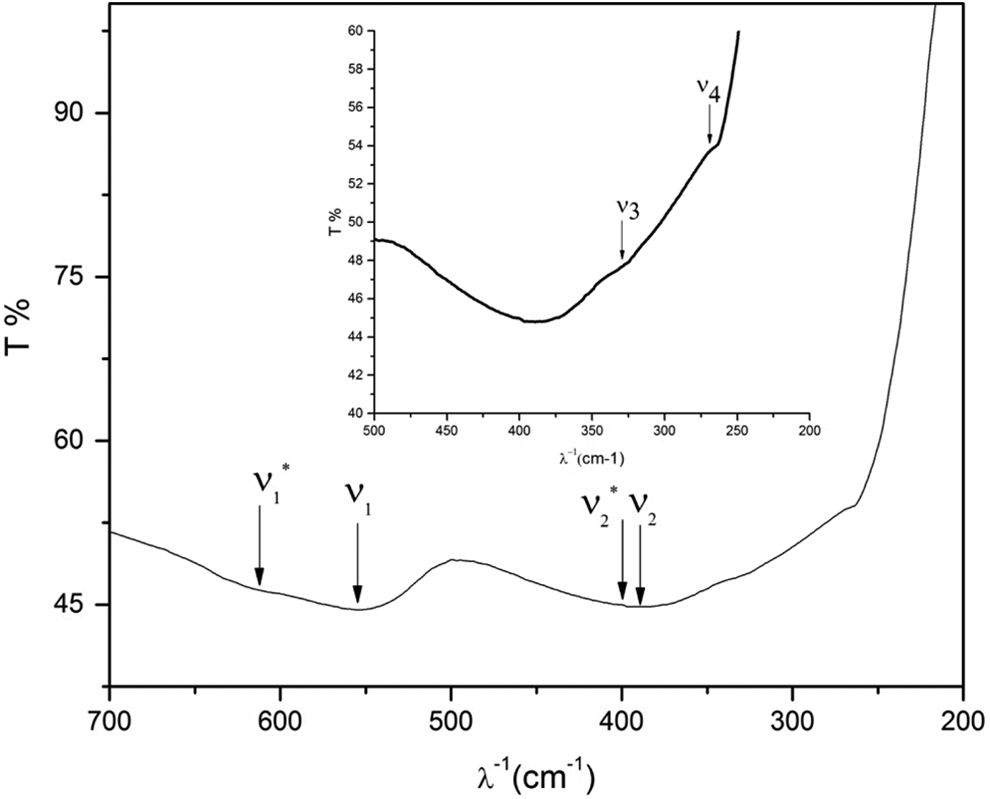
Infrared spectrum for Co0.2Zn0.8Fe2O4. The arrows refer to characteristic frequencies.
The characteristic frequencies drawn from Figure 4 are listed in Table 2.
Characteristic frequencies for Co0.2Zn0.8Fe2O4.
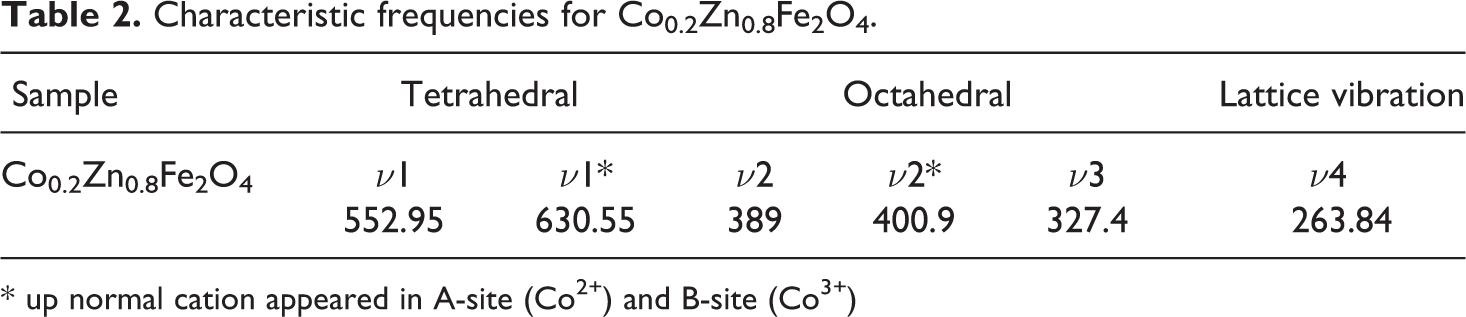
* up normal cation appeared in A-site (Co2+) and B-site (Co3+)
It is clear that the characteristic frequency ν3 confirms the presence of Fe+2 ions in B-site, which will be used later to explain the electrical properties.
The FTIR spectrum is also performed for blank NBR sample R and rubber ferrite sample RF (0.8) from 400 cm−1 to 4000 cm−1 as shown in Figure 5. For NBR, there are four characteristic frequencies:
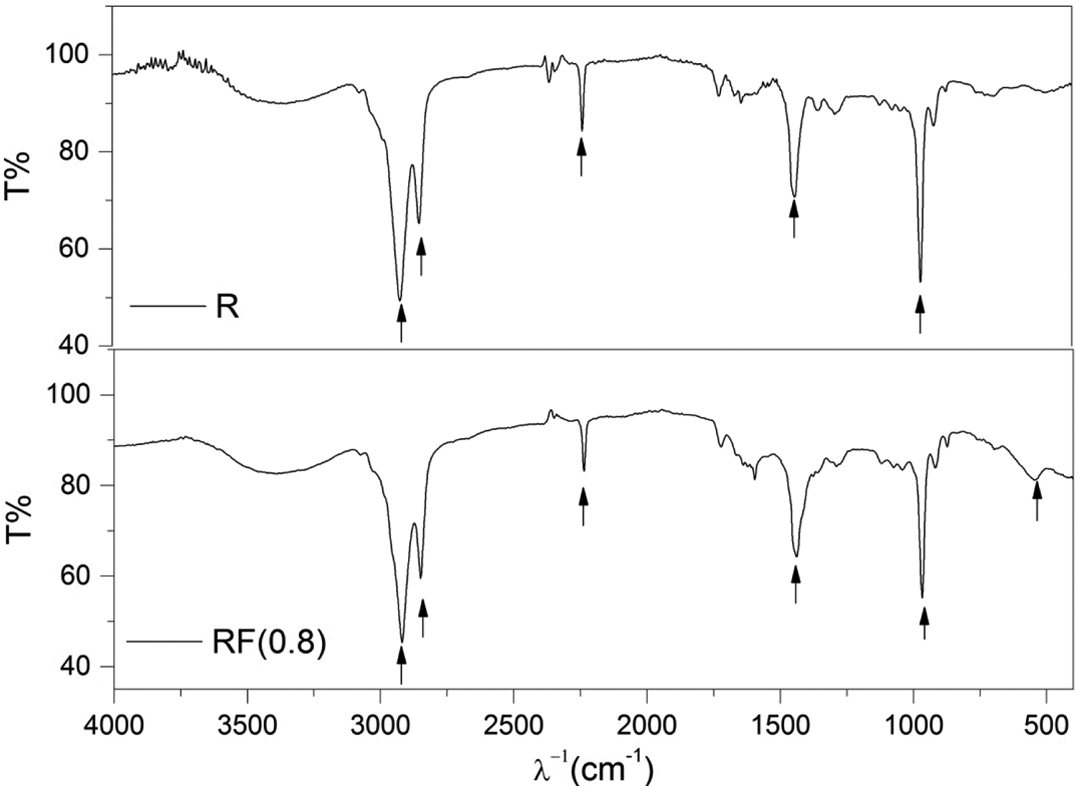
Infrared spectrum for rubber and rubber ferrite samples. The arrows refer to characteristic frequencies.
The characteristic frequencies are listed in Table 3. Moreover, the peak appeared at 552.95 cm−1 in RF (0.8) sample may be attributed to the tetrahedral sites of ferrite inside the rubber.
Characteristic frequencies for rubber samples.
TEM analysis
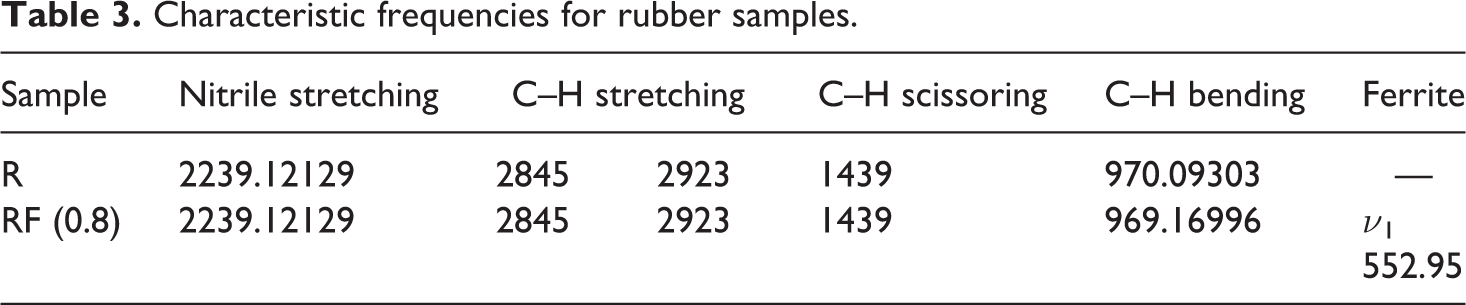
Figure 6 shows the TEM images for Co0.2Zn0.8Fe2O4 and size distribution histogram with the aid of ImageJ 1.46j software.
(a)TEM image and (b) the particle size distribution histogram for Co0.2Zn0.8Fe2O4 ferrite.
From the histogram of Figure 6(b), it is clear that the average crystallite size is about 14.5 nm. Therefore, there is a high agreement between crystallite size results obtained from X-ray (12.9 nm) and results obtained from TEM (14.5 nm), because in the range of small particle sizes, the particle size is nearly equal to crystallite size, therefore we can compare the crystallite size from X-ray with particle size obtained from TEM.
Rheological properties
The processability of these RFCs were determined by evaluating the cure parameters of the compounds.
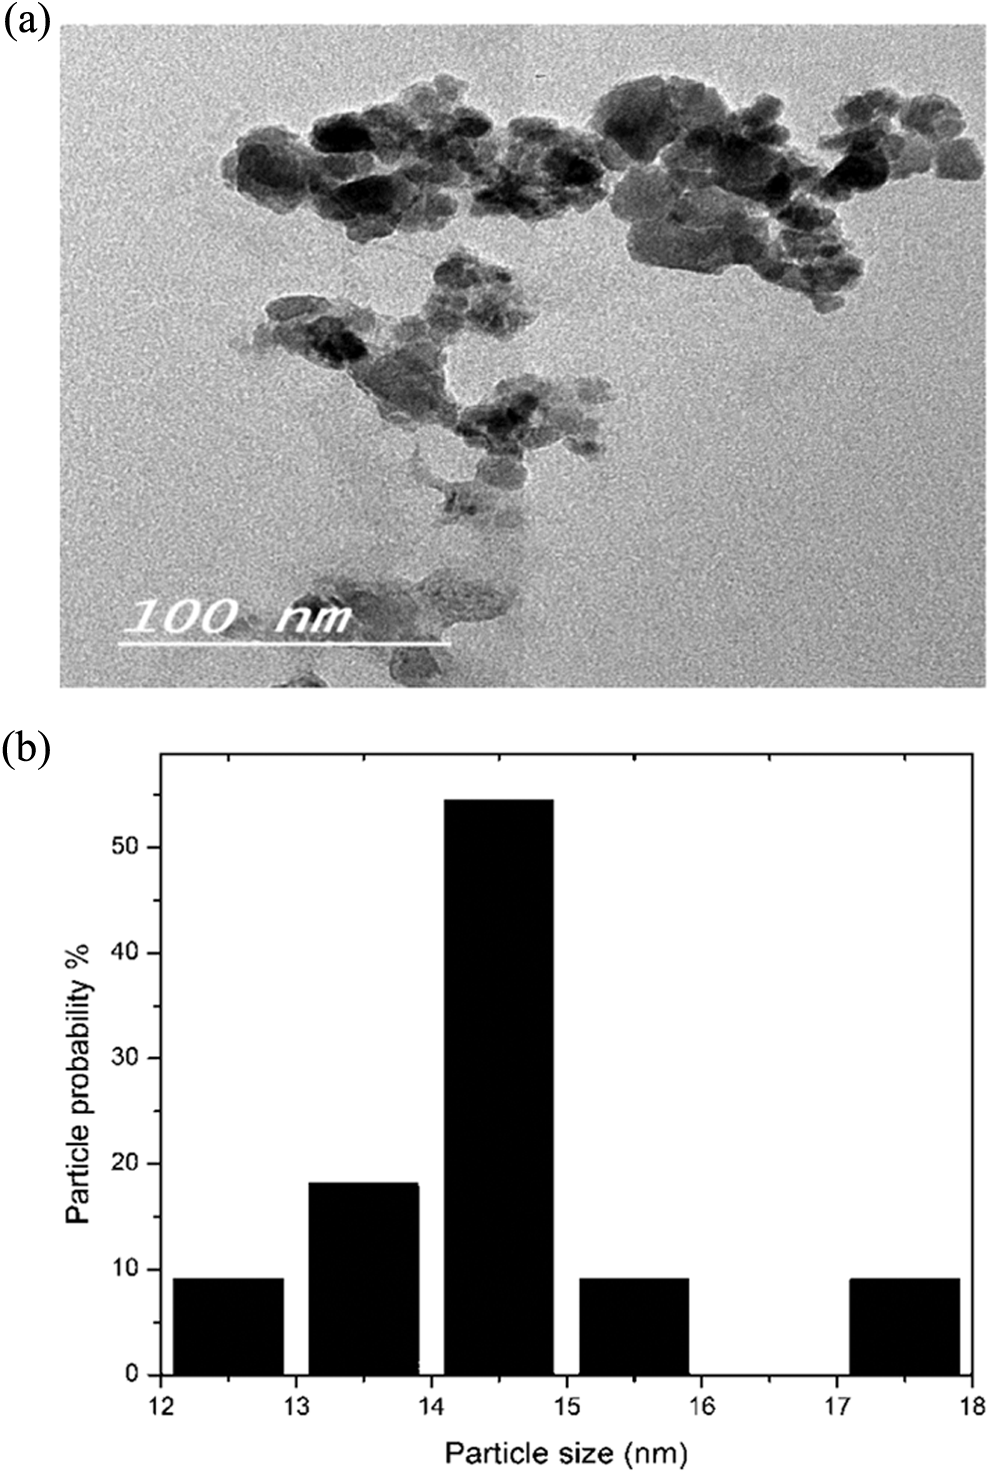
The variation of torque with different samples
Figure 7 shows the variation of torque and sample (i.e. composition of ferrite). The maximum torque MH shows a sudden increase from sample 1 (rubber without ferrite) to sample 2 RF (X0). The subsequent samples showed a gradual increase up to sample 6 RF (X0.8), followed by a decrease. Moreover, minimum torque showed a constant behavior.
The variation of torque with different samples.
Such a behavior for maximum torque MH may be presumably attributed to the increase in surface area of ferrite up to x = 0.8, which leads to the high rubber–ferrite interaction. Moreover, the decrease in maximum torque is related to the decrease in surface area of ferrite particle beyond x = 0.8, which reduces the rubber–ferrite interaction.
The variation of time (scorch, cure) and cure rate index with different samples
The variations of both scorch and cure times for different samples are illustrated in Figure 8. Both scorch time ts2 and cure time tc90 show a gradual decrease with sample up to sample 6, followed by an increase. On the other hand, the cure rate index (CRI) shows the inverse behavior of cure time.
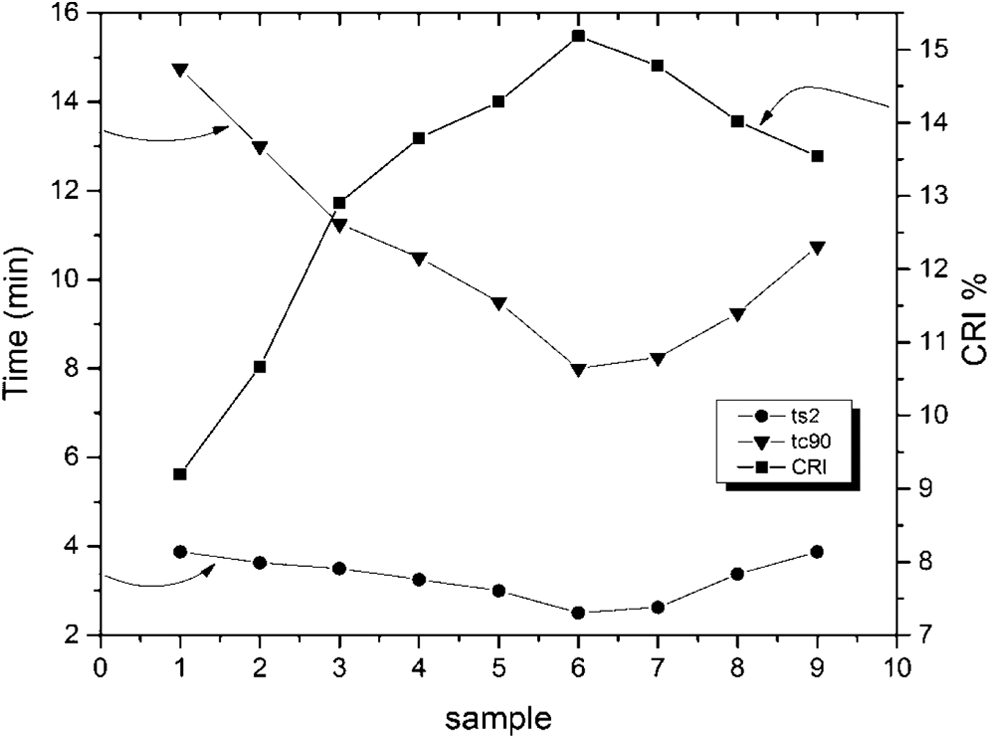
The variation of time (scorch, cure) and CRI with different samples. CRI: cure rate index.
Again, the behavior of both tc90 and ts2 could be attributed to the increase in the surface area of ferrite samples up to x = 0.8, which enhances the interaction between ferrite and rubber matrix, so the cure time decreases and cross-linking increases and hence CRI increases. However, the increase in time (cure, scorch) and decrease in CRI may be attributed to the decrease in the surface area of ferrite nanoparticles beyond x = 0.8. Such a decrease in surface area leads to poor interfacial interaction between the rubber and the investigated filler and thus the times (cure, scorch) increase and CRI decreases. 37
SEM analysis
The SEM micrographs for the samples blank rubber R (without ferrite), RF (X0.8), and RF (X1) are shown in Figure 9.
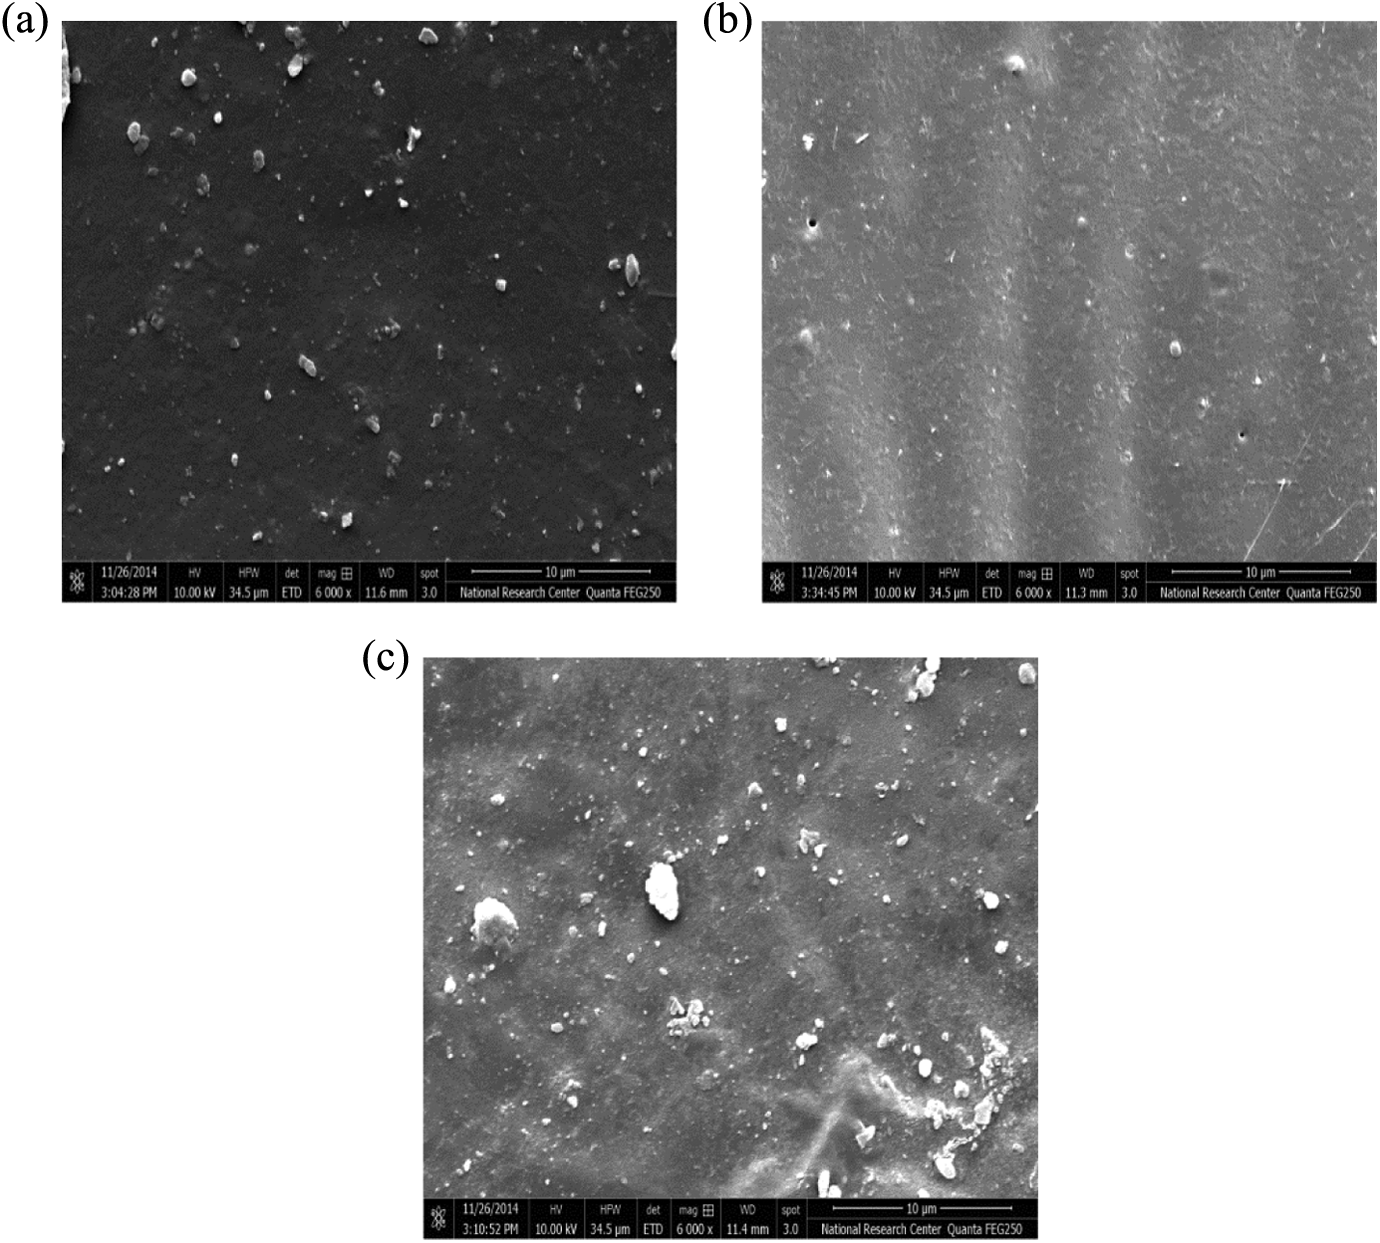
SEM micrographs for chosen samples (a) blank rubber R, (b) RF(X0.8) and (c) RF(X1). SEM: scanning electron microscopic.
Figure 9(a) shows the inhomogeneous distribution of ingredients for blank rubber R. On the other hand, a homogenous distribution was recorded when Co0.2Zn0.8Fe2O4 ferrite is added to rubber matrix resulting in RF (X0.8) sample, as shown in Figure 9(b). Moreover, a tendency of agglomeration of the ferrite nanoparticles was recorded when ZnFe2O4 is added to rubber matrix resulting RF (X1) sample as shown in Figure 9(c).
Mechanical properties
The variation of stress and Young’s modulus with different samples
The values of stress at yield (σB), stress at rupture (σR), and Young’s modulus (E) are shown in Figure 10. One can notice that σB, σR, and E show a continuous increase up to sample 6 RF (X0.8), followed by a decrease up to the last sample 9 RF (X1).
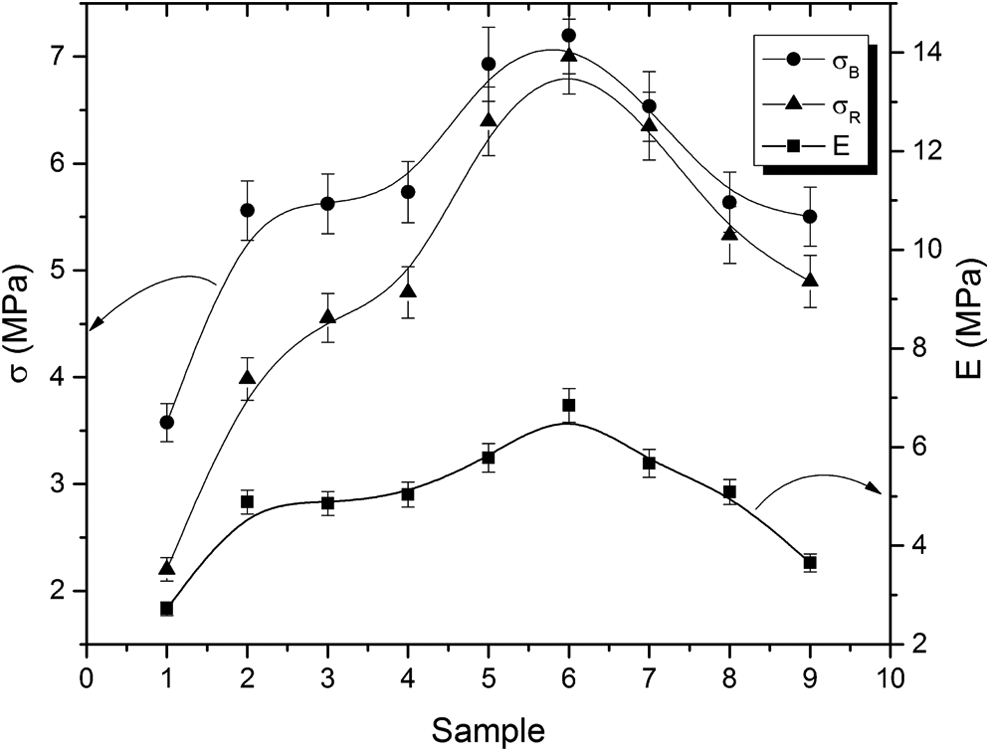
The variation of stress and Young’s modulus with different samples.
Such a trend for both stresses and modulus could be attributed to the increase in cohesive strength (cohesive forces between filler and rubber), as the surface area of ferrite increases and a maximum value is reached at sample 6. After sample 6, the surface area of ferrite particles decreases, which leads to decrease the cohesive strength and hence the three parameters decrease.
The variation of elongation and hardness with different samples
The elongation at rupture and hardness show a gradual increase with different samples up to sample 6, followed by a gradual decrease, as shown in Figure 11.
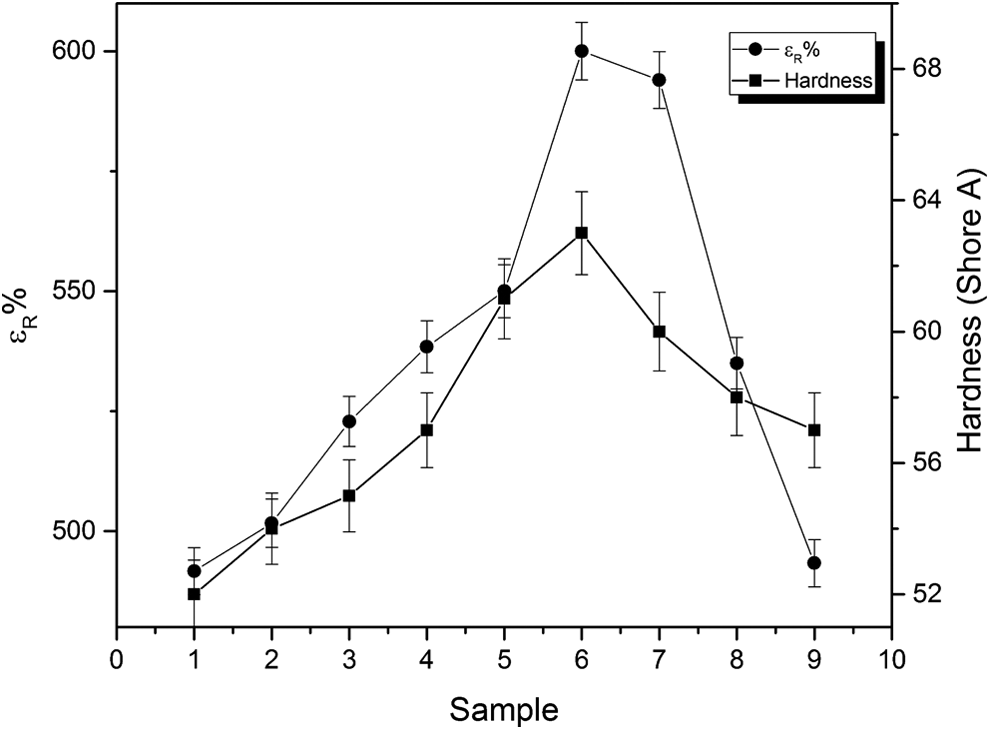
The variation of elongation at rupture and hardness with different samples.
Again, the trend is on the same way as the surface area. The increase in the surface area leads to increase in the elongation, and vice versa. Moreover, hardness behavior could be attributed to the cohesive strength as previously discussed.
Electrical properties
The variation of resistivity with frequency
The variation of the AC resistivity (ρac), at room temperature, with frequency (f) is illustrated in Figure 12 for some samples (1, 3, 6 and 9). It is obvious that ρac decreases with increasing frequency. Similar trend has been reported for different ferrites. 38,39
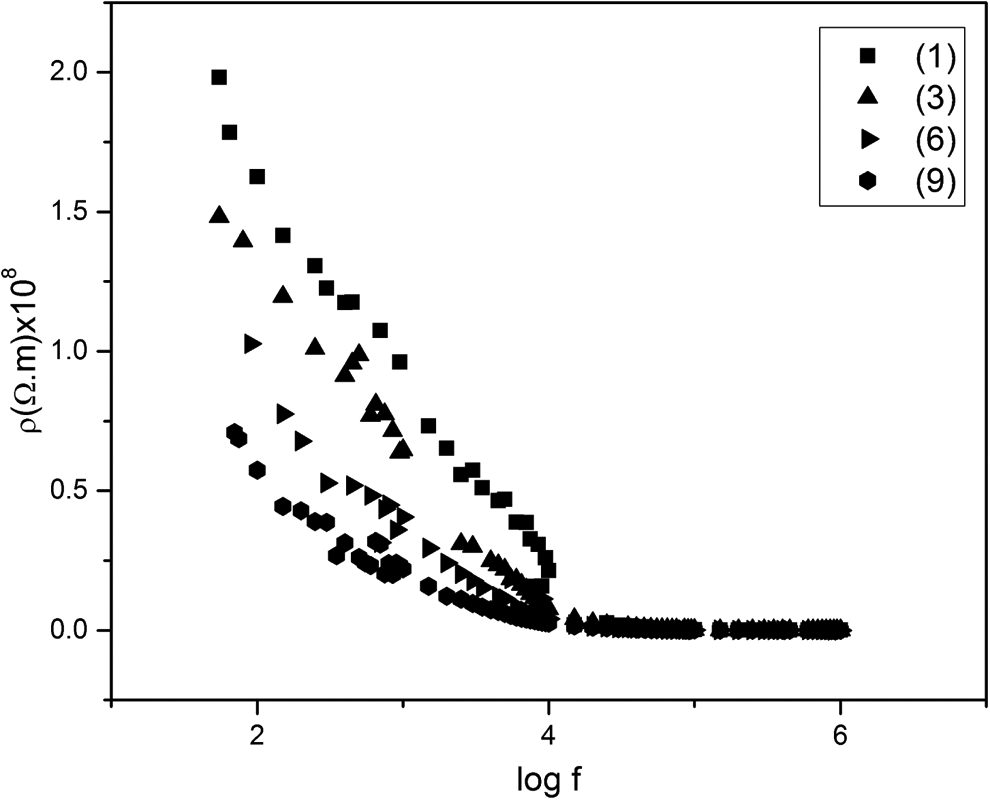
The variation of resistivity with frequency.
Such a result could be explained as follows. The conduction mechanism in our investigated systems is due to electron hopping between Fe2+ and Fe3+ in the B-site of the ferrite. The increase in frequency enhances the electron hopping frequency and hence increases the conductivity i.e. decreases the resistivity. At high frequencies, the resistivity of each system converges to a value independent of frequency. Such constancy is due to the fact that the electron hopping frequency cannot follow the external field and thus lags behind it.
The variation of real part of dielectric constant ε′ with frequency
Figure 13 shows the frequency dependence of the real part of the dielectric constant ε′ for samples (1, 3, 6 and 9) as examples at room temperature. It can be seen that ε′ initially decreases rapidly with increasing the frequency then it becomes fairly constant at high frequencies i.e. the dispersion is high in the low frequency region. Such a normal behavior was reported by several authors for different ferrites. 40 –42
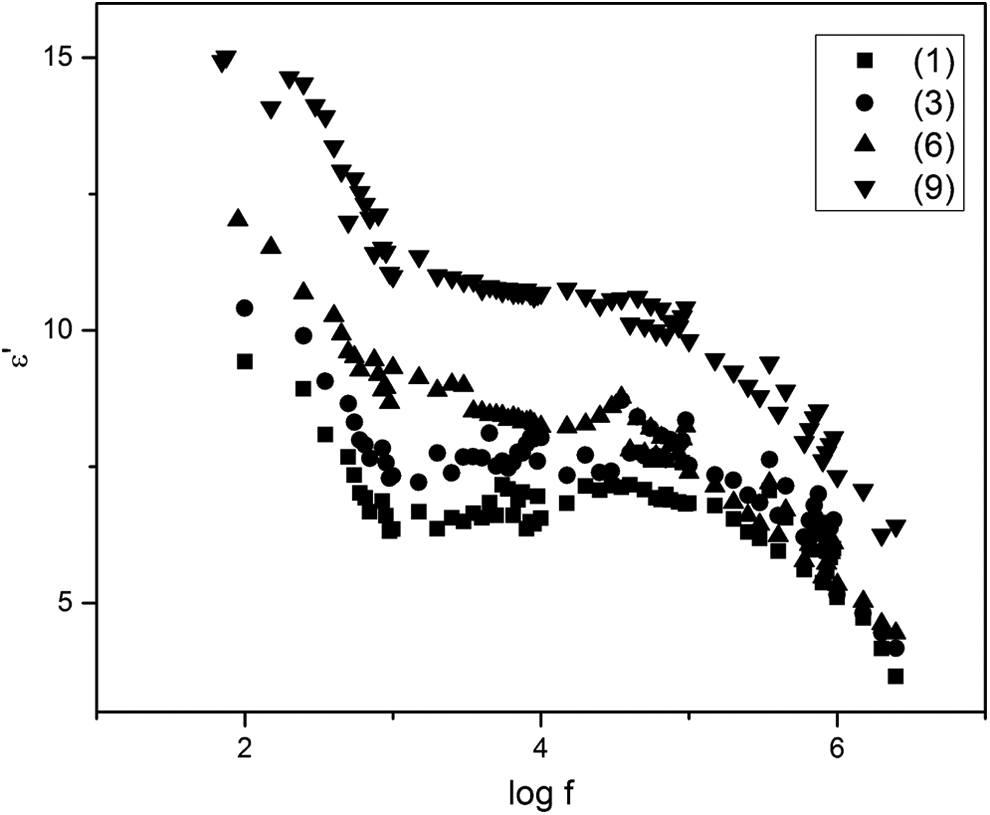
The variation of real part of dielectric constant with frequency.
The similarity between the frequency dependence of both the resistivity and the real part of the dielectric constant allowed many authors to suppose that both parameters have the same origin. 39,43 Therefore, the observed results could be explained on the basis that the dielectric properties, space charge polarization, are mainly governed by the conduction mechanism in ferrites, 39 wherein the electron hopping takes place. The electron hopping is favorable at lower applied field frequencies. The electron exchange between Fe3+ and Fe2+ gives local displacements of electron which induces polarization in ferrites. Therefore, at low frequency the dielectric constant has a maximum value. By increasing the frequency of the applied field, the electron exchange cannot follow the alternating field and so the dielectric constant decreases. 44
The variation of imaginary part of dielectric constant ε″ with frequency
The room temperature variation of ε″ (which represents the dielectric loss) with frequency f is shown in Figure 14 for samples 1, 3, 6 and 9. It can be seen that ε″ decreases continuously with increasing the frequency. A similar decrease of ε″ with frequency was also reported for many other ferrites. 45 –49
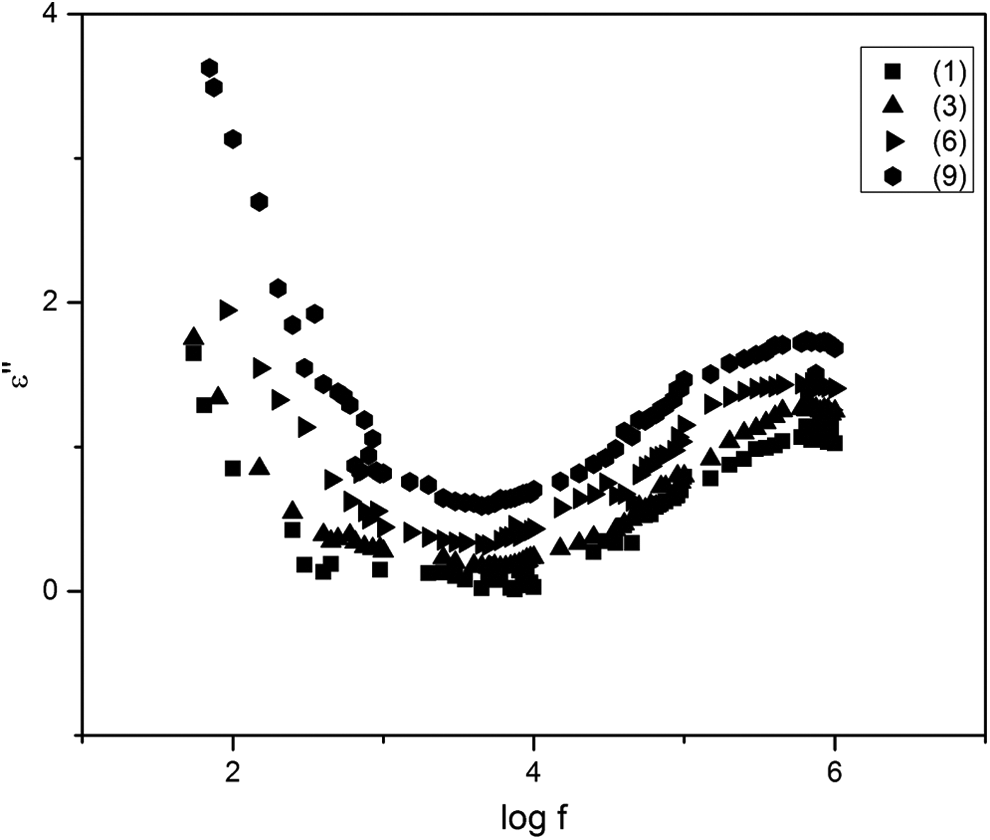
The variation of imaginary part of dielectric constant with frequency.
Such a decrease in ε″ could be discussed as follows. The core loss of RFCs is due to the dipole loss, which results from the dipole orientation (relaxation) which was found to decrease, especially at high frequencies, as the dipole orientation cannot follow the applied field frequency.
The variation of ρac, ε′, and ε″ with different samples
Figure 15 shows that the resistivity decreases with increasing Zn concentration in samples, that is, when Co2+ ions are substituted by Zn2+ ions in ferrite. The real part of dielectric constant ε′ shows a slow increase with samples up to sample 6. For the last three samples, a fast increase was recorded, while ε″ shows an increase with sample. All values recorded at fixed frequency of 5 kHz.
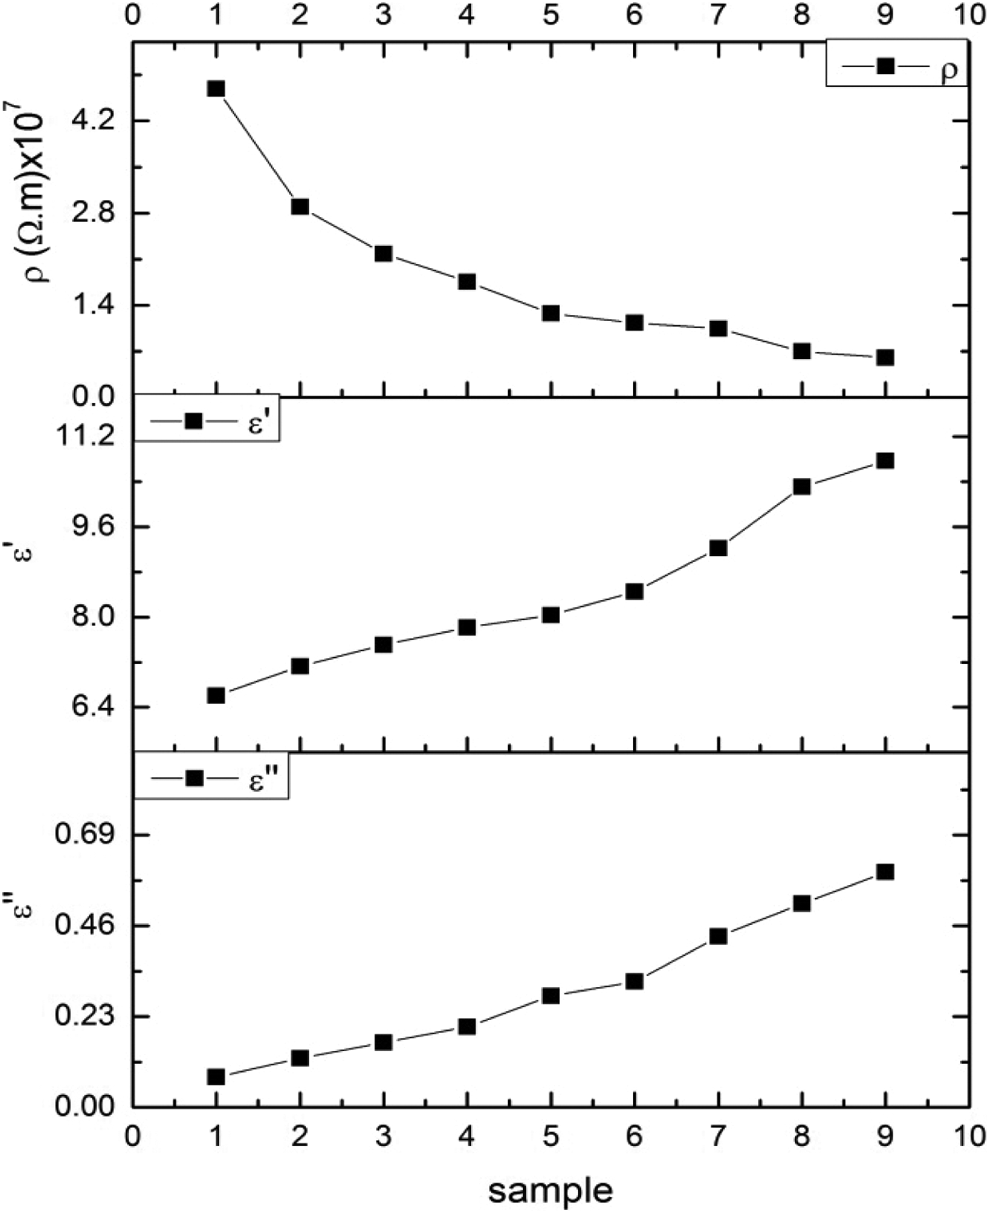
The variation of resistivity, real part and imaginary part of dielectric constant with different samples at 5 kHz.
The decrease in the ρac could be explained according to the cation distribution (Zn x Co y Fe1–x−y) [Co1−x−yFe1+x+y] O4. The increase of Zn in A-sites causes a migration of both Co2+ and Fe3+ to the B-sites. Part of Fe3+ ions are transformed into Fe2+ ions during preparation. Thus, the conduction in B-sites occur through Fe3+ ⇌ Fe2+ and Fe3+ + C02+ ⇌ F2+ + Co3+. Hence, probability of hopping increases. On the other hand, the real part ε′ expresses the concentration of charge carriers. Furthermore, it is known that ε′ represents the polarization of the material, that is, the concentration of the dipole moments per unit volume. Higher concentration of charge carriers gives higher value of ε′. Meanwhile, higher concentration of charge carriers means high conductivity or low resistivity. Thus, ε′ is inversely proportional to the resistivity which we have found experimentally in Figure 15. Moreover, the increment of dipoles per unit volume that are responsible for dielectric property increases the dipole loss and hence, the ε″ increases. 50
Conclusion
In this study, nanoferrite has been synthesized by sol-gel citrate method having the composition Co1−xZn
x
Fe2O4, where x = 0, 0.2, 0.4, 0.6, 0.8, 0.9, 0.95 and 1. X-Ray and TEM results provided a clear evidence of the formation of nanoferrite. NBR was mixed with nanoferrite to prepare a series of nanocomposites. The nanocomposites showed remarkable improvements in rheological, mechanical and dielectric properties. The presence of nanoferrite up to composition x = 0.8 enhanced different properties of NBR vulcanizates.
Footnotes
Declaration of conflicting interests
The author(s) declared no potential conflicts of interest with respect to the research, authorship, and/or publication of this article.
Funding
The author(s) received no financial support for the research, authorship, and/or publication of this article.