
Abstract
In the present investigation, a new material was used for the ring-opening polymerization (ROP) of ∊-caprolactone (∊-CL) as a chemical initiator. Generally, the metal salt initiated ROP of ∊-CL yielded a polymer with high melting temperature (T m). By keeping this idea in mind, the present research work was carried out. The PCL was synthesized under two different experimental conditions like Monomer to Initiator Ratio ([M/I]) and temperature variation. The optical band gap (E g) value for a hybrid was found to be reduced whereas after making composites the same was increased due to the encapsulation effect. The T m of Poly Caprolactone (PCL) was varied between 68.5°C and 71.4°C. The PCL composites synthesized above were characterized by various analytical tools like Fourier transform infrared spectroscopy, ultraviolet–visible spectroscopy, gel permeation chromatography, differential scanning calorimetry, thermogravimetric analysis, nuclear magnetic resonance spectroscopy (proton and carbon-13), particle size analysis and scanning electron microscopy. The E g value was increased with the increase in [M/I] ratio due to the decrease in calcium content.
Introduction
Organometallic compounds are used as an efficient catalyst for the preparation of aliphatic polyesters, particularly for the ring-opening polymerization (ROP) of ∊-caprolactone (∊-CL). 1 –3 In 2007, Dobrzynski used zirconium(acetenylacetate) as an initiator for the ROP of ∊-CL. 4 Wu and co-workers reported the metal complexes initiated polymerization of cyclic esters. 5 Per literature reports, amino calcium b-nitrobenzoxide initiated ROP of ∊-CL. 6 Calcium (Ca) complexes containing oxalate ligands were used as a catalyst for the ROP of ∊-CL. 7 The mercaptosuccinic acid (MSA)-coated cadmium telluride semiconductor nanocrystals were used in bioimaging application. 8 The cerium(IV)-MSA redox couple was used for the polymerization of acrylamide. 9 The ruthenium-MSA complexes were used for the oxidation of methylene blue in an acidic medium. 10
Recently, the synthesis, characterization, application and structural modification of biocompatible and biodegradable polymer is a fascinating field of research due to less or nil inverse effect on environment. Among the biodegradable polymers, PCL occupies the top most place due to the effective drug-carrying ability and zero cytotoxic effect. Such a nice candidate can be synthesized using different chemical initiators like functionalized multiwalled carbon nanotube, 11 silver nanoparticles 12 and ferrous ferric oxide 13 , and so on. Drug molecules are also used as an effective initiator for the ROP of ∊-CL without any branching and cross-linking reaction. 14,15 Other type of initiators such as metal alkoxides, 16,17 dyes, 18,19 Schiff base, 20,21 and its metal salts 22,23 were used as an initiator for the ROP of ∊-CL. Apart from these, –OH, 24,25 –NH2, 26,27 sulphonate, 28,29 ,–SH 30,31 and their derivatives were used as an initiator for the ROP purpose. Unfortunately, metal salts with free functional groups having seven membered cyclic rings as an initiator for the ROP of ∊-CL are available in less number because they offer high thermal stability, conductivity and molecular weight to the polymer. This urged us to use metal salts with free functional group as an initiator for the ROP of ∊-CL. The novelty of the present investigation is the role of metal salts as an initiator for the ROP of ∊-CL and it has high thermal stability. Besides, there has never been any systematic study on the influence of Ca-MSA on the ROP of ∊-CL and band gap of Ca during the ROP of ∊-CL.
Experimental
Materials
∊-CL (Sigma Aldrich, New Delhi, India), calcium carbonate (CaCO3; New Delhi, India), MSA (Fine chemicals, Mumbai, Maharashtra, India), stannous octoate (Sn(oct)2; Sigma Aldrich), chloroform (CHCl3; Spectrum chemicals, Mumbai, Maharashtra, India) and diethyl ether (Spectrum) were purchased and used as it is. Doube-distilled (DD) water was used for solution preparation and washing.
Synthesis of Ca-MSA nanohybrid
Fifteen grams of CaCO3 was dispersed in 100 mL of DD water under vigorous stirring condition. To this, 15 g of MSA in 100 mL DD water was added slowly. The reaction was carried out at 45°C for 2 h under nitrogen (N2) atmosphere. At the end of the reaction, the pale pink-coloured slurry was obtained. The slurry was isolated from the solution via filtration. After the filtration, the liquid was heated to dryness in a hot air oven at 110°C overnight. Thus, obtained white precipitate is Ca-MSA hybrid. During the course of the reaction, the thiol group of MSA can reduce the Ca2+ to Ca0 because of their reducing ability. The simple reduction reaction occurred through the thiol group of MSA. Mild reduction reaction leads to the formation of Ca-MSA nanoparticle. The carboxyl group of MSA can also interact with Ca2+ to form Ca-MSA hybrid. Finally, the white coloured precipitate was obtained, dried, weighed and stored in a zipper lock cover. Thus, the prepared Ca-MSA acts as an initiator for the ROP of ∊-CL (Figure 1).
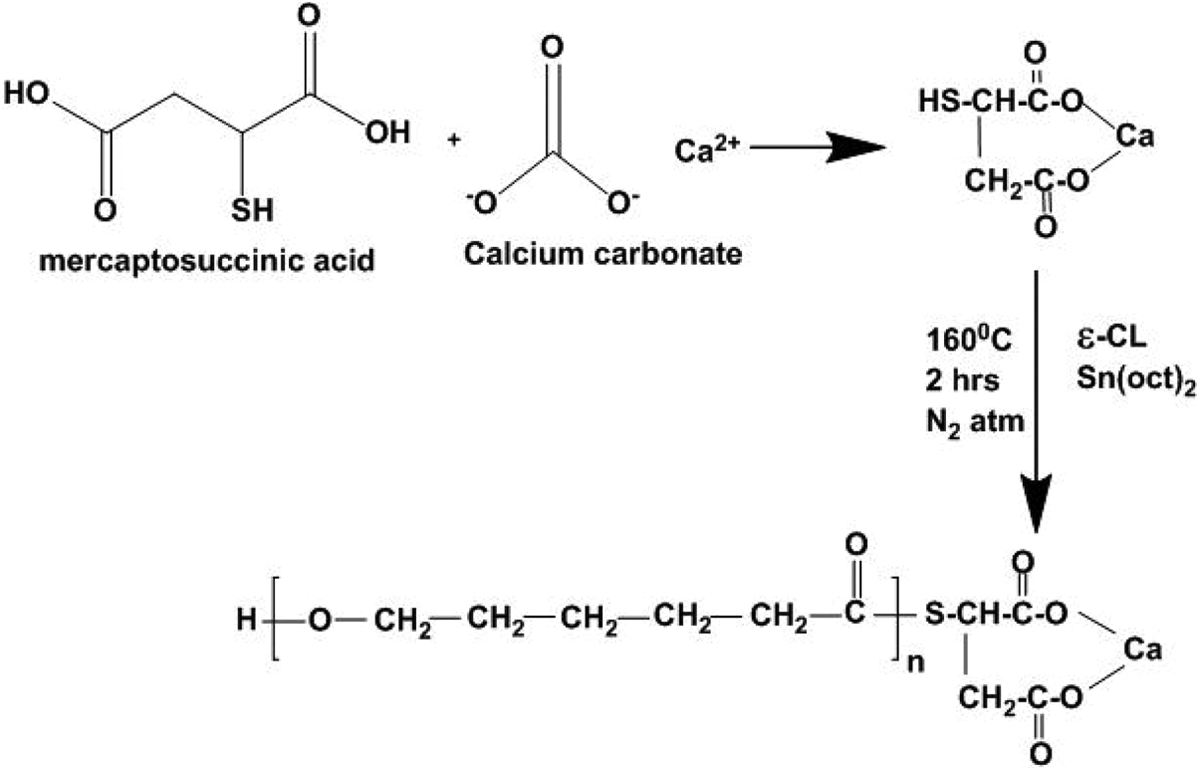
Synthesis of Ca-MSA end capped PCL. Ca: calcium; MSA: mercaptosuccinic acid.
ROP of ∊-CL by Ca-MSA
One gram of ∊-CL was weighed accurately and taken into a 25 mL capacity round-bottomed (RB) flask. Then, 0.001 g of Sn(oct)2 was injected into RB flask. Along with it, a required amount of Ca-MSA was added as an initiator. The RB flask was transferred to an oil bath, maintained at 160°C. 11 –13 The polymerization reaction was carried at various [M/I] ratios such as 10, 50, 100, 200 and 400 at constant Monomer to Catalyst Ratio ([M/C]) ratio. The [M/C] ratio was maintained at 1000. The reactions were continued for 2 h under N2 atmosphere. At the end of the reaction, highly viscous liquid was obtained. This indicates the polymer formation. The RB flask was removed from the oil bath and cooled. After cooling, the viscous solution was dissolved using CHCl3 as a solvent. Again the solution was reprecipitated using 300 mL of diethyl ether. After drying, a white coloured precipitate was obtained. The precipitate is PCL-Ca/MSA nanocomposite. Thus obtained PCL-Ca/MSA nanocomposite was weighed and stored in a zipper lock cover.
Characterization of the sample
Ultraviolet (UV)–visible (Vis) spectrum was measured using Shimadzu 3600 near infrared spectrophotometer (Japan). A Waters 2690 GPC instrument (Milford, Massachusetts, USA) was used to determine the weight average molecular weight (M w) of the polymer samples using tetrahydrofuran as an eluent at room temperature (RT) at the flow rate of 1 mL min− 1 against polystyrene standards. Fourier transform infrared spectroscopy (FTIR) spectra were recorded with the help of Shimadzu 8400 S (Japan) model instrument by potassium bromide (KBr) pelletization method from 400–4000 cm−1. 3 mg of copolymer was ground with 200 mg of spectral grade KBr and made into a disk under the pressure of 7 tons. The melting temperature (T m) of the polymer samples was determined using Dupont Thermal Analyst 2000 differential scanning calorimeter 910S (Wilmington, Delaware, USA). All the measurements were done under N2 atmosphere in a temperature range from RT to 100°C with 10°C min−1 heating rate. Thermal stability of polymer was measured by Dupont 951 thermogravimetric analyzer (Wilmington, Delaware, USA). Thermograms were recorded in air atmosphere in a temperature range from 30°C to 800°C at the heating rate of 10°C min−1. Proton and carbon-13 nuclear magnetic resonance (NMR) spectra of the polymer samples were recorded using Bruker Biospin High Resolution Digital 300 MHz NMR spectrometer (Billerica, Massachusetts, USA). Deuterated CHCl3 was used as the solvent and tetramethyl silane served as an internal standard. The surface morphology of the sample was measured by JSM 6300 scanning electron microscope (Jeol, Tokyo, Japan). Field-emission SEM with energy-dispersive X-ray (EDX) spectroscopy was used to examine the morphological behaviour of polymer with the help of field-emission scanning electron microscope (Hitachi S4800; Japan).
From the UV-absorption spectrum, the direct band gap was calculated for the above synthesized samples. The direct band gap of the material obeys the following relation:
Direct band gap energy:

where, α is absorption coefficient, E g is optical band gap of the material, A is constant, h is Planck’s constant and ν is the frequency.
Using the band gap values, the number of C-atoms in carbonaceous clusters (M) was determined. The M values are calculated using the relation:
where, E g is optical band gap of the material.
Results and discussion
FTIR study
Figure 2(a) indicates the FTIR spectrum of Ca-MSA system. The –OH stretching of the hybrid is observed at 3379 cm−1. The C–H symmetric and antisymmetric stretching was noted at 2909 cm−1 and 2951 cm−1, respectively. A peak at 1542 cm−1 is ascribed to be the bending vibration of free –OH group. The C–O–C linkage of hybrid is observed at 1260 cm−1. The –CH out-of-plane bending vibration (OPBV) can be seen at 682 cm−1. The M–O stretching appeared as a twin peak around 570 cm−1. 31 The C–S stretching of MSA appeared at 1410 cm−1 as a doublet peak. The C–H wagging appeared at 874 cm−1. Thus, the FTIR spectrum confirms the functional groups present in the hybrid system.
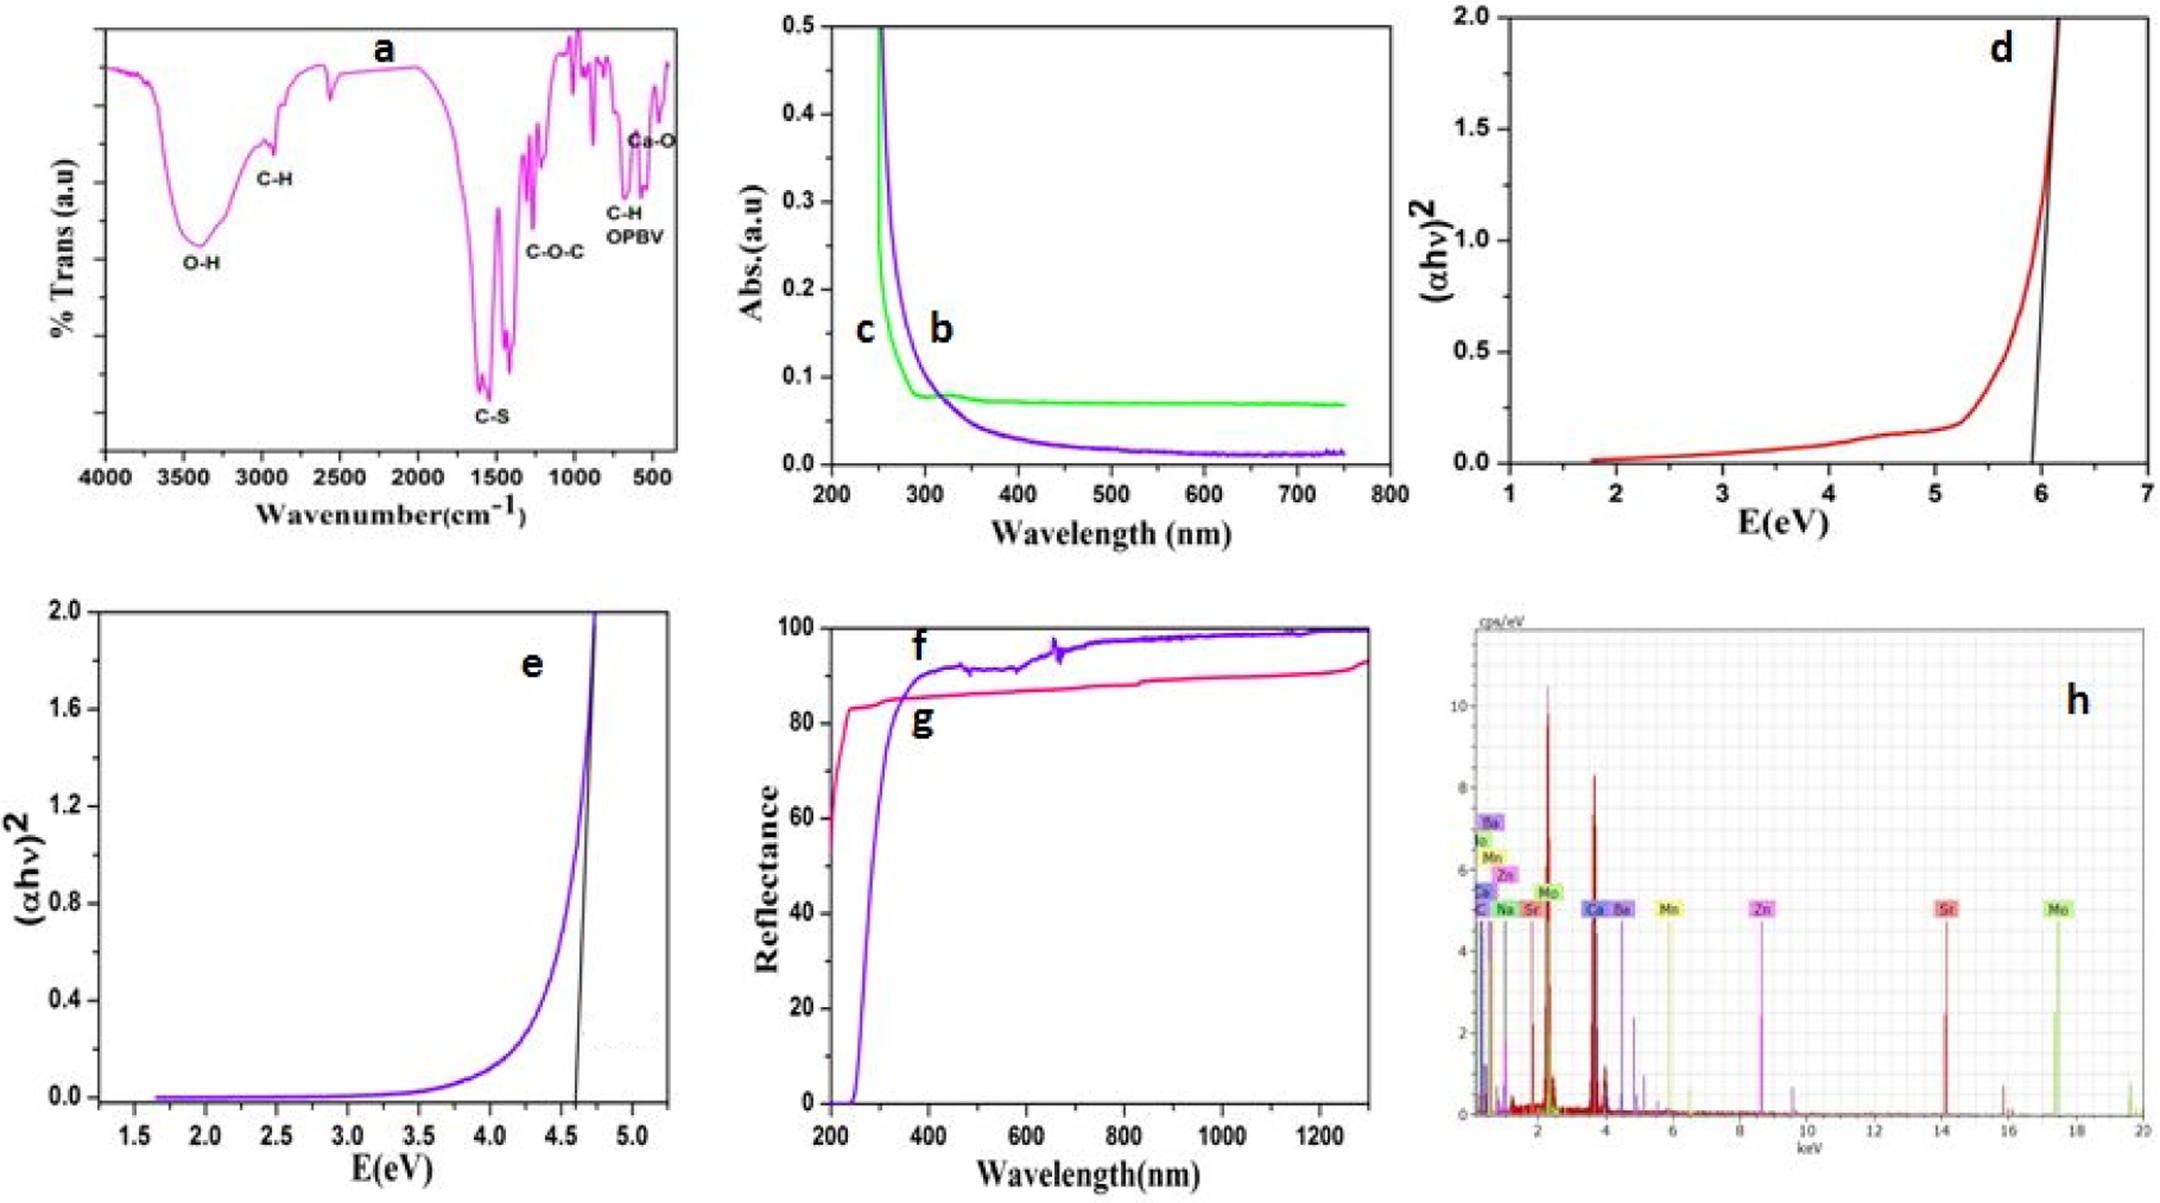
(a) FTIR spectrum of Ca-MSA, (b) UV-Vis spectrum of CaCO3, (c) UV-Vis spectrum of Ca-MSA, (d) band gap of CaCO3, (e) band gap of Ca-MSA, (f) reflectance spectrum of CaCO3, (g) reflectance spectrum of Ca-MSA and (h) EDX spectra of Ca-MSA. FTIR: Fourier transform infrared; Ca: calcium; MSA: mercaptosuccinic acid; UV-Vis: ultraviolet–visible; CaCO3: calcium carbonate; EDX: energy-dispersive X-ray.
UV-Vis, band gap and EDX of Ca-MSA
Figure 2(b) and (c) indicates the UV-Vis absorbance spectrum of CaCO3 and its hybrid, respectively. From the absorption spectrum, the band gap value of Ca was calculated by Tauc’s plot. Tauc’s plot for pristine CaCO3 is shown in Figure 2(d) with the band gap value of 5.92 eV. This confirms the semiconducting nature of CaCO3. Figure 2(e) represents Tauc’s plot for hybrid system with a band gap value of 4.59 eV. On comparison, the hybrid system exhibited the lower E g value due to surface functionalization reaction or due to the formation of Ca-MSA hybrid. The decrease in band gap informs the decrease in inter atomic distances and the perfect crystalline nature of the hybrid system. This is in accordance with our earlier communication. 31
The UV-Vis reflectance spectrum of CaCO3 and its hybrid is shown in Figure 2(f) and (g), respectively. The pristine CaCO3 exhibited the highest reflectance value but after hybrid formation the reflectance value was slightly reduced to 90. The reflectance value indirectly gives an idea about the hydrophobic nature of the material. 31 In the present investigation, after the hybrid formation, the hydrophobic character was reduced due to the availability of more H-bonding groups available in the hybrid system.
Figure 2(h) represents the EDX spectrum of the hybrid system. From the EDX, the percentage content of Ca was calculated as 10.39. The percentage content of C and O was determined as 33.22% and 50.63%, respectively. The remaining is due to the presence of other metal ions.
Particle size analysis
Figure 3 indicates the particle size analysis (PSA) spectrum of the hybrid system. The size of the hybrid is varied between 120 nm and 1100 nm. This is due to two reasons: the first one is the MSA contains two carboxyl and one thiol group. The thiol group can reduce the Ca2+ into Ca0 and further surface with the Ca nanoparticle. The mild reduction reaction leads to the formation of Ca nanoparticle of very small size. The second possibility is the metal salt formation, that is, the simple acid–base titration reaction. The two carboxyl group from MSA can interact with the Ca2+ and form its corresponding salt. The salt formation leads to the particle with the bigger size. Hence, the PSA confirms that during the hybrid formation both mild reduction and salt formation had occurred simultaneously. In 2014, Kannammal et al. 31 studied about the particle size of strontium-MSA. The result of the present investigation matches with the literature report.
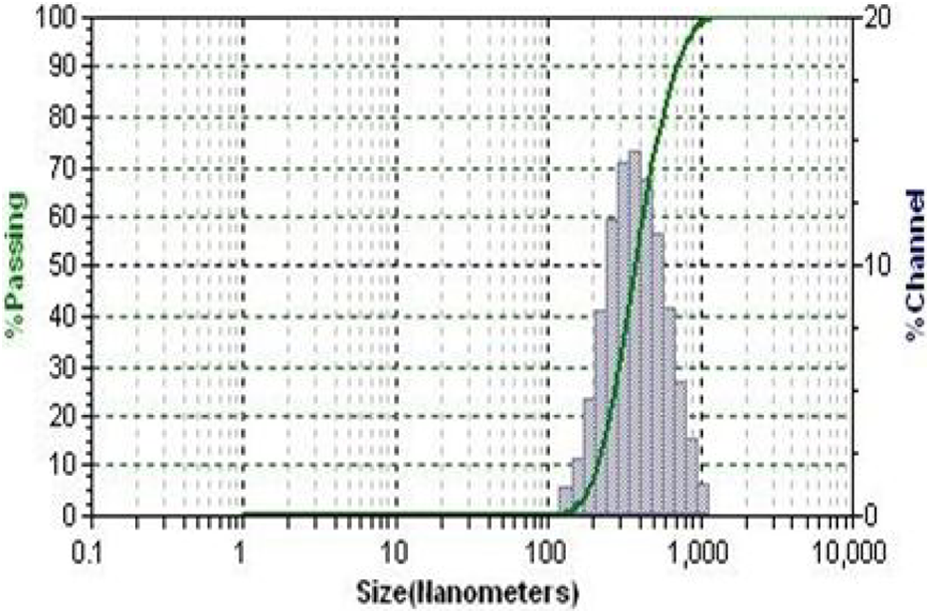
PSA of Ca-MSA. PSA: particle size analysis; Ca: calcium; MSA: mercaptosuccinic acid.
UV-Vis and band gap of PCL
The UV-Vis absorbance spectrum of PCL synthesized at [M/I] ratio is given in Figure 4(a) to (e). From the absorbance data the band gap energy of Ca-MSA was calculated using Tauc’s plot. Figure 5(a) to (e) represents the Tauc’s plot of PCL/Ca-MSA that was synthesized at [M/I] ratio of 10, 50, 100, 200 and 400, respectively. It was very interesting to note that the band gap energy was increased with the increase of [M/I] ratio (Figure 5(f)). The increase in band gap energy with the increase of [M/I] ratio can be explained as follows: (i) while increasing the [M/I] ratio, the concentration of Ca-MSA was proportionally decreased. (ii) The decrease in initiator species ultimately increases the molecular weight of PCL 31 (the gel permeation chromatography (GPC) results will be discussed in the forthcoming session.) (iii) While increasing the molecular weight of PCL, the chain length of PCL is also increased. The increase in chain length leads to the formation of more and more coil-like structure. (iv) The empty space between the coils or voids can be filled by the Ca-MSA. This leads to the encapsulation of Ca by the PCL chains.
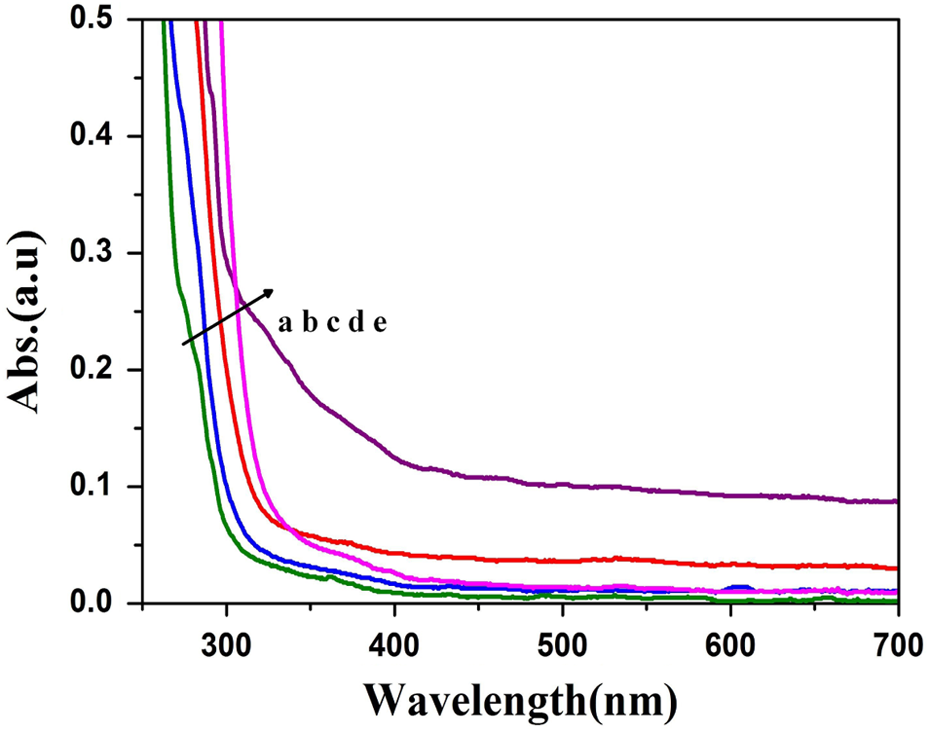
UV-Vis absorption spectrum of PCL synthesized at the [M/I] of (a) 10, (b) 50, (c) 100, (d) 200 and (e) 400. UV-Vis: ultraviolet–visible.
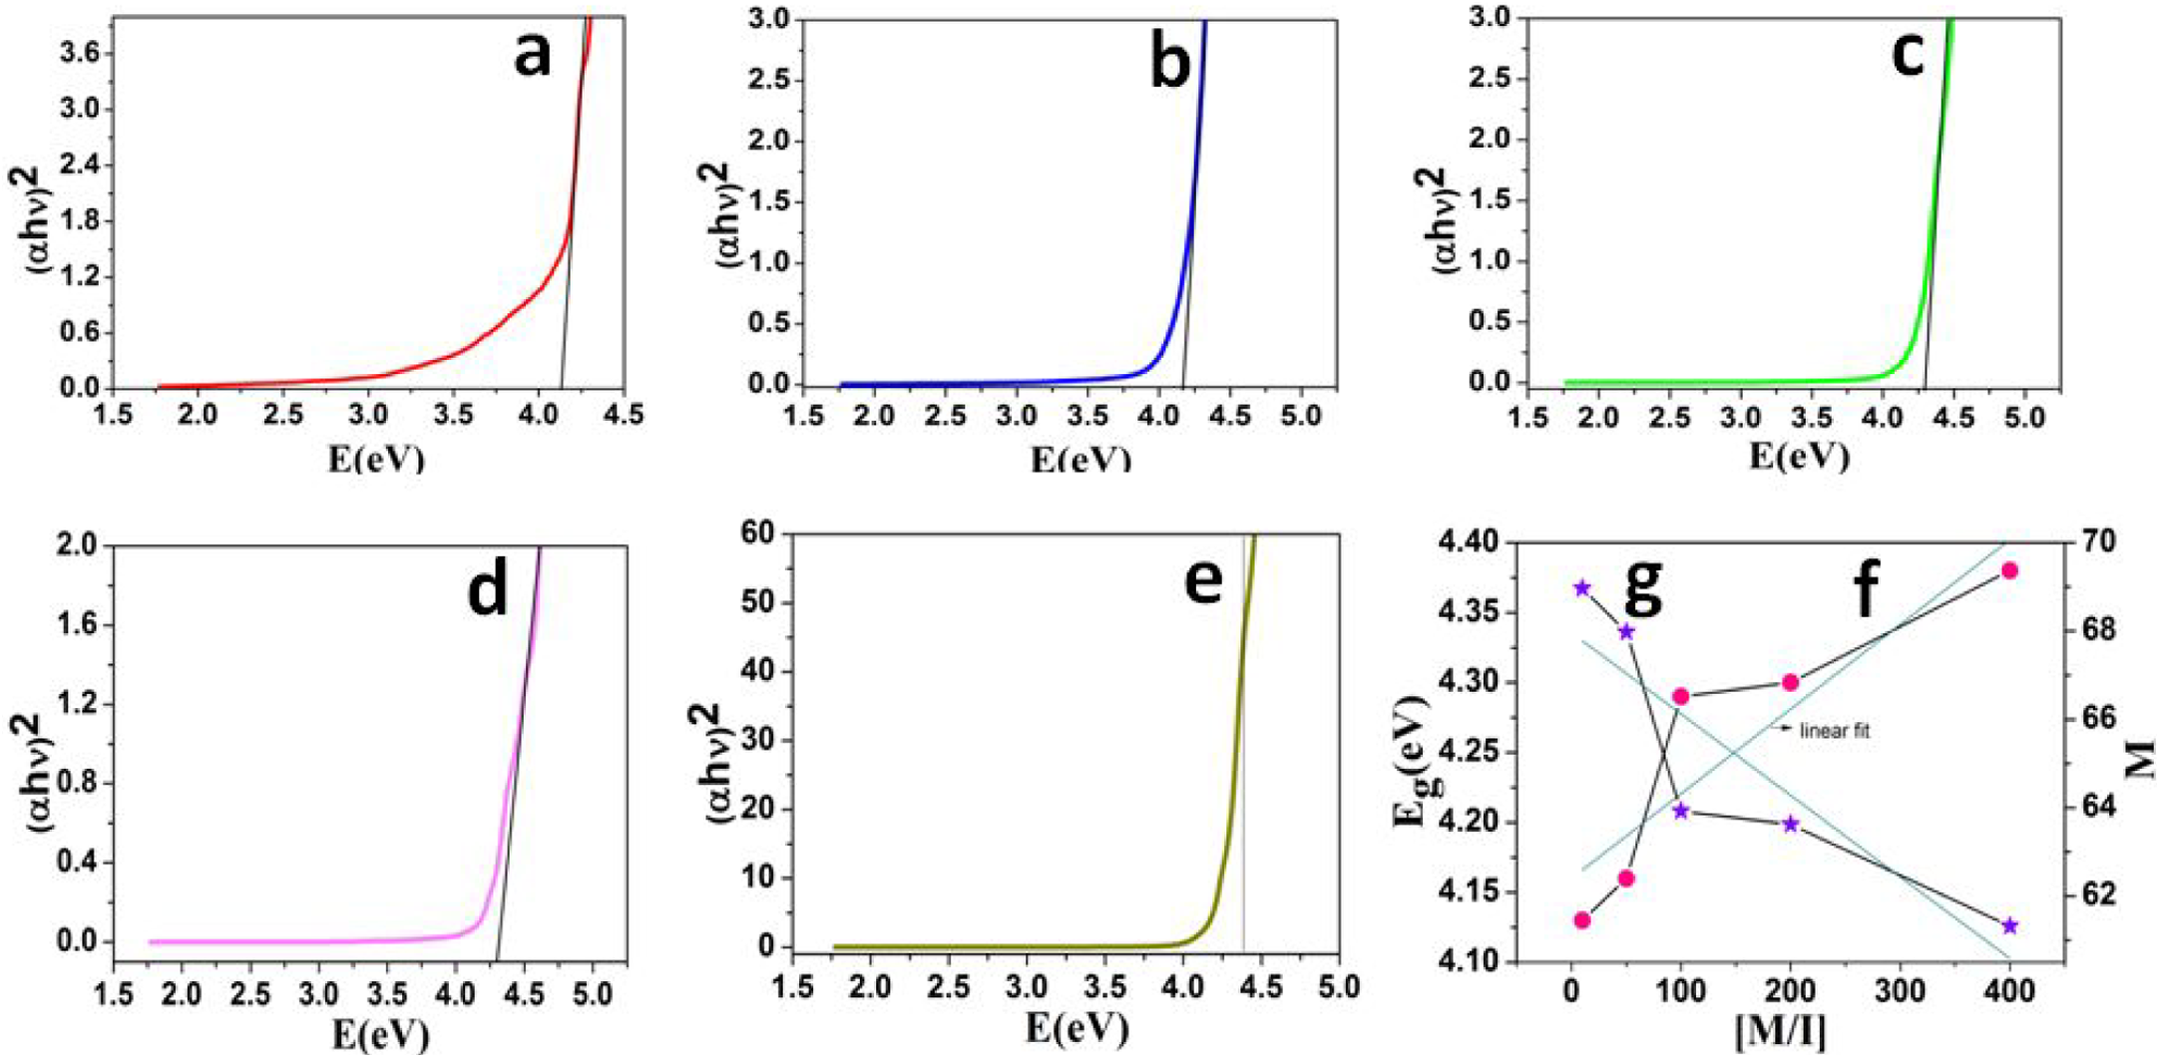
Tauc’s plot of PCL synthesized at the [M/I] ratio of (a) 10, (b) 50, (c) 100, (d) 200, (e) 400, (f) the plot of [M/I] vs. E g and (g) the plot of [M/I] vs. M.
As a result of decrease in concentration of Ca-MSA and encapsulation effect, the band gap energy was increased. The increase in band gap occurs while increasing the [M/I] ratio, it was further supported by determining the number of C atoms from the Ca-MSA clusters. The plot of [M/I] versus M (Figure 5(g)) was found to be a straight line with a decreasing trend. The plot indicates that while decreasing the initiator concentration, the number of carbon atoms from the Ca-MSA was found to be decreased. It means, during in situ polymerization reaction at 160°C leads to the breaking of Ca-MSA clusters. Moreover, the increase in number of voids or coils isolated the Ca-MSA from each other. Finally, the decrease in number of C atoms from the Ca-MSA clusters leads to the increase of band gap energy while increasing the [M/I] ratio.
GPC analysis
It was proposed that while increasing the [M/I] ratio, the molecular weight of PCL was increased accordingly. This concept can be scientifically proved by GPC measurements. The GPC images of PCL explains that while increasing the [M/I] ratio the M w of the polymer is increased (Figure 6(a) to (e)). Table 1 indicates that while increasing the [M/I] ratio both M w and number-average molecular weight (M n) were increased linearly. Again the increase in M w was due to the decrease in concentration of Ca-MSA. The polydispersity values proved that the Ca-MSA is a good initiator for the ROP of ∊-CL because of the absence of cross-linking or branching reaction. Thus, the GPC data supported the band gap and M values. In 2014, Sivabalan et al. 30 reported the effect of different functional initiators on the GPC of PCL. Recently, Meenarathi and research team 12 also studied about the GPC of PCL while increasing the [M/I]. Our result is coincides with their reports.
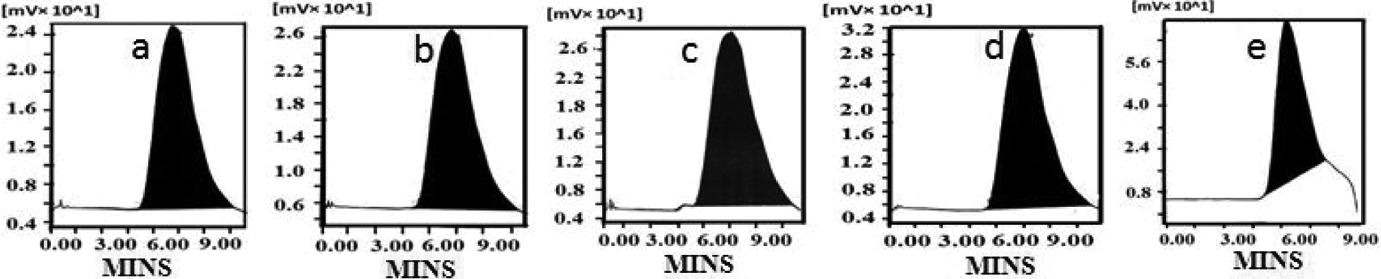
GPC of PCL synthesized at various [M/I] ratios of (a) 10, (b) 50, (c) 100, (d) 200 and (e) 400. GPC: gel permeation chromatography.
Effect of [M/I] ratio on the GPC, DSC, TGA and E g of PCL.
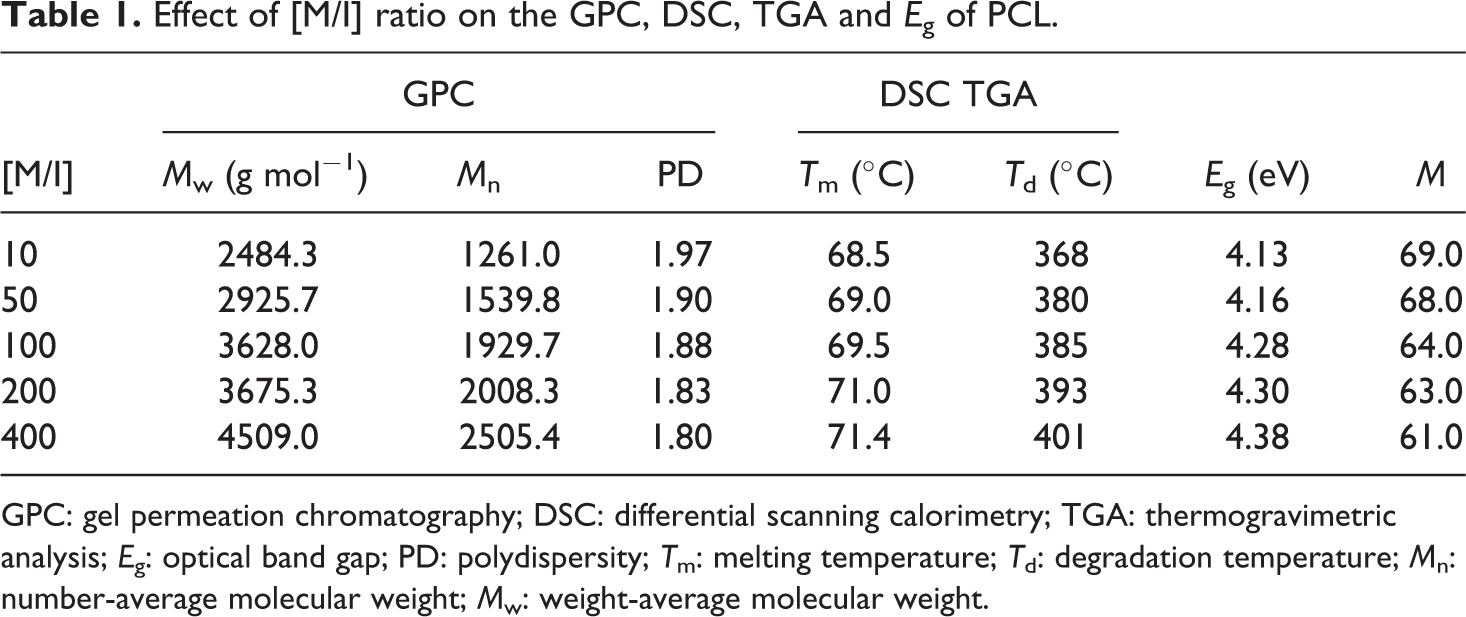
GPC: gel permeation chromatography; DSC: differential scanning calorimetry; TGA: thermogravimetric analysis; E g: optical band gap; PD: polydispersity; T m: melting temperature; T d: degradation temperature; M n: number-average molecular weight; M w: weight-average molecular weight.
Thermal studies
While increasing the [M/I] ratio, the initiator system not only broadened the band gap energy but also increased the thermal stability of the PCL. Figure 7(a) to (e) indicates the differential scanning calorimetry (DSC) heating scan of PCL synthesized at various [M/I] ratios. It was found that while increasing the [M/I] ratio the T m of PCL was varied between 68.5 and 71.4°C. It means, the added Ca-MSA increases the T m of PCL by acting as filler. This proved that the Ca-MSA initiator can increase the T m of PCL via increasing the polymer chain length, that is, increasing the molecular weight of PCL. 11 –13
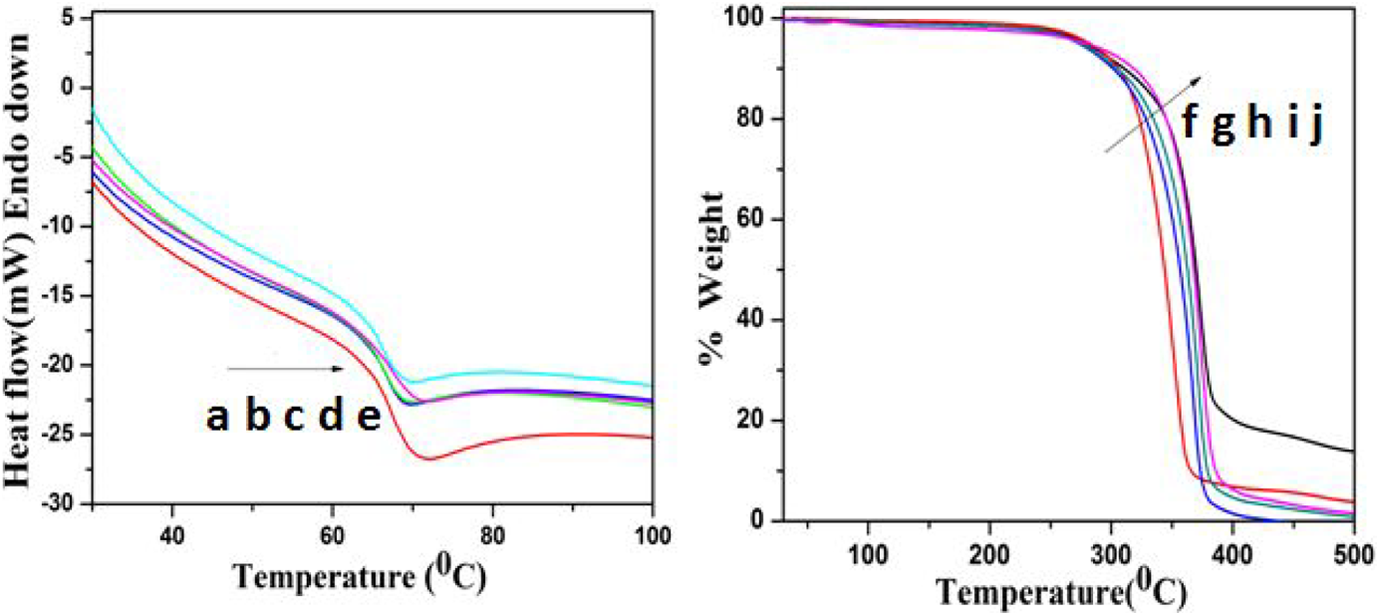
DSC of PCL synthesized at various [M/I] ratios of (a) 10, (b) 50, (c) 100, (d) 200 and (e) 400 and TGA of PCL synthesized at various [M/I] ratios of (f)10, (g) 50, (h) 100, (i) 200 and (j) 400. DSC: differential scanning calorimetry; TGA: thermogravimetric analysis.
Next, we would like to test the effect of concentration of Ca-MSA on the degradation temperature (T d) of PCL (Figure 7(f) to (j)). The thermogram exhibits a single-step degradation process. The major weight loss around 375°C is due to the degradation of PCL backbone. 13,19,26 The TGA thermogram pinpoints that while increasing the [M/I] ratio, the thermal degradation temperature is also slightly shifted to higher temperature, when [M/I] = 400. The percentage of weight residue remained above 450°C increased, which was calculated as greater than 15%. Both the DSC and TGA thermal studies reported that while increasing the [M/I] ratio, the T m and T d were increased. The DSC and TGA results also indirectly co-supported the band gap value.
Surface morphology
The PCL exhibits its own surface morphology as broken stone in general. 12 In the present investigation, the surface morphology of PCL is entirely different. The stone like morphology did not appear, instead it led to some other morphology with micro voids and the dispersion of Ca-MSA on the surface of PCL (Figure 8(a)). This authenticated that the surface morphology of a polymer can be altered by an initiator.
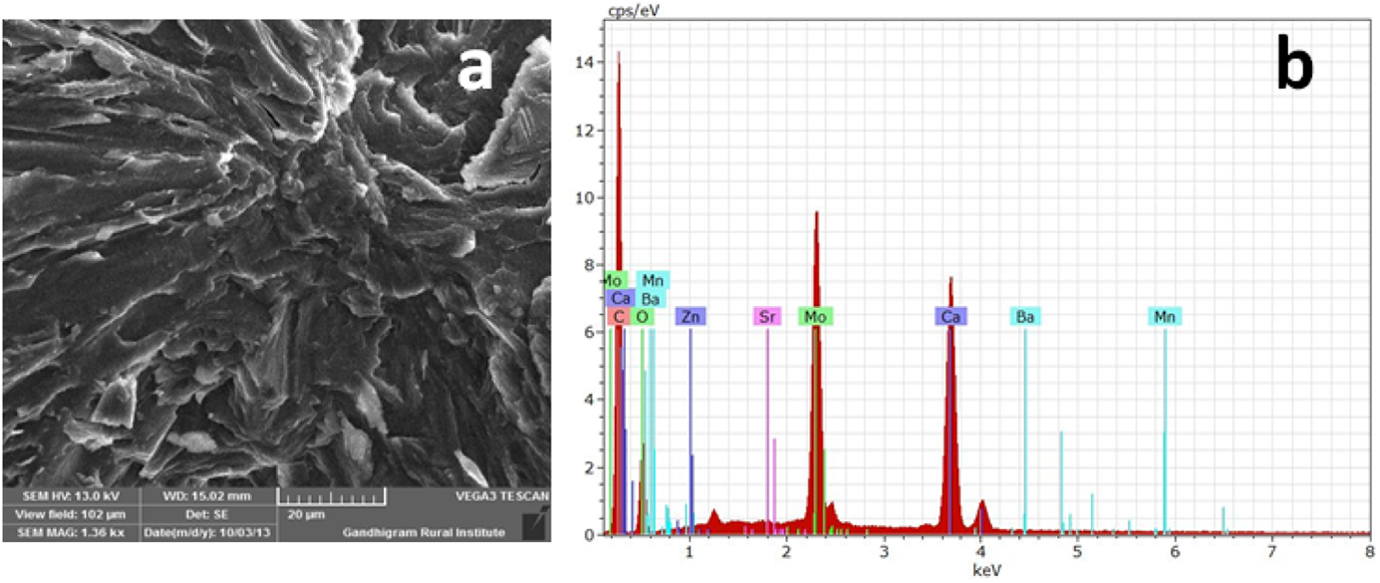
(a) SEM of PCL/Ca-MSA nanocomposite and (b) EDX of PCL/Ca-MSA nanocomposite. SEM: scanning electron microscopy; Ca: calcium; MSA: mercaptosuccinic acid.
Energy-dispersive X-ray spectroscopy
The presence of Ca-MSA on the PCL surface was confirmed by EDX. Figure 8(b) indicates the EDX spectrum of PCL/Ca-MSA nanocomposite system. The percentage of carbon, oxygen and Ca were calculated as 73.49%, 23.34% and 1.98%, respectively. The decrease in Ca content supported the [M/I] = 100. The percentage of Ca present in the Ca-MSA is somewhat greater than that of the polymer nanocomposite.
Conclusions
From the above physicochemical studies, niche points are summarized here as a conclusion. The FTIR spectrum confirmed the presence of C=O and C–H OPBV stretching in hybrid system. The UV-Vis reflectance value of the hybrid system exhibited the hydrophobic nature of metal salt. After the structural modification the band gap energy of Ca was exhibited the lower value. The ring opening nature of Ca salt was confirmed by varying the [M/I] ratio and corresponding M w were increased. Tauc’s plot confirmed that the band gap energy increases with the increase in molecular weight of PCL.
Footnotes
Acknowledgement
We express our sincere thanks to Mrs G Vijayalakshmi, Assistant Professor, Department of English, for her valuable help during this manuscript preparation.
Declaration of Conflicting Interests
The author(s) declared no potential conflicts of interest with respect to the research, authorship, and/or publication of this article.
Funding
The author(s) received no financial support for the research, authorship, and/or publication of this article.