
Abstract
This study reports the results of experimental and numerical investigations on the thermophysical properties and the process of melting of a phase-change composite material. The proposed phase-change composite material based on epoxy resin with spherical shape paraffin wax (RT27) was used as a new thermal storage system. Thermal characterization was performed using a transient guarded hot plate technique. The results revealed the importance of thermal storage by latent heat. The numerical analysis is realized using numerical COMSOL® Multiphysics 4.3b. The effect of various parameters of the numerical solution on the results is examined: in particular, the term describing the mushy zone in the momentum equation and the influence of temperature melting range. The findings of the experimental investigation compare favorably with the numerical results.
Keywords
Introduction
The building sector is one of major energy consumers and its contribution toward global energy consumption is about 40%. 1 –3 Due to the accelerate climate changes combined with the continuous increase in the level of greenhouse gas emissions and the climb in fuel prices, the growing trend of energy use in buildings might be continuously experienced in the future. Therefore, improving energy efficiency and conservation in buildings is becoming one of main issues of concern to governments and societies today. Economists, scientists, and engineers throughout the world are in search of (1) strategies to reduce the demand, (2) methods to ensure the security of the supplies, (3) technologies to increase the energy efficiency of power systems, and (4) new and renewable sources of energy to replace the limited and harmful fossil. 4 Among them, the use of thermal energy storage (TES) systems is received increasing interest, which has been recognized as one of effective approaches to reducing the mismatch between supply and demand. Thermal energy can be stored as a change in internal energy of a material as sensible heat, latent heat, and thermochemical or combination of all these. 5 Recently, the latent heat thermal energy storage (LHTES) system using phase-change materials (PCMs) has gained greater attention concern for building applications due to its ability to provide high-energy storage density and the characteristics to store thermal energy at relatively constant temperatures. 6,7 PCMs are substances with a high heat of fusion that are capable of storing or releasing large amounts of energy by melting and solidifying at certain temperatures. 8 They can be used for thermal regulation in buildings and have been recognized as ideal thermal storage materials that can be integrated in plaster, gypsum, concrete, or other construction materials. 9 Many kinds of inorganic and organic PCMs and their mixtures have been investigated as LHTES materials. 10 –12 So far, among the investigated PCMs, paraffin was found as the most useful PCM for thermal storage at low temperature thanks to its great latent heat, excellent thermal and chemical stability, and small vapor pressure 13 ; however, paraffin shows a low thermal conductivity (0.21–0.24 W m−1 K −1). 14 Several methods have been developed to enhance thermal conductivity of PCM. These different techniques presented in literature contain dispersing high conductivity particles within the PCM, inserting a metallic matrix, adding chunks of metal tubing into the PCM, and impregnating a porous graphite matrix with PCM. 15,16 An attractive technique is to integrate PCMs inside cavities which could exist in construction components. This is the case of hollow bricks, although several studies have established such a method useful to increase thermal inertia of buildings. 17,18 For characterization of thermal properties of PCMs, differential scanning calorimetry (DSC) is commonly utilized. 19,20 Nonetheless, DSC method gives information about thermal properties in micro-sized samples. For investigation, PCM in real conditions is indispensable to propose experimental device in order to get information about thermal properties of sample in large size. Trigui et al. 21 developed a consistent method for testing PCM materials at long-term performance in large-sized samples. They describe the first store built with the composite material developed to improve different properties of PCM such as information about latent heat, storage and release energy, heat capacity, and thermal conductivity. Their unique method for thermal investigation of PCM was used for resin epoxy/paraffin wax of spherical geometry and epoxy resin/metal tubes filled with paraffin 21 as well as for LDPE/paraffin wax composites at different concentration of paraffin wax. 22 Therefore, Karkri et al. developed a new construction materials with high TES capacity for use in high-comfort constructive systems using Plaster/Micronal® at different percentage of Micronal. 23 In TES system, a spherical container presents a considerable challenge. This is mainly due to its low volume to heat transfer surface area ratio. 24 Spherical shape is chosen because it can be easily packed into the storage system. The melting and freezing process has been investigated in various geometrical configurations 25,26 such as slab, cylinder, and sphere. Generally, melting in cylindrical and/or spherical containers can be classified two categories 27,28 : constrained and unconstrained. In constrained melting (also known as inward, fixed or centered), the solid phase is prevented from movement due to gravity and thus it is completely surrounded by the liquid melt at all times and it is independent on the density difference between the solid and liquid phases. In effect, there is no direct contact melting next to the wall of the container. Conversely, in unconstrained melting, the solid phase is free to move in unconstrained melting either downward or upward (depending on the density difference between the solid and liquid phases) and it encountered when there is no anchor inside the capsule for the solid PCM to cling with the existence of difference in density between the liquid and solid phases.
Highlighting a key aspect connected to the present study, the research works developed by Tan et al. 29 improved the importance buoyancy-driven convection during constrained melting of PCM inside a spherical capsule experimentally and numerically. The computations were based on an iterative, finite-volume numerical procedure that incorporated a single-domain enthalpy formulation for simulation of the phase-change phenomenon. The results revealed that, during the early period, conductive heat transfer dominates, as evident by the near-spherical shape of the PCM. As buoyancy-driven convection was strengthened due to the increase of the melt zone, it was observed that melting in the upper half of the sphere is greatly faster than in the down half of the sphere. Due to unstable molten liquid layer that supports chaotic fluctuations, Waviness of the bottom surface of the PCM was also observed and high discrepancy between numerical and experimental readings of temperatures, while this discrepancy in relatively low in the stable fluid layer in the top region of the sphere. Kar et al. 30,31 reported a numerical study designed to the thermal performance of a PCM storage unit and the solidification process of PCM inside a spherical capsule. Kar et al. 32,33 conducted a numerical investigation to simulate melting around a horizontal circular cylinder in the presence of natural convection in the melt phase. A two-dimensional non-steady mathematical model was proposed to solve this problem. In spite of the numerous literature concerning the numerical simulation of the PCM melting process, a small number of numerical contributions consider the three natural convection effect occurring in the liquid phase that enhances heat transfer at the solid–liquid interface. Through comparison of reliable experimental data and numerical modeling, Aadmi et al. 34 studied the energy storage using a PCM. A new transient hot plate apparatus was used to measure the temperatures and heat fluxes in order to characterize the PCM influences. A-3-D COMSOL® Multiphysics software 4.3 was applied for the computation of the thermal behavior of the composite. An effective heat capacity method-based mathematical model was proposed to analyze PCM for latent storage. Prediction exhibited a very good agreement with experimental observations. Murray and Groulx 35 introduced a two-dimensional theoretical model using the COMSOL Multiphysics package (version 4.0a and 4.4) based on the effective heat capacity formulation to predict the melt fraction of PCM. Only conduction and convection heat transfer mode was considered inside the square enclosure containing octadecane as the PCM, even during the melting processes. At t = 0, The vertical walls were maintained at constant high and low temperatures while the other walls were insulated the effect of the melting temperature range utilized in the simulation was improved. Additionally, the impact of viscosity on the onset and strength of natural convection and the findings melting interface position was discussed. The results demonstrated the importance of accounting for natural convection during melting in a PCM.
Voller and Prakash 36 studied the effect of the constant C as the parameter that reflects the kinetic processes in the mushy zone on the melting process, using two different values: 1.6 × 10³ and 160 × 103. It was found that an increase in C caused diminution of the flow in the mushy zone. It was showed the importance of studying the relationship between the constant C and the morphology of the mushy zone. Among the accessible data, Brent et al. 37 and Pal and Joshi 38 utilize the value of C = 1.6 × 10⁶ whereas Tan and Fok 39 used C = 105. The last value was used also by Katsman. 40
In the present article, a detailed study on the thermal storage capacity of a parallelepiped PCM composite such as the “composite Trombe wall” for energy conservation in building, particularly in passive solar walls, is analyzed and discussed. As the overall purpose is to use a composite which does not flow when the PCM is the liquid state and we propose a novel PCM (RT27) which does not need any conditioning.
An experimental device consisting of flux metric measurement has been developed to provide the thermal performance of the composite. In addition, a DSC analysis was carried out. The experimental apparatus allows providing “apparent” thermal conductivities and heat storage capacities of the composite at the solid and liquid states and also a measurement of the latent heat of fusion. During the variation of the thermodynamic state samples, the quantity of energy exchanged could be calculated when the boundary temperatures vary. In this article, a mathematical model has been developed. The COMSOL Multiphysics 4.3b was applied for the computation of the thermal behavior of the composite. A comparison with the experimental results was made and several simulation runs were conducted to provide the heat storage during the melting.
Experimental study
Sample preparation
The present work employs the use of organic paraffin as the PCM. Paraffin waxes can be good PCMs because of their desirable characteristics such as a high latent heat of fusion, negligible supercooling, low vapor pressure in the melt, chemical inertness, and stability. 11 The paraffin wax (RT27) was purchased from Rubitherm GmbH (Germany) with an average melting point of 26°C. 42 This melting point was judged to be reasonable for use in an interior building envelope.
The first step is to fabricate a calibrated spherical shape based on a commercial paraffin wax RT27 using a specific mold, see Figure 1(a). Paraffin is injected in liquid state under constant pressure on the center of each shell with special syringes. After filling, the cooling and shrinkage compensation (approximately 10%) of the paraffin spheres are performed. The second step was to place these paraffin spheres in a mold (200 × 200 mm2) with a controlled distribution keeping a distance of 2 mm between each surrounding spheres (Figure 1(b)). The resin (Araldite_ LY5052/Aradur_ 5052) was then injected in the center of the upper wall of the mold at room temperature and under constant pressure to impregnate these paraffin spheres. Finally, the sample is pressurized in the mold and the injection of an excess of material will be introduced to compensate the shrinkage, as shown in Figure 1(c).
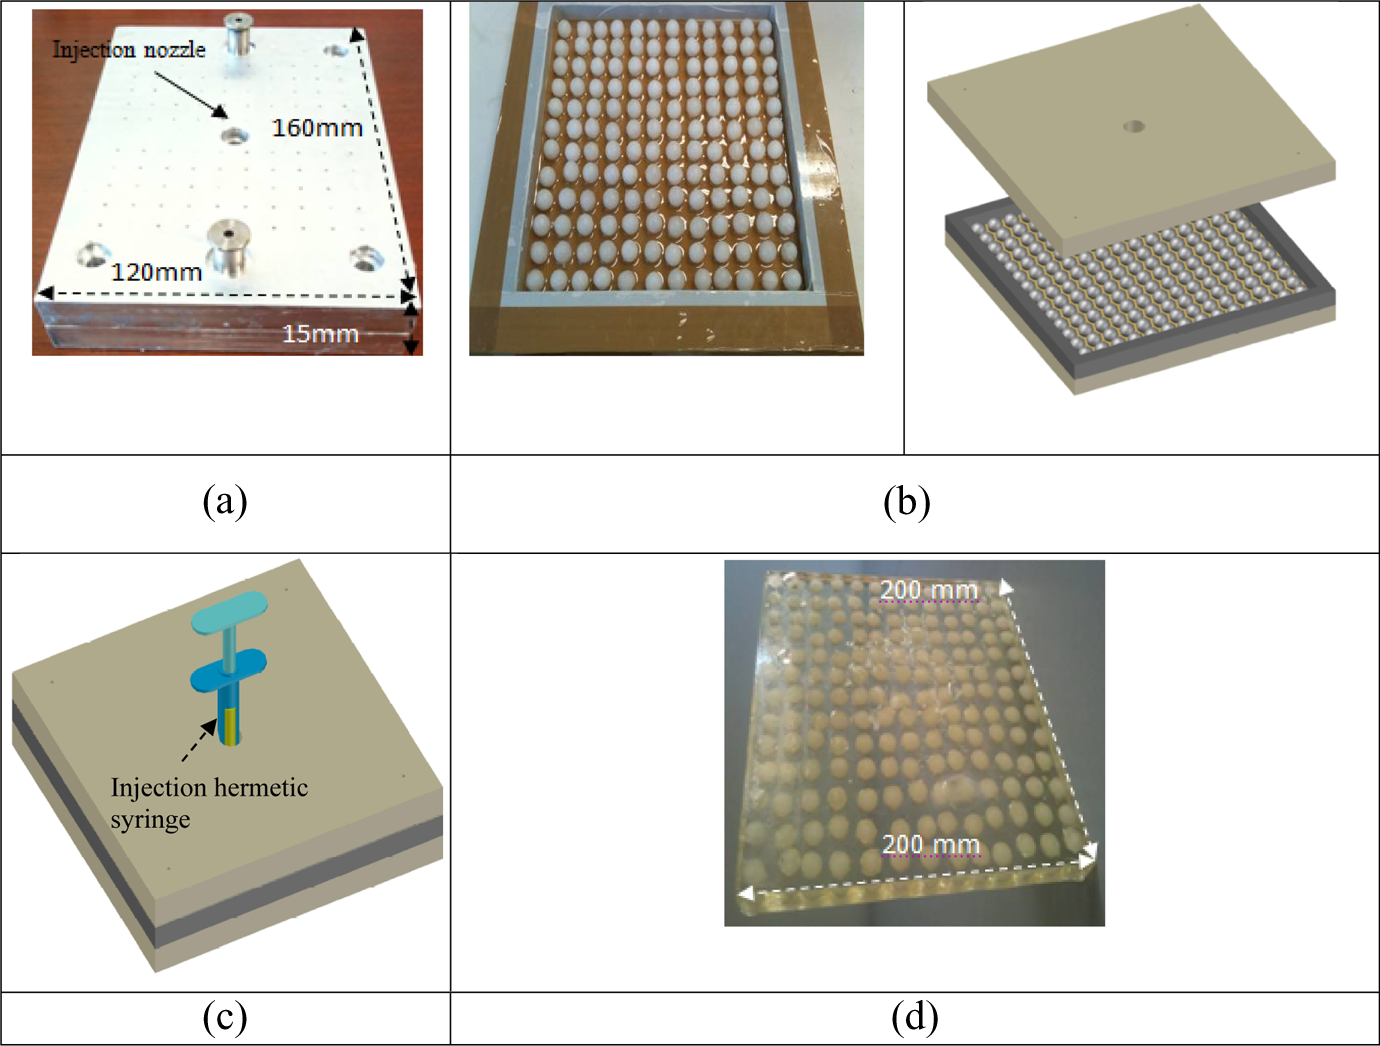
Manufacturing of Epoxy resin/paraffin spheres composite: (a) Mold for the manufacture of paraffin spherical shape, (b) Positions of spherical paraffin shape into a mold, (c) Process of injection, (depoxy resin + paraffin spherical shape.
The sample to be characterized (Figure 1 (d)) has a mass of 762 g, 200 × 200 × 17.4 mm3 of dimensions, and 1094.83 kg m−3 of density. The amount of paraffin (RT 27) introduced in the matrix is 110.33 g. Figure 1(d) shows a sample with paraffin spheres of 12 mm of diameters.
Transient guarded hot plate technique
From a thermal viewpoint, a wide variety of thermophysical characterizing methods are available. For PCMs, classical calorimetry methods, such as DSC and differential thermal analysis can be used; however, these techniques can only be applied to very small quantities of products (some milligrams). 13 –19
When evaluating material performance on a commercial scale, a test method that accommodates a larger sample region should be used that may provide additional information regarding long-term product stability. During long-term performance testing, large PCM specimens often settle or stratify and are typically not perfectly homogeneous, especially after undergoing multiple freezing/melting cycles. Therefore, it is necessary to use noninvasive methods to determine the heat of fusion and specific heat of large samples.
In this work, a transient guarded hot plate technique (TGHPT) based on the measurement of the temperature variations and heat flux exchanged during heating and cooling is proposed for the determination of the heat storage capacities and apparent thermal conductivities of the (epoxy resin/paraffin spheres) in the solid and liquid states. It also allows the determination of the melting latent heat.
21,22,41,43
A schematic drawing of the experimental setup is presented in Figure 2. A parallelepiped-shaped sample is positioned between two horizontal heat exchanger plates of aluminum linked to thermo-regulated baths that allow a fine regulation of the injected oil temperature with a precision of about 0.1°C. The lateral sides of the studied samples are insulated by 11-mm thick polystyrene-expanded foam, which creates an insulating ring around the sample and minimizes the heat transfer to the external ambient conditions. In order to measure heat flux
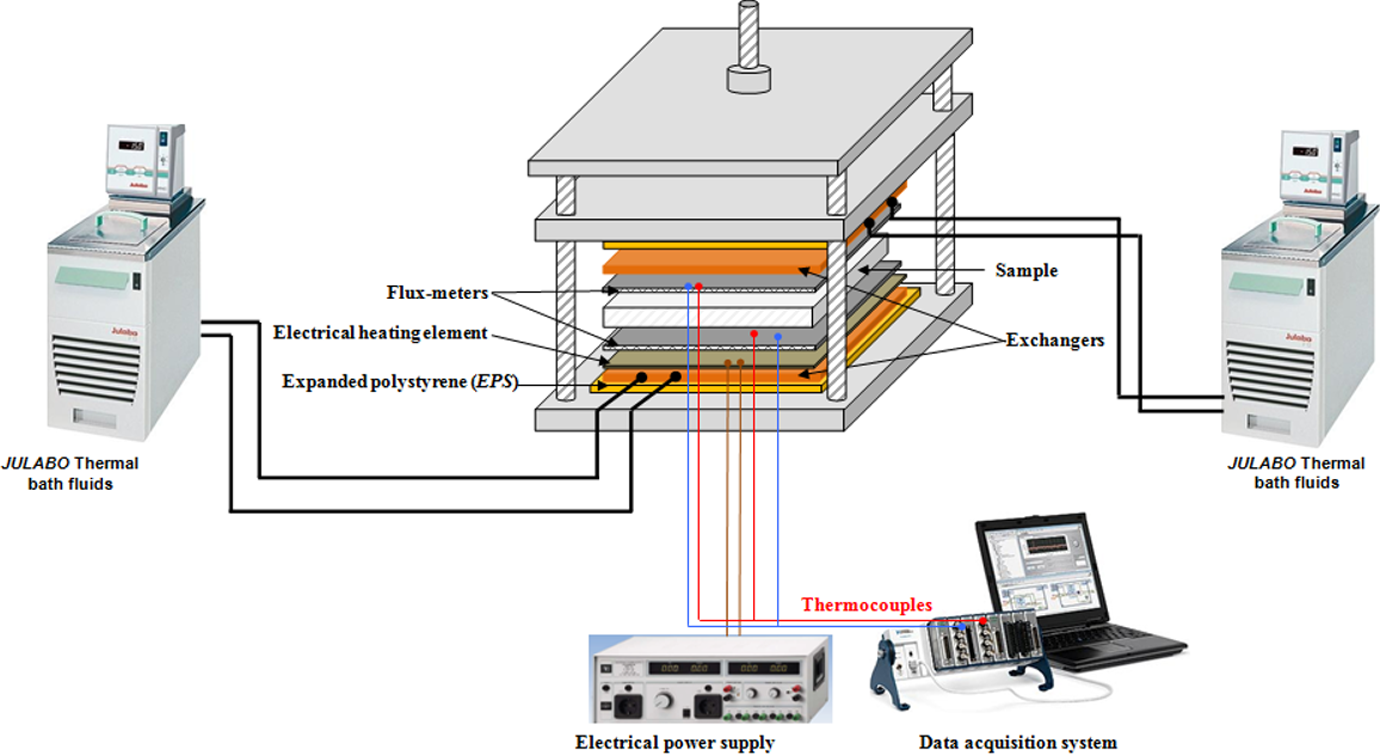
Transient Guarded Hot Plate Technique (TGHPT).
Result and discussion
Thermal analysis of paraffin wax DSC
A PerkinElmer Diamond DSC differential scanning calorimeter (Waltham, Massachusetts, USA) with an intra-cooler was used to measure the thermophysical properties of the PCM (RT27). It was calibrated in temperature and enthalpy with indium, tin, and benzyl and calibrated in heat capacity (C p) with a sapphire sample. To measure phase-change temperatures and enthalpies, samples were sealed in non-hermetic aluminum pans with lids. To perform heat capacity measurements, samples have not been sealed. The weight of each sample was in the range from 5 up to 20 mg. In the present study, the DSC instrument is used to measure the melting temperature and fusion heat properties of the PCM through a thermal cycle of cooling to heating.
The DSC provides qualitative information on endothermic/heat absorption (e.g. melting) and exothermic/heat releasing (e.g. solidification or fusion) processes of materials as shown in the Figure 3. In this figure, the positive flow represents the heat absorbed by the RT27 paraffin during melting, whereas the negative heat flow represents the heat released during solidification. One can observe that melting occurs within a large range of temperature because of the composition of the paraffin. It is composed of a mixture of solid saturated hydrocarbons with the following molecular formula: 4% C17H32, 36% C19H36, 45% C18H34, 12% C20H38, 2% C21H40, and 1% other alkanes). This result is in a good agreement with the study of He et al. and Laurent Royon et al., 44,45 which have revealed that paraffin mixtures freeze and melt within a temperature range and not at a constant temperature. In DSC curves of endothermic/heat absorption (e.g. melting) it is seen that exist two peaks, the larger peak is due to solid–liquid phase change and the smaller peak is due to solid–solid phase transition. The melting temperature value (T peak = 25°C) is not dependent of heating rate, while T onset is estimated to be 23.67°C).
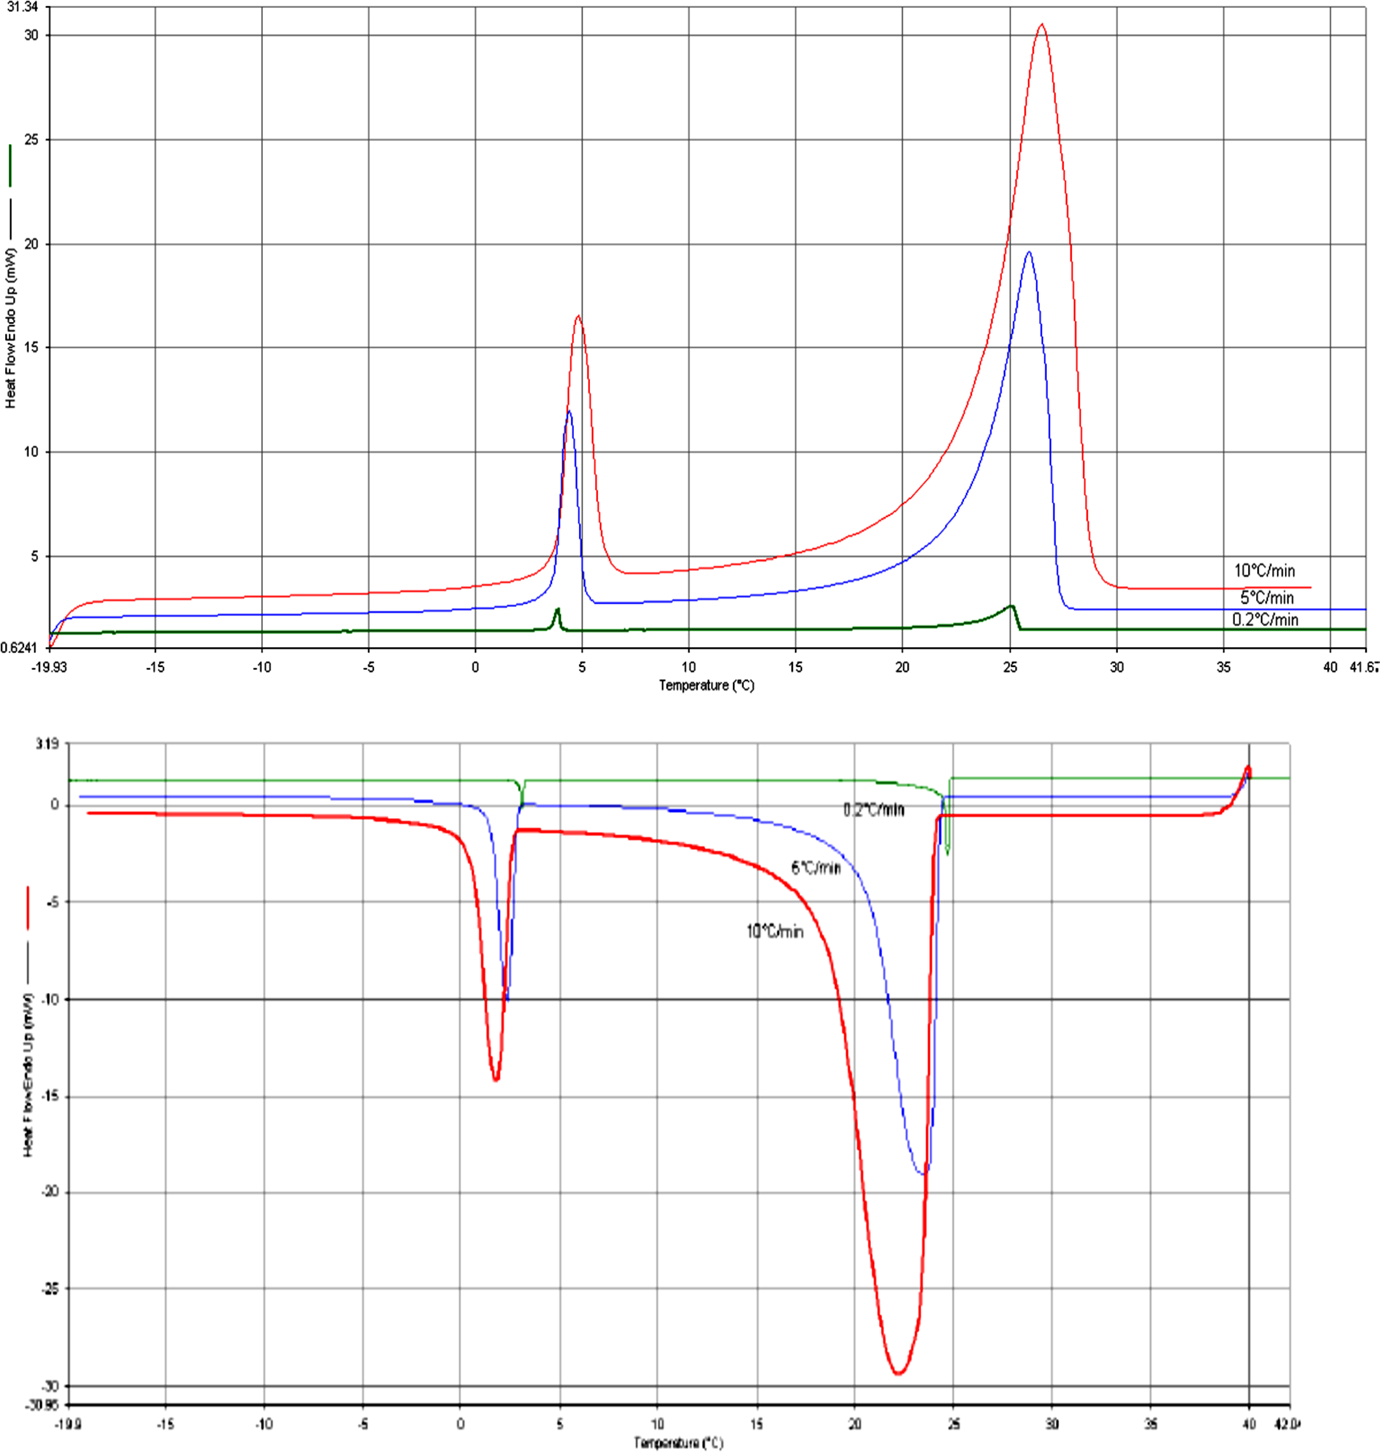
DSC curves of endothermic/heat absorption (e.g., melting) and exothermic/heat releasing (e.g., solidification or fusion) processes of RT27 at different Scanning rate (0.2°C/min, 5°C/min, 10°C/min). DSC: differential scanning calorimetry.
As can be seen in Figure 3 that as the heating rates increase the peaks shift toward higher temperatures and as the cooling rates increase the peaks shift toward lower temperatures leading to the thermal gradients in the sample. These processes display sharp deviation from the steady state thermal profile and exhibit peaks and valleys in a DSC thermogram (heat flow vs. temperature profile). The DSC thermal analyses were performed in the temperature range of −60°C/+50°C. The latent heat of melting or fusion can then be obtained from the area enclosed within the peak or valley, as shown in the Figure 4.
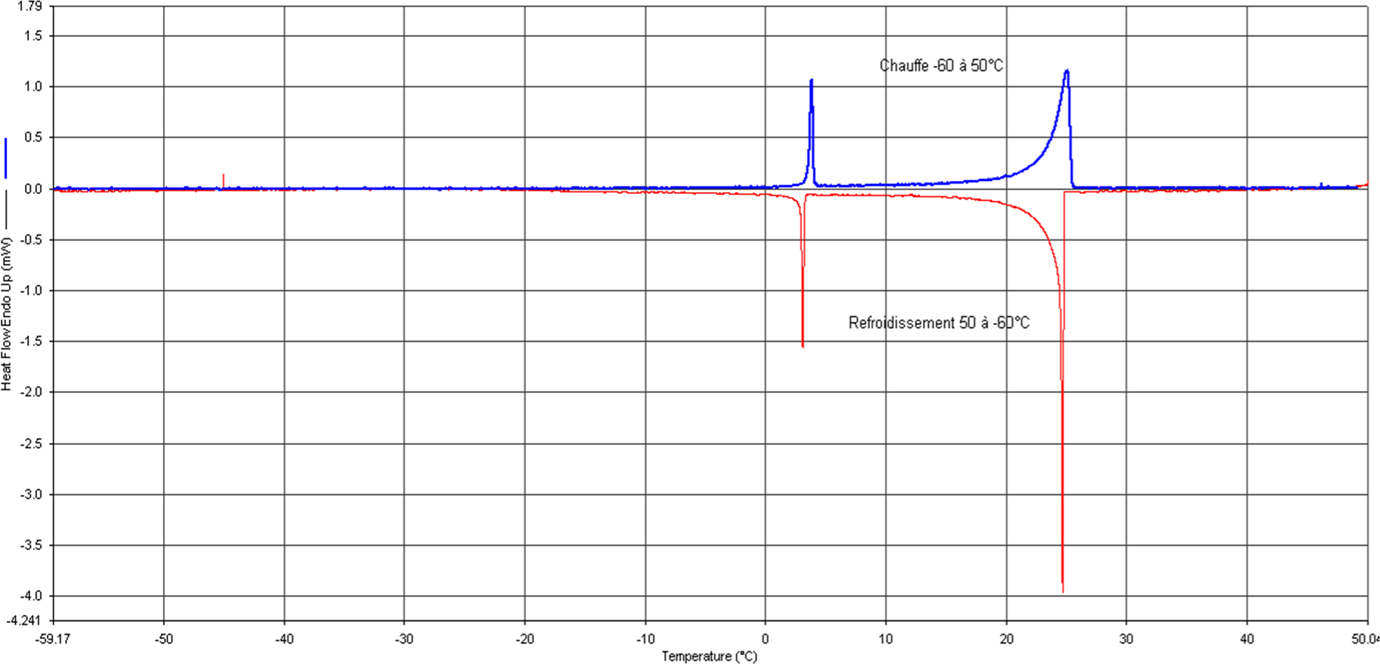
Stored heat (~ DH) as a function of temperature measured by Differential Scanning Calorimetry (Scanning rate, 0.2°C/min). DSC: differential scanning calorimetry.
Figure 4 presents the DSC melting and freezing curves of the RT 27 at 0.2°C min−1 scanning rate and the characteristic temperatures including melting temperature (T m), melting peak temperature (T m-peak), freezing temperature(T f), and freezing peak temperature (T f-peak). The difference between T m-peak and T f-peak is the supercooling ΔT. It can be observed that the melting/freezing peak temperature is 25.09 and 24.69°C, respectively, so the supercooling is 0.4°C. This confirms that the supercooling is negligible in paraffin.
The latent heat of the paraffin is obtained as the total area under the peaks of the solid–solid and solid–liquid transitions of the paraffin in the composite by numerical integration.
Table 1 contains a comparison of thermophysical properties of paraffin wax (RT27) obtained for two samples with another results for University of Lieida. 46
Comparison of thermophysical properties of paraffin wax (RT27).
DSC: differential scanning calorimetry.
The effect of different heating/cooling rates and the sample size can be clearly seen in Table 1.
The sample size also affects the signal of the sample. If a small sample size is selected with low heating and cooling rates, the temperature shift inside the sample will be reduced. But this is not the solution. Because, both the small sample size and low heating and cooling rate lead to a weak signal and hence decreasing the accuracy in enthalpy. Moreover, the small sample could not be a representative of the bulk material to be analyzed. 46
As a result, some factors that may affect the DSC measurements are as follows: sample positioning on the DSC stage (variations in baseline), structure and mass of the sample (proper thermal contact), and heating rate. (Trade-off between sample attaining thermal equilibrium and data acquisition times. A fast heating rate may minimize the data acquisition time compromising salient features of the material property.)
To clarify the effects on the heat transfer performance, an experimental device was developed, based on the measurement of temperatures and heat fluxes exchanged between the two lateral sides of the PCM samples, providing the total heat stored during the phase-change process.
Heat transfer measurements
This section aims to present the thermal properties measured in the experimental investigation. Several tests were carried out to ensure the reproducibility of the experiments.
Apparent thermal conductivity measurements
In order to determine experimentally the solid and liquid apparent thermal conductivities of the composites, a temperature gradient was imposed between up and down sides of the composites until observing a zero heat flux (equilibrium state). The apparent thermal conductivities are calculated by the following expression 21,22 :
where e is the thickness of the specimen and
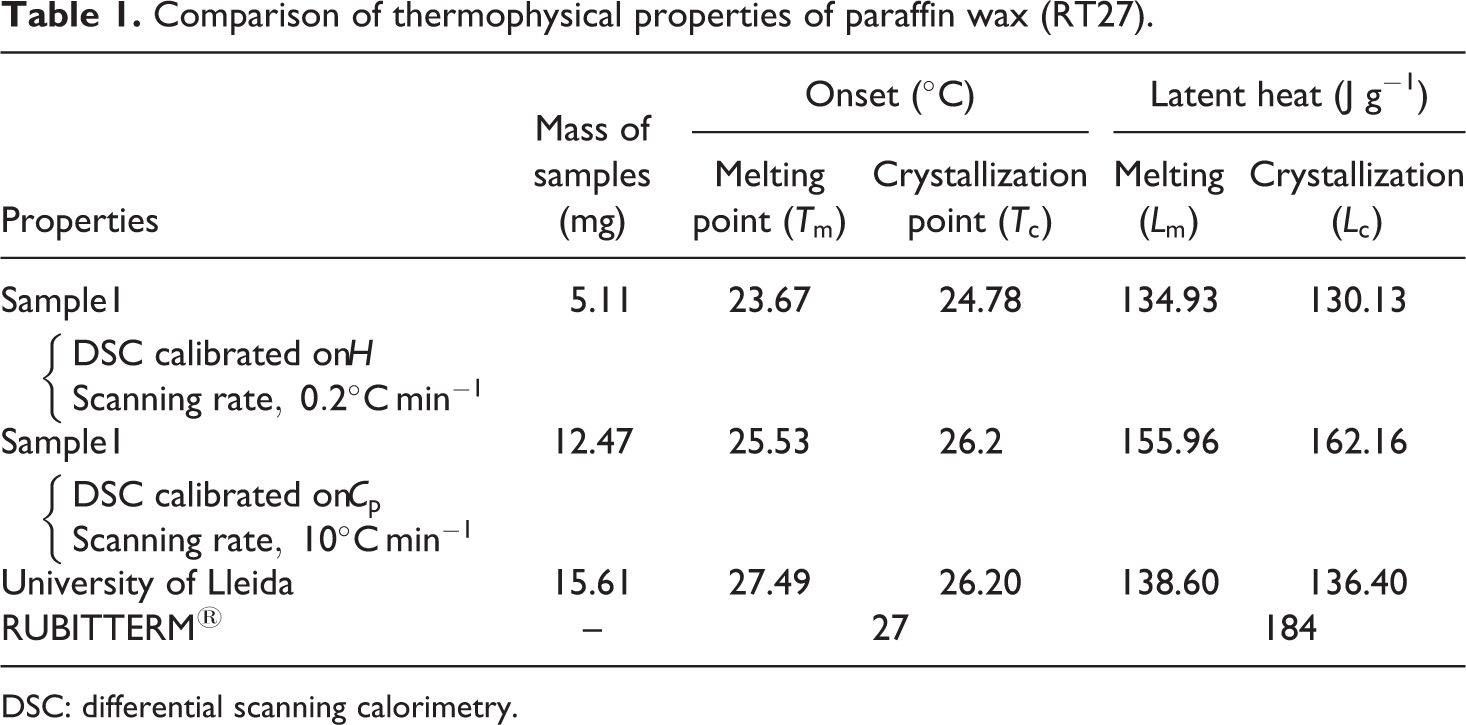
Figure 5 shows the result for PCM in solid phase. The problem to be considered relates to a composite that initially is isothermal where T init = T exch1 = T exch2 = 15°C, lower than the T m. This temperature was maintained until thermal equilibrium. The whole material was entirely solid. Then, at time t > 0, the composite was heated by modifying the temperature on a single face only (T end = T exch2 = 20°C), such that T end < T m (fusion process).
Measurements with thermal variation one side of the solid sample (15°C to 20°C) for Resin/wax.
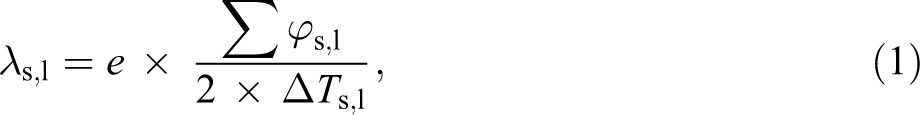
A similar experiment was carried out for the liquid phase; the sample is subjected to a temperature gradient generated by the two heat exchangers plates. The temperature levels (40°C and 50°C) are higher than the melting temperature on both sides (Figure 6). In order to evaluate the results, Figure 7 presents here the result for the case of the solid-phase sample out of pure resin epoxy with the same dimensions, as the sample made of the compound was produced with paraffin.
Measurements with thermal variation one side of the liquid sample (40°C to 50°C) for Resin/wax.
Measurements with thermal variation one side of the solid sample for Resin.
The results were found to be satisfactory and provided values of apparent thermal conductivities, which are listed in Table 2.
Apparent thermal conductivities of composites.
Storage/release latent heat study
Sensible and specific heat capacity (in solid and in liquid states)
The heat capacity of the material was determined for the solid and liquid phases from the total sensible heat accumulated by the material between two imposed temperatures.
Initially, the sample is isothermal. Therefore, it is heated or cooling by modifying the temperature set point of the thermo-regulated bath. The material will thus evaluate from T init to T end. Between these two permanent steady states, the material stores a quantity of sensible heat Q, which constitutes the variation of the internal energy of the system. The flux meters make it feasible to measure the heat fluxes exchanged at the borders of the composite.
The total amount of energy per mass stored can then be obtained from the following expression:
where
To determine the apparent specific heat of the PCM in the solid state, T init and T end have to be lower than the melting temperature. Similarly, to determine the apparent specific heat in the liquid state, the experimental protocol is carried out for a temperature range higher than the melting temperature (T init = 40°C and T end = 50°C).
The evolution of the heat fluxes and temperatures on both sides of the sample during the determination of the specific heat capacities of the resin/wax composite in the solid and liquid states is represented in Figures 8 and 9, respectively. Figures 8 and 9 present the variation of the heat evolution of the sample in solid and liquid phase, respectively. In these figures, we can note the symmetrical behaviors of the flows. Results for the liquid phase only were also obtained but the behavior, despite additional natural convection heat transfer, is somewhat similar to the curves presented in Figure 9.
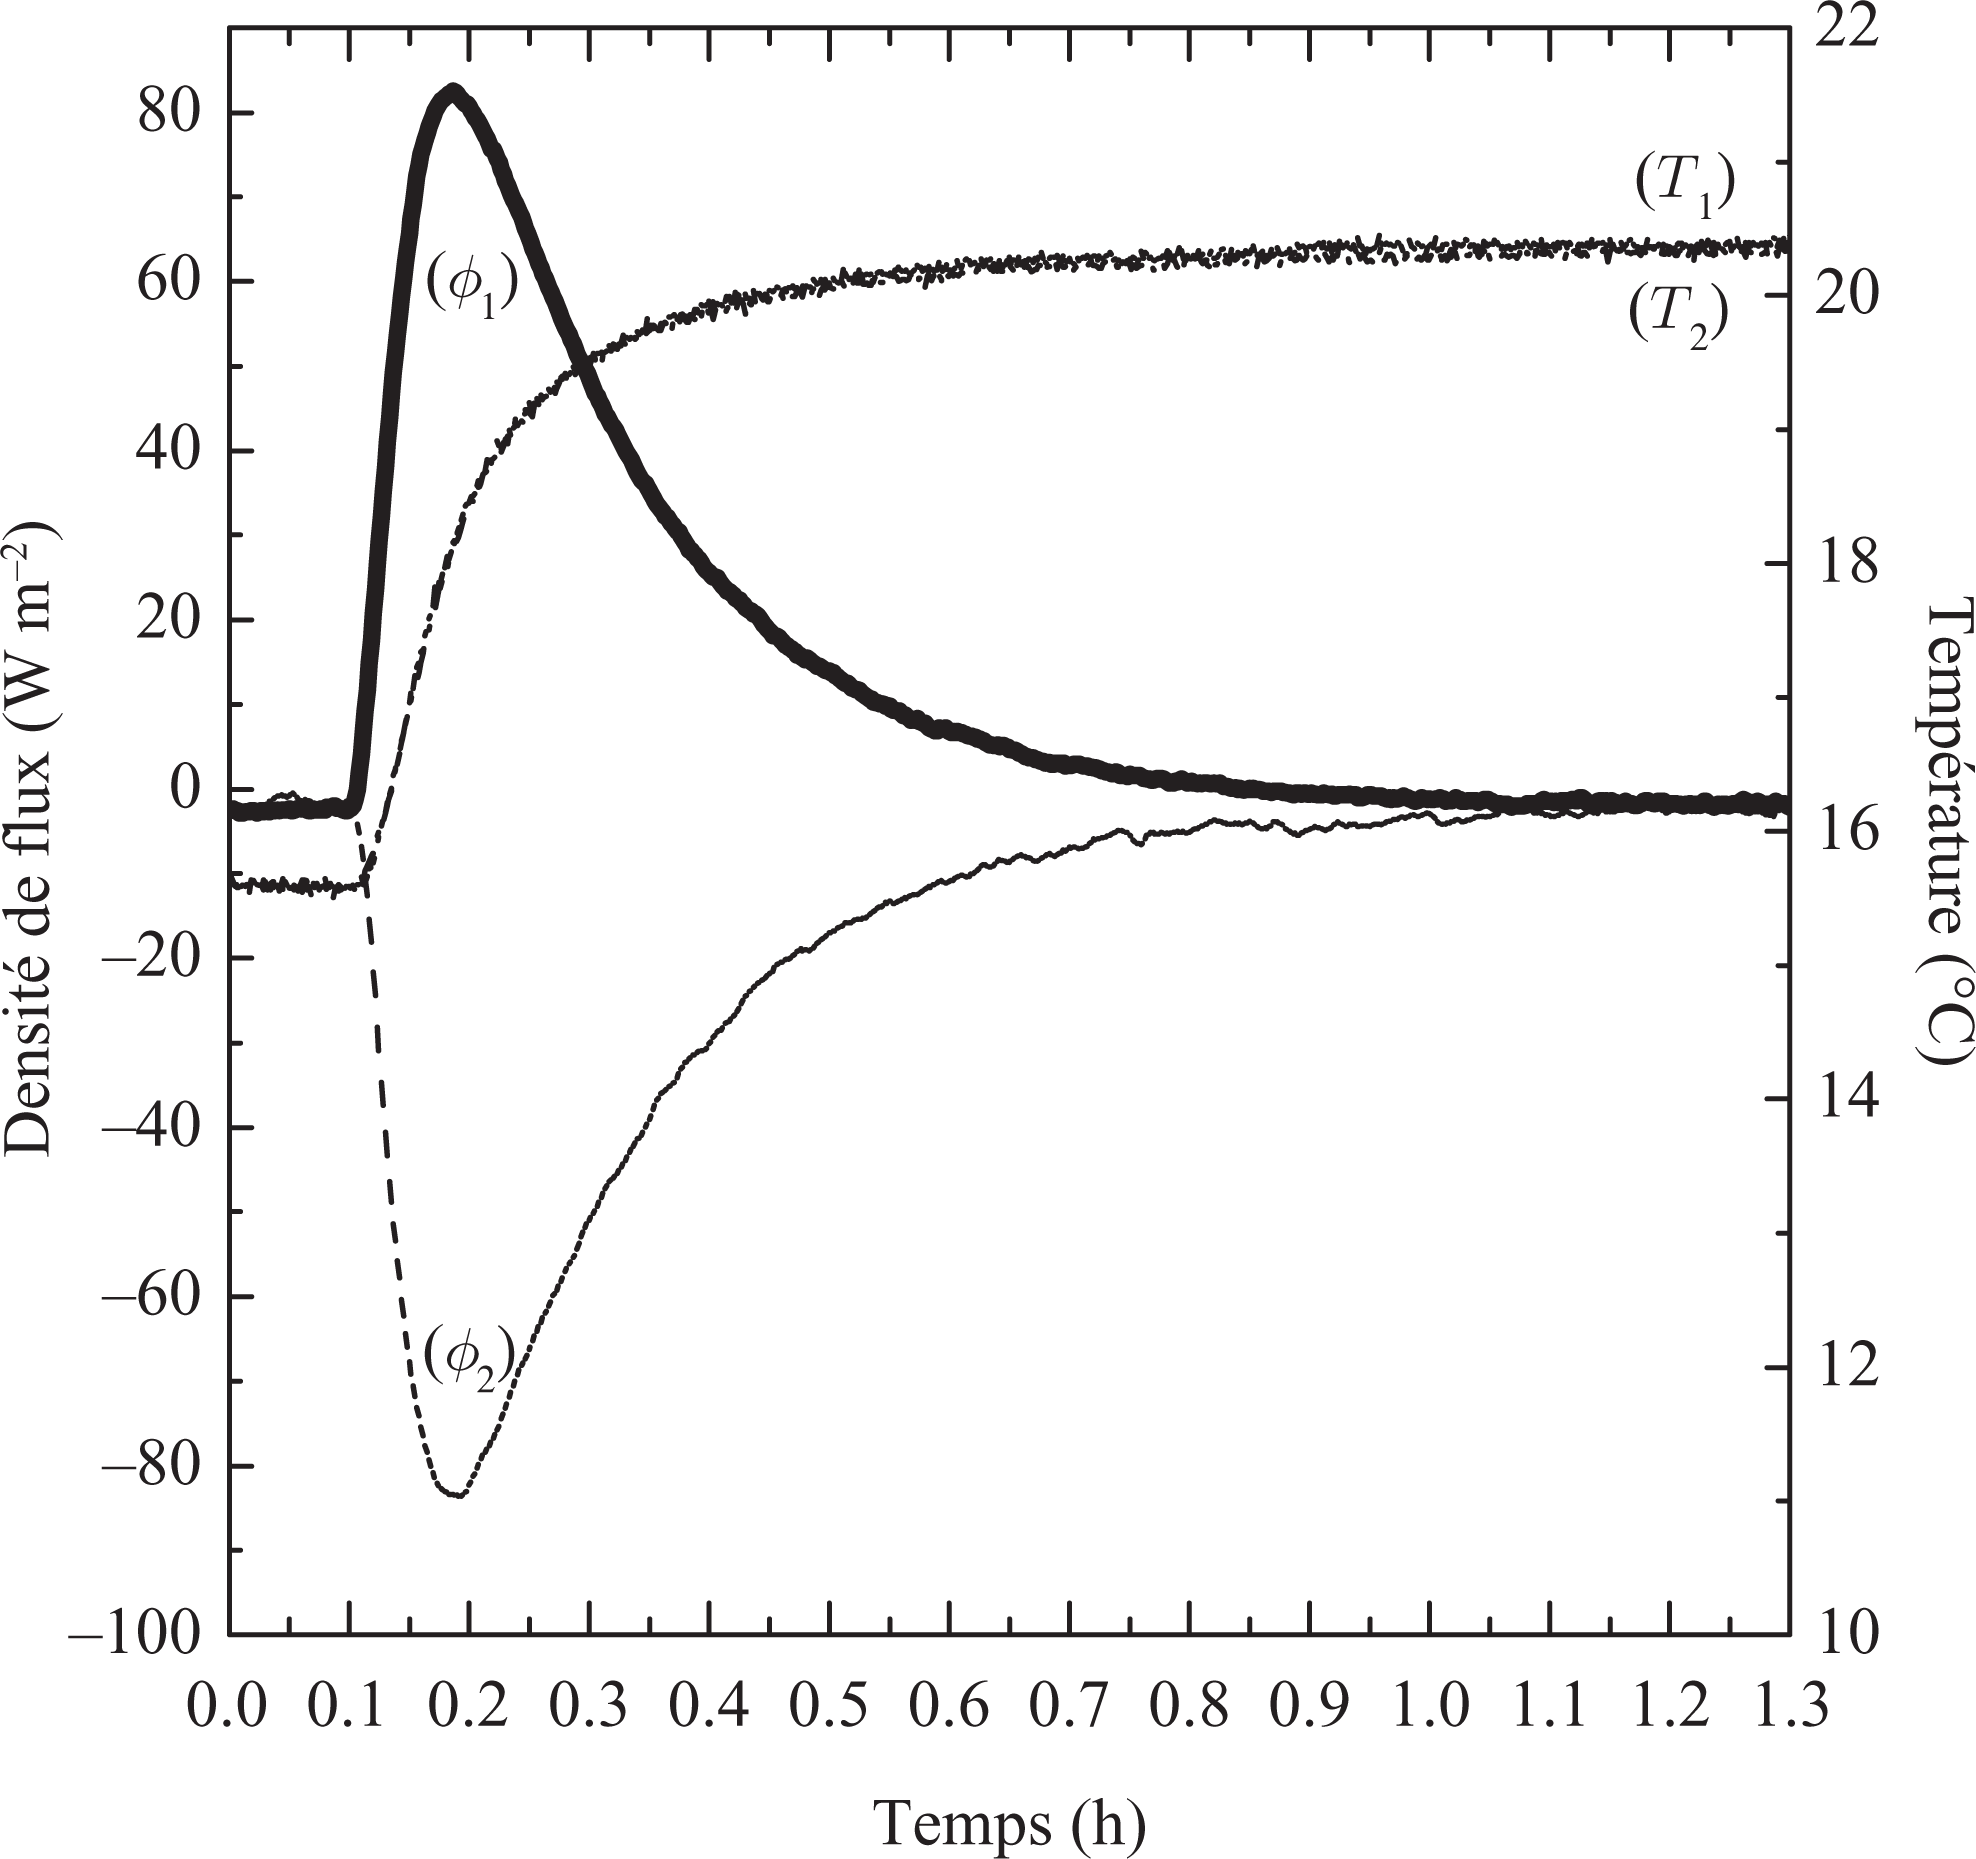
Heat flux and temperatures evolution of the solid phase (15°C to 20°C).
Heat flux and temperatures evolution of the liquid phase (40°C to 50°C).
Furthermore, the flow evolves very quickly at the beginning of data collection and then fall to 0, which corresponds to the achievement of a new state balance at the end of the test. The solid or liquid specific heat capacity is calculated by integrating the heat fluxes from the initial state (T init) and the final state (T end). The results obtained for the specific heat capacity and the sensible heat stored for the solid and liquid states are summarized in Table 3.
Quantity of heat stored and apparent latent heat for composites.
Latent heat of fusion determination
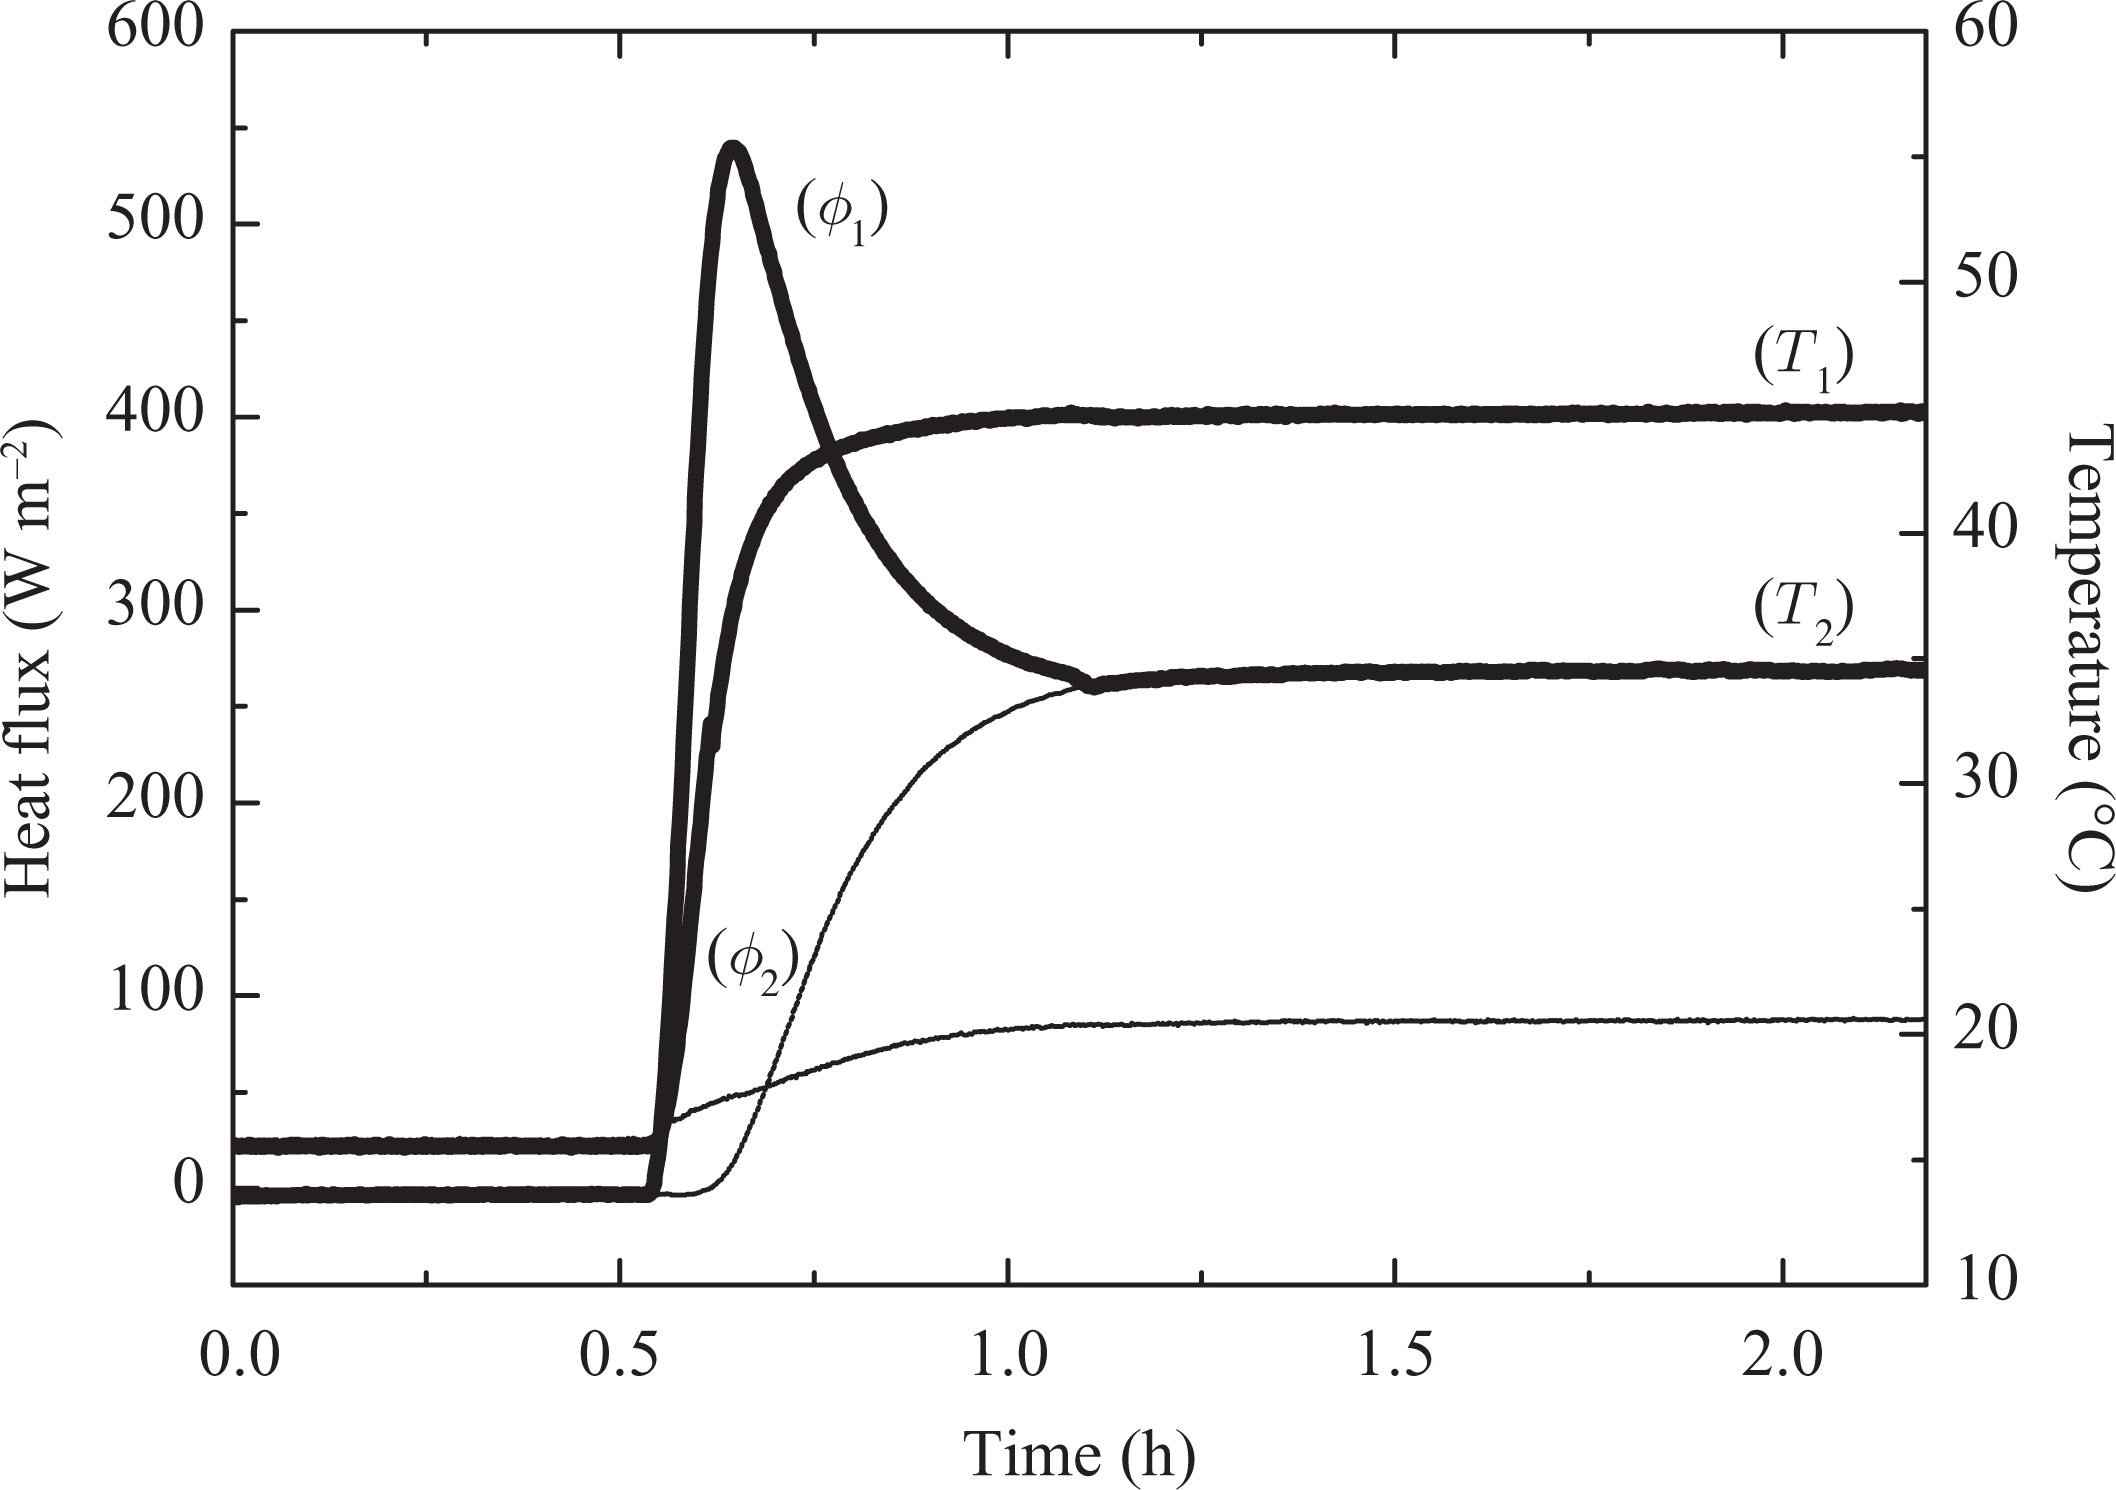
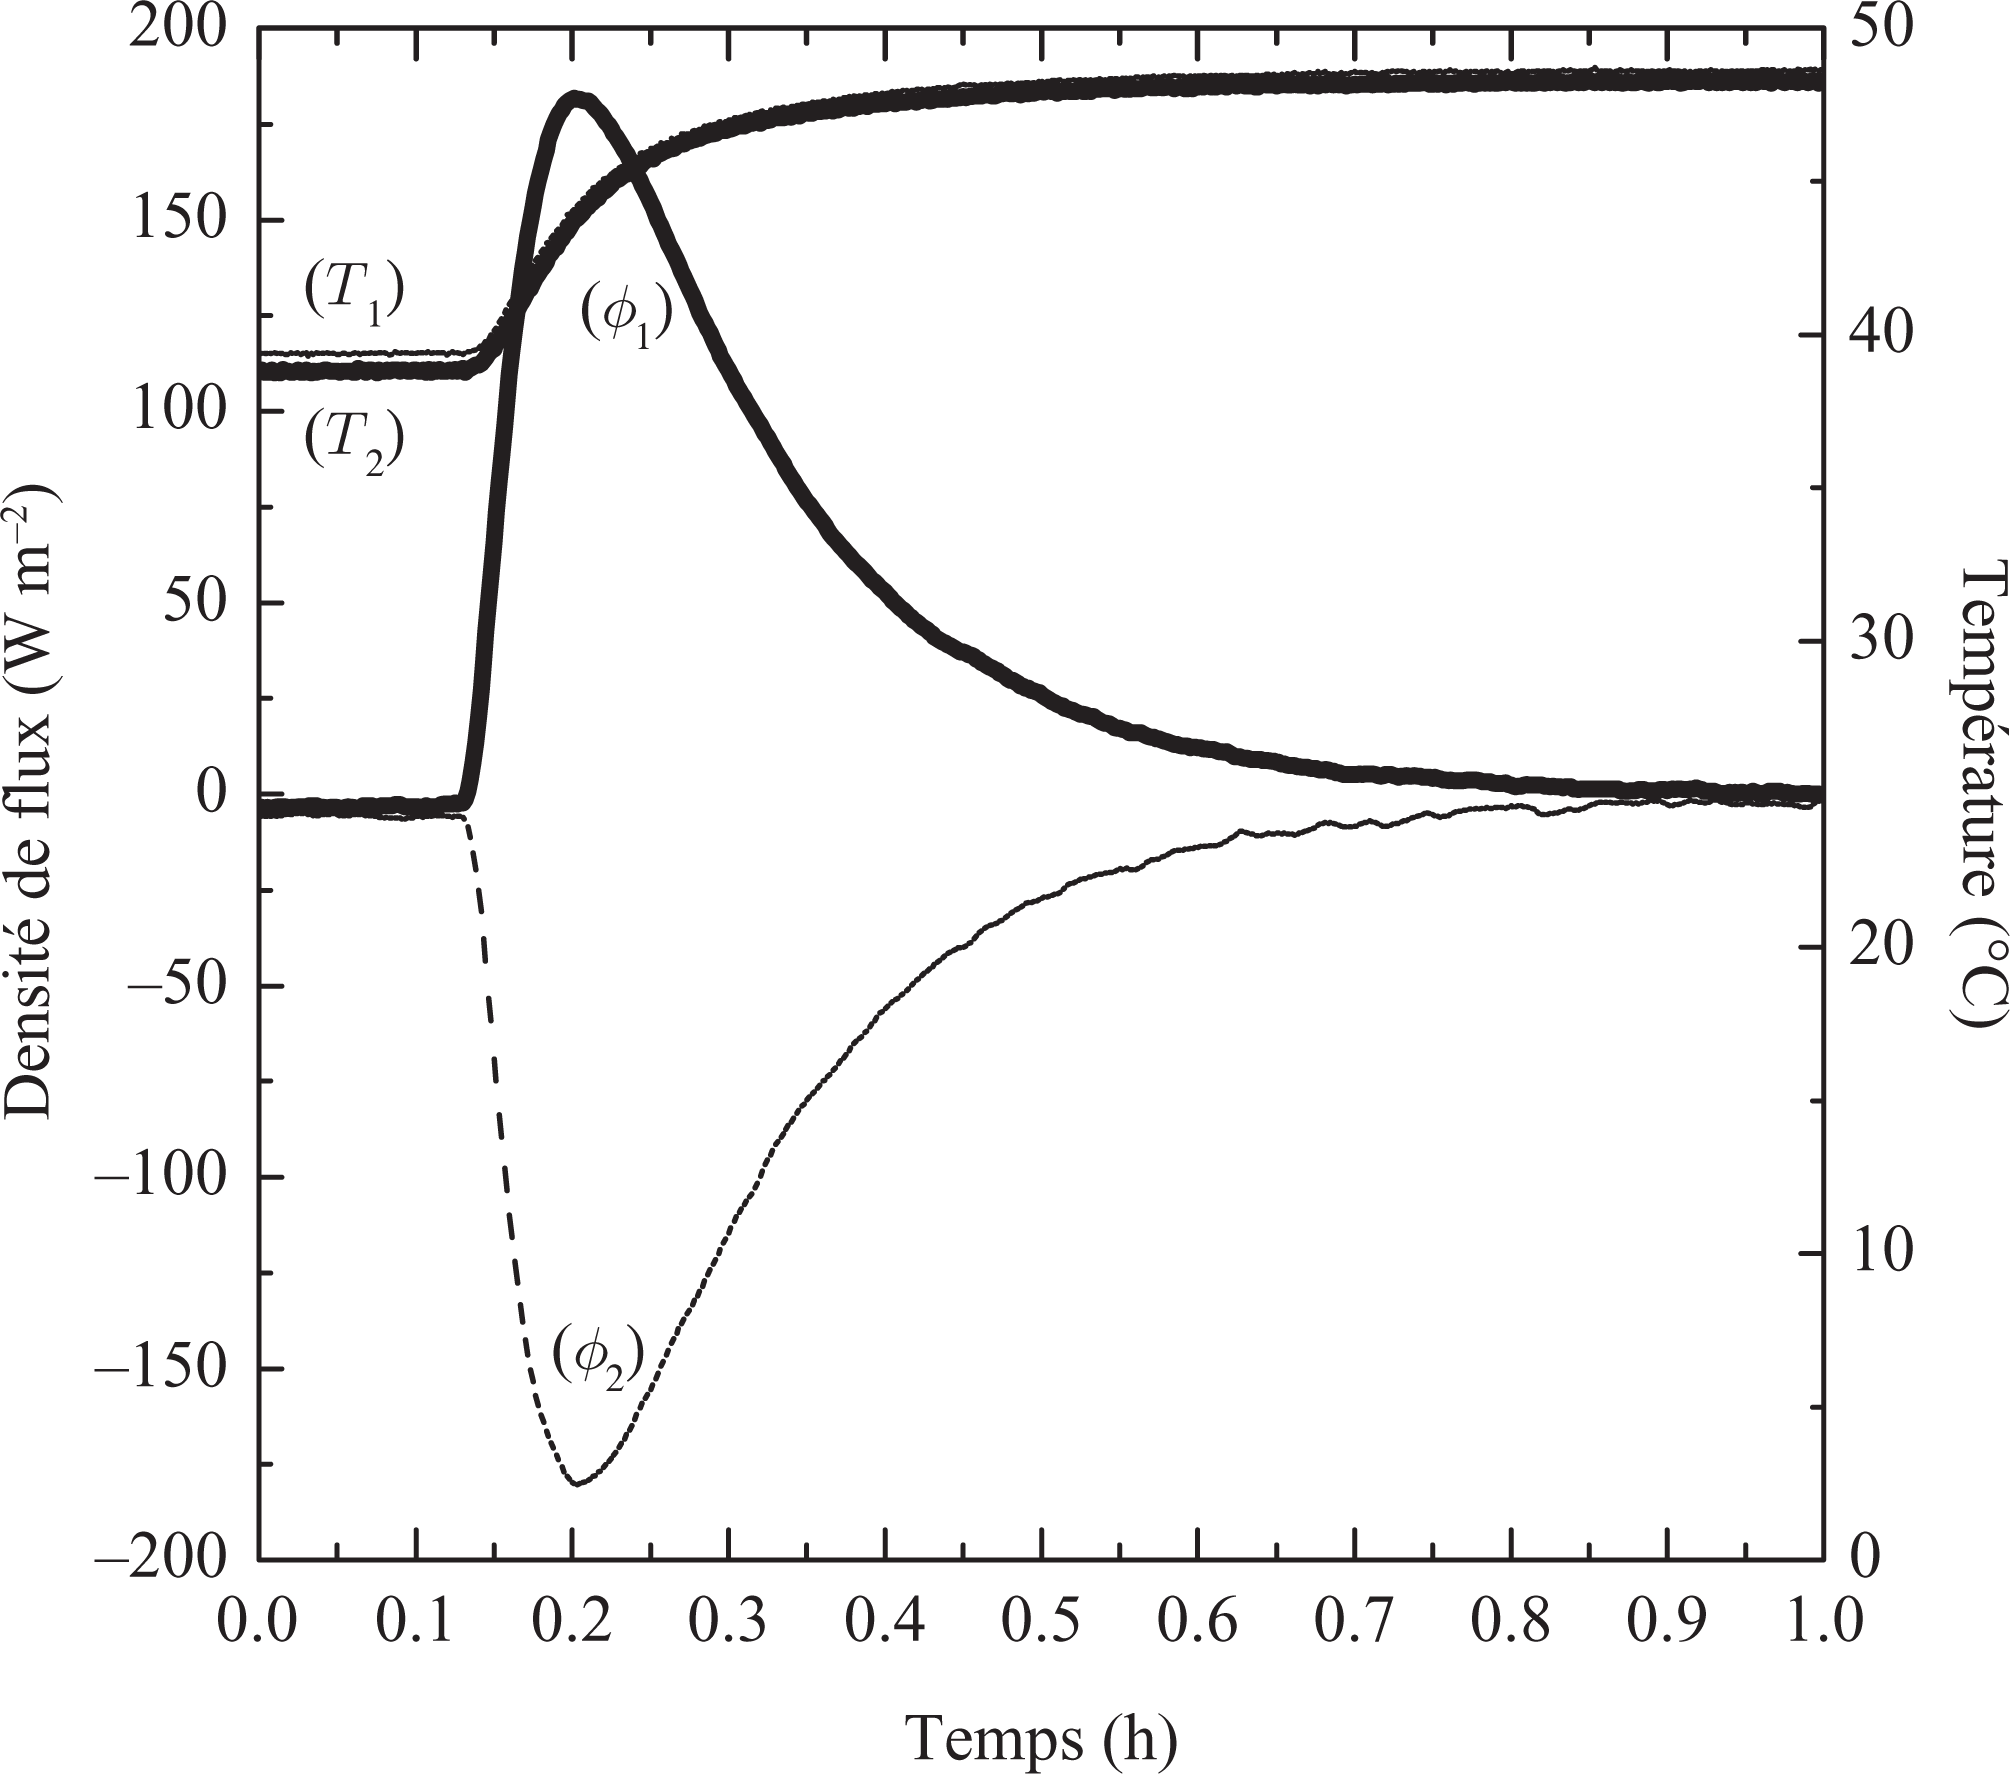
The latent heat of phase change is one of the most important criteria in the selection of PCMs for building thermal storage applications. This value can be obtained from the experiments conducted in this work (see Figure 10) by calculating the amount of total heat (Q) stored between two stable thermal states (15°C and 50°C).
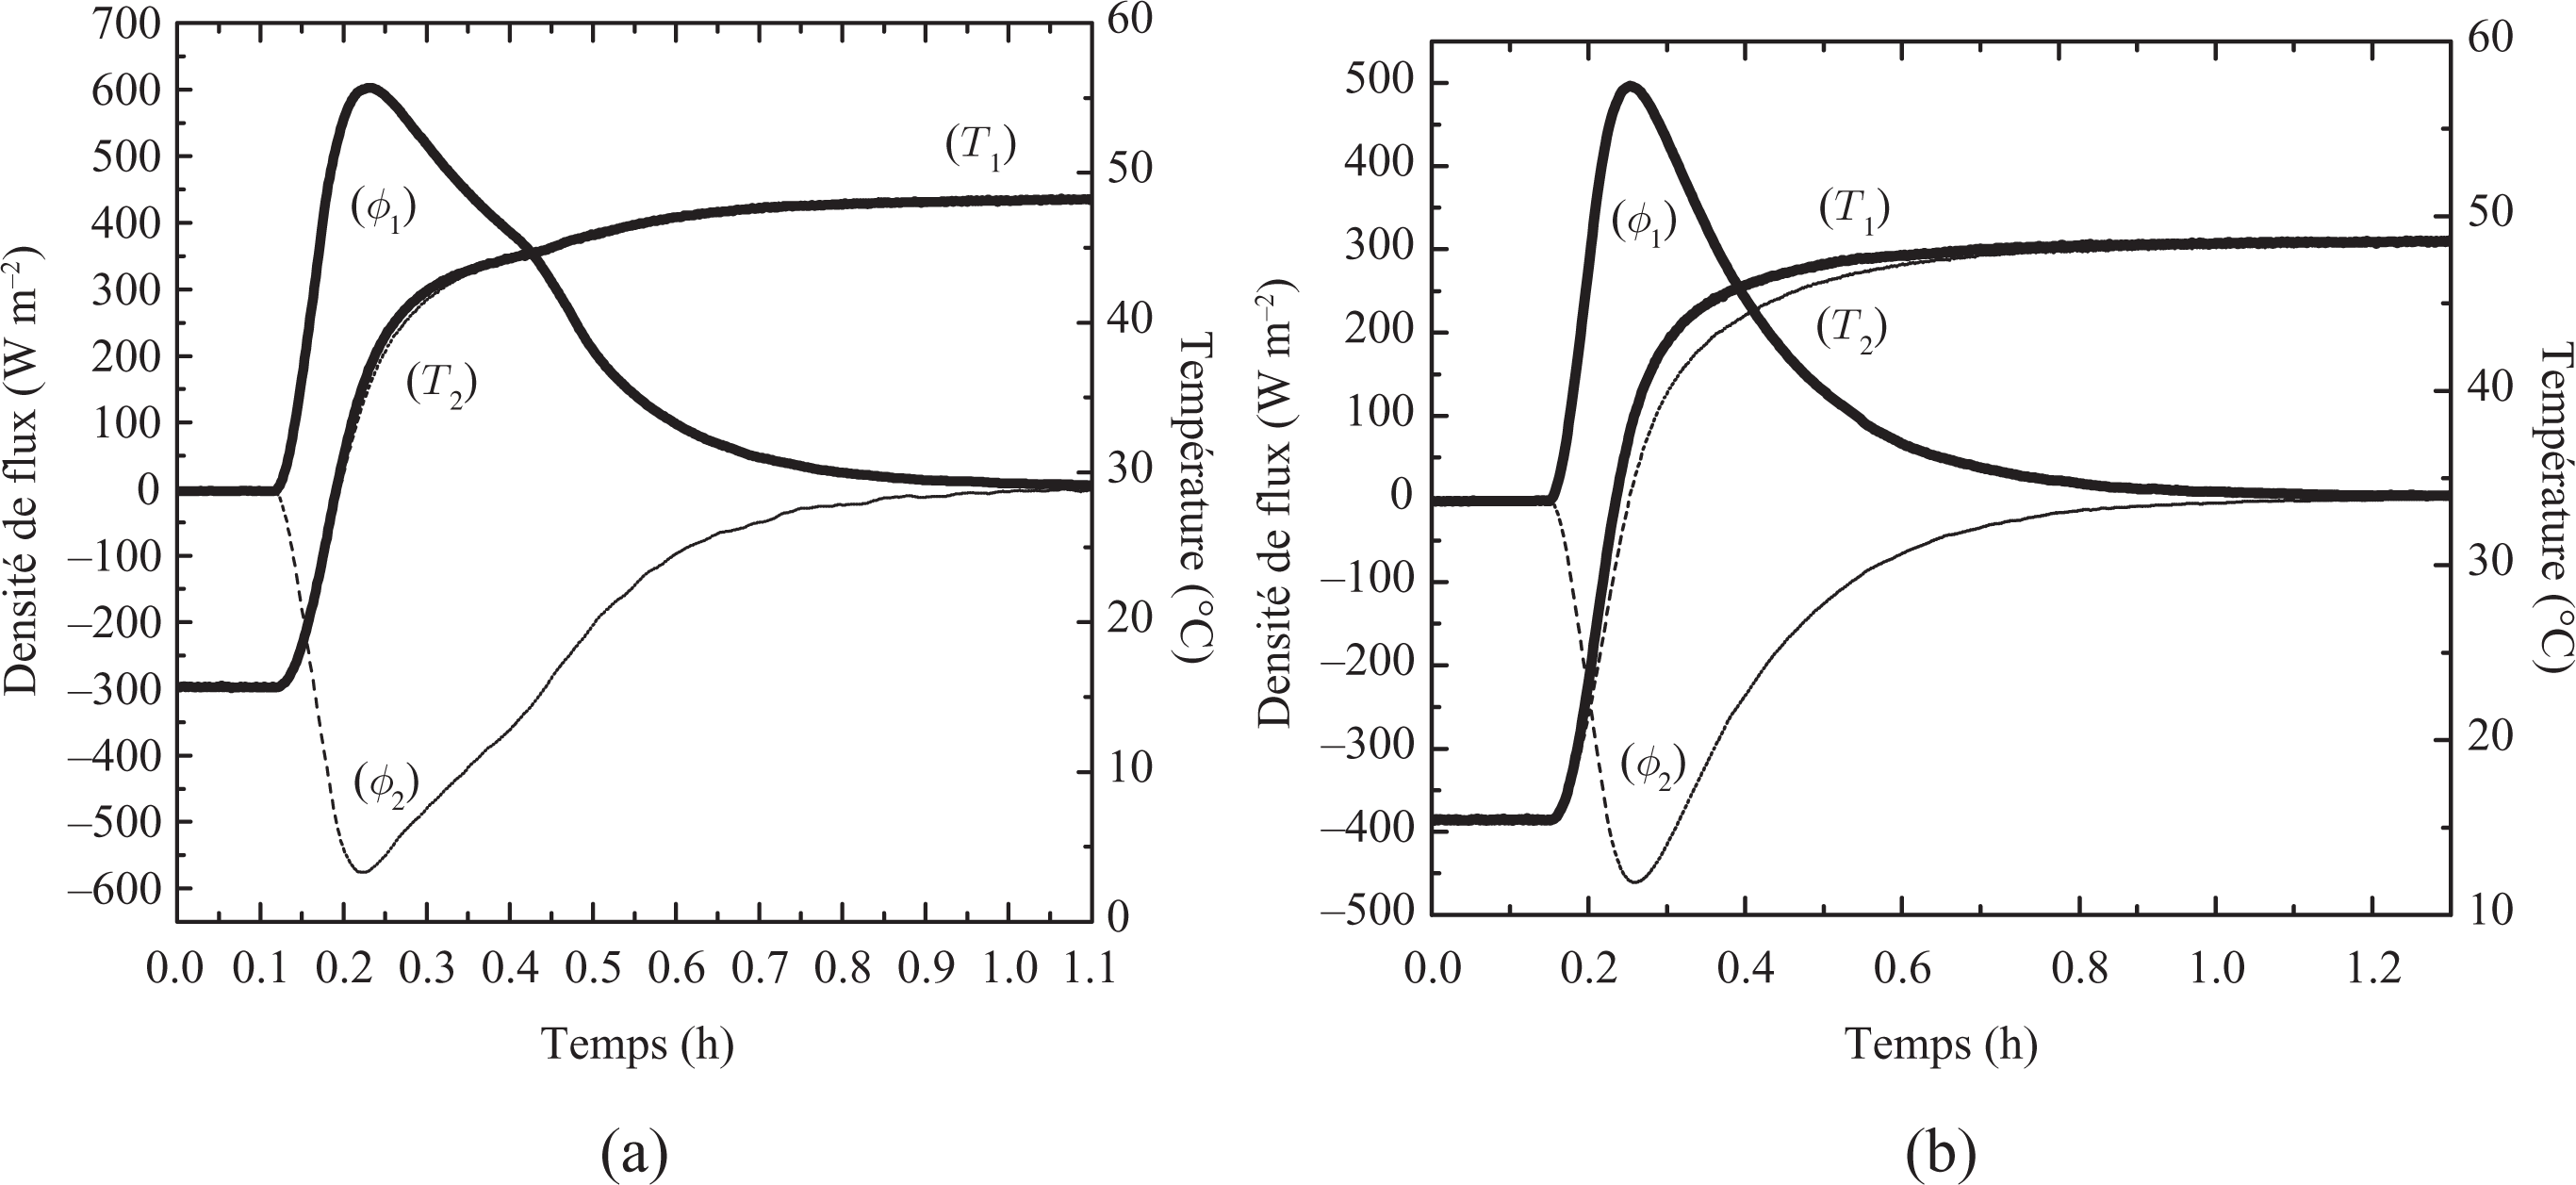
Heat flux and temperatures evolution from solid to liquid (15°C to 50°C) (a) Resin/wax, (b) Resin.
The thermal evolution from 15°C to 50°C allowed us to follow the complete melting process of the composite (from the solid state to the liquid state), during which a large quantity of energy has been stored as sensible (Q sens) and latent (L m) heat by the material. The selected temperatures are satisfactorily far away from the zone of melting point to consider that certainly the material is strictly in one or in the other state. The total amount of energy per mass stored can then be obtained from the following expression:

where
The quantities of heat stored and heat capacities for solid and liquid states are given in Table 3. These values will be helpful to determine the apparent latent heat of the composite (resin/wax).
To demonstrate the importance of thermal storage by latent heat, evolution of flow and temperatures for different temperature differences between the initial and final states are presented in Table 4.
Quantity of heat stored and heat capacity for composites.
Energy release
In the cooling case, where the temperature evolves from 50°C to 15°C, solidification of the material occurs. For our parallelepipedic samples, one observes symmetrical evolution on the measured heat fluxes on the two faces of the sample (Figure 11). Initially we observe a normal evolution of measured heat flux corresponding to the cooling of the liquid phase. At the end of this phase (t = 33 min), when the temperatures of surfaces are in the vicinity of 28°C, the heat flux evolution is reversed. From this critical moment, the cooling of the sample continues, the material is solidified slowly and cools until it reaches the prescribed 15°C: after more than 1 h 50 min, the sample reaches an equilibrium state.
Heat flux and temperatures evolutions (50°C to 15°C).
Heat restitution is a very long process. At the beginning of solidification, a layer of solid PCM starts to be formed on the plane surface in contact with the exchanging plate, a layer which “isolates” the liquid phase from the cooling source. Solidification goes on slowly because of the low thermal conductivities of the PCM (λ is estimated at = 0.211 W m−1 K−1). The temperature of the sample surface reaches 15°C only at the end of the test.
Numerical study
Problem formulation
The composites material (resin/wax) was seen like a periodic repetition of a representative volume element (RVE). The RVE is composed of a sphere of radius r = 6 mm centered in a cubic cavity of dimensions (143 mm3). To obtain a solution of the governing equations, 47,48 several assumptions are indispensable to appreciate the limits of the validity of the selected method. The boundary conditions at the edges of the representative volume element are of adiabatic type at the vertical walls. The contact between the matrix and spherical capsules was considered to be perfect, and the velocity on the wall of the sphere is equal to 0.We will consider that the flow in the liquid phase is Newtonian, laminar, incompressible, and the Boussinesq approximation holds. We will neglect viscous dissipation and the effect of thermal expansion. Thermophysical properties of the PCM are constant for solid and liquid phases and are independent of temperature. The PCM behaves ideally (supercooling is not accounted).
The PCM is homogenous and isotropic. A two-dimensional numerical simulation (Figure 12) was carried out utilizing COMSOL Multiphysics software 4.3b which is based on the finite element method to simulate the thermal behavior of the composite. Taking into account the aforementioned assumptions, the governing equations for the heat transfer melting process can be written as:
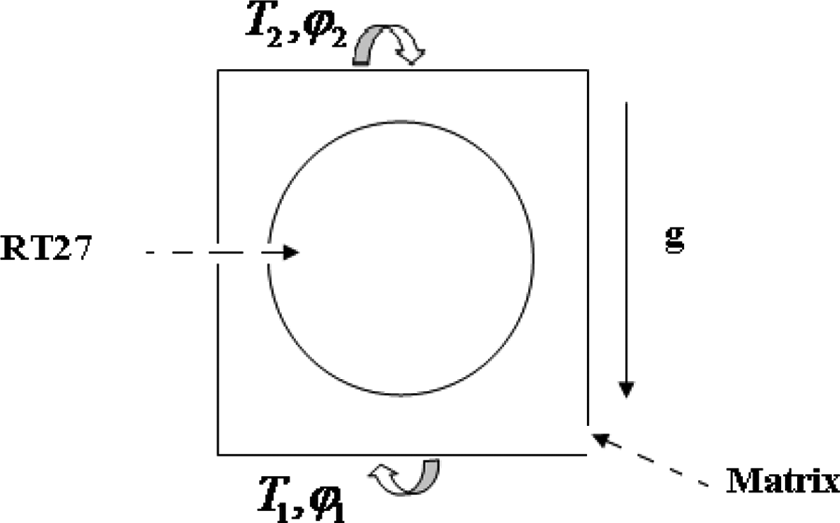
Composite material with applied boundary conditions.
Heat equation in the solid region:
Conservation equations in the PCM (liquid region):
Conservation of mass:
Conservation of momentum:
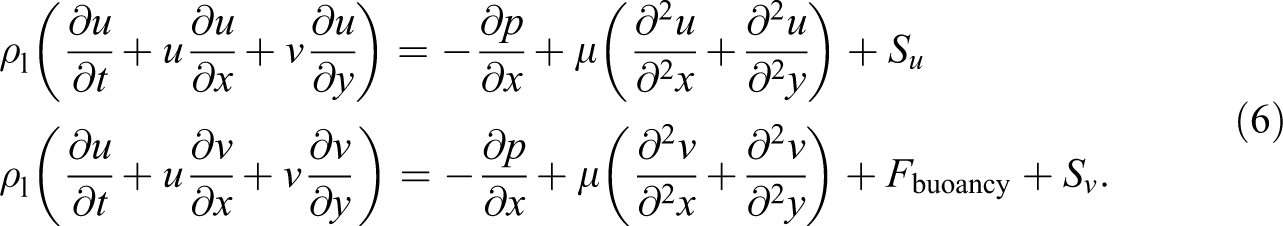
Energy conservation:

The

Here, the term
In order to achieve this behavior, an appropriate definition of B, which is the Carman–Kozeny relation 50 :
where b = 0.0003 50 is a small computational constant used to avoid a division by 0 and C is a constant reflecting the morphology of the melting front. The study of the effect of this constant on the melting process is given in the next section.
For modeling the phase-change problem, the effective heat capacity method is used here because at the time of the phase change, the release (or the absorption) of the latent heat is taken into account by the increase in the specific heat apparent.
To consider the latent heat absorbed during the melting process, the interface region is processed by equation (12) depending on the phase transition temperature rang (
Computational procedure and validation
As discussed above, the momentum equation (6) contains a source term with the parameter C, defined the mushy zone constant, equation (10). Its effect on melting was examined by Voller and Prakash 36 for a square domain. It was shown that C influenced the melting process but the findings were not correlated to experimental results, and thus no specific observation was obtained as for the suggested value. Since then, the literature has tended to refer to the constant C as the parameter that reflects the kinetic processes in the mushy zone, which are believed to be different for materials of various types.
In order to solve numerically the problem of solidification, Assis has found that the values of C = 105 − 106 yield results that disagree with the physical picture of the process. His study showed that the most suitable value was C = 10 8 and the latter were profitably utilized for modeling of solidification in a spherical shell. 52 As following that investigation, the same value of C was used for modeling solidification in a vertical cylindrical tube. 53
One of the benefices of the simulations was to provide information which may be difficult to obtain in an experimental device. For example, the time evolution of the liquid fraction for pure PCM was easily obtained by means of the COMSOL software.
In the present study, the impact of the constant C on the fusion process is studied: the value of 104 is explored along with 105, 106, 107, 108, and 109. Accordingly, Figure 13 shows the simulated melt fractions versus time for specimen S1 in the case of the temperature slope 15–50°C. One can notice from the figure that the greatest time for the whole melting is when C = 109 and the shortest is when C = 104 and 105. For the other values of C, the time necessary to melt the total material fall between these two extremes. It was found that when the constant rises from C = 105 to C = 109, the results are becoming closer to those for C = 109. As mentioned above, the melting time obtained with C = 105 is much shorter than the experimental results. Thus, it appears that there exists a value of C for which the agreement with the experimental results would improve.
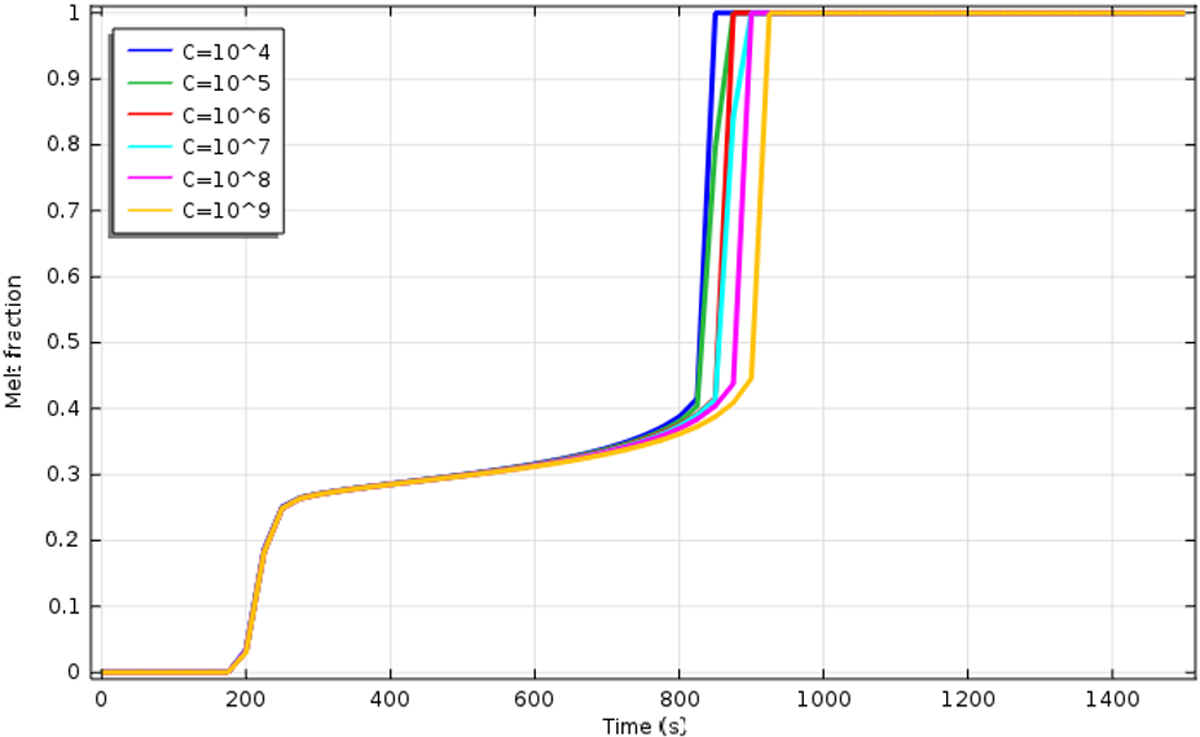
Melt fraction vs. time for different values of the mushy zone constant.
Figure 13 shows that even for C = 109, the simulated melting time is not in very good agreement with the experimental data (Figure 10). Therefore, it was decided to explore the effect of the phase transition temperature rang. 35 The effect of the melting temperature range on the melting interface position is investigated: value of 0.9 K is explored along with 1, 2, 3, 4, and 5. The experimental values are in good agreement with the theoretical values. They are presented in Figure 14.
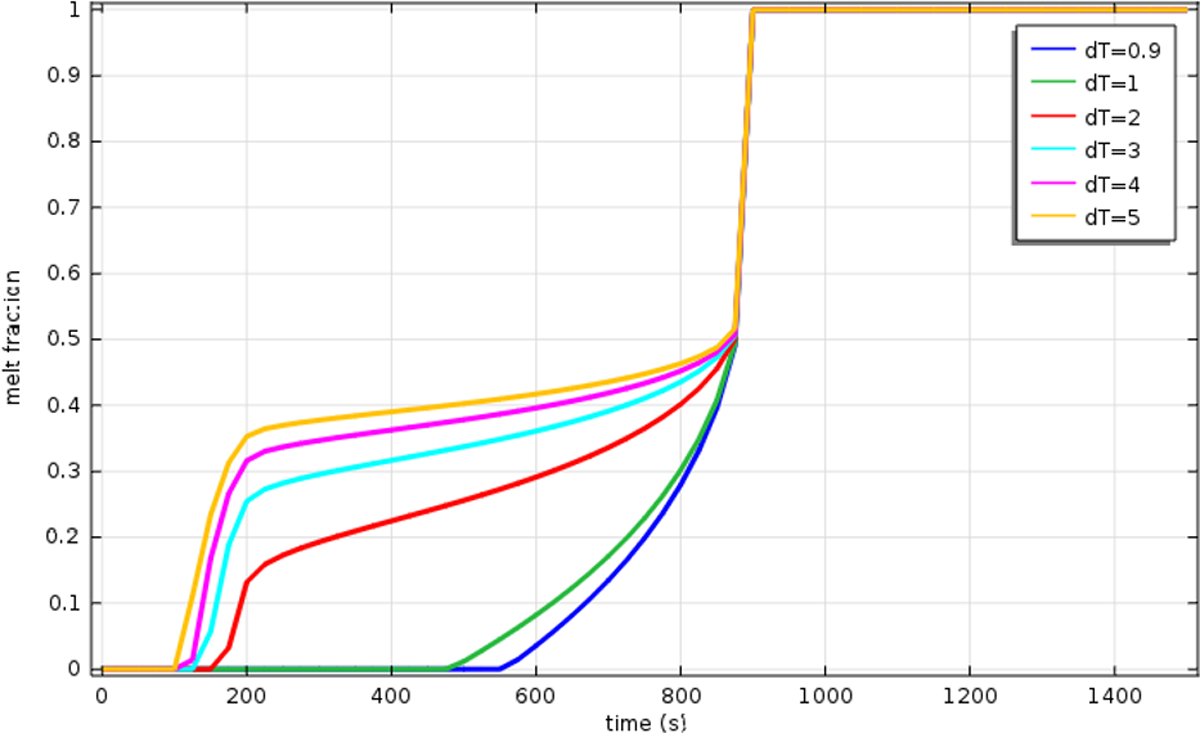
Evolution of melting front position for varying ΔT m.
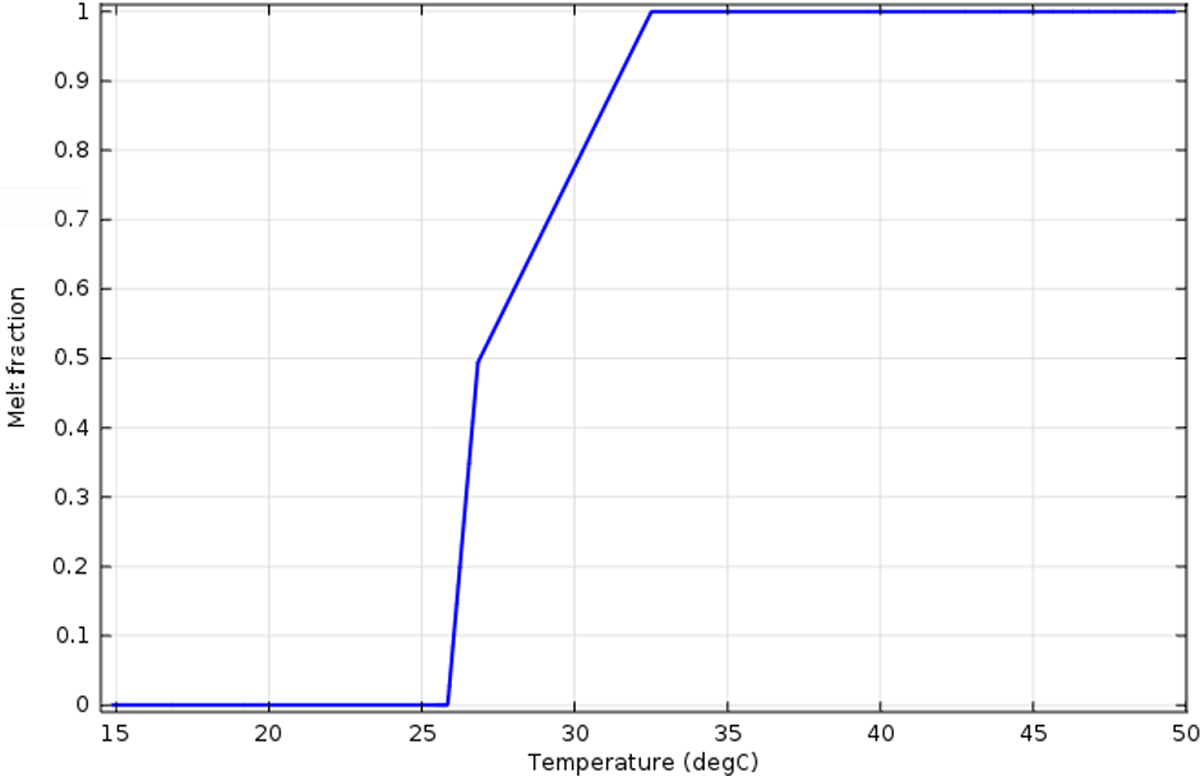
The most suitable value is ΔT m = 1 K. In this case, the time needed to melt the whole material calculated by simulations were almost the same as the one obtained from the experimental curve: 15.41 min by COMSOL and 17.5 min in the experimentation (Figure 18). Thus, of the rest of this study, we consider that C = 109 and ΔT m = 1. Figure 15 presents the melt fraction of the PCM as a function of temperature. The phase-change melting onset and end temperatures of 26°C and 34°C, respectively.
Melting interface position as a function of temperature.
Figure 16 presents the solid shape (shown in blue) evolution in time during the heating process of a resin filled with PCM sphere. This simulation corresponds to the heating from the temperature T 1 = T 2 = 15°C to the temperature T 1 = T 2 = 50°C.
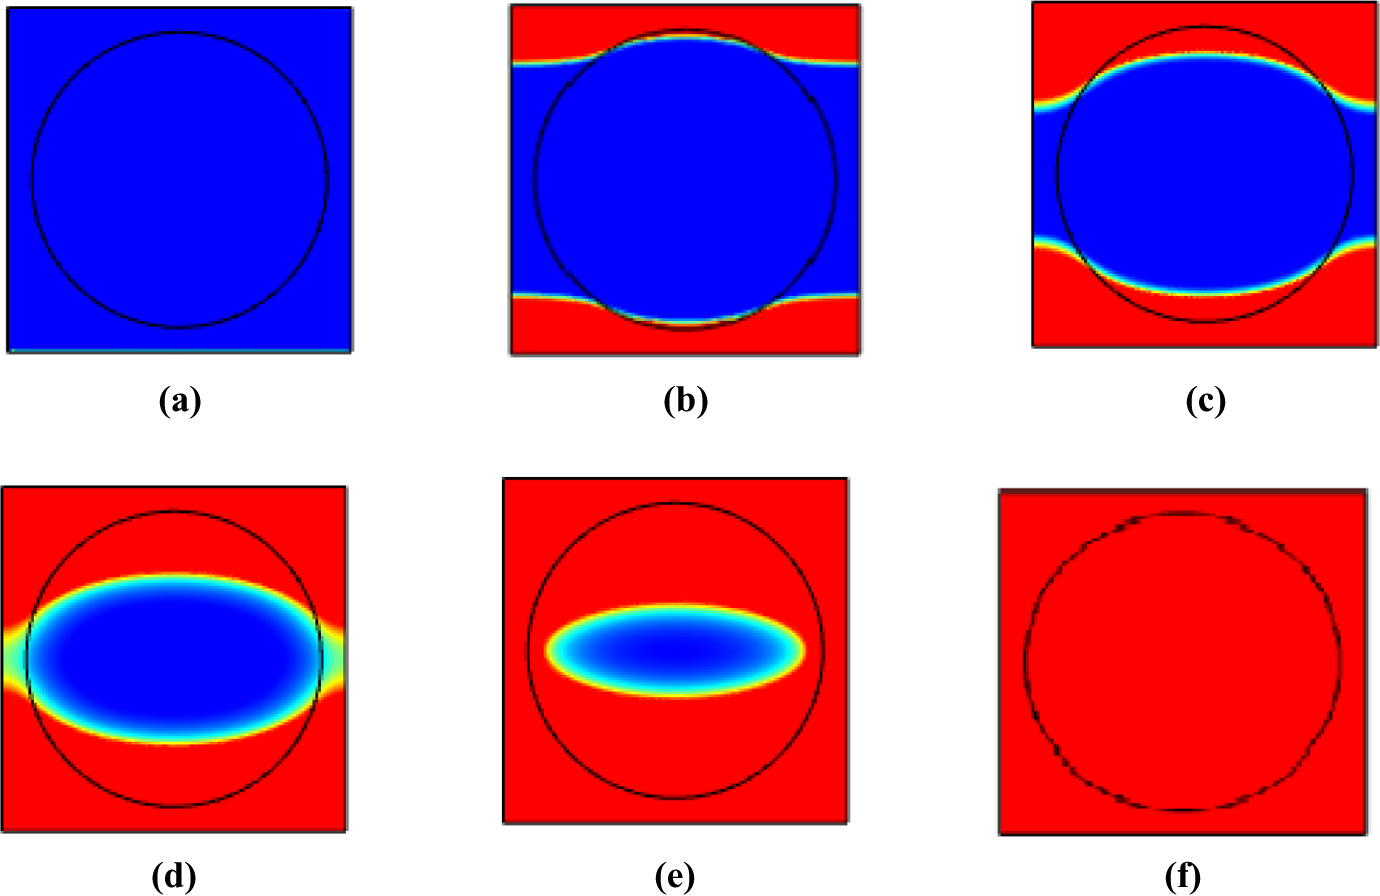
Evolution of the melting front propagation: (a) t = 0 s, (b) t = 25 s, (c) t = 100 s, (d) t = 300 s, (e) t = 600 s, and (f) t = 900 s.
It has been shown from experimental findings 54 that four distinct regimes occurred during the melting process are as follows (a) pure conduction, (b) mixed convection/conduction, (c) convection dominant, and (d) “shrinking solid” as shown in Figure 16.
Initially, the molten layer thickness is very small; conduction is likely to be dominant heat transfer mechanism. The prevailing phenomenon of conduction is indicated by the existence of nearly perfect concentric isotherms and parallel-to-wall circular interface shape as shown at time instants of 0–25 s. As the time increases, the molten layer thickness starts to vary along the horizontal direction, with the molten layer being thickest at the top and the bottom of the field as seen in Figure 16(c) (100 s). This suggests that buoyancy-driven natural convection is commencing to strengthen. Nevertheless, the melt layer thickness is still nearly uniform over much of the sides’ parts of the sphere, which exhibit that conduction is still an important mechanism. The emergence of the melt front shape is analogous to the mixed convection/conduction regime. 55
As the melting progresses, the convective contribution increases and their effects on the solid/liquid interface become more noticeable. Consequently, the melt layer thickness varies continuously along the sphere as observed in Figure 16(d) (300 s).
Figure 16(e) presents a photograph of the PCM further along in the fusion process. By this time, the side portion of the PCM has completely melted away.
By the 900 s, the sphere is fully filled with molten liquid. Since this point forward, natural convection is the prevailing phenomenon that has also been studied by the authors, for example, Zhang et al. 56 and Khodadadi et al. 57
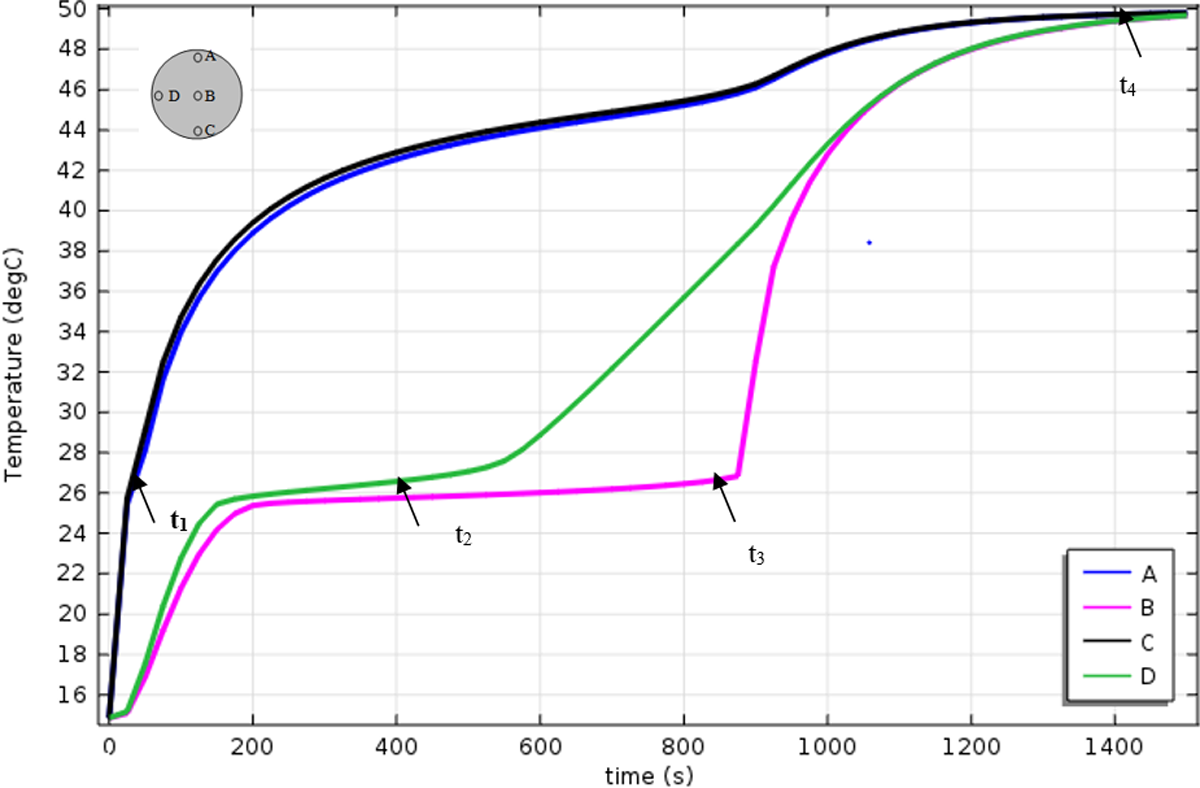
Figure 17 shows the time variation of the temperatures of pure RT27 at different locations (A, B, C, and D). It has been shown from computational and experimental 58,59 results that three different regimes occurred during the melting process are as follows: (a) pure conduction, (b) mixed convection/conduction, and (c) convection dominant.
Melting behaviors during the melting process.
The first stage is identified by dominance of conduction during which the supplied heat flux is used to eliminate the subcooling effect (
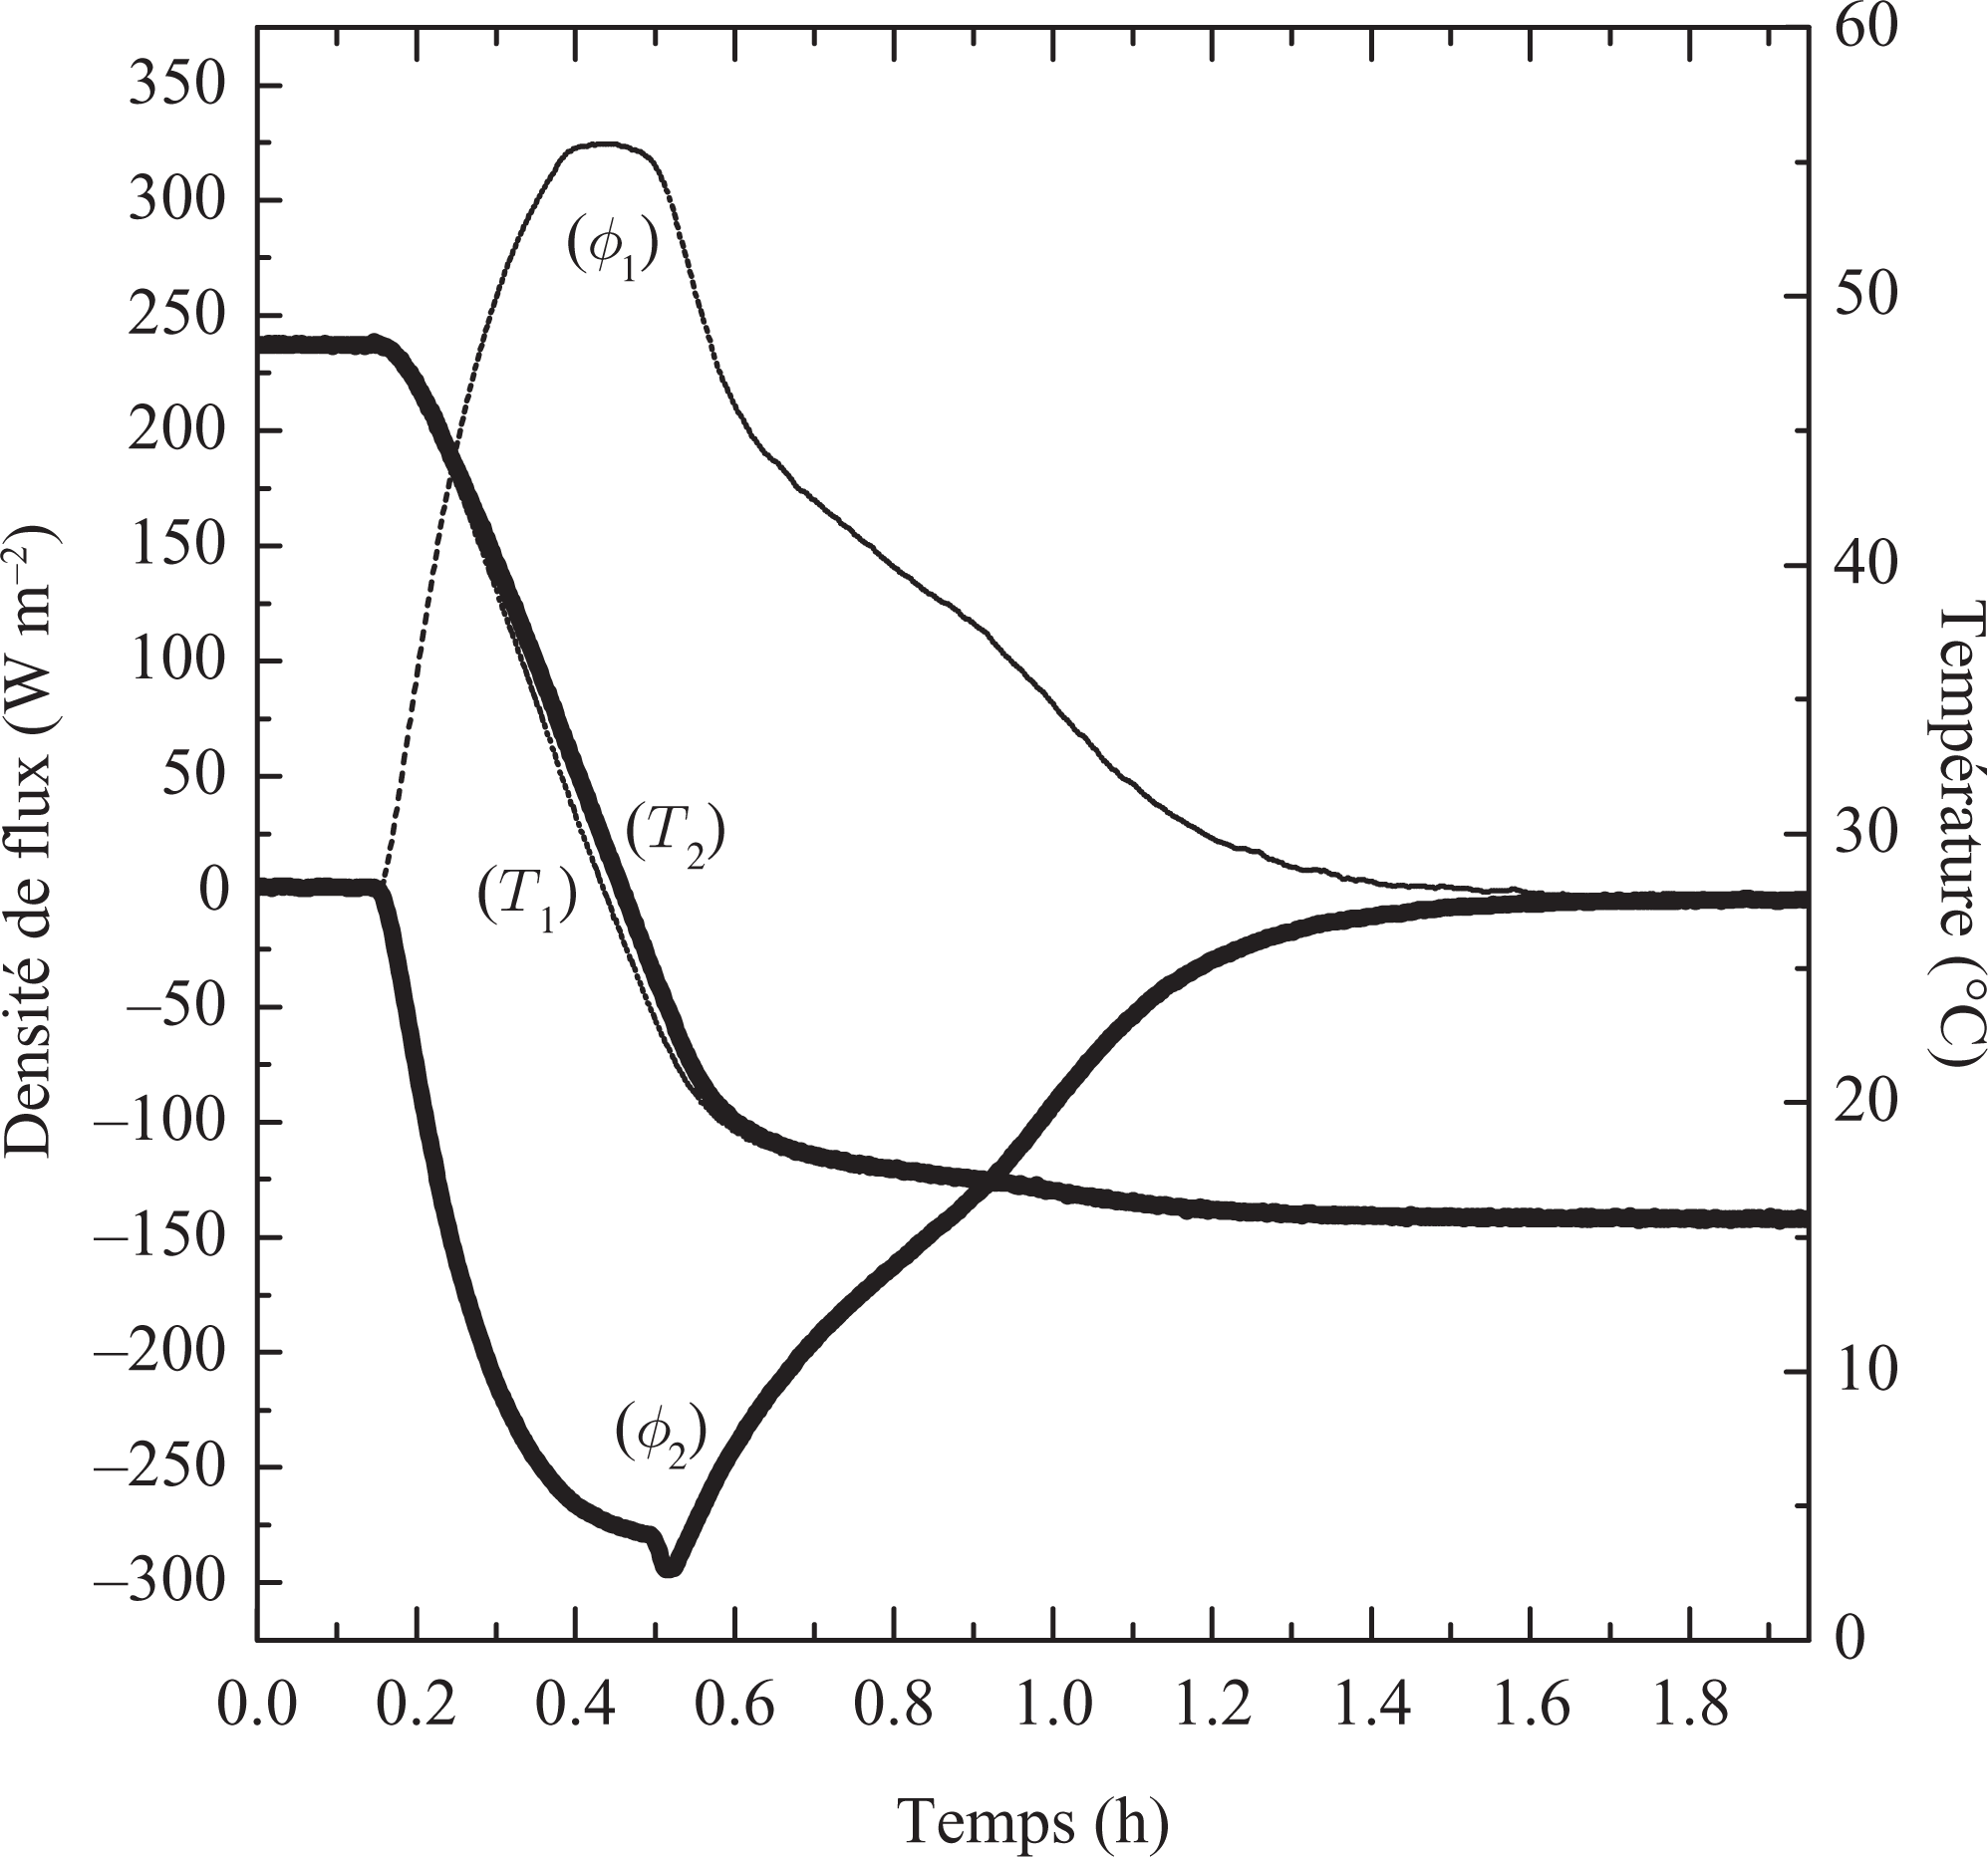
Temperature and density flux on the two faces of the sample for a ramp (15–50°C).
The solid–liquid phase change is the essential characteristic of the second stage. Isothermal solid–liquid phase change is identified during this stage where the applied heat flux is used for phase change without significant temperature rise, and this performance is the core advantage of using PCM in thermal storage or thermal protection where large amount supplied heat flux latently is absorbed or released at nearly constant temperature. This stage initiates at an early time for the upper and lower half and it is due to domination of natural convection, while it needs more time to begin at the middle horizontal plan where conduction is dominant.
When the PCM is completely melted at t = t 4, the third stage will starts with clear domination of natural convection and considerable temperature rise with fluctuations since the supplied heat flux is used for heating the melt liquid sensibly and therefore low temperature gradient and higher thermal stratification are recorded. This is related to domination of buoyancy effect as circulating flow exchange energy effectively throughout the liquid in the container.
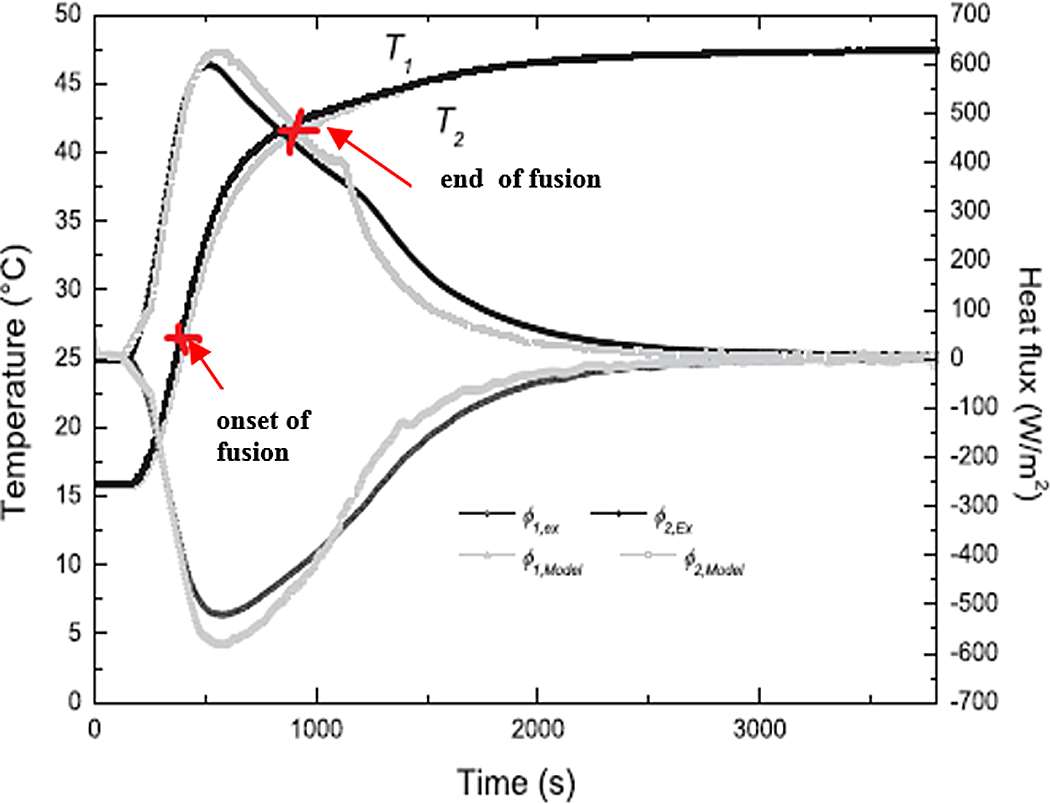
Figure 18 34 presents the evolution of heat flux measured and calculated in change phase during the temperature range (15–50°C). In this case, the three steps of heat transfer (solid, solid/liquid, and liquid) are highlighted and the period of every stage obtained from experimental data and simulation results is almost the same. Nevertheless, a little difference occurs between experiments and computational predictions in the region where both phases coexist. The difference could be justified by the behavior of the PCM 27 which is different after every solidification process and/or the effect of the pressure on the melting point of the PCM 27 in the sphere. Also, the result seems due to the difficulty, in the experiment, to control the measured temperature and heat flux with a good precision.
Conclusion
Recently, in building energy conservation, solar TES plays an important role, which is greatly assisted by the incorporation of LHS in building elements. LHS in a PCM has received considerable attention because of its high storage density with small temperature swing. In this study, a macroencapsulated resin/wax building material was successfully fabricated for TES. The commercial PCM RT 27 was selected for use in this composite due to their high latent heat. This article reports on the successful utilization of an experimental method, TGHPT, to measure simultaneously the temperatures and heat fluxes in order to characterize the phase-change effects. The objective of this article was to study thermal conductivity, thermal stability of these PCM composites, and the amount of energy exchanged during the variation of the samples thermodynamic states when the boundary temperatures vary. The results led to the following conclusion: PCM with its capacity of storing thermal energy as latent heat is a viable approach of the utilization of solar heat, a green source of energy, and the optimization of energy consumption in buildings. PCM is feasible in storing thermal energy in that particular way because of the endothermic/exothermic process of phase transition. The determination of the enthalpy of the composite (resin/wax) as a function of temperature with sufficient accuracy in enthalpy and temperature is crucial in applications for heating and cooling buildings.
The heat transfer characteristics of constrained melting process inside composites have been investigated numerically and the results have been compared with the experimental results.
The results provide that melting is dominated by conduction at early stages indicated by concentric solid–liquid interfaces parallel to the circular heated wall. At later times, natural convection is augmented and this affects the shape of the melting. Lower melting rate and temperatures are recorded in the middle horizontal plan of the sphere due to the developing role of conduction. An optimization will to be considered in future studies by introducing conductive particles to increase the thermal conductivity of the PCM.
Footnotes
Declaration of Conflicting Interests
The author(s) declared no potential conflicts of interest with respect to the research, authorship, and/or publication of this article.
Funding
The author(s) received no financial support for the research, authorship, and/or publication of this article.
References
Supplementary Material
Please find the following supplemental material available below.
For Open Access articles published under a Creative Commons License, all supplemental material carries the same license as the article it is associated with.
For non-Open Access articles published, all supplemental material carries a non-exclusive license, and permission requests for re-use of supplemental material or any part of supplemental material shall be sent directly to the copyright owner as specified in the copyright notice associated with the article.