
Abstract
The aim of this work is to investigate the degradation of low molar mass poly(ethylene terephthalate) (PET)/organically modified montmorillonite (OMMT) clay nanocomposites prepared by melt processing. The rheological behavior in combination with transmission electron microscopic images suggests an intercalation and therefore a percolating network. Furthermore, the results indicate that the increase of organoclay content caused a degradation of PET during processing of PET/OMMT nanocomposites, once it was observed the PET molar mass decreases. The effect mentioned could be attributed to an increase of Brønsted acidic sites on the platelet surface, which is produced by the Hofmann elimination reaction of ammonium, and also the presence of residual metal compounds on clay surface might possibly favored the polymer matrix degradation process.
Introduction
Poly(ethylene terephthalate (PET) is a semicrystalline thermoplastic polyester with satisfactory mechanical, physical, and chemical properties, including heat resistance, high stiffness and strength, and dimensional stability. 1 –4 However, many attempts have been made to further improve the PET properties by blending it with different nanofillers producing the polymer–clay nanocomposites. 1 –8
Polymeric nanocomposites have attracted considerable attention in recent decades due to their unique properties compared with those of conventional composites. 5 –8 Among these properties are higher strength, modulus, thermal stability, barrier properties, chemical resistance, and reduced cost. 1 –3 Layered silicate clays are particularly good candidates to improve these properties due to high surface area, swelling capabilities, and exceptionally stable oxide network. 1,2,4,5
From the morphological point of view, two ideal morphologies, defined as intercalated and exfoliated, describe the clay dispersion state in the polymeric matrix. In the intercalated structure, polymeric chains are inserted into the gallery space between the individual silicate layers. In contrast, in the exfoliated structure, the individual clay layers are dispersed in the polymeric matrix. However, complete exfoliation is rare, and most materials display a combination of multiple dispersion states. 9
Many PET/clay nanocomposites studies have been published in literature based on the melt intercalation and/or in situ polymerization methods, demonstrating an improvement in mechanical, thermal, and barrier properties when compared with the pristine polymer. 10 –12 From industrial and environment points of view, preparation of thermoplastic nanocomposites by melt blending using conventional plastic compounding tools is the best choice. However, this method can cause thermal decomposition of commonly used alkyl ammonium ions in modified clays, which may result in degradation of the polymer matrix. 13 –17
Despite these studies about PET nanocomposites in the literature, 1 –4,10 –13,17 –21 it is important to notice that just little 4,10 –13,17 is known about the influence of organoclay on the thermal stability of PET chains. Moreover, there is less supporting evidence and a disagreement on the subject. For example, Chang et al. 18 and Yuan et al. 19 reported an increased PET thermal stability in the presence of the organoclay. On the other hand, Xu et al. 13 investigated the systems of PET/organoclays with various contents of hydroxyl groups and absorbed ammonium via melting extrusion. The results indicated that clay structure as well as the different types of employed surfactants degradated the polymeric matrix.
Other authors have reported that the polymer matrix degradation is accelerated due to metallic components and surfactants presented in the clay. 4,13,17,22 Guan et al. 22 described that some metallic derivatives found in the montmorillonite (MMT) during the polycondensation process influenced the thermal stability of nanocomposites. Besides, the total quantity of these metallic derivatives is higher before the clay modification (sodium MMT), which accelerated the degradation during processing.
In this work, the rheological properties, morphology, thermal behavior, and PET molar mass of PET/OMMT nanocomposites, prepared using melt extrusion, were analyzed with the purpose of evaluating the influence of organoclay content on the PET degradation.
Experimental
Materials
In this study, PET was supplied by Mossi & Ghisolfi S.A. (M&G, Brazil) with low molar mass and intrinsic viscosity (IV) of 0.60 dL g−1. In this context, it is important to emphasize that the low molar mass of PET is defined as the polymer molar mass before the solid-state polymerization process. An organically modified montmorillonite (organoclay-OMMT), with a cation exchange capacity of 90 meq 100 g−1 and a real density of 1.98 g cm−3, commercially known as Cloisite® 30B clay, was obtained from Southern Clay Products, Inc. (Gonzales, Texas, USA). The ammonium cation of Cloisite 30B is reported to be methyl, dihydrogenated tallow quaternary ammonium.
Melt compounding and injection molding
PET and organoclay (OMMT) were dried under vacuum at 180°C and 80°C, respectively, for 12 h before use to prevent hydrolytic degradation during processing. PET was mixed with the desired quantity of organoclay (1, 3, and 5 wt%) and processed at one compounding step in a twin-screw extruder (length-to-diameter ratio = 20; ZSK-26 Mc, Coperion, Germany). The temperature profile was 160/170/190/230°C and screw rate was 250 r min−1. The PET/organoclay samples were named as follows: PET-0% (pure PET), PET-1% (1 wt% of OMMT), PET-3% (3 wt% of OMMT), and PET-5% (5 wt% of OMMT).
Parallel-plate rheometry
Linear viscoelastic measurements were carried out using Anton Paar–Physica Rheometer (MCR series, Germany) in the oscillatory shear mode with parallel plates (25 mm in diameter) at a wide frequency range from 0.1 rad s−1 to 500 rad s−1. Gap spacing of approximately 1 mm was set in all measurements. All the experiments were performed at 260°C, under nitrogen atmosphere to avoid oxidative degradation of the samples. The measurements were done in constant deformation.
Transmission electron microscopy
The nanocomposites morphology was examined in a Philips CM-120 transmission electron microscope (TEM; Amsterdam, the Netherlands). The microscope was operated at an acceleration voltage of 120 kV. Ultrathin sections, approximately 40 nm thick, were cut perpendicular to the sample plane at −140°C in RMC Products (Boeckeler, Tucson, Arizona)—Power Tome X (CR-X) cryo-ultramicrotome. The cut was performed at the LNLS Brazilian Synchrotron Light Laboratory, Brazil.
X-Ray diffraction
X-Ray diffraction (XRD) measurements were performed using a Philips X-Ray Diffractometer X’PERT multipurpose diffractometer model (PW3050/10) set up in reflection mode with incident copper Kα radiation (λ = 0.15418 nm) under 30 mA of current and 40 kV of voltage at 0.2°min−1 scan rate.
Differential scanning calorimetry
The differential scanning calorimetry (DSC) analyses were carried out in a DSC Q200 analyzer (TA Instruments, New Castle, Delaware, USA). The experiments were performed according to the following program:
Initial temperature: 30°C; First heating: from 30°C to 300°C (heating rate of 50°C min−1); Cooling: from 300°C to 50°C (cooling rate of 10°C min−1); and Second heating: from 50°C to 300°C (heating rate of 20°C min−1).
The results reported in this work correspond to the cooling and second heating runs. All DSC curves were normalized according to the sample mass. The degree of crystallinity (Xc) of PET in the nanocomposites was calculated using melting enthalpy (▵Hm) value of 100% crystalline PET (135 J g−1). 23
Oxidative induction time
The oxidative induction time (OIT) was carried out in a DSC Q200 analyzer (TA Instruments). Samples were heated at a rate of 20°C min−1 in an inert atmosphere of nitrogen from 40°C to 270°C. In this temperature, an isotherm was done for 5 min and then switched up the inert atmosphere to an oxidative atmosphere, using oxygen gas, for 35 min.
The OIT measurements were done simultaneously by extrapolating the isothermal baseline and the first slope of the exothermic peak. Duplicate experiments were performed to obtain more accurate results.
Thermogravimetric analyses
The thermal stability of the samples was analyzed by thermogravimetry in an STA 449 F3 Jupiter (NETZSCH Instruments, Germany), from 25°C to 800°C, at a heating rate of 10°C min−1 under argon flow (100 dm3 min−1). Duplicate experiments were performed to obtain more accurate results.
Intrinsic viscosity
The intrinsic viscosity (IV) measurements were performed in an automated microviscometer (AMVn) from Anton Paar at 30°C and determined by the Billmeyer equation 23 , from ASTM D 4603 (2011) 24 standard:

where η, ηrel, and c are the IV, relative viscosity, and concentration, respectively.
The samples were dissolved in a (60/40) w/w% phenol/1,1,1,1 tetrachloroethane solution under agitation and heating at 110°C. PET nanocomposites viscosity measurements were done according to the procedure reported by Xu et al. 13 using unfiltered solutions and calculated on the basis of polymer mass (not including clay). Triplicate experiments were performed in order to obtain more accurate results.
Results and discussion
Parallel-plate rheometry
In order to verify structural changes caused by the addition of clay in the PET matrix, parallel-plate rheometry was performed. Small amplitude shear test for PET and the nanocomposites was performed in the region of linear viscoelasticity. Figure 1 shows the results for complex viscosity as a function of frequency and some TEM micrographs.
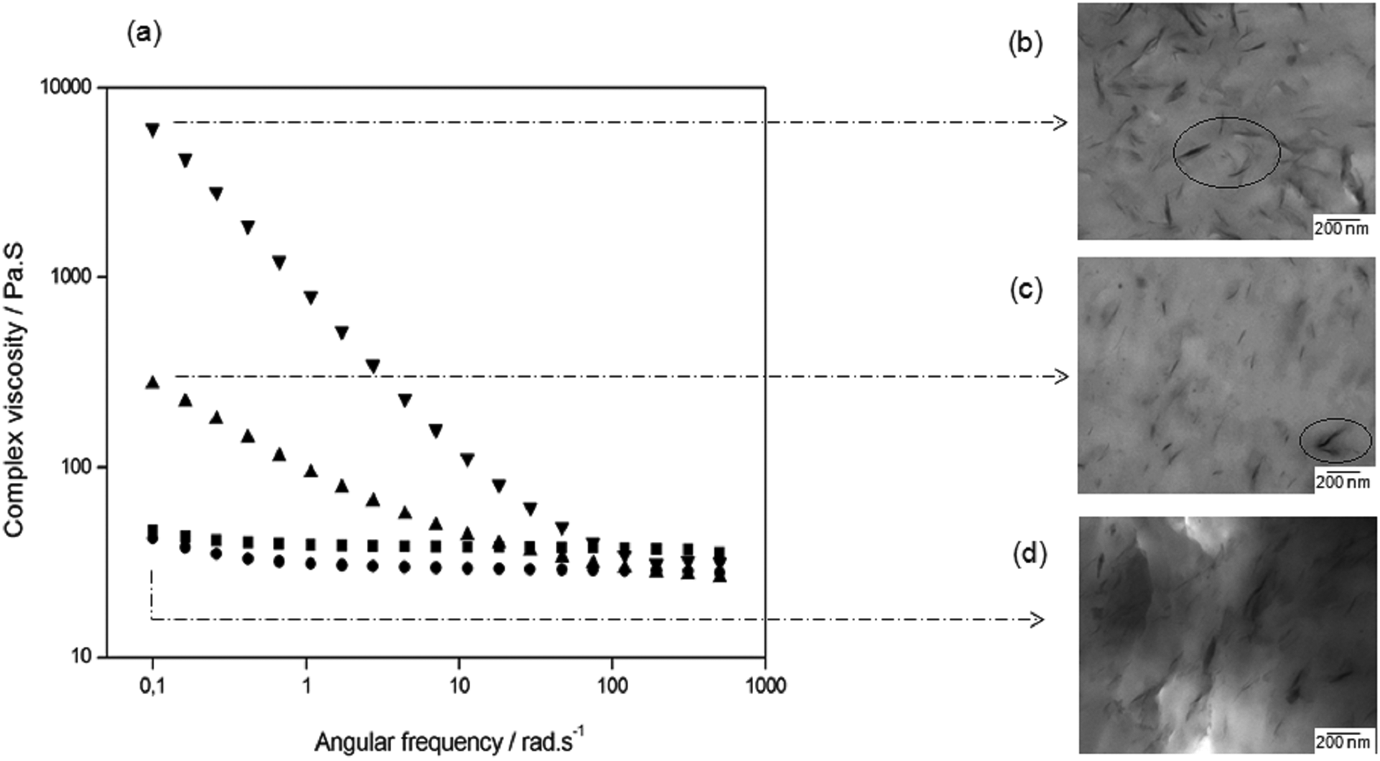
(a) Complex viscosity versus frequency for samples of (▪) PET-0%, (•) PET-1%, (▴) PET-3%, and (▾) PET-5%. TEM images of the PET/OMMT nanocomposites: (b) PET-5%, (c) PET-3%, and (d) PET-1%. PET: poly(ethylene terephthalate); TEM: transmission electron microscopy; OMMT: organically modified montmorillonite.
At lower frequencies, it is possible to see (Figure 1) that there is a significant increase in the complex viscosity for PET-3% and PET-5% samples (275 and 6.080 Pa·s, respectively) when compared to the material with a lower amount of clay (PET-1%, 42.5 Pa·s) and without clay (PET-0%, 46.6 Pa·s). Initially, we could consider that at a critical concentration (5 and 3 wt% of OMMT) and relatively low stress levels, the interactions between the clay-stacked lamellae are more pronounced, resulting in a three-dimensional structure, 4 as can be visualized using TEM micrographs.
Moreover, TEM micrographs of the nanocomposites with 1, 3, and 5 wt% OMMT contents were used to obtain visual information about the internal structure of the mixtures at the nanometer scale (Figures 1 and 2) and show the clay dispersion with stacked lamellae and a very small interlayer distance between them.
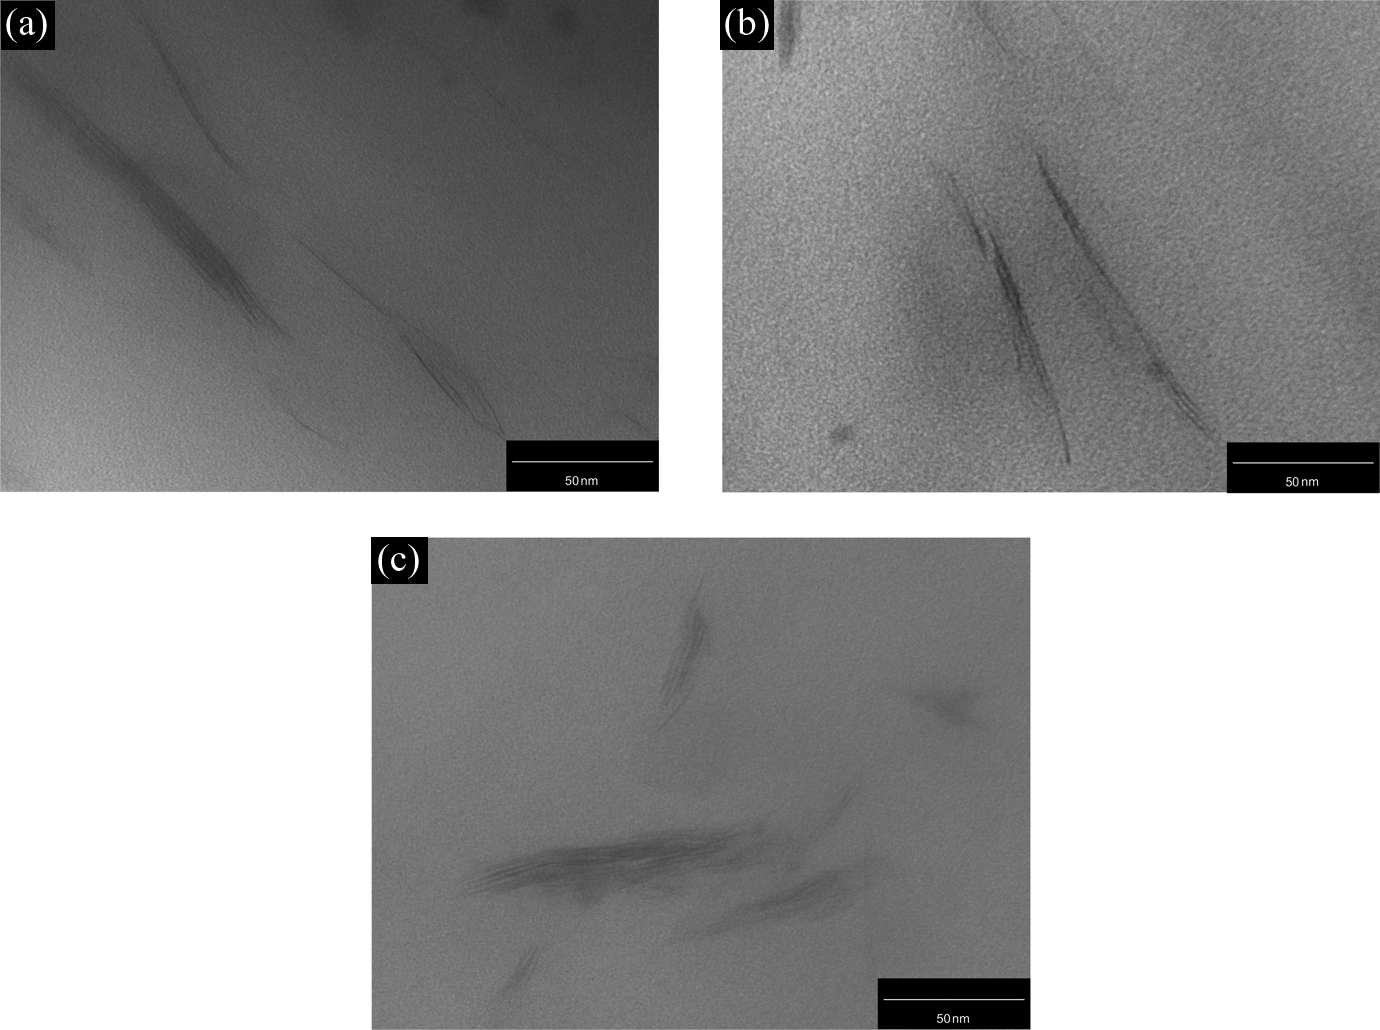
TEM images of the PET/OMMT nanocomposites: (a) PET-1%, (b) PET-3%, and (c) PET-5%. TEM: transmission electron microscope; PET: poly(ethylene terephthalate); OMMT: organically modified montmorillonite.
The organoclay studied in this work has hydroxyl groups, favoring the interactions with the carbonyl groups of the PET backbone. Furthermore, there are no exfoliated structures, which can be associated with the low molar mass of PET. This factor could cause the low stress transfer from PET to OMMT during processing.
It was also noticed in Figure 1(a) that the PET-0% and PET-1% present a purely Newtonian behavior over the frequency range. In other words, the complex viscosity unchanged with the angular frequency variation.
For PET-3% and PET-5%, a decrease in viscosity is observed as the frequency becomes higher, which is more pronounced for sample with higher clay loading.
At higher frequencies, it is noticed that the curves in Figure 1(a) practically overlap each other, indicating that the rheological behavior is basically dictated by the matrix and the influence of the OMMT is insignificant. For this same frequency range, it was noticed that the resultant tension is also greater. It could disaggregate and disrupt the three-dimensional structure since the clay particles are oriented and aligned with the flow direction. Furthermore, all the nanocomposites showed lower viscosity values than PET-0% for frequencies higher than 100 rad s−1, suggesting the possible degradation of these materials. Krácalík et al. 25 studied recycled PET/OMMT nanocomposites prepared via melt compounding and analyzed the effect of different organomodifiers on the properties of these materials. They observed a similar behavior as presented in this work. The authors attributed this behavior to a disruption of network and later to the orientation of filler particles in flow.
The storage (G′) and loss (G″) moduli of pure PET and the nanocomposites were evaluated from the results of the rheological analysis (Figure 3).
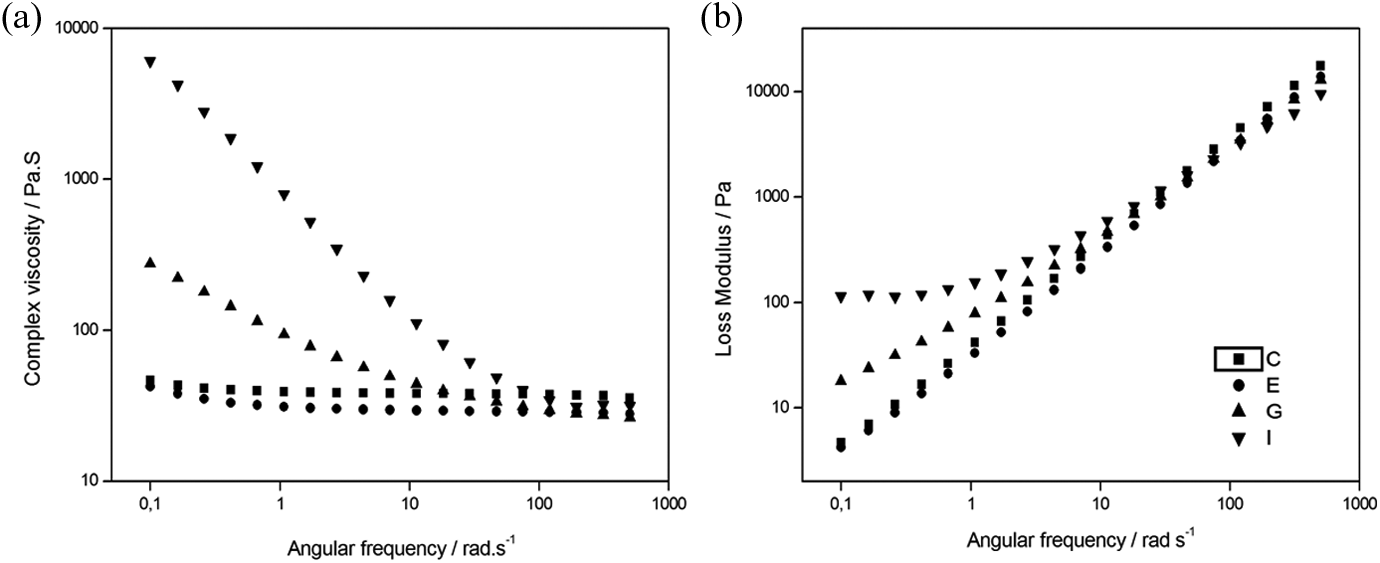
Storage modulus (a) and loss modulus (b) in a function of angular frequency for the samples (▪) PET-0%, (•) PET-1%, (▴) PET-3%, and (▾) PET-5%. PET: poly(ethylene terephthalate).
From Figure 3, it is observed that there is an increase in the values of G′ and G″ as the clay content increases. This behavior is more evident for G′ (Figure 3(a)). Several studies in the literature showed that the rheological response of filled polymers markedly differs from that of unfilled systems. 26 –28 In this study, for values above 1% of OMMT occurred a percolation threshold, the particle–particle and particle–polymer interactions dominated, and formed a secondary network structure, according to the results shown in complex viscosity. This structure breaks down in higher frequency, resulting in a behavior of G′ and G″ more alike.
The critical volume of filler loading defined in terms of percolation threshold depends on the number of silicate platelets per stacked lamellae in the polymer matrix. As observed by TEM micrographs, the stacked lamellae exhibited a considerable anisotropy and form a three-dimensional network. The clay lamellae rotate and relax completely. Thus, when G′ presents higher values than G″, it shows that the material has reached the percolation threshold and the clay formed a “lattice”. This behavior is observed for samples with clay contents of 3% and, especially, 5%.
The XRD patterns of organoclay (OMMT), in the polymer matrix, achieved after the processing operations are shown in Figure 4.
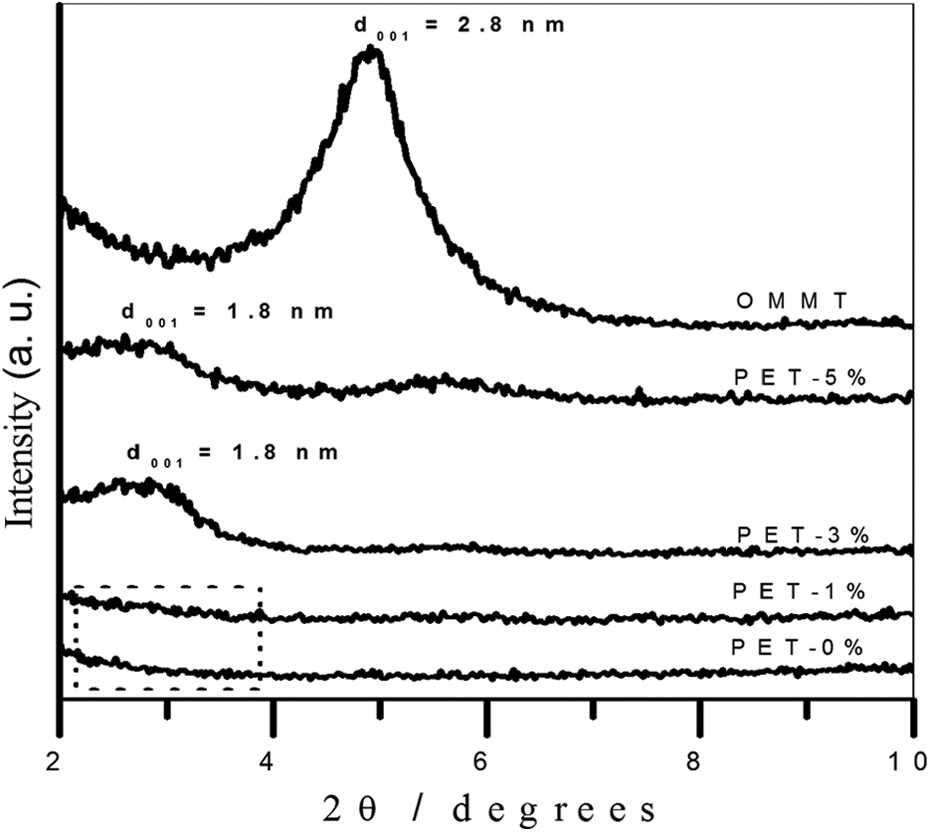
XRD patterns for organoclay (OMMT) and PET/organoclay nanocomposites. XRD: X-ray diffraction; OMMT: organically modified montmorillonite; PET: poly(ethylene terephthalate).
Figure 4 shows that the peaks are broad and in the compositions with 3% of OMMT (peaks not shown), after the range of 2.0° and 5.0°, which means that there is no harmonic series. The scientific literature describes this fact as an effect of the mixed structure on the silicate, 4,29 –31 corresponding to a disordered intercalation. 17 There is a coexistence of different kinds of tactoids, not perfectly ordered or with different interlayer distances. It generates uncertainty in the univocal determination of the structure of the silicate. 4
The XRD peak for pure OMMT shifted from 4.9° (d001 = 1.8 nm) to 2.8° (d001 = 3.2 nm) for PET nanocomposites filled with 5% and 3% of organoclay, suggesting intercalation of the polymer molecules in the clay galleries. In the case of PET-5% sample, another distinct broad peak at higher angles is added to PET with respect to OMMT, and it is associated with the coexistence of distinct tactoids structures. This behavior is according to those obtained by TEM.
For the PET filled with 1% of organoclay, the absence of the clay diffraction peak suggests clay delamination. However, this could also be related to the low organoclay content and/or to the platelets disorganization into the polymer matrix.
Thermal behavior and Intrinsic Viscosity
In order to evaluate the organoclay effect on the characteristic transition temperatures of PET as well as its effect on the crystallinity, DSC measurements (in inert atmosphere) were performed. Figure 5(a) and (b) shows DSC curves corresponding to cooling and the second heating, respectively, for PET and PET/organoclay nanocomposites.
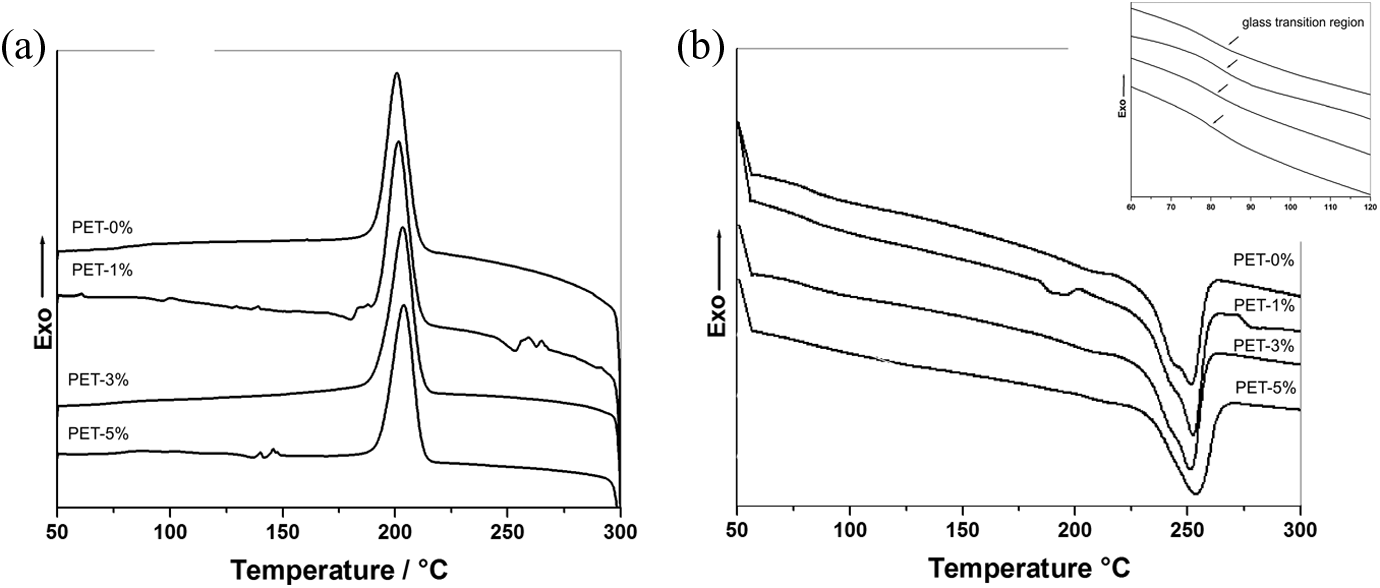
DSC curves of PET/organoclay: (a) non-isothermal crystallization behavior on controlled cooling at a cooling rate of 10°C min− 1 and (b) second heating up to 300°C at a heating rate of 20°C min− 1. DSC: differential scanning calorimetry; PET: poly(ethylene terephthalate).
The glass transition temperature (Tg; assumed as the temperature corresponding to the half width of the transition), the crystallization and melting temperatures (Tc and Tm), the crystallization enthalpy, ▵Hm, and Xc were obtained from the DSC curves (Figure 5), which are listed in Table 1.
Thermal properties of PET and PET/organoclay nanocomposites obtained by DSC.
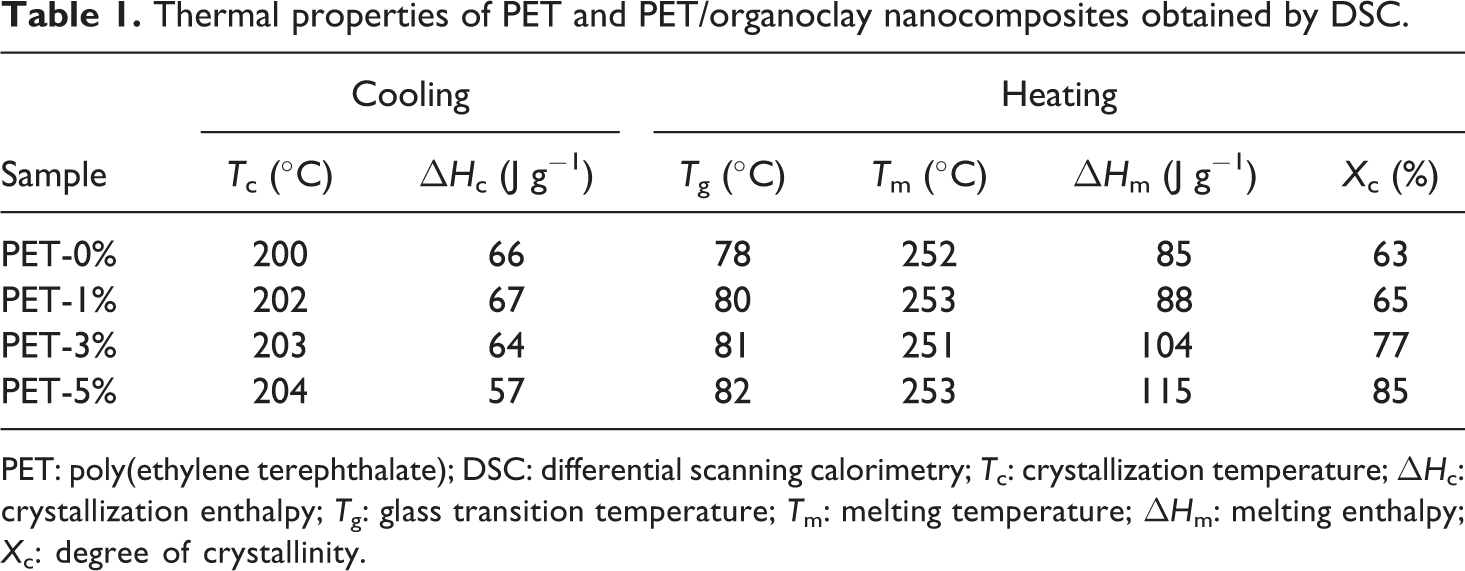
PET: poly(ethylene terephthalate); DSC: differential scanning calorimetry; Tc: crystallization temperature; ΔHc: crystallization enthalpy; Tg: glass transition temperature; Tm: melting temperature; ΔHm: melting enthalpy; Xc: degree of crystallinity.
The addition of organoclay causes a tendency to displace the Tg to higher values for the PET/organoclays nanocomposites containing 1, 3, and 5 wt% of OMMT. The Tg shift is strongly dependent on interface morphology, interparticle spacing, and polymer–nanoparticle interactions. 32 Furthermore, complex relaxation dynamics in the polymer/layered clay nanocomposites can be expected due to the geometrical constraint imposed by the two-dimensional space of the intercalated and exfoliated structures. 33,34
Paul et al. 9 described the change in the polymer matrix Tg with the nanosized particles content increase as a “nano-effect”. The Tg change is attributed not only to the extent of interaction between the polymer chains and layered clay but also to the confinement effect of the entanglement chains. Thus, the interplay of the confinement and surface effects dictates Tg shift. Additionally, the physical or chemical attachment of the polymer chains with the layered clay alters the segmental mobility due to the difference in the entanglement density and conformational entropy near the clay surface. Thus, strong interaction between the polymer and clay increases Tg. 35 –37 Regarding the PET/organoclay nanocomposites presented in this study, it is possible to associate the increase of Tg to the restriction of the segmental motion of PET backbone by the organoclay (OMMT), indicating favorable interactions between PET and the silicate layers.
The endothermic peak of the pure PET (PET-0%) appears at 252°C and corresponds to the Tm. The nanocomposites melting transition peaks were usually unchanged in the DSC thermograms. However, for the PET-3% and PET-5%, an increase of ▵Hm and Xc is observed. This behavior was associated with two distinct effects: (1) molar mass decrease and (2) increase of nucleation rate. So, this suggests that the organoclay could play a role on the amount of crystallizable material.
In the first case, with the possible molar mass decrease, the chains become more mobile and capable of forming crystallites. 4 However, the geometrical constraint imposed by the two-dimensional space of the intercalated and exfoliated structures shifted the Tg of PET to higher values with increasing concentration of OMMT. Even decreasing the PET molar mass, the clay can impose chains restriction. Thus, these cited factors are expected to balance themselves.
Secondly, the nanometric dispersion of silicate nanolayers in a polymer matrix provides a large interfacial area and promotes heterogeneous crystallization, so the clay platelets could act as a nucleating agent. 17 It was observed (Table 1) an increase in Tc for the nanocomposites when compared with PET-0%. This indicates the OMMT nanoparticles nucleation activity on PET crystallization. 3,38
The OIT was determined to investigate the organoclay effect in the oxidation stability polymeric matrix. Figure 6 shows the OIT thermograms for PET/OMMT nanocomposites and clearly indicates the difference in the heat flow for the samples.
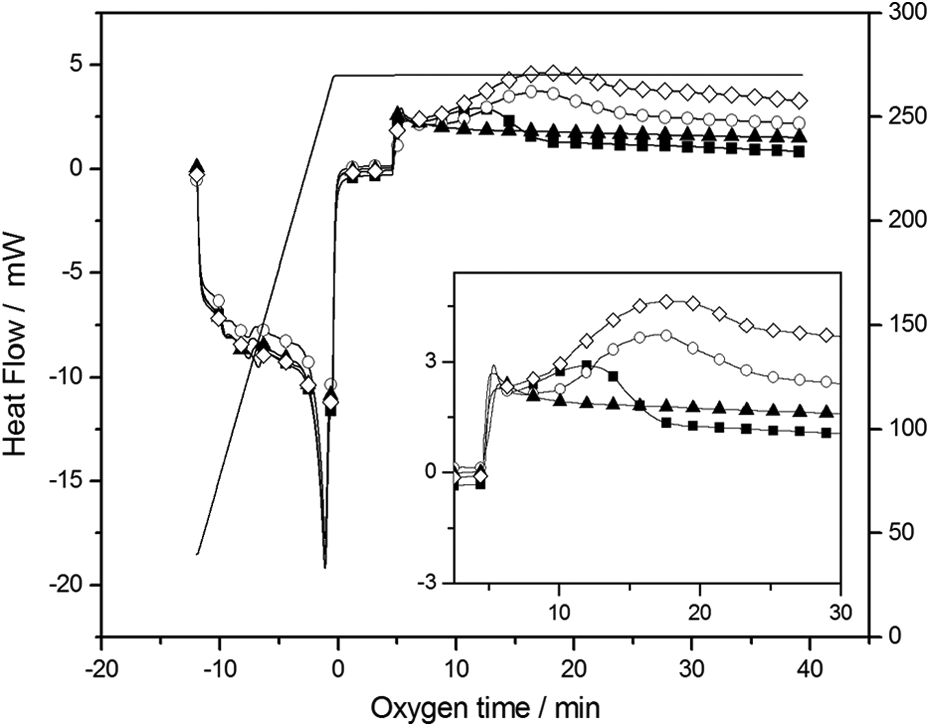
OIT curves of (▪) PET-0%, (○) PET-1%, (▴) PET-3% and (◊) PET-5%.; OIT: oxidative induction time; PET: poly(ethylene terephthalate).
Table 2 shows that the pure polymer (PET-0%) and PET/OMMT nanocomposites have almost the same induction time. Nevertheless, the nanocomposites show a larger variation of heat flow compared to the pure polymer, as it can be seen in Figure 6. Considering that the higher the heat flow variation, the greater the quantity of oxidized species. 39 Thus, probably more species in the nanocomposites are prone to oxidation as compared to PET-0%. It is important to remark that this effect may be verified for all samples, taking into account the duplicated tests. These results were also reported by Dominkovics et al. 40 who studied polypropylene/organoclay nanocomposites.
Average OIT performed for pure PET and PET/OMMT nanocomposites.
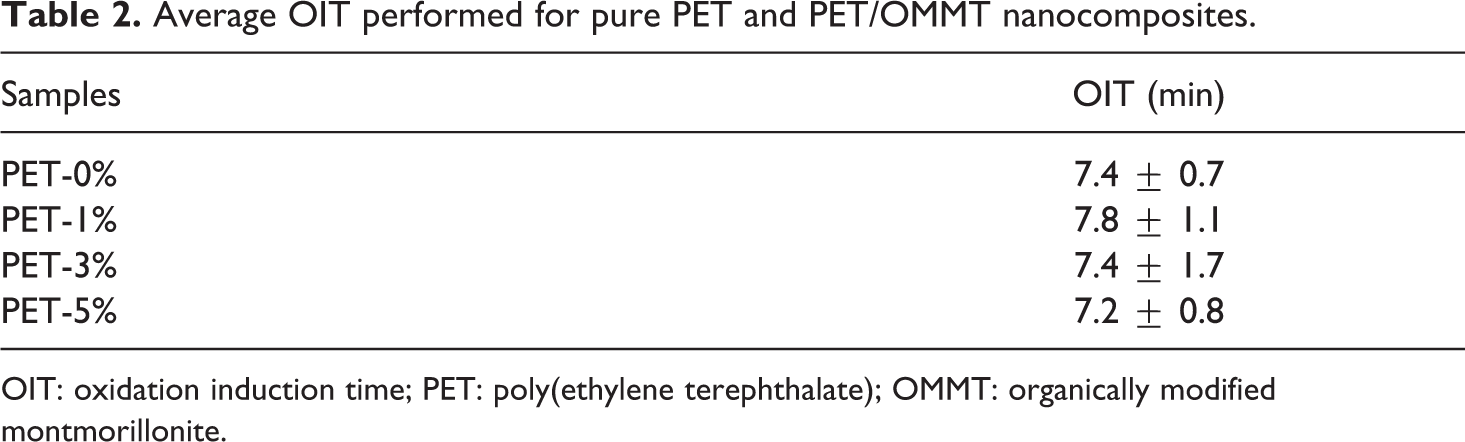
OIT: oxidation induction time; PET: poly(ethylene terephthalate); OMMT: organically modified montmorillonite.
To evaluate the possible thermal PET degradation caused by the OMMT, thermogravimetry experiments were carried out under inert conditions for all the PET/organoclay nanocomposites, as shown in Figure 7.
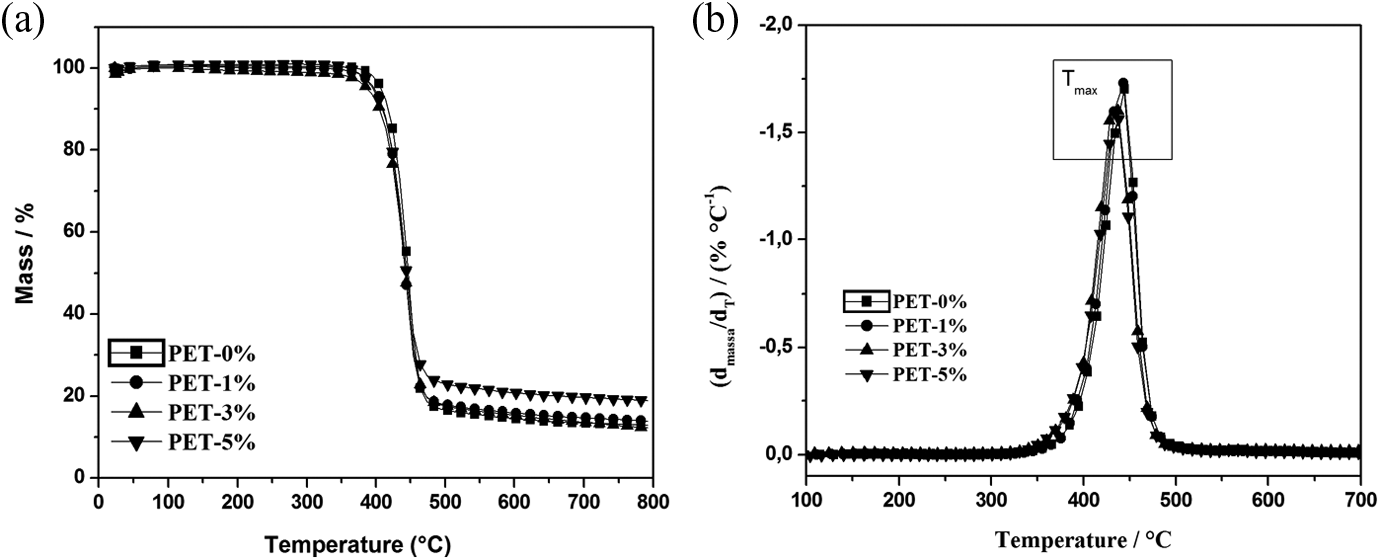
(a) TG curves and (b) first derivative curves of PET-0%, PET-1%, PET-3% and PET-5%. TG: thermogravimetric analysis; PET: poly(ethylene terephthalate).
The decomposition temperature (Td) at which there is 10 wt% (T10%) of mass loss, the maximum speed mass loss temperature (Tmax), determined by the maximum value of the first derivative, the difference between Tmax and T10% (ΔT), and the inorganic residues fraction (Re) at 650°C were obtained from Figure 7 and are shown in Table 3.
Parameters of TG curves of pure PET and PET/OMMT nanocomposites under inert conditions.
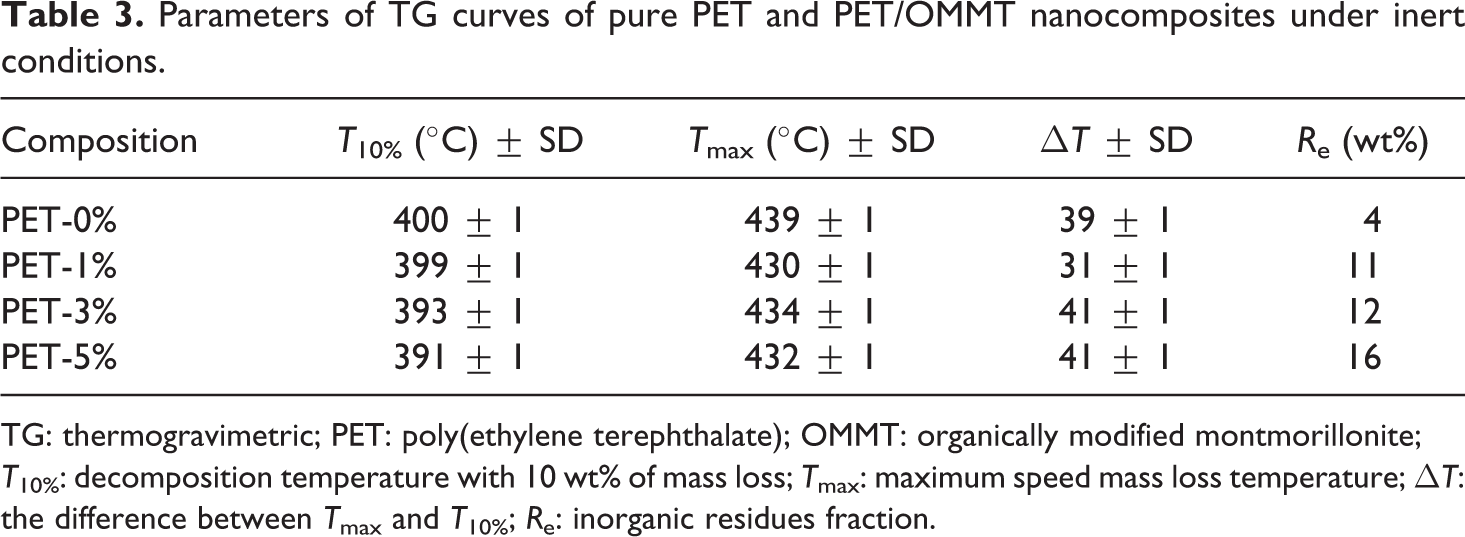
TG: thermogravimetric; PET: poly(ethylene terephthalate); OMMT: organically modified montmorillonite; T10%: decomposition temperature with 10 wt% of mass loss; Tmax: maximum speed mass loss temperature; ΔT: the difference between Tmax and T10%; Re: inorganic residues fraction.
It is observed that with the organoclay contents increase, the Td for 10 wt% of weight loss decreases, indicating that the presence of OMMT causes the polymer thermal instability.
From the values of ▵T, it is possible to obtain information on the mass loss kinetics. Accordingly, the larger the ▵T value, the slower the release or generation of volatiles during the degradative processes after to start the mass loss. The evaluation of this parameter shows whether the evolution of the mass loss up to its maximum occurs rapidly or slowly, enabling a comparison between pure and hybrid materials. Thus, from the results showed in Table 3, it is noted that the hybrid materials, with the exception of the PET-1%, show a tendency to release volatiles slower when compared to pure PET. The higher the increase of the organoclay concentration, the smaller the gases diffusion through the polymer mass due to the barrier effect caused by the difficulty in the removal of volatiles, 7,41 reducing the degradation kinetics. 42 In other words, the physical barrier provided by the organophilic clay lamellae can influence the reduction rate of radical formation and restrict the mobility of the polymer chains as well as the diffusion of volatiles by increasing the mean free path (Figure 8). 41,43
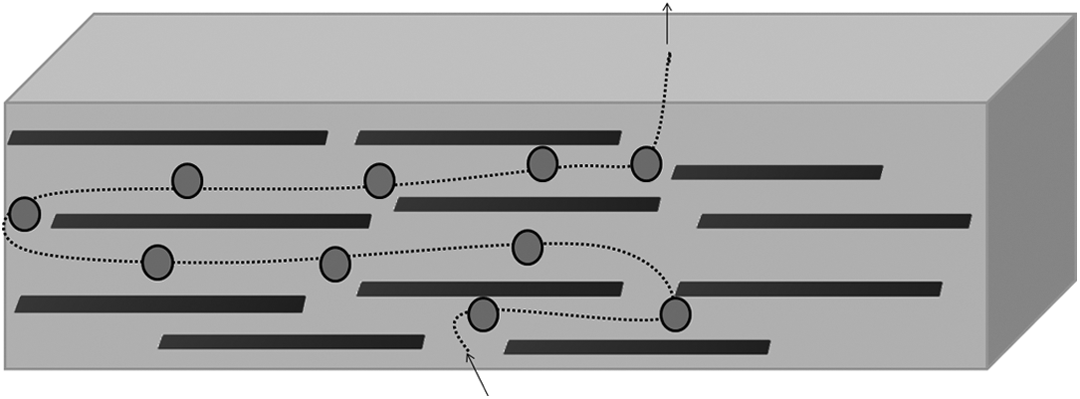
Schematic representation of the effect of the physical barrier provided by the lamellae organoclay in a polymeric matrix; (•) volatiles products originated by degradation.
Nanocomposites exhibit a gas transport mechanism similar to a semicrystalline polymer, which consists of a permeable phase (polymer matrix), and it is contained in one impermeable and dispersed platelets fraction, as described by Nielsen. 44
This effect was observed by Krump et al. 43 who studied the influence of the isothermal and non-isothermal crystallization of polypropylene/MMT nanocomposites prepared by melt intercalation.
To evaluate the possible degradation on the matrix, the IV was measured for pure PET and PET/organoclay nanocomposites (Table 4).
IV for pure PET and PET/organoclay nanocomposites.
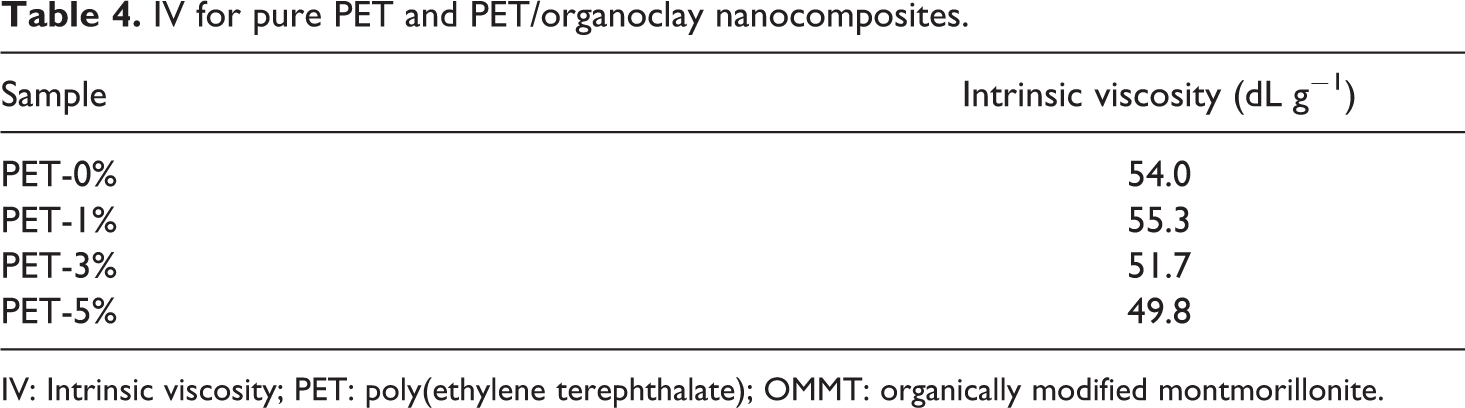
IV: Intrinsic viscosity; PET: poly(ethylene terephthalate); OMMT: organically modified montmorillonite.
As previously mentioned, the viscosity of PET nanocomposites was measured according to the procedure reported by Xu et al., 13 using unfiltered solutions and calculated on the basis of polymer mass, not including clay. Moreover, La Mantia et al. 4 tested solutions containing higher clay amounts as those used in this work and verified that the presence of the clay did not significantly influence the flow time and therefore the calculated intrinsic viscosity.
The polymer IV was essentially unchanged with the addition of 1 wt% of organoclay since the value is the same as for pure PET considering the standard deviation associated with this measurement. The addition of 3 and 5 wt% of OMMT shows a decrease in IV. Thus, the addition of this amount of organoclay, during processing, influenced polymer degradation, once the PET molar mass decreases. This is attributed, as described by some authors, 13,14 to the elimination of the ammonium modifier, which results in a substitution of the ammonium linkage on the clay with a hydrogen proton due to the β-carbon cleavage. So, the hydrogen proton present in the clays should be acting as the Brønsted acidic sites to accelerate the polymer degradation. The mechanisms of these reactions were proposed and represented in Figure 9(a) and (b).
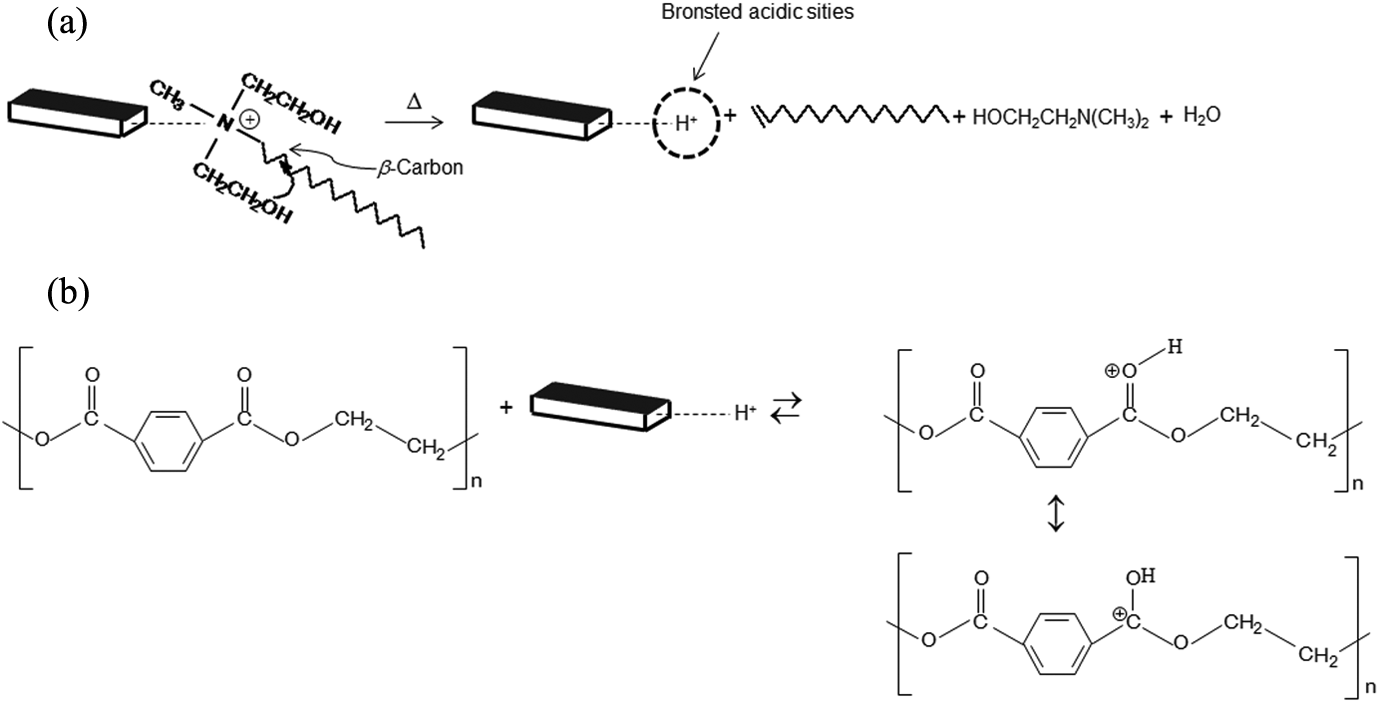
(a) The Hoffman elimination reaction for quaternary ammonium compounds in organoclays and (b) early PET degradation. PET: poly(ethylene terephthalate).
Despite having disconsidered the clay mass in the calculation, it is known that there should be interactions between the clay and the PET chains. It is expected an increase in the viscosity as the clay content increases. On the other hand, the viscosity decreases, and this is a strong evidence of matrix degradation. Moreover, the residual metal compounds on the clay surface could have favored the degradation process of the polymer matrix. These compounds usually accelerated the degradation reactions of PET and may be described as follows 45 :


where MX2 and MX are metallic compounds and RH is the polymer, in the early stage of the degradation which may result in free radicals.
In this context, Guan et al. 22 determined the amount of metallic derivatives released from different kinds of clays (MMT) and studied its effects on the thermal stabilities of PET/MMT nanocomposites prepared by in situ polycondensation. Inductively coupled plasma analysis of MMT was performed, and the results indicated that there are many kinds of metallic elements on it, such as sodium, magnesium, aluminum, calcium, zinc, iron, titanium, cobalt, nickel, copper, and manganese, which could accelerate the degradation during processing. Furthermore, the final result was the deterioration of processing stability of the nanocomposites.
In the present work, the decrease in thermal stability upon organoclay addition is attributed to the decrease in polymer molar mass due to the presence of Brønsted acidic sites on the platelet surface and the residual metal compounds available for polymer degradation during processing. This behavior was according to those present in dynamic rheometry and the thermal analysis.
Conclusion
In this work was studied the nanocomposites based on PET as matrix and OMMT (Cloisite 30B, modified with a polar organic salt) prepared by melt extrusion.
In summary, the parallel-plate rheometry shows that in lower frequencies, the interactions between particle–particle and particle–polymer are strong enough to generate a three-dimensional structure in the nanocomposites. Moreover, the rheological behavior in combination with TEM images suggests an intercalation and therefore a percolating network. This structure breaks down when higher ranges of frequency are reached and the complex viscosities for the nanocomposites become slightly lower than those of the pure polymer.
Finally, the results of IV, thermogravimetric and OIT analyses indicated that the increase of organoclay content caused degradation of PET since the PET molar mass decreases in intercalated nanocomposites. This effect can be attributed to an increased amount of Brønsted acidic sites on the platelet surface and the presence of residual metal compounds on the surface of the clay, which possibly favored the degradation process of the polymer matrix.
Footnotes
Declaration of Conflicting Interests
The author(s) declared no potential conflicts of interest with respect to the research, authorship, and/or publication of this article.
Funding
The author(s) disclosed receipt of the following financial support for the research, authorship, and/or publication of this article: The authors are thankful to CAPES (Coordenação de Aperfeiçoamento de Pessoal de Nível Superior) for the financial support from PNPD project.