
Abstract
This article holds significance in preparing nanocomposites with reasonably good strength and flexibility. Nanohydroxyapatite (nHA) and polypropylene glycol-coated nHA (PPG-nHA) were synthesized by sol–gel technique. Nanocomposites derived from immiscible blends of thermoplastic polyurethane (TPU) and polydimethylsiloxane (PDMS) rubber with nHA as the nanofiller were prepared by melt mixing technique and characterized. Transmission electron microscopic images display a significant extent of dispersion of modified and unmodified nHA in the blend matrices. Scanning electron microscopy results show that the incorporation of PPG-nHA leads to a reduction in the particle size of PDMS in the blends. Dynamic storage modulus against strain sweep study reveals the interaction between the polymer matrix and the filler increased by the surface coating of nHA with PPG. Surface coating of nHA with PPG led to the enhancement of physicomechanical properties of the blend nanocomposites. Thermogravimetric analysis shows the incorporation of PPG-nHA increases the degradation temperature of TPU-PDMS blends. Melt rheological studies of the blends and the blend nanocomposites reveal the shear-thinning behavior of the nanocomposites at all different filler loadings, and this shear thinning effect is more prominent in the case of composites at higher loading of the nanofiller.
Keywords
Introduction
Hydroxyapatite (Ca10(PO4)6(OH)2; HA) is widely used as a filler for biomedical applications such as orthopedic, dental, and maxillofacial implants because of its excellent biocompatibility and osteoconductivity. Application of virgin HA is limited because of its brittleness and low fatigue resistance. However, its composites with polymers exhibit excellent advantages as biomaterials. Natural bone mainly consists of nanosized HA crystals. Thus, nano-hydroxyapatite (nHA)–based nanocomposites with polymers have drawn tremendous attention among scientists and technologists in the field of biomedical engineering applications. Polymer/HA composites have generated tremendous interest in the recent years as bone substitute and repairing materials. Synthesis of nHA in nanometer scale has created great interest because of its reinforcing nature in polymer matrices. Sol–gel process, coprecipitation technique, and hydrothermal synthesis are some of the popular techniques adopted to synthesize nHA. Lower processing temperature, homogenous dispersion, and ability to generate nanocrystalline powders make the sol–gel technique a better choice for synthesizing nHA. 1 –4 Polyurethanes, especially thermoplastic polyurethanes (TPUs), have become a buzz word in the polymer industry more so in the biomedical, footwear, wire and cable, as well as adhesive and coating industries apart from the automotive industry. Blood bags, different types of vascular catheters, small caliber vascular grafts for vascular access, mammary implants, pacemaker connectors, suture materials, and matrices for controlled drug release have been developed based on TPU in the recent years successfully because of its biocompatibility. TPU has higher durability, excellent fatigue resistance, higher abrasion resistance, and supreme mechanical strength properties among a cluster of other synthetic polymers known in the recent years. TPUs can be processed like any other thermoplastics using techniques such as extrusion, molding, casting, and electro-spinning. This property makes TPU a suitable candidate for designing intricate-shaped articles and devices for biomedical applications. 5,6 Polydimethylsiloxane (PDMS) elastomers are being used extensively in a wide range of biomedical applications such as blood pump, cardiac pacemaker leads, mammary prostheses, artificial skin, and maxillofacial reconstruction because of their excellent biostability, biocompatibility, physiological inertness, higher temperature resistance, and oxidative stability. Studies have been carried out earlier to improve the biocompatibility of silicone elastomers through various techniques. 7 –9 Melt blending of polymers has become an inexpensive route to develop new materials that combines the functionalities of the individual polymer components. Thus, blends of TPU with silicone rubber imparts properties such as excellent mechanical strength, fatigue resistance, and ease in processability of TPU combined with the biocompatibility and thermal stability of PDMS rubber. These properties will make the TPU-PDMS blend an ideal biomaterial. In the earlier works, the authors have shown that the blends of TPU and PDMS rubber develop the desired phase morphology by controlling the processing parameters and also through in-situ compatibilization to achieve improved mechanical strength properties suitable for biomedical applications. 10 –13
In the present study, the authors have attempted to investigate the synthesis and characterization of HA nanorods and the preparation of n-HA composites derived from TPU-PDMS immiscible blends. The surface of the n-HA nanorods was modified with polypropylene glycol (PPG) to enhance the interaction with the polymer matrices to achieve good mechanical strength, good stiffness, and flexibility. The blend nanocomposites have been characterized for their mechanical, dynamic mechanical, thermal, morphological, and rheological properties.
Experimental
Materials and sample preparation
TEXIN® RxT85A, an aromatic polyether-based TPU with specific gravity of 1.12 and a melt flow index of 4 g/10 min at 190°C/8.7 kg was kindly provided by Bayer Material Science (Chennai, Tamilnadu, India). PDMS grade, Silastic WC-50™ with a specific gravity of 1.15 was supplied by Dow Corning Inc. (Midland, Michigan, USA). Calcium nitrate (Ca(NO3)2·4H2O), diammonium hydrogen phosphate ((NH4)2HPO4), and n-butanol were procured from Sigma Aldrich (Bengaluru, Karnataka, India). PPG of molecular weight 660 was purchased from Merck (Mumbai, Maharashtra, India).
Synthesis of n-HA
nHA has been synthesized in aqueous solutions according to the method proposed by Narasaraju and Phebe. 14 The pH values of the solutions of Ca(NO3)2·4H2O and (NH4)2HPO4 were adjusted to be more than 10 with ammonia solution. They were then mixed with a stoichiometric ratio of calcium to phosphorus of 1.67. After the reaction was completed, the precipitate was rinsed several times with distilled water until the pH value reduced to 7. In order to avoid serious aggregation of the ultrafine powder during drying, water in the precipitate was replaced by n-butanol. Then, the precipitate was dried at about 80°C and calcined at 400°C.
Synthesis of PPG-coated n-HA
PPG-coated n-HA has been synthesized in aqueous solutions according to the method proposed by Selvakumar et al. 15 The pH values of the solutions of Ca(NO3)2·4H2O and (NH4)2HPO4 were adjusted to be more than 10 with ammonia solution. Then, 2 ml of PPG was added to Ca(NO3)2·4H2O solution, and both the solutions were mixed with a stoichiometric ratio of calcium to phosphorus of 1.67, followed by stirring for 2 h. The pH of the reaction medium was kept at 10 using ammonia solution. The resultant precipitate was filtered and dried at 90°C overnight. Calcination process has not been performed on the in-situ-prepared PPG-coated nHA crystal because the PPG coating might get degraded at higher temperatures. From here on, the pristine (unmodified) and PPG-coated HA nanorods will be referred as nHA and PPG-nHA respectively. The following well-established reaction explains the precipitation method of HA crystal formation. 1,3,16

Preparation of nanocomposites
Blends of TPU and PDMS were prepared in a Brabender Plastograph® EC (digital 3.8-kW motor, a torque measuring range of 200 Nm, at a speed range from 0.2 to 150 min−1) per the procedure established in an earlier publication. 10 TPU was allowed to melt at 190°C after which the unmodified n-HA/PPG-modified n-HA was added to it, and the blend was mixed in the plastograph for two more minutes. At the next stage, PDMS was added and melt blended for another 3 min in the plastograph. Composite formulations prepared as mentioned above were compression molded to obtain tensile sheets of approximately 2 mm thickness, using a thermoplastic compression molding press (Moore Press, GE Moore and Son, Birmingham, UK) at 190°C for 3 min at a pressure of 7 MPa. The designation of the composites follow the empirical formula TxPy(UH/MH)z and TxPy for blends. “T,” “x,” “P,” and “y” indicate TPU, wt% of TPU in the blend, PDMS, and wt% of PDMS in the blend, respectively. “UH,” “MH,” and “z” indicate unmodified n-HA, PPG-coated n-HA, and parts per hundred resin (phr) of the n-HA in the blends, respectively. For example, the designation T90P10UH3 denotes the nanocomposite containing 90 wt% TPU, 10 wt% PDMS, and 3 phr of unmodified n-HA.
Characterization
FTIR spectroscopy
Fourier transform infrared (FTIR) spectra were investigated to analyze the authenticity of the procedure of synthesis of n-HA. FTIR study of nanofillers has been carried out using a Perkin Elmer FTIR spectrophotometer (model spectrum RX I; Waltham, Massachusetts, USA), within the range of 400–4400 cm−1 at a resolution of 4 cm−1 by preparing potassium bromide pellets of the powdered samples. An average of 16 scans was acquired for each sample.
XRD studies
X-Ray diffraction (XRD) study of the n-HA was carried out with the help of Philips PW-1710 X-ray diffractometer (Eindhoven, The Netherlands) provided with crystal monochromated copper Kα radiation (λ = 1.540598 Å) in the angular range of 10°–80° (2θ) with an accelerating voltage of 40 kV and a current of 20 mA.
TEM studies
The morphology of n-HA and the dispersion of n-HA in the blend matrix were analyzed with high-resolution transmission electron microscopy (TEM; JEM 2100, JEOL, Japan) with lanthanum hexaboride target, operating at 200 keV and with an average beam current of 116 μA. The samples of HA for TEM were prepared by dispersing a small amount of the sample in ethanol and ultrasonicated for 30 min. Two drops of the resultant suspension were dropped onto a copper grid and was dried in a desiccator before observing under the microscope. The nanocomposites samples for the TEM analysis were prepared by ultra cryomicrotomy. Since the samples are elastomeric in nature at ambient temperature, the temperature for microtomy is kept at −80°C, which is almost 30°C lesser than the Tg of the main component, that is, TPU. At this temperature, the samples are hard like in glassy state, which favors ultra cryomicrotome easily. Freshly sharpened glass knives were used to get very thin cryosections. The cryosections were placed onto a copper grid and were dried in a desiccator before observing under the microscope.
SEM studies
A JEOL JSM-5800 scanning electron microscope was used to study the dispersion of PDMS rubber and phase morphology of the binary blend of TPU and PDMS rubber and its nanocomposites. The blends and nanocomposites were subjected to cryofracture in liquid nitrogen, and the PDMS phase was selectively extracted from the specimens using toluene as the solvent. Before examination, the fracture surfaces were dried in an oven at 70°C, cooled to room temperature in a desiccator, and then sputter coated with a thin layer of gold in a vacuum chamber. The specimens were subjected to scanning electron microscopy (SEM) at 0° tilt angle. Particle size of the dispersed phase was analyzed using the image processing tolbox of MATLAB.
Mechanical properties
Dumbbell specimens were punched out of the molded tensile sheets, and tensile properties were measured per ASTM D 412 standard using a Zwick/Roell BX1-EZ005.A4K-00 universal testing machine at ambient temperature and at a crosshead speed of 500 mm min−1. Five specimens of each sample were tested, and the average value is reported.
Hysitron TI 950 nanomechanical test equipment was used to study the surface mechanical properties of TPU-PDMS nanocomposites. Displacement-controlled quasi-static test was performed on the sample. Five indentations were measured to obtain average values of reduced modulus (Er), can be analyzed from the unloading curve using the following relation:
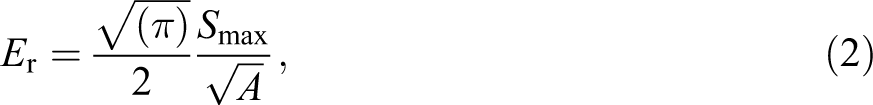
where Smax is the slope of the unloading curve at the point of maximum load and A is the projected contact area.
Thermogravimetric analysis
Thermogravimetric analysis (TGA) of the blends and their nanocomposites were carried out using TGA Q500 (TA instruments, New Castle, Delaware, USA) in the temperature range from 35°C to 600°C at a heating rate of 10°C min−1 under nitrogen atmosphere.
Dynamic mechanical analysis
Strain sweep experiments on the blends and the nanocomposites were carried out using a dynamic mechanical analyzer (Metravib 50N, France). The experiment was carried out at 25°C under tension mode at a frequency of 1 Hz. The strain range is varied from 0.01% to 20% and the static pre-strain of 0.5% was applied to all samples to avoid buckling. Storage modulus of the samples with respect to the strain was measured.
Melt rheology study
Rheological characteristics of blends and nanocomposites were studied using a Monsanto processability tester, a microprocessor-controlled programmable capillary rheometer using a capillary with length/diameter ratio of 20. The flow behavior was studied at a temperature of 190°C and at 7 different shear rates (12.26, 61.33, 122.66, 306.5, 613.3, 919.5 and 1226 s−1).
The apparent shear rate (Ϝa), apparent shear stress (τa), and apparent viscosity (ηa) were calculated using the following mathematical expressions:
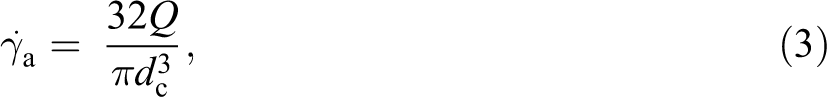
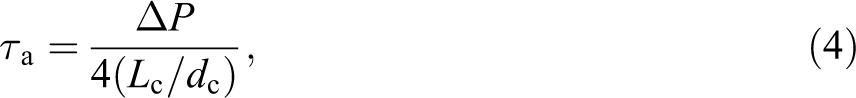
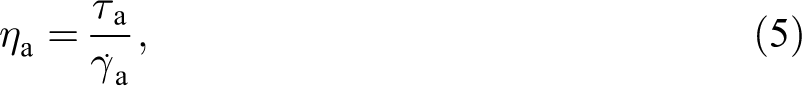
where Q is the volumetric flow rate of melt in cubic meter per second (Barrel cross section area × plunger velocity); dc is capillary diameter in meter; Lc is capillary length in meter, and ΔP is pressure dip across the capillary in pascals. 17
Results and discussions
FTIR analysis of unmodified and PPG-modified n-HA
Figure 1 shows the FTIR spectra of n-HA and PPG-modified n-HA. The spectra showed a very weak band around 3720 cm−1, sharp and a medium sharp band at 3570 cm−1, and a weak broad band between 3550 and 3350 cm−1. The peaks at 3720 and 3570 cm−1 bands correspond to OH− group, and the broad band at 3570–3350 cm−1 corresponds to strongly adsorbed H2O. The two medium sharp peaks at 633 and 3570 cm−1 are due to vibrational OH− and structural OH−, respectively. The medium band at 1633 cm−1 is assigned to adsorbed water, and the broad band at 3428 cm−1 may be due to the lattice H2O. Bands at 1040, 946, 603, and 569 cm−1 are assigned to the vibration of the phosphate group,
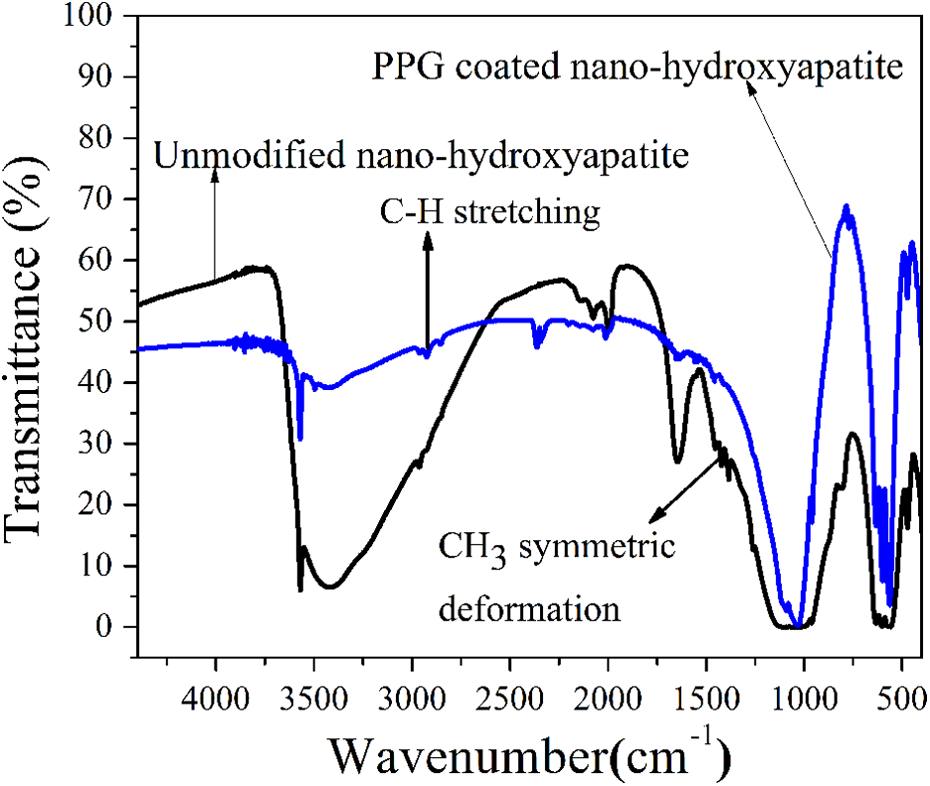
FTIR spectra of nHA and PPG-modified nHA. FTIR: Fourier transform infrared; nHA: nanohydroxyapatite; PPG: polypropylene glycol.
XRD study of unmodified and PPG-modified nHA
Figure 2 compares the XRD patterns of unmodified and PPG-modified nHA. The characteristic peaks at 2θ regions of 26°, 29°, 32°–34°, 40°, and 46°–54° indicated the crystalline nature of HA and the peaks at the diffraction angles at 26°, 32°, 33°, and 40° (2θ) are attributed to (002), (211), (300), and (310) diffraction planes, respectively. 4 Figure 2 confirms that unmodified and PPG-nHA show similar XRD pattern. The diffracted peaks of unmodified HA ((211), (300), (202)) are consistent with those of the PPG-nHA, and therefore, the bulk properties of the PPG-nHA remains the same. Surface modification is an event occurring only at the HA surfaces. If the chemical reaction alters the state of the bulk properties such as crystallinity and the crystalline phase, the resulting HA loses its inherent properties. But similarity in the XRD pattern for both the modified and unmodified nHA confirms that the surface coating did not induce any change in the crystalline phase of HA. The average crystallite size of the nHA crystals were determined by the full width at half maximum (FWHM) of the XRD peak using Scherrer’s equation as follows:
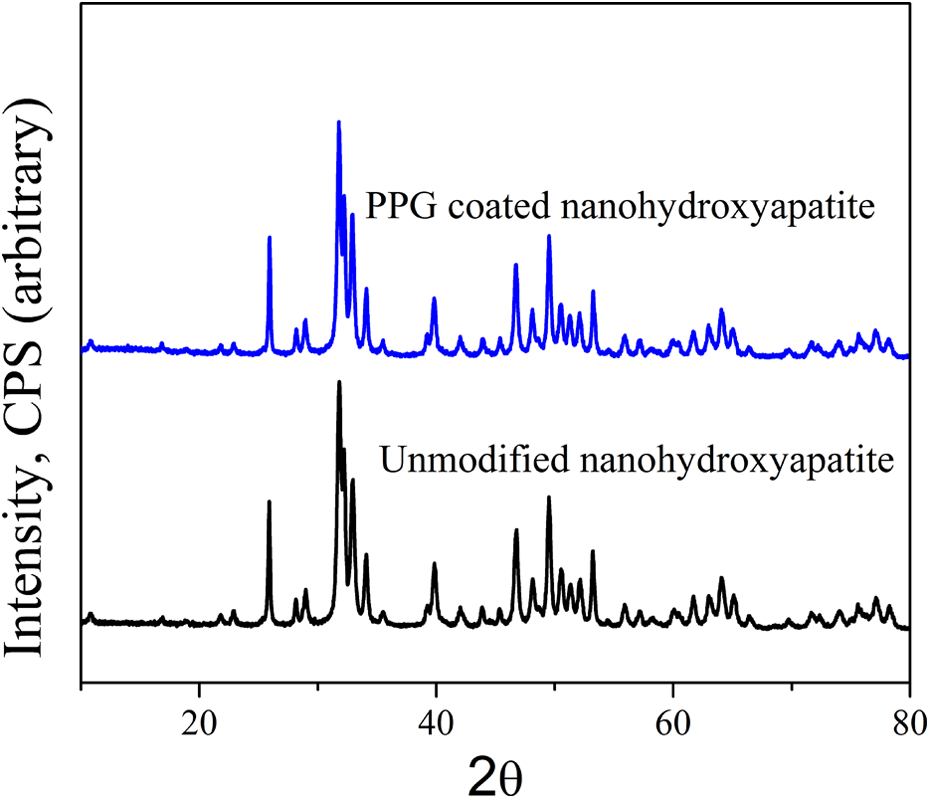
XRD patterns of unmodified and PPG-modifiednHA. XRD: X-ray diffraction; PPG: polypropylene glycol; nHA: nanohydroxyapatite.
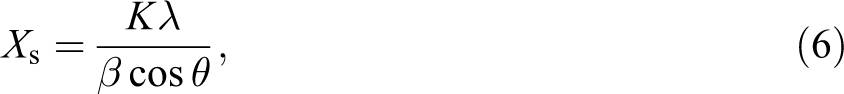
where Xs is the size of the crystallite, λ is the X-ray wavelength, β is FWHM of the diffraction peak, θ is the diffraction angle, and K is the Scherrer’s constant. K value for usual crystals is 0.9). 19 The crystallite size was estimated using the reflections of various planes, and it is tabulated in Table 1. This confirms that the coating of PPG does not induce the dislocation of nHA crystal structure, rather it only slightly changes the crystallite size.
Crystallite size of nHA and PPG-modified nHA crystal with respect to various reflection planes.
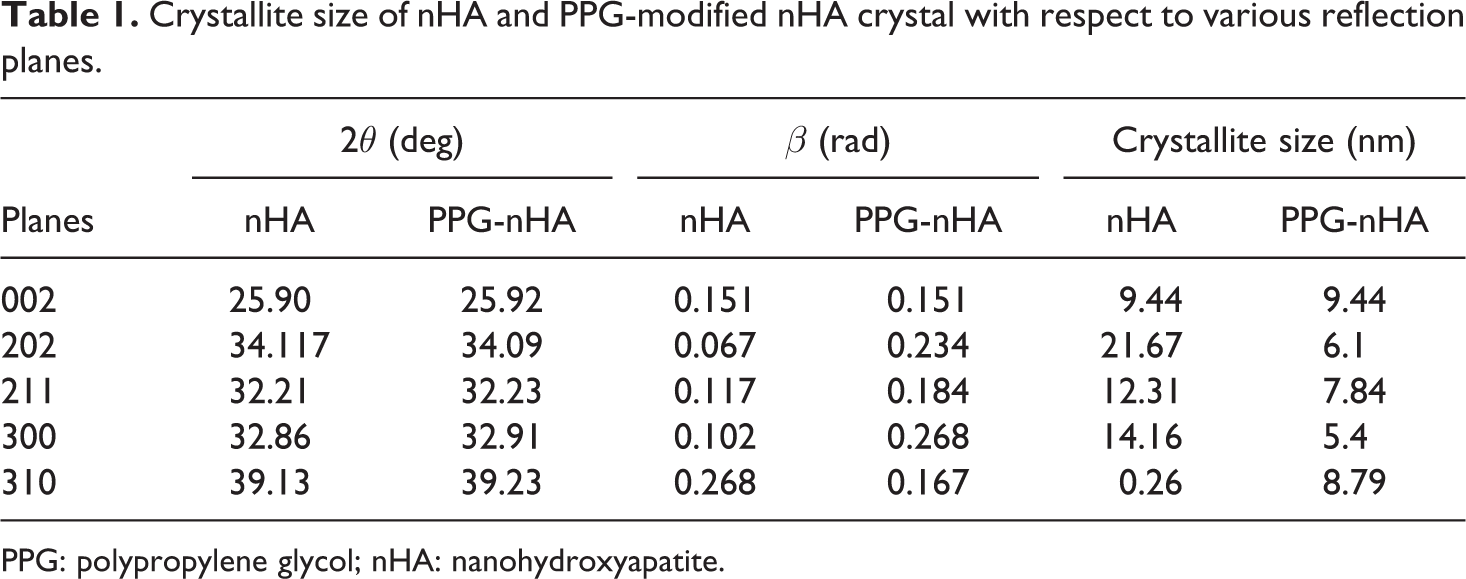
PPG: polypropylene glycol; nHA: nanohydroxyapatite.
TEM analysis of unmodified and PPG-modified nHA and nanocomposites
Figure 3 shows the TEM images of unmodified HA. They were found to be in the form of cylindrical nanorods. As shown in Figure 4, PPG-coated HA was also shaped in the form of cylindrical nanorods, but the size of the nanorods were different from that of unmodified nHA. The diameter and the length of the nanorods were measured using ImageJ software, and the results are listed in Table 2.
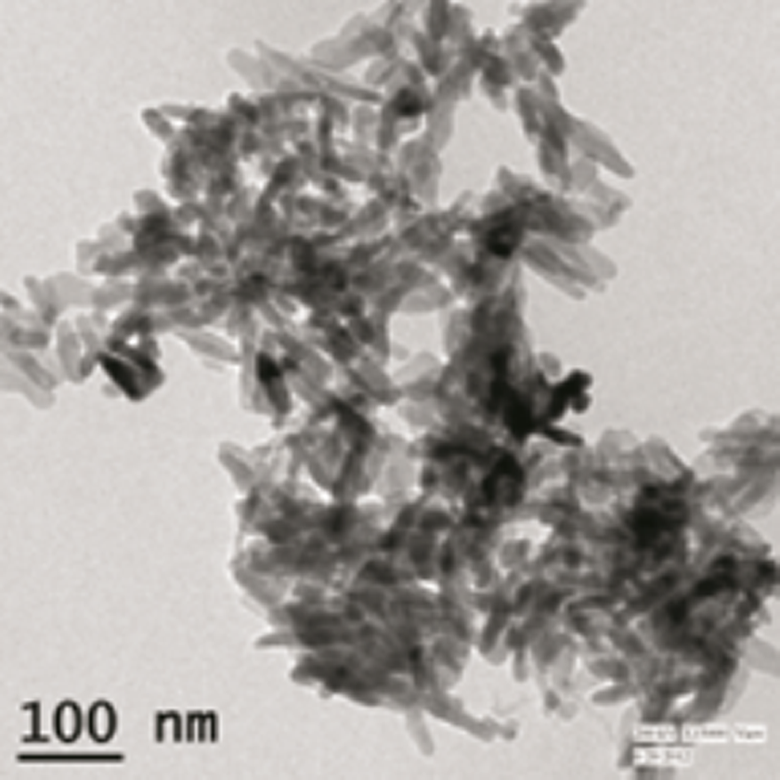
TEM images of unmodified HA, which were found in the form of cylindrical nanorods. TEM: transmission electron microscopic; HA: hydroxyapatite.
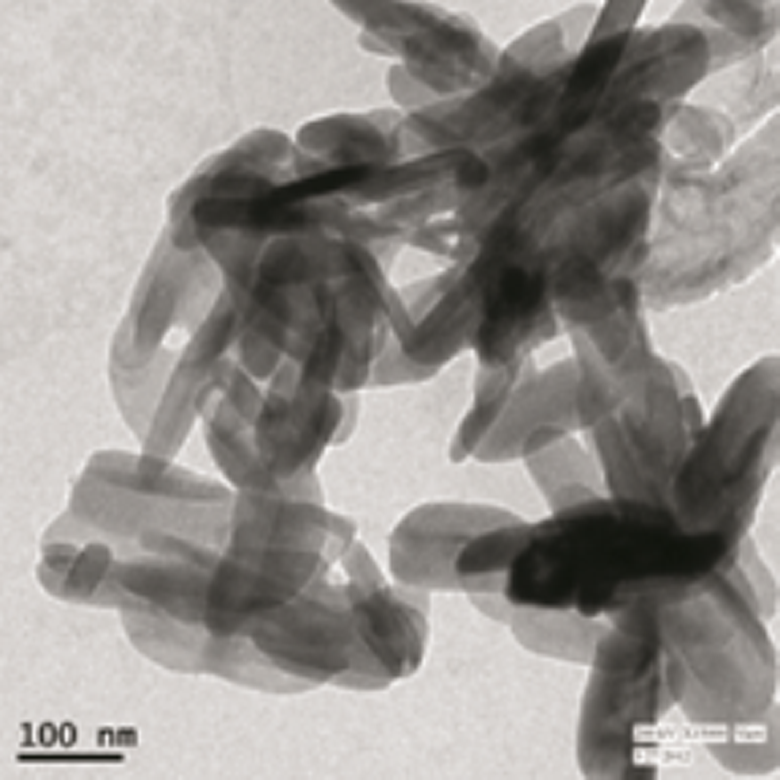
TEM image of PPG-nHA. TEM: transmission electron microscopic; PPG: polypropylene glycol; nHA: nanohydroxyapatite.
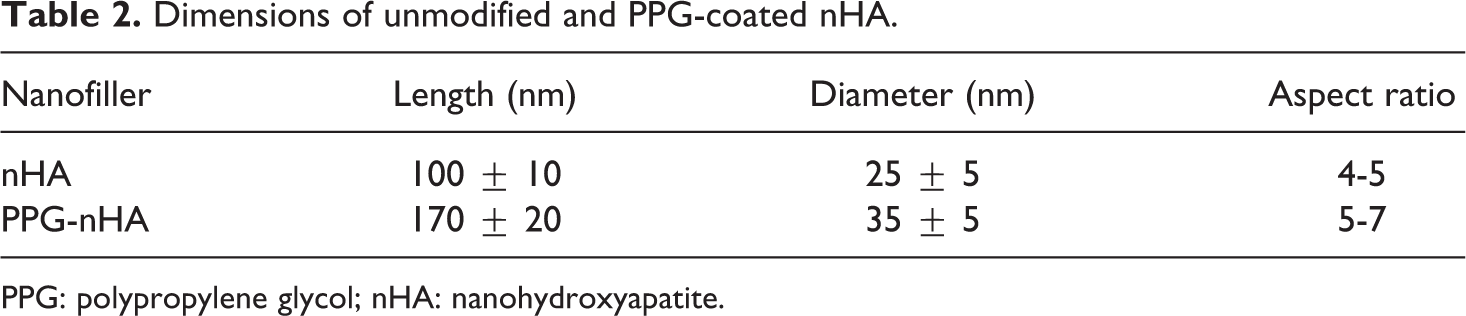
Dimensions of unmodified and PPG-coated nHA.
PPG: polypropylene glycol; nHA: nanohydroxyapatite.
In the case of unmodified nHAs, the aspect ratio of the nanorods are between 4 and 5, as the diameter of the nanorods lies in the range of 20–30 nm and the length of the nanorods fall in the range of 90–110 nm. The diameter of the cylindrical PPG-coated nHA lies in the range of 30–40 nm, and the length ranges from 150 to 190 nm. Thus, the aspect ratio of the nanorods falls in the range of 5–7. The reason for increase in aspect ratio of the PPG-coated nHA compared to unmodified nHA is explained below. PPG is a nonionic surfactant containing both hydrophilic groups (–O–) and hydrophobic groups (–CH2–CH2–). In an aqueous solution, the PPG molecule can spread to form long-chain structures with the hydrophilic groups exposed and the hydrophobic groups embedded in the aqueous solution. In PPG and Ca(NO3)2 4H2O mixed solution, the lone-pair of electrons of “O” atom of PPG exerts the ability of binding calcium (Ca2+) ion, and large number of Ca2+ ions would accumulate on the surface of PPG long chain. When NH4H2PO4 is added into the solution, the OH– and
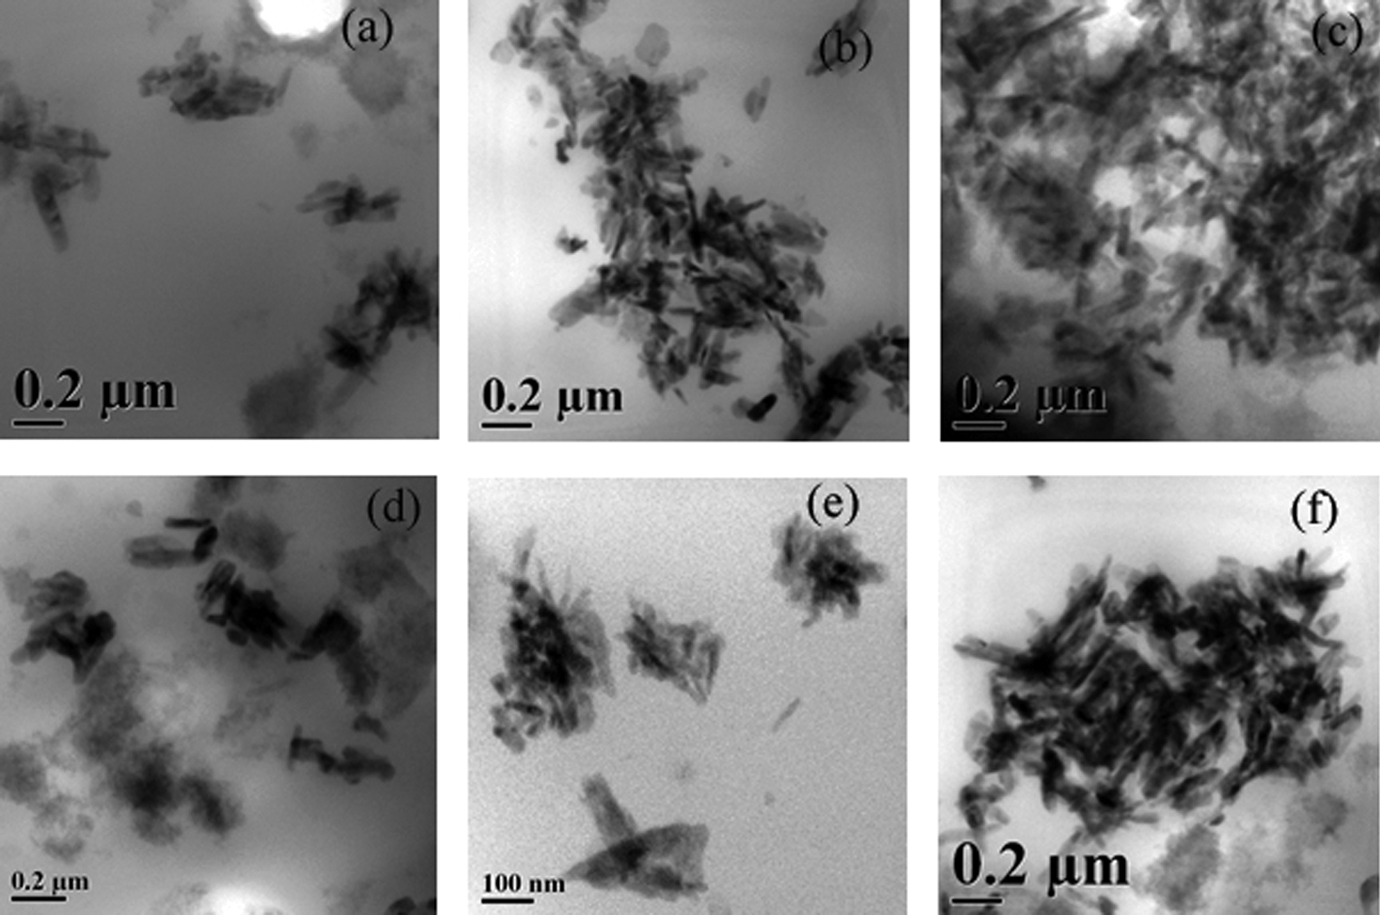
TEM images of the nanocomposites with unmodified nHA are shown in Figure 5.
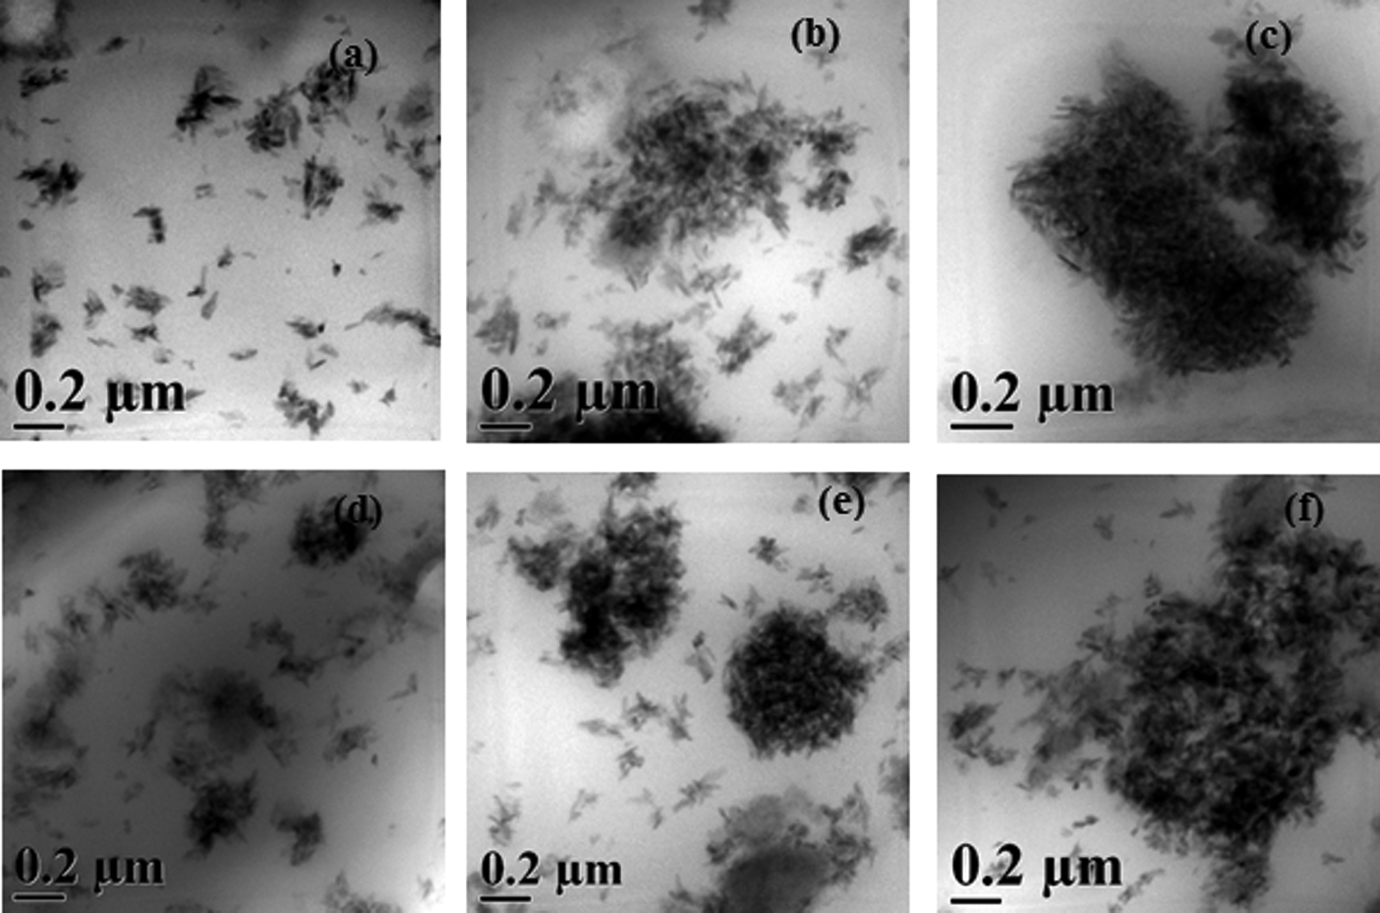
TEM images of composites made from unmodified nHA (a) T90P10UH1, (b) T90P10UH3, (c) T90P10UH5, (d) T80P20UH1, (e) T80P20UH3, and (f) T80P20UH5. TEM: transmission electron microscopy; nHA: nanohydroxyapatite.
Figure 5(a) to (c) shows the transmission electron micrographs of unmodified nHA nanocomposites in the blend of T90P10. Figure 5(a) and (b) show agglomerated structure of nHA with scattered distribution but without good dispersion in the the matrix containing 1 and 3 phr of nHA. The composite with 5 phr of nHA (Figure 5(c)) shows fully agglomerated structures and no tendency to disperse. This indicates that beyond 3 phr of the nanofiller severe agglomeration occurs. Similar observations were noted with composites derived from the blend T80P20 as shown in Figure 5(d) to (f). It is evident from TEM images that the melt mixing is not much effective in the dispersion of the nHA into the blend matrix.
TEM images of the T90P10 blend nanocomposites containing 1, 3 and 5 phr of PPG-nHA are shown in Figure 6(a), (b), and (c), respectively.
TEM micrographs of the nanocomposites made from PPG-nHA: (a) T90P10MH1, (b) T90P10MH3, (c) T90P10MH5, (c) T80P20MH1, (d) T80P20MH3, and (e) T80P20MH5. TEM: transmission electron microscopy; PPG: polypropylene glycol; nHA: nanohydroxyapatite.
As the proportion of PPG-modified nHA increased, the agglomerations in the composites were more prevalent. The dispersion of the PPG-nHA was slightly better than that of the unmodified nHA in these composites. Hence, it may be inferred that PPG-modified nHA does not improve the dispersion of the filler in the blend matrix significantly but does only marginally. Similar observations were noted for the composites made from T80P20 blend as well, which are shown in Figure 6(d) to (f).
The lower extent of dispersion of fillers in all these composites may be ascribed to the lower melt viscosity of the blends at the processing temeparture of 190°C, which doesn’t provide enough shear force to separate each of the nanoparticles and distribute it in the matrix.
SEM studies
Incorporation of nHA into the blend matrix influences the phase morphology of the blend. SEM of virgin blends and their nanocomposites were carried out to analyze the effect of both nHA and PPG-nHA on the phase morphology of T80P20 blend. The scanning electron micrographs are shown in Figure 7.
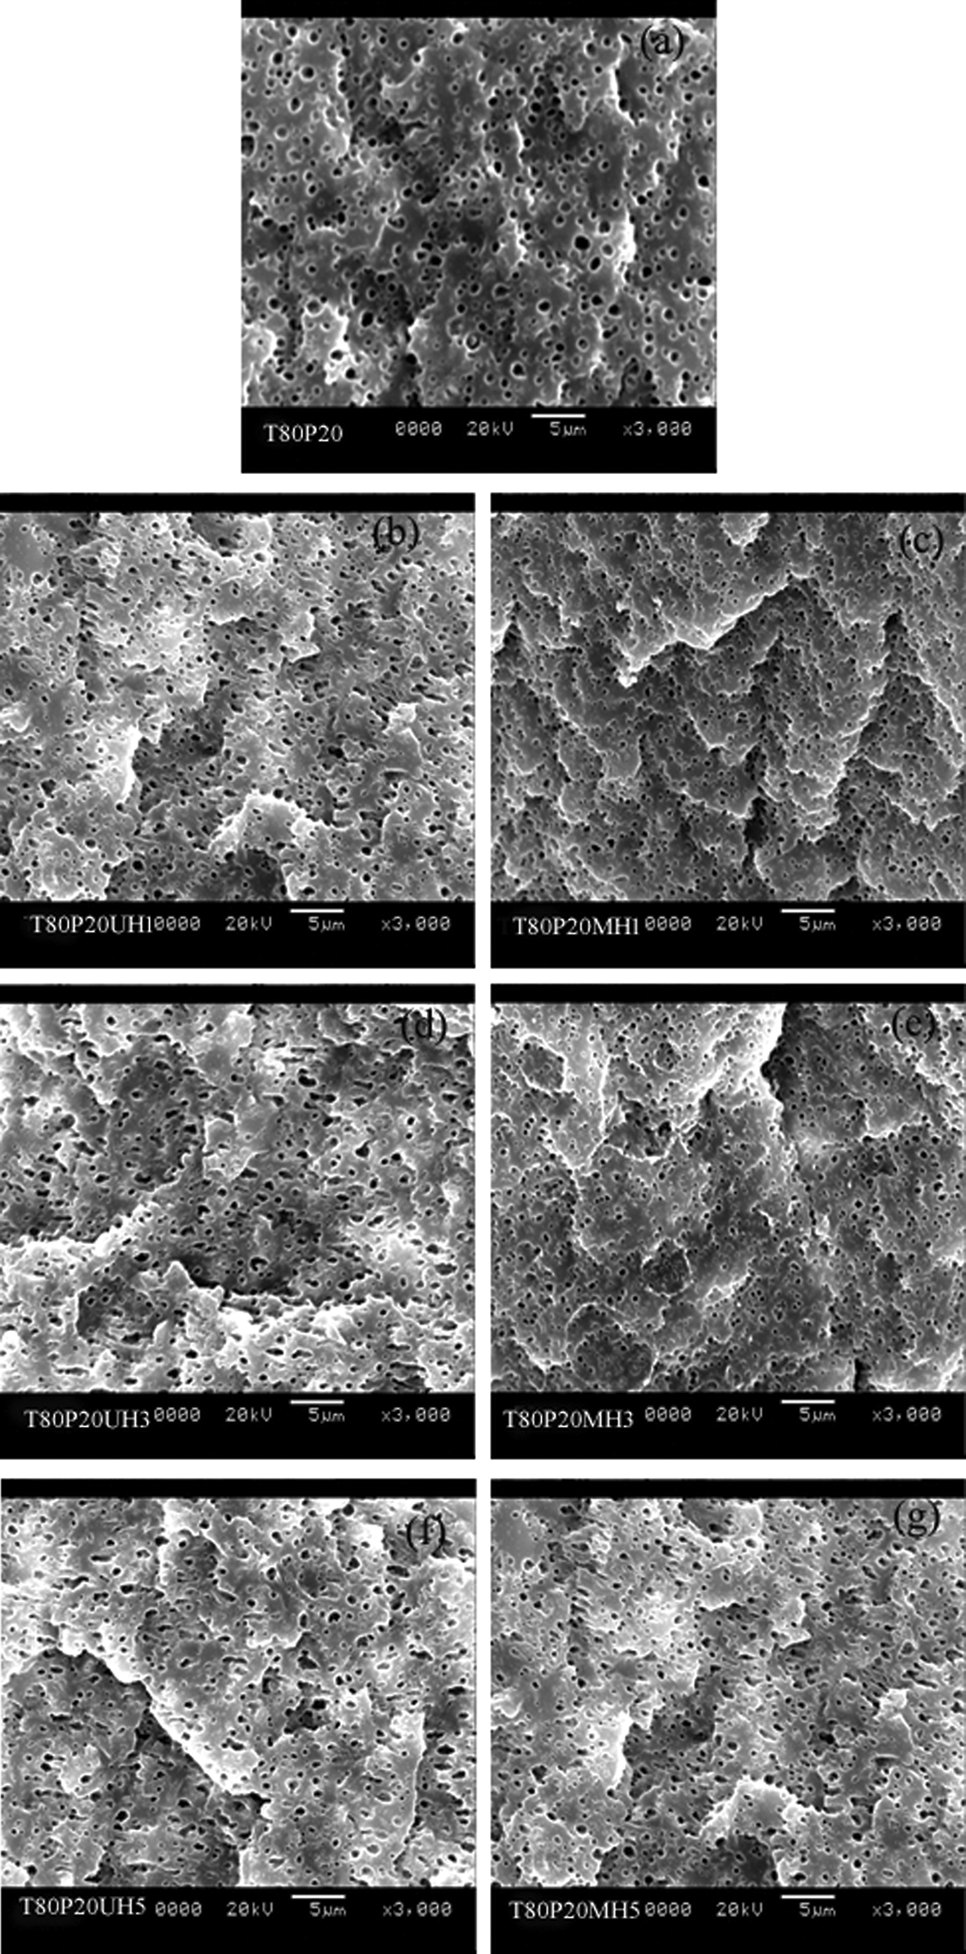
SEM micrographs of (a)T80P20, (b)T80P20UH1, (c)T80P20MH1, (d)T80P20UH3, (e)T80P20MH3, (f)T80P20UH5, and (g)T80P20MH5. SEM: scanning electron microscopic.
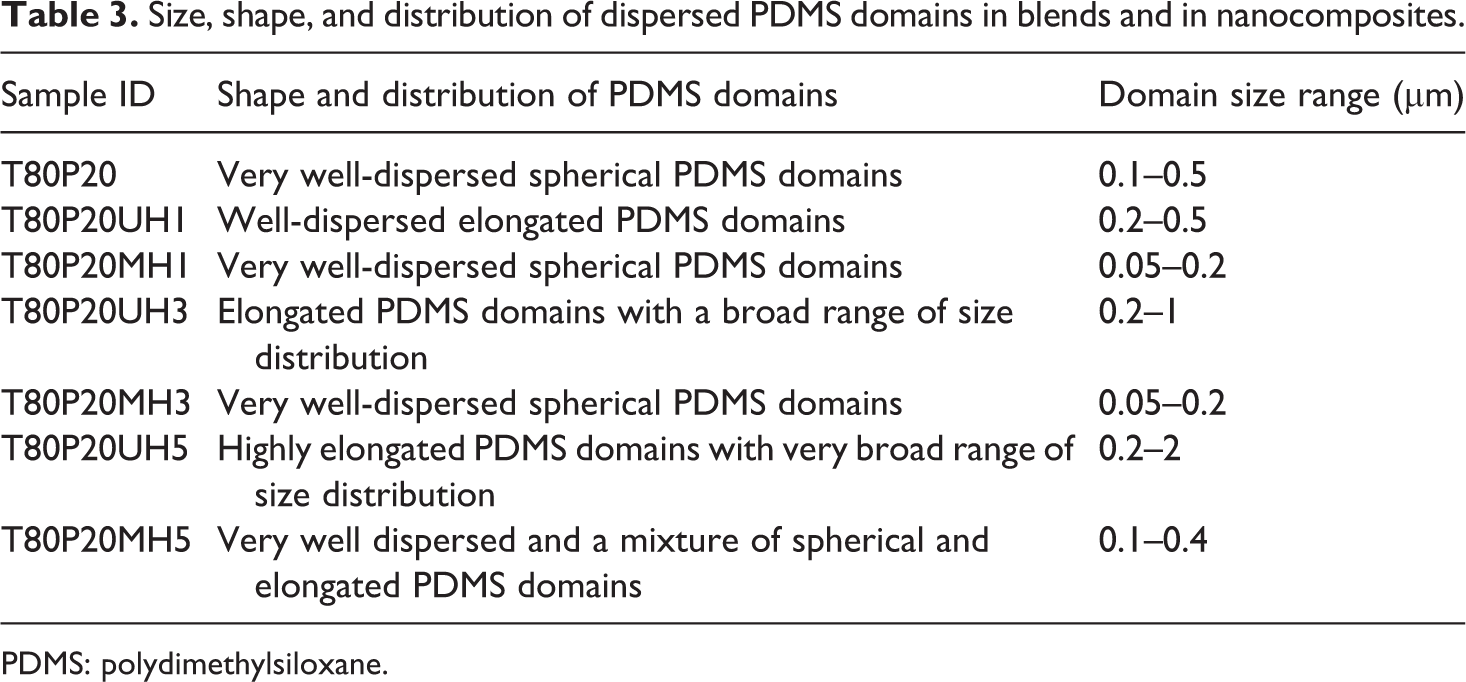
The holes present in the SEM images are the etched portions of dispersed PDMS phase and the remaining area is TPU, the major matrix component. nHA is not visible clearly in the micrographs as its size is in the nano level. The domain sizes of PDMS is being calculated using the image processing toolbox of MATLAB software and is listed in Table 3.
Size, shape, and distribution of dispersed PDMS domains in blends and in nanocomposites.
PDMS: polydimethylsiloxane.
SEM images show very interesting obserations. It is clear from Figure 7 and Table 3 that the the incorporation of 1 and 3 phr of PPG-nHA reduces the domain size of the PDMS significantly. The domain size of the PDMS as shown in Figure 7(c) and (e) was measured to be as low as 0.05 µm, which is very much lower compared to that in the T80P20 blend. This indicates that the PPG-nHA acts as a compatibilizer between TPU and PDMS rubber. The driving force for this polymer wrapping is the electrostatic force of attraction between the Ca2+ ion of the nanofiller and the lone pair of electrons in the “O” atom of the PPG molecules. Surface wrapping of PPG molecules facilitates better dispersion of the nHA and stronger interface formation and the PPG layer may act as non-covalent surface functionalization of the nHA. 15,21 Furthermore, there may be an intermolecular interaction between surface hydroxyl (OH−) functional group of nHA rods and the N–H group from TPU. The molecular weight of PPG used in this work is very less (600). So the available OH group at the end of each PPG molecules will be also high. So there will be a great possibility to have more interaction between the OH group in the PPG and O atoms in PDMS. The formation of O–H····O bond formation between the OH groups in the surface-wrapped nHA and PDMS backbone creates better interaction between the nanofiller and PDMS. Similar kinds of interactions have been observed in few literatures. 22 –25 These interactions may reduce the interfacial tension between TPU and PDMS. This may be the reason for the lower domain size of the PDMS rubber in the composites. Not much change has been observed in the dimension of PDMS domains between the composites with 1 and 3 phr of PPG-modified nanocomposites. However, the addition of 5 phr of PPG-nHA induced the coalescence between two or more domains of PDMS forming bigger PDMS domains (Figure 7(g)).
In contrast to the above observation, addition of nHA did not decrease the domain size of the PDMS, rather it increased, which may be due to the coalescnec of the PDMS particles that is clearly visible in Figure 7(b), (d), and (f). The extent of coalascence increases with increase in the proportion of nHA. In addition, incorporation of nHA distrurbs the shape of the PDMS domains, as is evident from the distorted spherical droplet/matrix morphology with irregularly shaped PDMS domains. Bigger domain size of the PDMS rubber are observed due to the merging of two or more PDMS particles.
Mechanical properties of the blends and nanocomposites
The effect of nHA and PPG-nHA on the static tensile properties of the TPU-PDMS blend nanocomposites at ambient temperature have been investigated. Stress–strain plot of blends and their nanocomposites are shown in Figure 8.
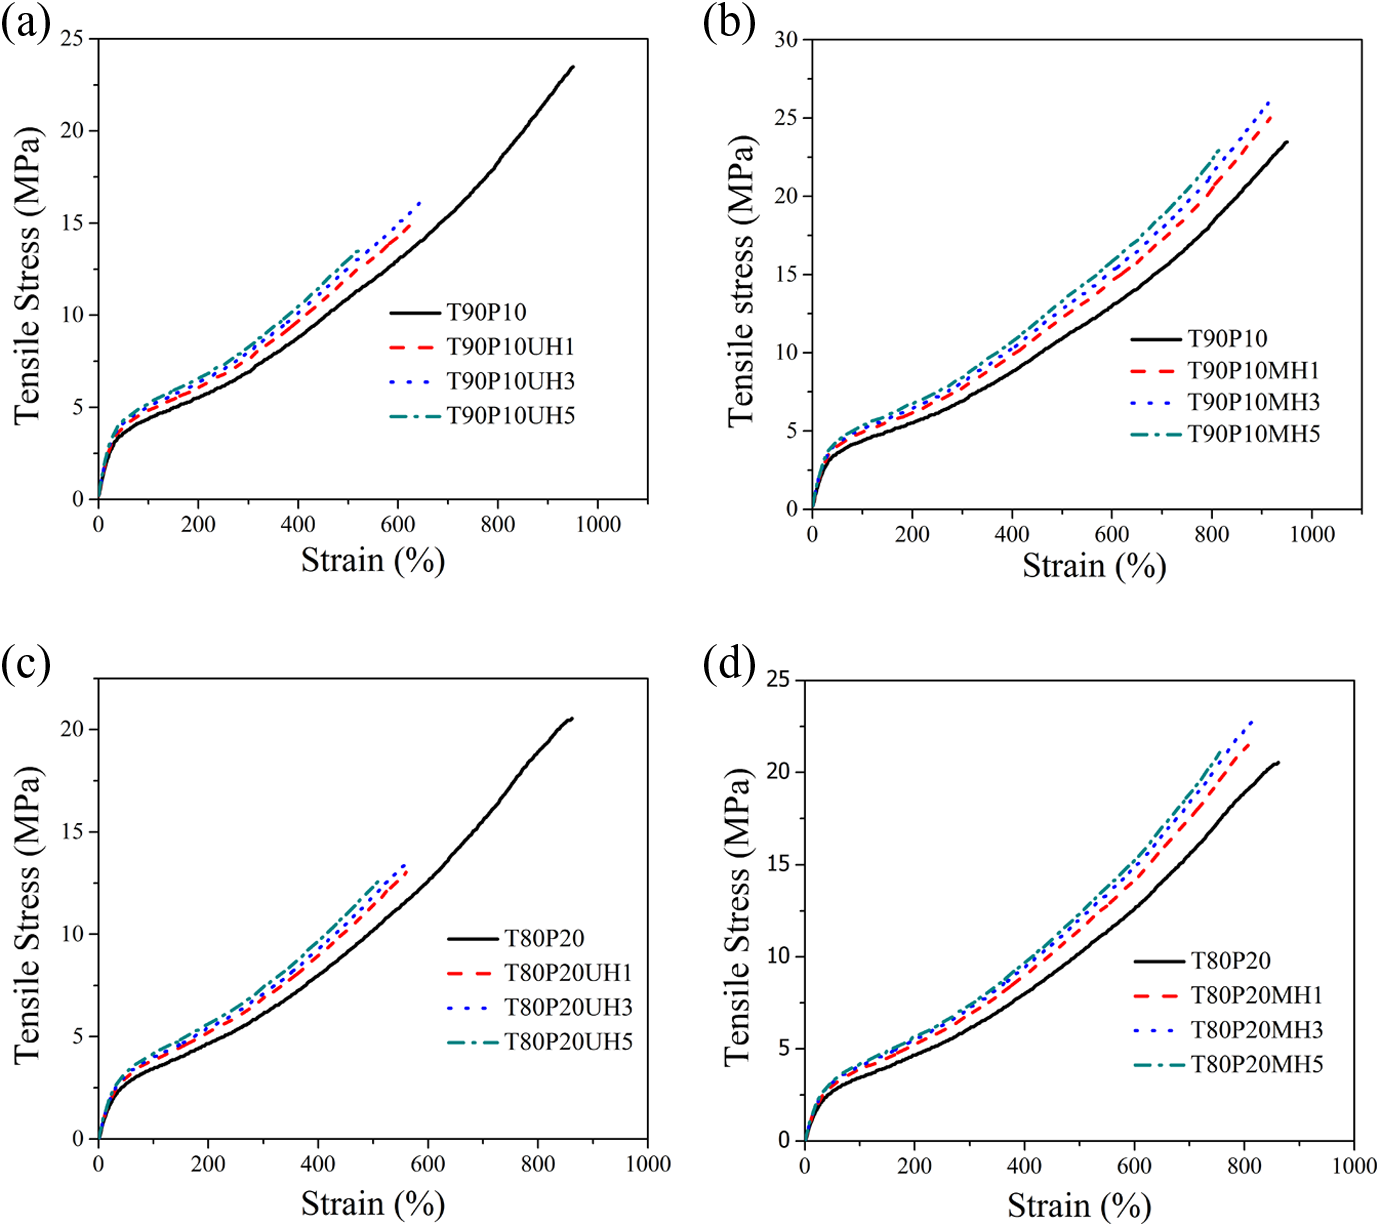
Stress–strain plot of blends and their nanocomposites (a) nHA-based nanocomposites of T90P10 blends, (b)PPG-nHA–based nanocomposites of T90P10 blends, (c) nHA-based nanocomposites of T80P20 blends, and (d) PPG-nHA–based nanocomposites of T80P20 blends. PPG: polypropylene glycol; nHA: nanohydroxyapatite.
Modulus at 100% elongation, modulus at 200% elongation, modulus at 300% elongation, tensile strength, and elongation at break are summarized in Table 4.
Tensile properties of TPU-PDMS blends and nanocomposites.
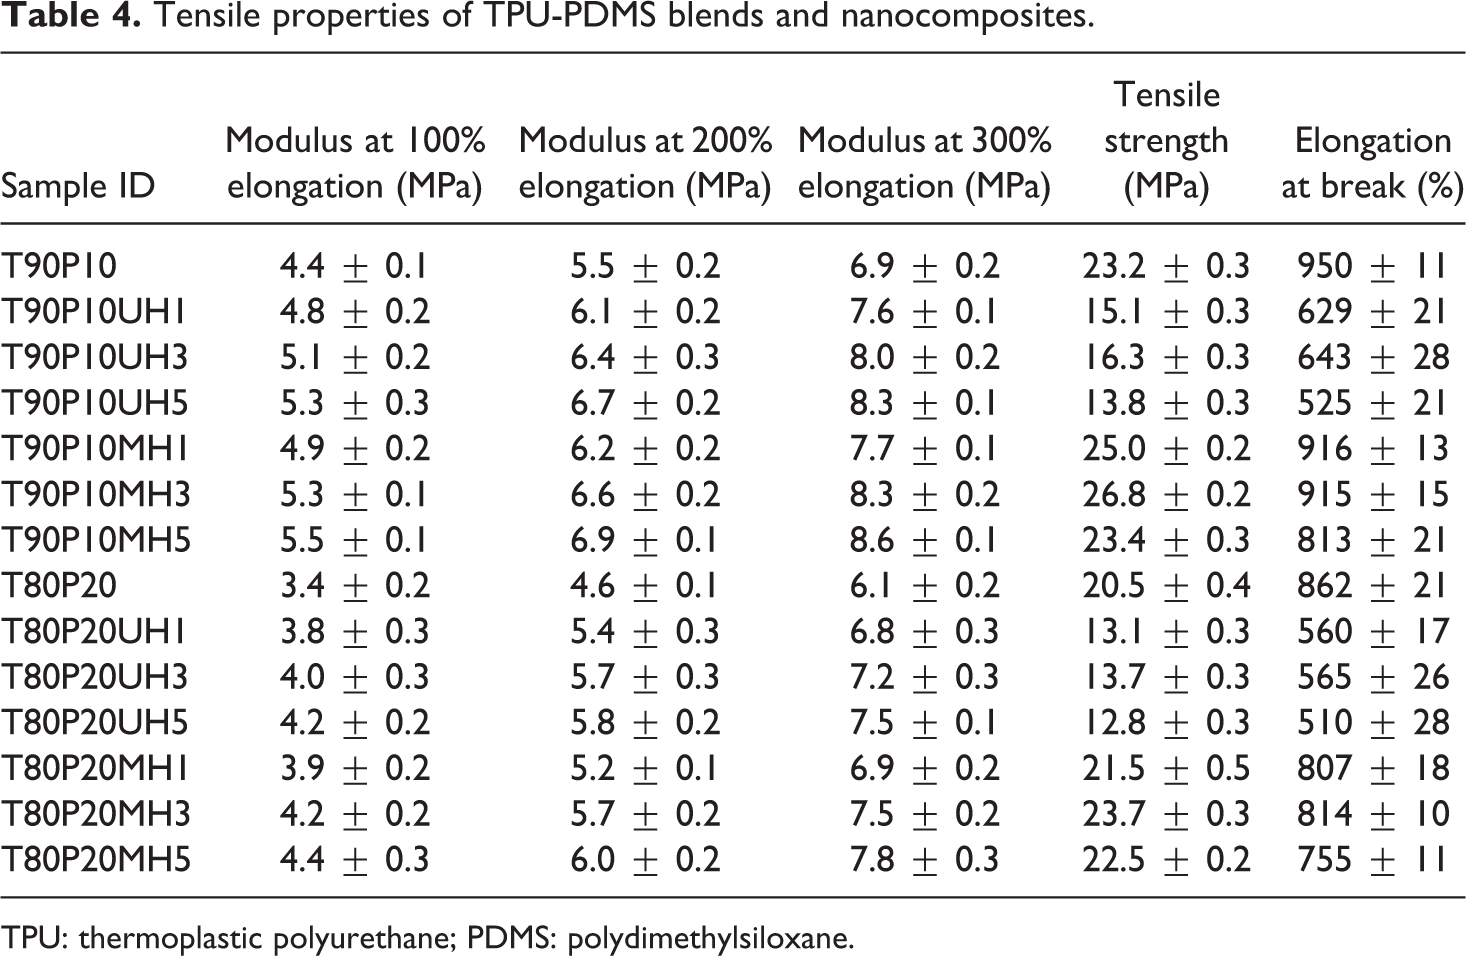
TPU: thermoplastic polyurethane; PDMS: polydimethylsiloxane.
Results indicate that the addition of unmodified nHA increases the modulus at 100%, 200%, and 300% elongation but reduces the elongation at break and tensile strength considerably. Addition of 1, 3, and 5 phr of unmodified nHA in the T90P10 blend increase the modulus at 100% elongation by 9%, 15.9%, and 20.5% and the modulus at 200% elongation by 10.9%, 16.3%, and 21.8%, respectively. Similarly the modulus at 300% elongation increases by 10.1%, 15.9%, and 20.3% by the incorporation of 1, 3, and 5 phr of unmodified nHA, respectively, into the T90P10 blend. Addition of 1, 3, and 5 phr of unmodified nHA reduces the elongation at break by 34%, 32%, and 45%, respectively, and tensile strength is reduced by 35%, 30%, and 41% compared to the T90P10 blend. The reduction in tensile strength and elongation at break is prominent beyond 3 phr of nHA, and it is evident from the gross agglomeration of nHA in the blend matrix at 5 phr loading (Figure 5(c)). Reduction in the tensile strength and elongation at break may be due to the incompatibility between the nHA and the polymer blend matrix resulting in lower polymer–filler interaction and a higher filler–filler interaction. This would be evident from the dynamic modulus studies under strain sweep presented in the subsequent section. Similar observation has been found for T80P20 blend-containing nHA at three different loadings.
The surface coating of nHA with PPG enhances the mechanical properties of the nanocomposites compared to the unmodified nHA-filled nanocomposites. This may be attributed to greater interaction between the modified nHA and the blend matrix. Addition of 1, 3, and 5 phr of PPG-coated nHA into T90P10 blend increases the modulus at 100% elongation by 11.4%, 21%, and 25%, respectively. Similarly modulus at 200% elongation is increased by 12.7%, 20%, and 26% by the incorporation of 1, 3, and 5 phr of PPG-modified nHA, respectively. Incorporation of 1, 3, and 5 phr of PPG-nHA into T90P10 blend increases the modulus at 300% elongation by 11.5%, 20.2%, and 24.6%, respectively. Similar observations on modulus at 100%, 200%, and 300% elongation are found for the composites made from T80P20 blend and PPG-nHA. By the addition of 1 and 3 phr of PPG-modified nHA into T90P10 blend, tensile strength increases from 23.2 MPa to 25.0 and 26.8 Mpa, respectively. The addition of 5 phr reduces the tensile strength marginally to 23.4 Mpa, and this may be explained by the agglomeration of nanofiller in the T90P10MH5 nanocomposites, which is clearly visible in the transmission electron micrographs. In the case of T80P20 blend composites, 1and 3 phr of PPG-nHA incorporation increases the tensile strength from 20.5 MPa for T80P20 to 21.5 and 23.7 Mpa, respectively. But the addition of 5 phr of PPG-nHA slightly decreases the tensile strength to 22.7 MPa. It is concluded from the tensile properties that 3 phr of PPG-nHA is found to be optimum loading for TPU-PDMS blend-based composites. Further addition of nanofiller decreases the tensile properties due to the severe agglomeration of nanofiller in the blend matrix.
Comparison of the tensile strength and elongation at break between nHA and PPG-nHA–filled nanocomposites are represented in Figure 9.
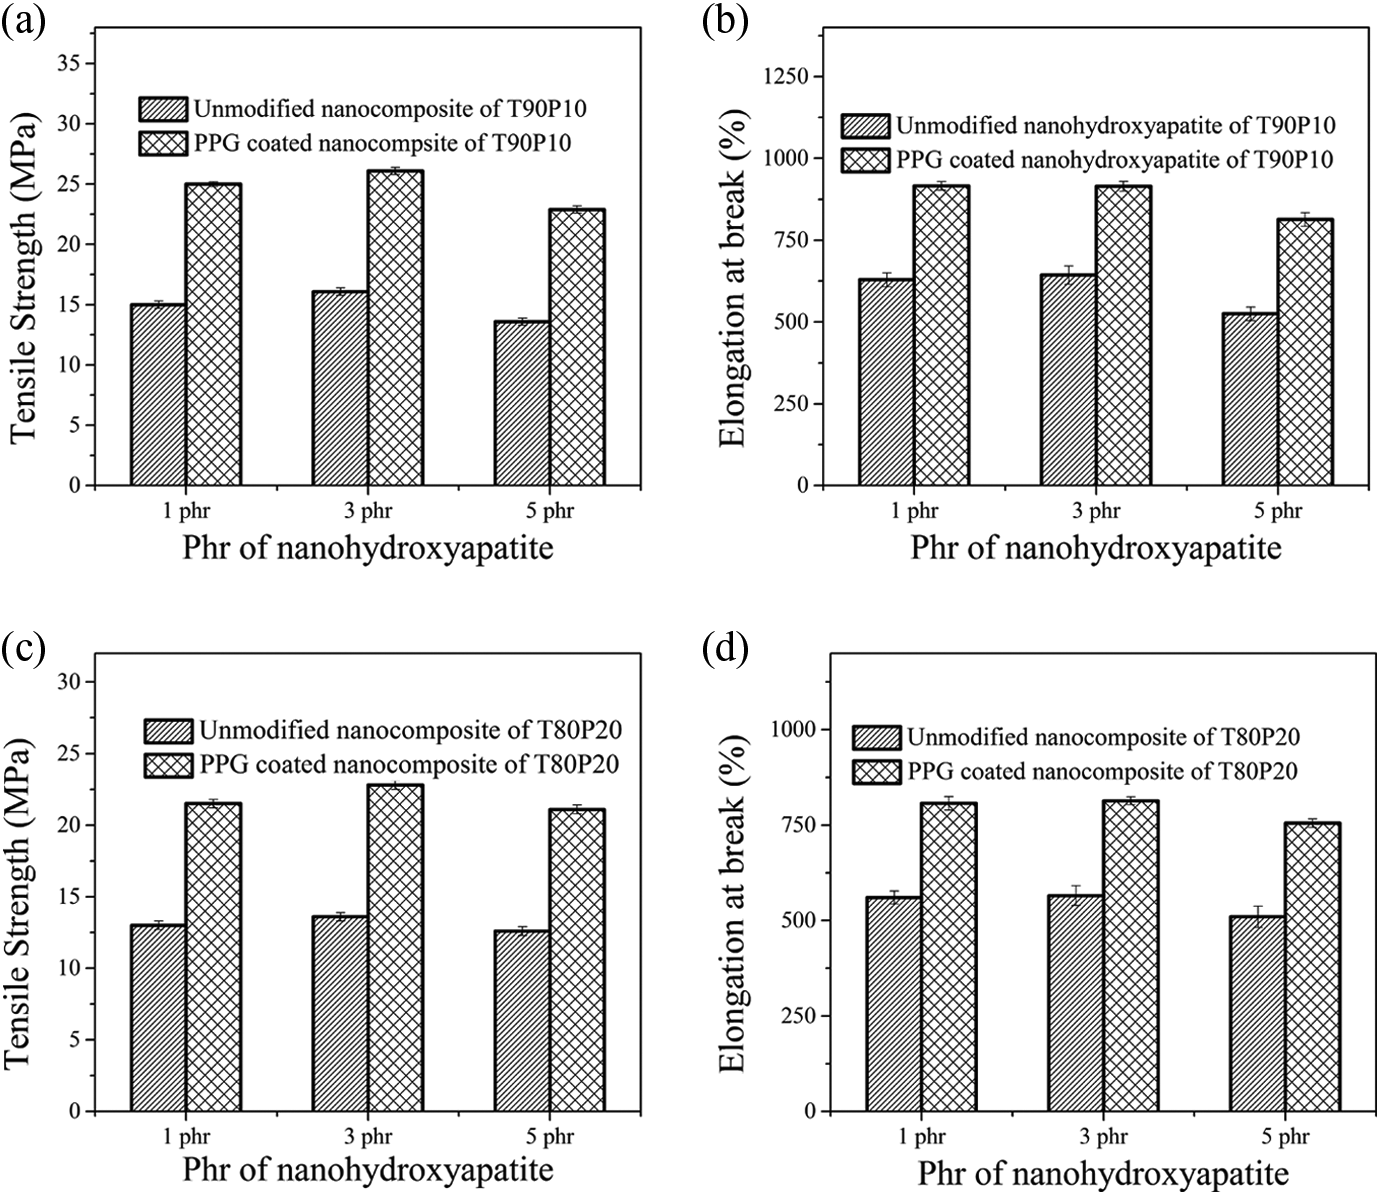
(a, b) Comparison of tensile strength and elongation at break of nHA and PPG-nHA–filled nanocomposites of T90P10 blend, respectively; (c, d) comparison of tensile strength and elongation at break of nHA and PPG-nHA–filled nanocomposites of T80P20 blend, respectively. PPG: polypropylene glycol; nHA: nanohydroxyapatite.
T90P10 blend composites containing 3 phr PPG-nHA shows an improvement in elongation at break by 42% and an improvement in tensile strength by almost 64% compared to 3 phr unmodified nHA-incorporated nanocomposites. Similarly T80P20 blend composites containing 3 phr PPG-nHA shows an improvement in elongation at break by 44% and an improvement in tensile strength by almost 73% compared to 3 phr unmodified nHA-incorporated nanocomposites.
Nanomechanical test was performed using quasi-static indent on TPU-PDMS blends and its nanocomposites to understand the relation between toughness with respect to the nHA filler loadings. The average Er) of all the samples was plotted against the nHA loading in Figure 10.
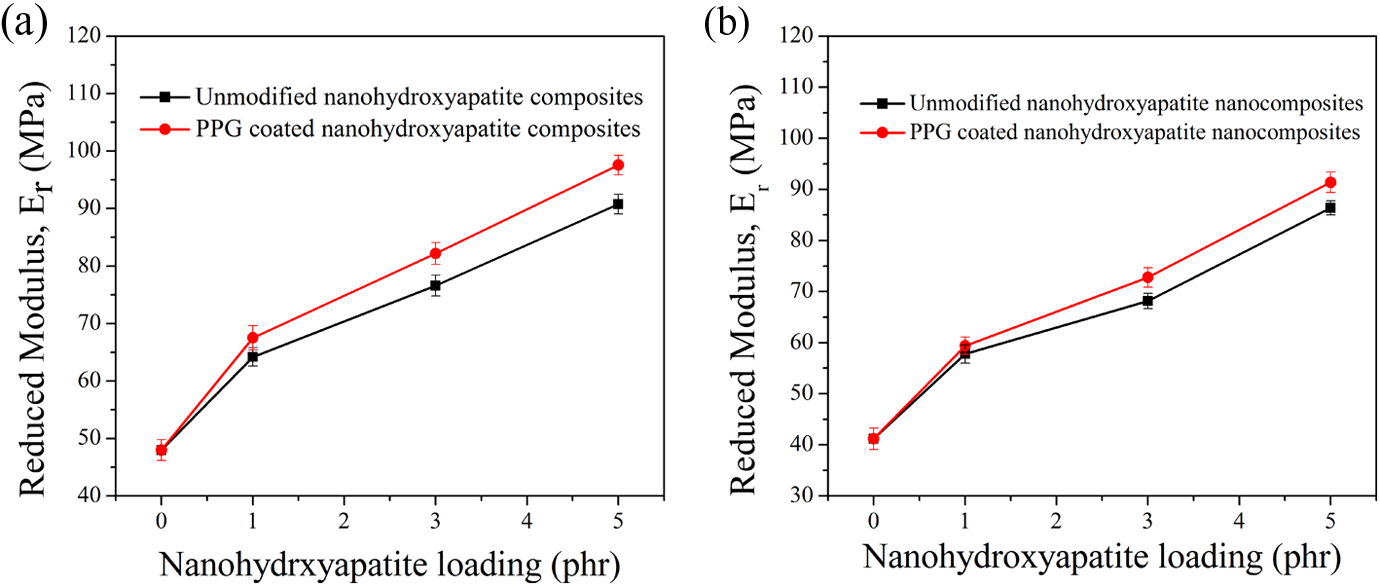
Er of nanocomposites as a function of nHA loading. Er: reduced modulus; nHA: nanohydroxyapatite.
Clearly the incorporation of the nHA into the blends has a significant effect on Er. The Er values steadily increased with increasing nHA loading. Moreover, the improvements for the PPG-nHA–filled composites were higher than those for the unmodified nHA-filled composites. The addition of 3 phr of PPG-nHA into T90P10 increases the Er by approximately 71%, while the addition of 3 phr of unmodified nHA into T90P10 increases the Er by approximately 60%. Similarly, the addition of 3 phr of PPG-nHA into T80P20 increases the Er by approximately 76%, while the addition of 3 phr of unmodified nHA into T80P20 increases Er by approximately 65%. These results confirm that the incorporation of nHA makes the TPU-PDMS blends stiffer.
Thermogravimetric analysis
Thermogravitograms and derivatograms of the blends and their nanocomposites with 3phr PPG-nHA are presented in Figures 11 and 12, respectively.
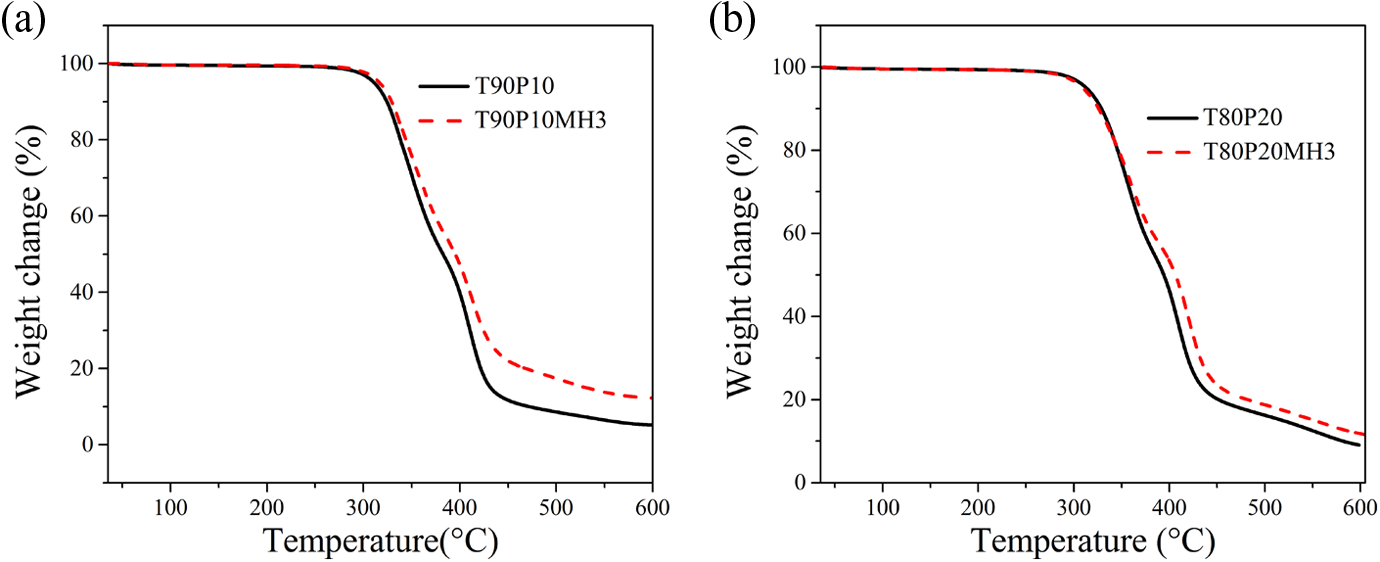
Thermogram of TPU-PDMS blends and their nanocomposites: (a) T90P10 and T90P10MH3 and (b) T80P20 and T80P20MH3. TPU: thermoplastic polyurethane; PDMS: polydimethylsiloxane.
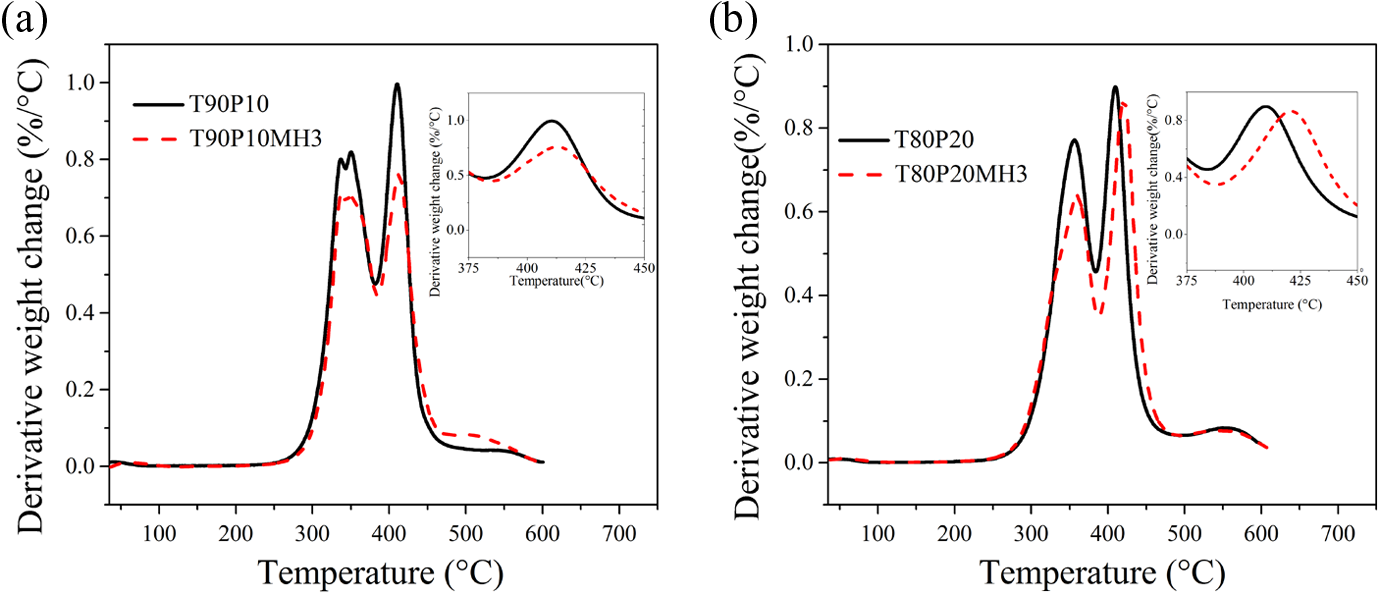
Thermoderivatogram of TPU-PDMS blends and their nanocomposites: (a) T90P10 and T90P10MH3 and (b) T80P20 and T80P20MH3. TPU: thermoplastic polyurethane; PDMS: polydimethylsiloxane.
The experimental results of TGA are presented in Table 5.
TGA results of blends and nanocomposites with 3 phr of PPG-nHA.
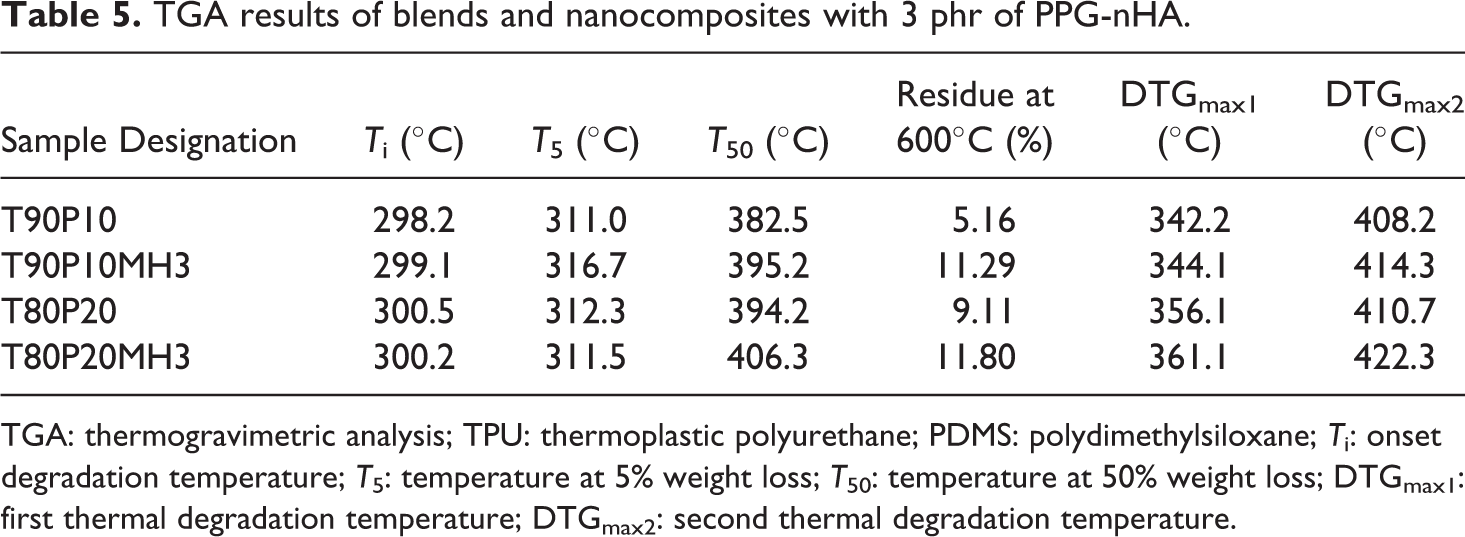
TGA: thermogravimetric analysis; TPU: thermoplastic polyurethane; PDMS: polydimethylsiloxane; Ti: onset degradation temperature; T5: temperature at 5% weight loss; T50: temperature at 50% weight loss; DTGmax1: first thermal degradation temperature; DTGmax2: second thermal degradation temperature.
Figure 11(a) shows that T90P10 and T90P10MH3 have almost similar onset degradation temperature (Ti). T90P10MH3 showed 5°C increase in temperature at 5% weight loss (T5) than that of T90P10. Still the nanocomposites show higher T5. Similarly, T90P10MH3 showed an improvement of 12.7°C in temperature at 50% weight loss (T50) than T90P10. T90P10MH3 possess a residual weight of 11.29% after 600°C, which is higher than that of T90P10, which shows a residual weight of 5.16%. Figure 11(b) shows that due to the early degradation of some amount of PPG in the T80P20MH3 causes the marginal decrease (0.8°C) in the temperature at T5 compared to T80P20. It may be noted that the first degradation is mostly dominated by the degradation of organic modifier present in the nHA. T80P20MH3 shows an improvement of 12.1°C in the temperature at T50 than T80P20. T80P20MH3 possesses a residue of 11.80% after 600°C, which is higher than T80P20 that shows a residue of 9.11%. Figure 12(a) and (b) shows that the degradation of the blends and nanocomposites occur in two stages. Earlier studies revealed that thermal degradation of polyurethane occurs in two stages. First is the degradation of hard segment of the TPU. It occurs as urethane groups first undergo depolymerization, resulting in individual monomers, which then further decompose to produce carbon dioxide. The second degradation is due to the polyol chain scission. 26,27 T90P10MH3 shows only 2°C improvement in the DTGmax1 and 6.1°C improvement in DTGmax2 than T90P10. T80P20MH3 shows 5°C improvement in the DTGmax1 and 11.6°C improvement in DTGmax2 than T80P20. TGA shows that the addition of nHA increases the degradation temperature of the TPU soft segment. This effect is attributed to the strong interfacial interaction between the PPG-modified nHA and TPU-PDMS blend as well as restricted molecular mobility imparted by the nHA, which plays a vital role in thermal decomposition. But the effect of nHA on the degradation temperature of the TPU hard segment is negligible.
Dynamic mechanical behavior of the nanocomposites under strain sweep
In the case of nonlinear viscoelastic solids such as elastomer composites and nanocomposites, the dynamic mechanical properties depends not only on the temperature and frequency but also on the type and extent of deformation, that is, strain. 28 The Payne effect is related to the network structure formed by filler in a polymer matrix, and therefore, it may be used to characterize the three-dimensional distribution of fillers in the polymer matrix. At higher strain, the filler network breaks down and the dynamic modulus G′ decreases rapidly. If the reduction in the dynamic modulus is smaller, the filler–filler network shall be lower and hence Payne effect will be weaker. This indicates a better dispersion of the filler in the polymer matrix as well as better interaction between the filler and the polymer matrix. 29 Figure 13 shows the variation of the storage modulus of the blend nanocomposites made from nHA and PPG-nHA at different shear rates.
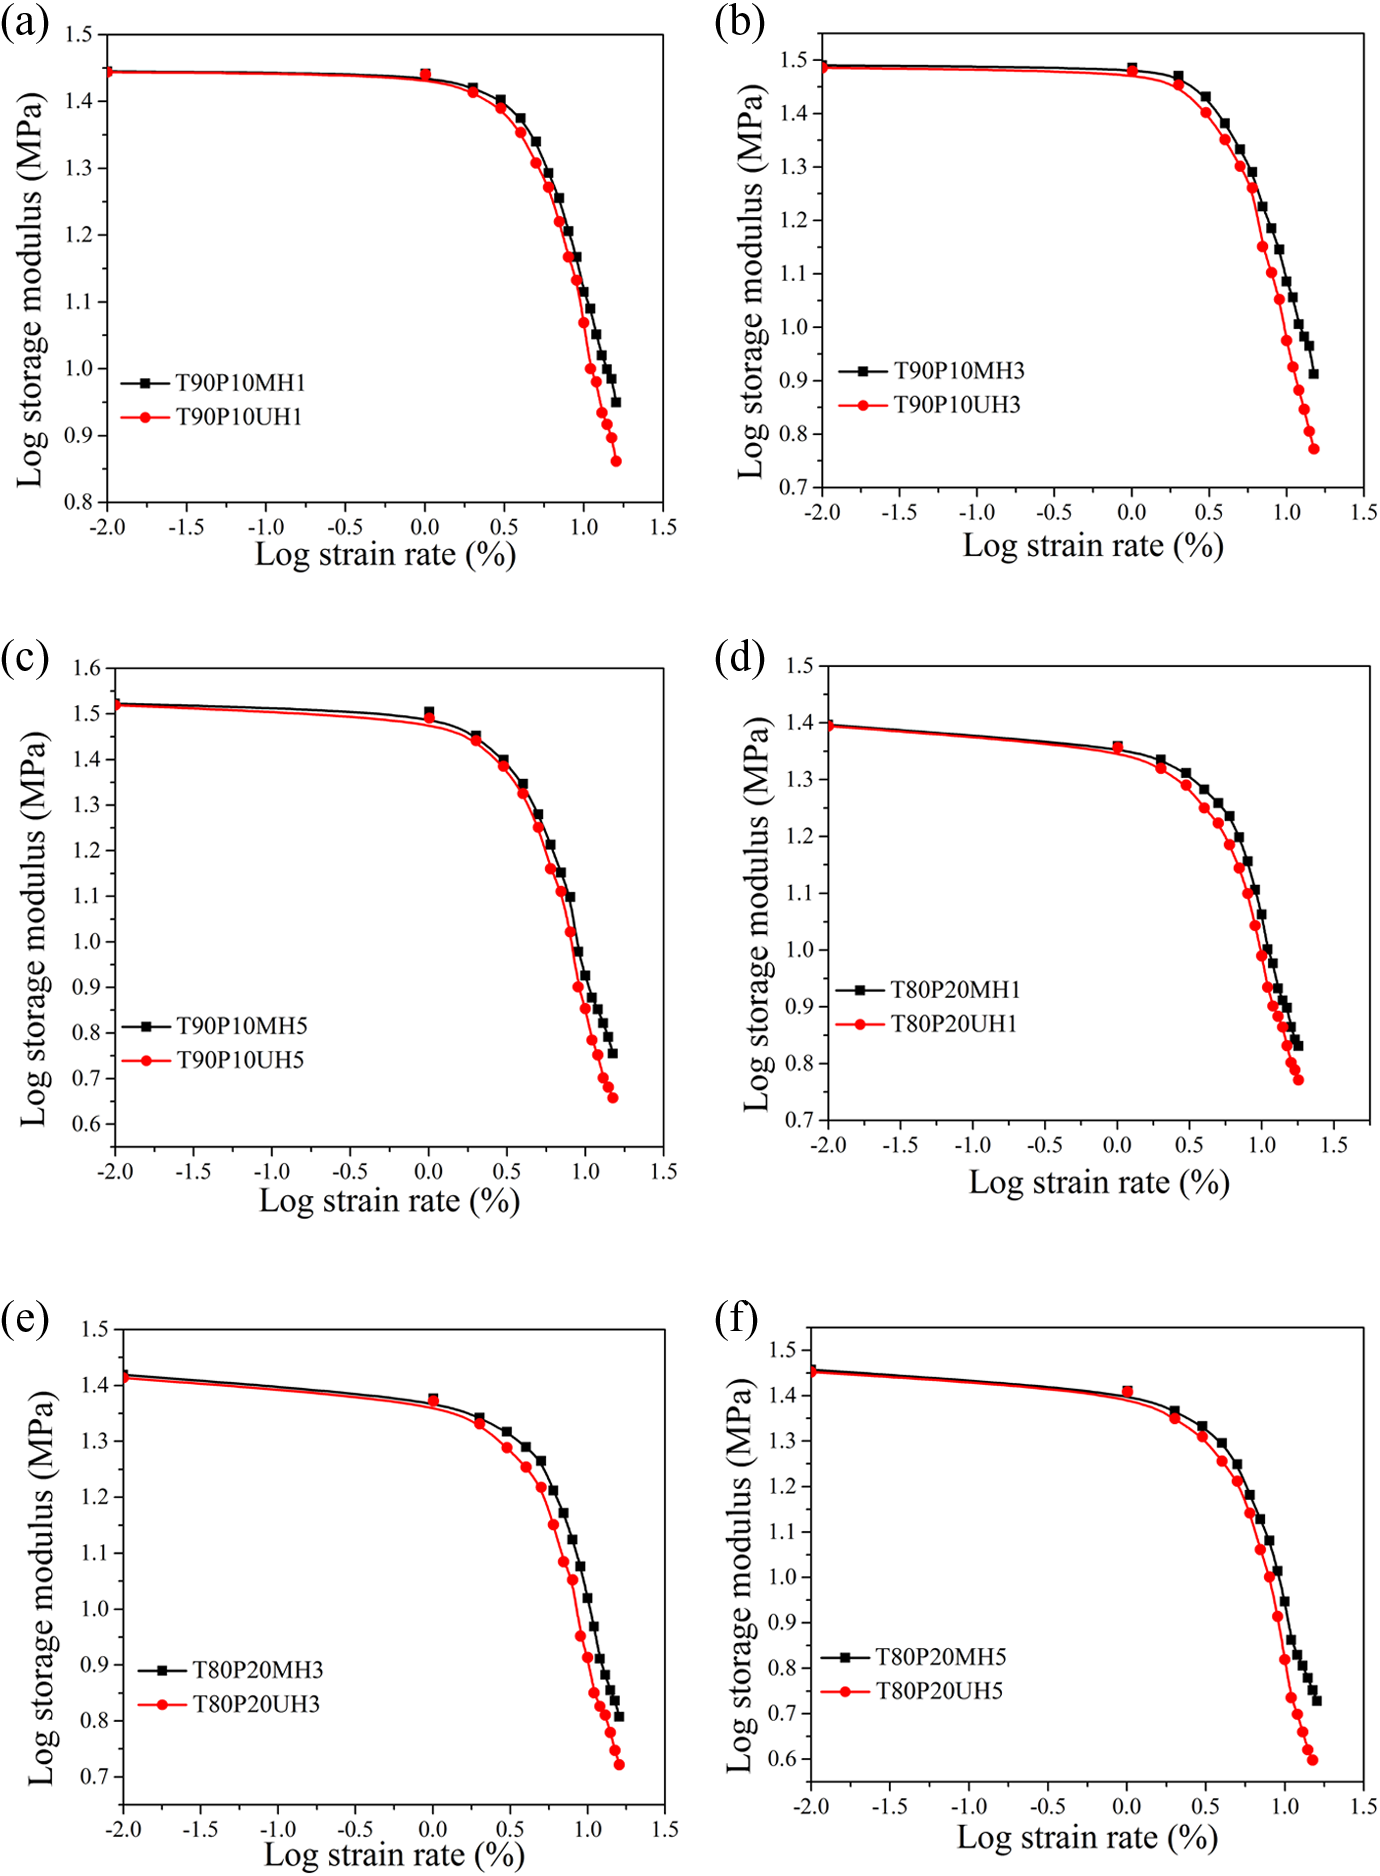
Log storge modulus with respect to the log strain rate of PPG-nHA and nHA-based nanocomposites: (a)T90P10MH1 and T90P10UH1; (b) T90P10MH3 and T90P10UH3; (c) T90P10MH5 and T90P10UH5; (d) T80P20MH1 and T80P20UH1; (e) T80P20MH3 and T80P20UH3; and (f) T80P20MH5 and T80P20UH5. PPG: polypropylene glycol; nHA: nanohydroxyapatite.
Decrease in storage modulus with increase in percentage strain was observed for all the compositions. The percentage drop in storage modulus at different strains starting from 3% to 10% is presented in Table 6 in comparison with the storage modulus at 0.01% strain.
The percent drop in storage modulus of the nanocomposites upto 10% strain compared to the modulus at 0.01% dynamic strain.
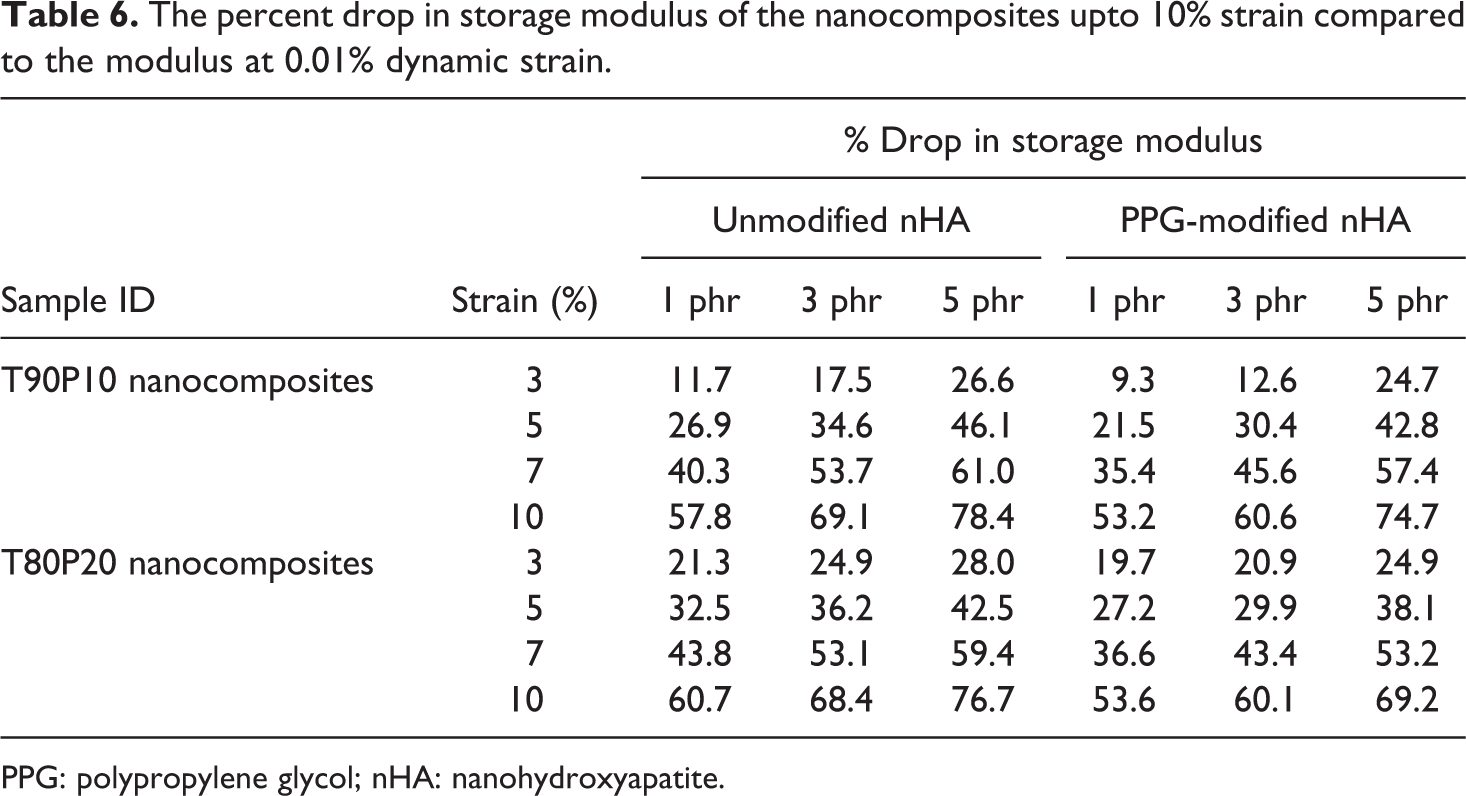
PPG: polypropylene glycol; nHA: nanohydroxyapatite.
The storage modulus dropped drastically at 5 phr addition of nanofillers both in the case of nHA and PPG-nHA composites as compared to 1 and 3 phr-filled composites. At higher doses of the nanofiller, clusters of fillers are formed. At low strain, the time-dependent response of an elastic polymer is mainly determined through interactions between the polymer matrix and the filler network. At higher strain, filler network is broken down, and the modulus is then determined only by polymer–polymer entanglements, elastically effective filler–polymer couplings and hydrodynamic filler effects. Composites with 5 phr filler loading has a higher filler–filler network structure, and therefore, the modulus attenuation due to the collapse of the filler network structure is at the highest level. Table 6 and Figure 13 show that percentage drop in storage modulus of the PPG-nHA nanocomposite is considerably lower than that of unmodified nHA-filled composites, especially at higher strain, that is, above 5% dynamic strain. This implies that the interaction between the PPG-coated nHA and the polymer blend matrix is prominent. Payne effect is more prominent in the case of nHA-filled nanocomposites than PPG-nHA–filled nanocomposites under all investigated loading levels of filler irrespective of the blend compositions.
Melt rheology study
Figure 14 shows the log apparent viscosity against log shear rate of the blends and their composites with PPG-coated nHAat 190°C.
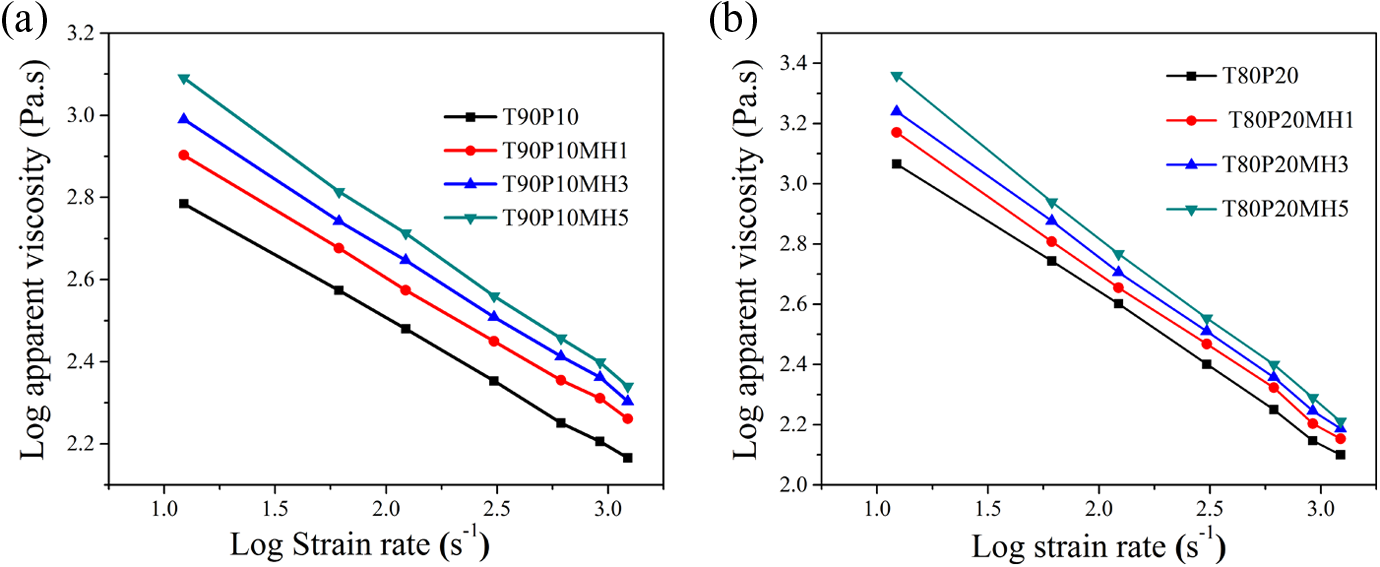
Log apparent viscosity versus log shear rate of the blend and composites of (a)T90P10 and (b) T80P20.
The shear viscosity decreases with increasing apparent shear rate, indicating a shear-thinning (i.e. pseudoplastic) nature because of highly entangled state of the molecular chains that get disentangled and become orientated under high shear conditions, leading to reduction in viscosity. It can be seen from Figure 14 that shear viscosity decreases substantially with increasing shear rate. Also the melt viscosity increases with increase in the level of PPG-coated nHA. The melt viscosity values for the nanocomposites at different PPG-nHA doses under high shear rate conditions are closer to that of neat blends in contrary to that observed at low shear rate conditions. In other words, at high shear rates, nanocomposites exhibit prominent shear-thinning behavior as compared to that observed for the neat blends. The shear-thinning nature is more prominent in the composites containing more than 3 phr PPG-nHA loading.
Conclusions
nHA and PPG-coated nHA were synthesized in the form of nanorods by sol–gel technique. The unmodified nHA particles were cylindrical in shape with a diameter in the range of 20–30 nm and a length of around 100 nm for the unmodified nHAs. The PPG-coated nHA have a diameter in the range of 30–40 nm and a length in the range of 140–200 nm, which is much higher than the unmodified nHA. TEM images of the nanocomposites exhibited scattered distribution with limted dispersion of the nanofiller. Incorporation of PPG-nHA act as a compatibilizer to the TPU and PDMS rubber blends by reducing the dispersed domain size of the PDMS rubber. The incorporation of unmodified nHA imparted lower tensile strength as well as the elongation at break of the TPU-PDMS rubber blends. PPG-nHA–filled nanocomposites exhibited an improvement of 66% in the tensile strength and 43% in the elongation at break as compared to the unmodified nHA-filled nanocomposites. The optimum dose of the nanofiller was found to be 3 phr. Nanoindentation studies confirmed the increase in the modulus and stiffness of the polymer blends with the addition of nHA and the increase is more prominent in the case of PPG-nHA–filled nanocomposites. Dynamic strain sweep measurements confirmed the interaction between the PPG-nHA and the TPU-PDMS blend matrix. TGA exhibited slightly higher thermal stability for the PPG-coated nHA than the virgin TPU-PDMS blends. The melt rheological studies revealed the shear-thinning nature of the nHA–filled TPU-PDMS rubber blend nanocomposites, and the shear-thinning behavior was more prominent in the composites with higher loading of nanofillers.
Footnotes
Acknowledgments
The authors are grateful to Mr Selvakumar for his valuable suggestions for synthesizing the nanofillers.
Declaration of Conflicting Interests
The author(s) declared no potential conflicts of interest with respect to the research, authorship, and/or publication of this article.
Funding
The author(s) received no financial support for the research, authorship, and/or publication of this article.