
Abstract
In this study, organoclay-containing polystyrene (PS)-based nanocomposites were fabricated by extrusion in the presence of thermoplastic elastomer modifiers. Styrene–butadiene–styrene (SBS) rubber was used as the elastomeric compatibilizer and maleic anhydride (MA) was grafted onto SBS rubber at different ratios. Grafting was made via melt blending. Cloisite® 30B was used as the organoclay and it was added to PS and PS/SBS blends using a corotating twin-screw extruder, followed by injection molding. Clay loading was kept constant as 2 wt%, and the elastomer content was varied between 0 and 40 wt% throughout the study. MA grafted SBS enhanced the intercalation/exfoliation of clay layers resulting in higher tensile strength, modulus, elongation at break, and impact strength with respect to neat PS. Composites containing 15 wt% MA grafted SBS displayed the optimum average domain size resulting in the high impact strength without deteriorating the tensile strength and modulus values. Elastomer addition increased the glass transition temperature of the samples due to branching or cross-linking during extrusion. PS and PS/SBS exhibited similar melt flow index values with their organoclay-containing composites. MA acted as a plasticizer and decreased viscosity. Scanning electron microscopy study indicated that dispersion of clay layers was observed at the PS-SBS interphase and also in the elastomer phase. Intercalated and exfoliated structures of organoclay layers were confirmed by X-ray diffraction and transmission electron microscopy analyses.
Introduction
Polymer–clay nanocomposite can be defined as a polymer or copolymer having intercalated and/or exfoliated platelets obtained from a layered material. 1 –4 Over the past decade, polymer–clay nanocomposites have attracted considerable interest in both academia and industry, owing to their outstanding mechanical properties such as stiffness, strength, and modulus with only a small amount of the nanoadditives. This is caused by the large surface area to volume ratio of nanoadditives when compared to micro- and macro-additives. 5 –10
Polystyrene (PS) belongs to the group of standard thermoplastics that also includes polyethylene, polypropylene, and polyvinylchloride. Because of its special properties, PS can be used in an extremely wide range of applications. It is a versatile polymer whose principal characteristics include transparency, ease of coloring and processing, and low cost. 11 Because of the brittle characteristics of PS, the basic development trends were directed to copolymerization of styrene with polar monomers such as methacrylates or maleic anhydride (MA) and elastomeric modifiers. 12 –14 Block copolymers, which are compatible with the polymer matrix, are also used for the impact modification of PS. Compatibility is directly related with the ability of the rubber phase to disperse itself uniformly to reduce interfacial tension and to improve adhesion. 15
There are some studies in the literature that reported the influence of the compatibilizer on dispersion of organoclay in the PS-based nanocomposites. In these research works, it was confirmed that dispersion and arrangement of clay layers into PS matrix were greatly enhanced in the presence of several modifiers. 16 –28 There are various types of block copolymers used for impact modification of PS, but commercially available styrene–butadiene–styrene (SBS) block copolymer is the most preferred candidate due to its ability to form distinct styrene (hard phase) and diene (rubber phase) domains with well-defined morphologies. Elastomeric character of SBS leads to improved mechanical ductility in addition to level up the compatibilization with an organoclay phase. 29 –35
The purpose of this study is to investigate the effects of compatibilizer and grafted MA ratio on the morphology, mechanical, thermal, and rheological properties of PS-based composites. SBS copolymer and MA-grafted SBS (SBS-g-MA) were used as the compatibilizers and Cloisite® 30B was used as the organoclay. In order to modify the SBS rubber, MA was grafted onto SBS by means of melt blending process. Grafting of MA onto SBS was applied at 1% w/w and 2% w/w ratios. Then, PS/SBS, PS/SBS-g-MA (1 wt%), and PS/SBS-g-MA (2 wt%) blends were prepared by melt compounding method. These blends are denoted as binary blends. Using the same procedure, PS/organoclay (PS/NC) denoted as the binary nanocomposite and ternary nanocomposites containing PS/elastomer/ 2 wt% organoclay were also compounded using a twin-screw extruder. Pure PS was also subjected to the same compounding mechanism in order to compare the test results. In order to characterize the nanocomposites, all standard test specimens were prepared by injection molding. X-ray diffraction (XRD) analyses were performed in order to observe the dispersion of the organoclay in the PS matrix. Scanning electron microscopy (SEM) and transmission electron microscopy (TEM) techniques were performed to investigate the dispersion of elastomeric phase and effects of organoclay on domain sizes. Thermal characterization of the nanocomposites was performed by differential scanning calorimetry (DSC). Rheological properties were determined by melt flow index (MFI) measurements and viscosities of the raw materials were observed at different shear rates by capillary viscometry. Mechanical characterization of the nanocomposites was performed by tensile and impact tests.
Experimental
Materials
PS with a trade name of Lacqrene® 1960N was used. It has an MFI of 30 g/10min and density of 1.05 g cm−3. It was purchased from Total Petrochemicals USA, Houston, Texas and supplied in the form of pellets in 25 kg polyethylene bags. The organoclay, Cloisite® 30B, was purchased from Southern Clay Products (Gonzales, Texas, USA). Styrene–butadiene–styrene (SBS) rubber with a trade name of Elastron D was purchased from Elastron Kimya AS (Turkey) and supplied in the form of pellets. It is SBS type extrusion grade elastomer with shore D hardness of 65 and density of 0.89 g cm−3. MA (2,5-furandione) used in this study was purchased from Sigma-Aldrich Chemicals Co. (USA). Molecular weight of MA is 98.06 g mol−1.
Production of blends and composites
Acorotating twin-screw extruder was used in order to obtain ternary nanocomposites. The model of the extruder is Thermoprism TSE 16 TC (Thermo Fisher Scientific Inc., Waltham, Massachusetts, USA) with L/D = 24 (L: flighted length of the screw and D: outside diameter). Intermeshing twin screws rotate in the same direction in order to disperse small agglomerates in polymer melt with high shear rate. It contains kneading blocks that consist of four kneading discs with a staggering angle of 45°. The screw diameter and the twin bore diameter of the extruder are 15.6 and 16 mm, respectively. It has a barrel length of 384 mm. In addition to these, maximum screw speed and maximum torque that can be achieved are 500 r min−1 and 12 Nm. During the extrusion process, temperature profile of the hopper, the mixing zones and the die, the screw speed, and the total flow rate of feed were kept constant. Process temperatures were 30, 200, 200, 200, and 200°C for the hopper, the three mixing zones, and the die, respectively. The screw speed and total flow rate of feed were kept constant at 150 r min−1 and 25 g min−1 throughout the process. In order to obtain the desired compositions, inlet flow rates of the main feeder and the side feeder were calibrated before each extrusion run. The molten product obtained from the extruder barrel was cooled by passing through a water bath, whose temperature was continuously controlled. At the end of the water bath, a blower was placed in order to remove the water from the product surface, and finally the product was collected in plastics bags after passing through the pelletizer. In order to modify SBS rubber, 1 and 2 wt% of MA was grafted by means of an extruder. Predefined amounts of MA and SBS rubber were manually premixed and then this mixture was fed into the extruder at the same operating conditions mentioned earlier. PS/compatibilizer mixture was fed from the main feeder of the extruder, and clay was fed from the side feeder of the extruder. All extruded blends and nanocomposites were dried overnight at 80°C. After the extrusion, the specimens were injection molded by DSM Xplore (Sittard, the Netherlands) laboratory scale micro injection molding equipment. During the molding process, the melt and mold temperatures were set to 200°C and 30°C, respectively, for all the samples.
Characterization techniques
The composites containing organoclay were analyzed by using a Rigaku D/Max 2200/PC X-ray (Rigaku Corp., Tokyo, Japan) diffractometer that generates a voltage of 40 kV and current 40 mA from Cu Kα radiation source (λ = 1.5418). The diffraction angle 2θ was scanned from 1° to 10° with a scanning rate of 1° min−1 and a step size of 0.02°. Bragg’s law was used to calculate the distance between the silicate layers. The samples for XRD analyses were obtained from injection-molded specimens. The apparent shear viscosities of the raw materials were measured by using LCR Series capillary rheometer (Dynisco Instruments Ltd., Massachusetts, USA). The experiments were performed at 200°C and in the range of shear rate from 1.37 to 412 (1/s). The dimensions of the die were 30.48 mm capillary length and 0.762 mm capillary diameter. SEM analysis was performed by a JEOL JSM-6400 (JEOL Inc., Massachusetts, USA) low-voltage scanning electron microscope. The impact fracture surfaces were etched in an ultrasonic bath for 15 min at 30°C, by using n-heptane to dissolve the elastomeric phase. Before SEM photographs were taken, the fractured surfaces were coated with a thin layer of gold in order to obtain a conductive surface. SEM photographs were taken for each specimen at 250× and 1500× magnifications. For TEM analysis, sections of 70 nm in thickness were cryogenically cut with a diamond polymer knife at a temperature of −100°C for PS/organoclay and PS/elastomer/organoclay nanocomposites. These samples were examined by a FEI (Oregon, USA) transmission electron microscope at an acceleration rate of 80 kV. All samples were trimmed parallel to the molding direction. The glass transition temperature (T g) measurements of the samples were carried out under nitrogen atmosphere by using Perkin Elmer (Waltham, Massachusetts, USA) Diamond differential scanning calorimeter. Samples were heated from 20°C to 350°C with a heating rate of 20°C min−1. Tensile tests were performed for each composition according to ASTM D638M-91a using a Lloyd LR 30 K (West Sussex, UK) Universal Testing machine. The crosshead speed was calculated as 3 mm min−1, based on the gauge length of 30 mm and strain rate of 0.1 min−1. The tensile strength, tensile modulus, strain at yield, and strain at break values were obtained by testing five samples for each composition and taking the averages. In order to perform unnotched Charpy impact tests, injection-molded samples with dimensions of 80 × 10 × 4 mm were used with the Ceast Resil Impactor (Ohio, USA). All of the tests were performed at room temperature. At least five samples were used for each composition set and the average and standard deviation values were calculated. MFI test was performed according to ASTM D1238-79 using an Omega Melt Flow Indexer (Connecticut, USA). The measurements were carried out at 200°C with a load of 2.16 kg. The weight of the sample passing through the die in 10 min, defined as melt index, was determined for all compositions. At least five measurements were done for each sample to get accurate results.
Results and discussion
XRD study
XRD analysis has been widely used to analyze the dispersion of organoclay in the polymer matrix and the interlayer spacing of the silicate layers. For intercalated structures, the characteristic peak tends to shift to a lower angle due to the expansion of the basal spacing. 36 –38 Although the layer spacing increases, attractive force still exists between the clay layers to stack them in an ordered structure. Change in intensity and the shape of the basal reflections are the evidence that specifies the intercalation of polymer chains. 39,40
The basal spacing values of all the compositions are shown in Table 1. The basal spacing of the organoclay was found as 18.1 Å. Cloisite® 30B has high polarity. Therefore, it is expected to be compatible with polar elastomers. Figure 1 shows the XRD pattern of nanocomposites containing organoclay and different ratios of pure SBS (Figure 1(a)), 1 wt% SBS-g-MA (Figure 1(b)), and 2 wt% SBS-g-MA (Figure 1(c)). As the compatibilizer content increased, peaks in XRD patterns became broader and the intensities decreased. Cloisite® 30B is a polar organoclay, thus it is expected to be more compatible with chains that exhibit polarity. The results showed that increasing these aromatic thermoplastic compatibilizers content causes intercalation and exfoliation of the organoclay layers. Owing to their polar nature, SBS-g-MA chains have higher compatibility with Cloisite® 30B in comparison to PS chains do. Thus SBS-g-MA chains can enter between the clay layers more easily in comparison to PS chains can. Comparison of Figure 1(a) with Figure 1(b) and (c) shows that the XRD patterns of the ternary nanocomposites prepared with SBS-g-MA show broader peaks indicating larger interlayer spacing distribution. Thus, it can be said that the elastomer SBS-g-MA acts as a suitable compatibilizer for the PS/clay system studied.
XRD results of all compositions.
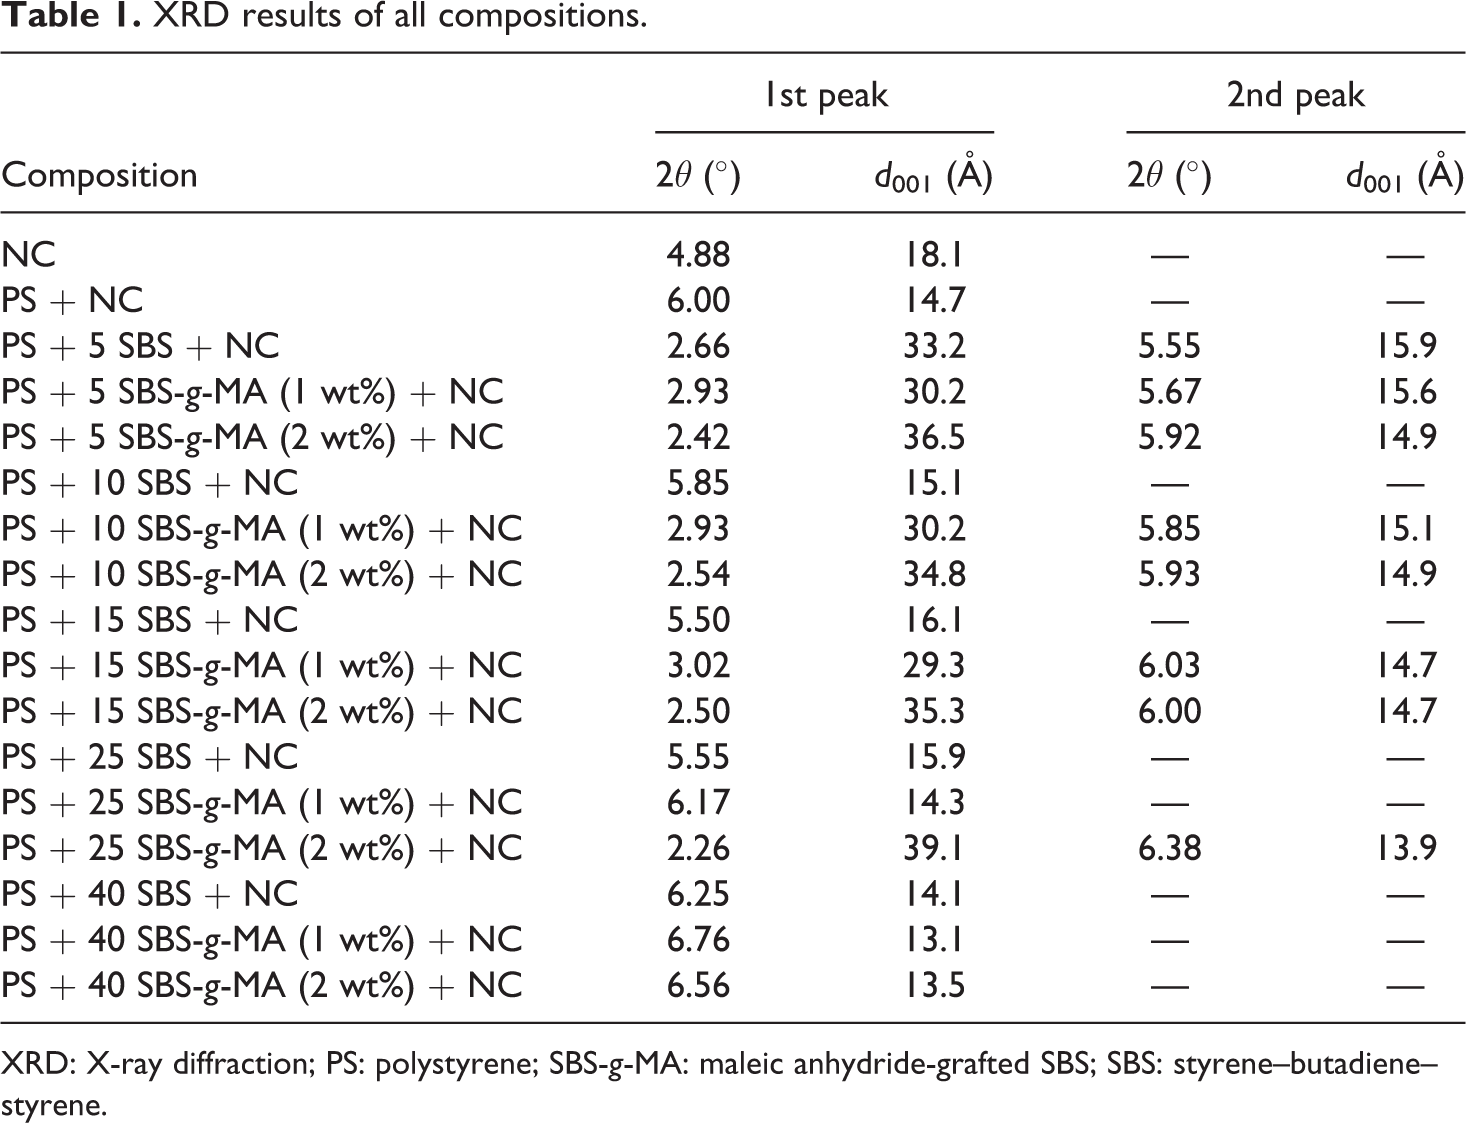
XRD: X-ray diffraction; PS: polystyrene; SBS-g-MA: maleic anhydride-grafted SBS; SBS: styrene–butadiene–styrene.
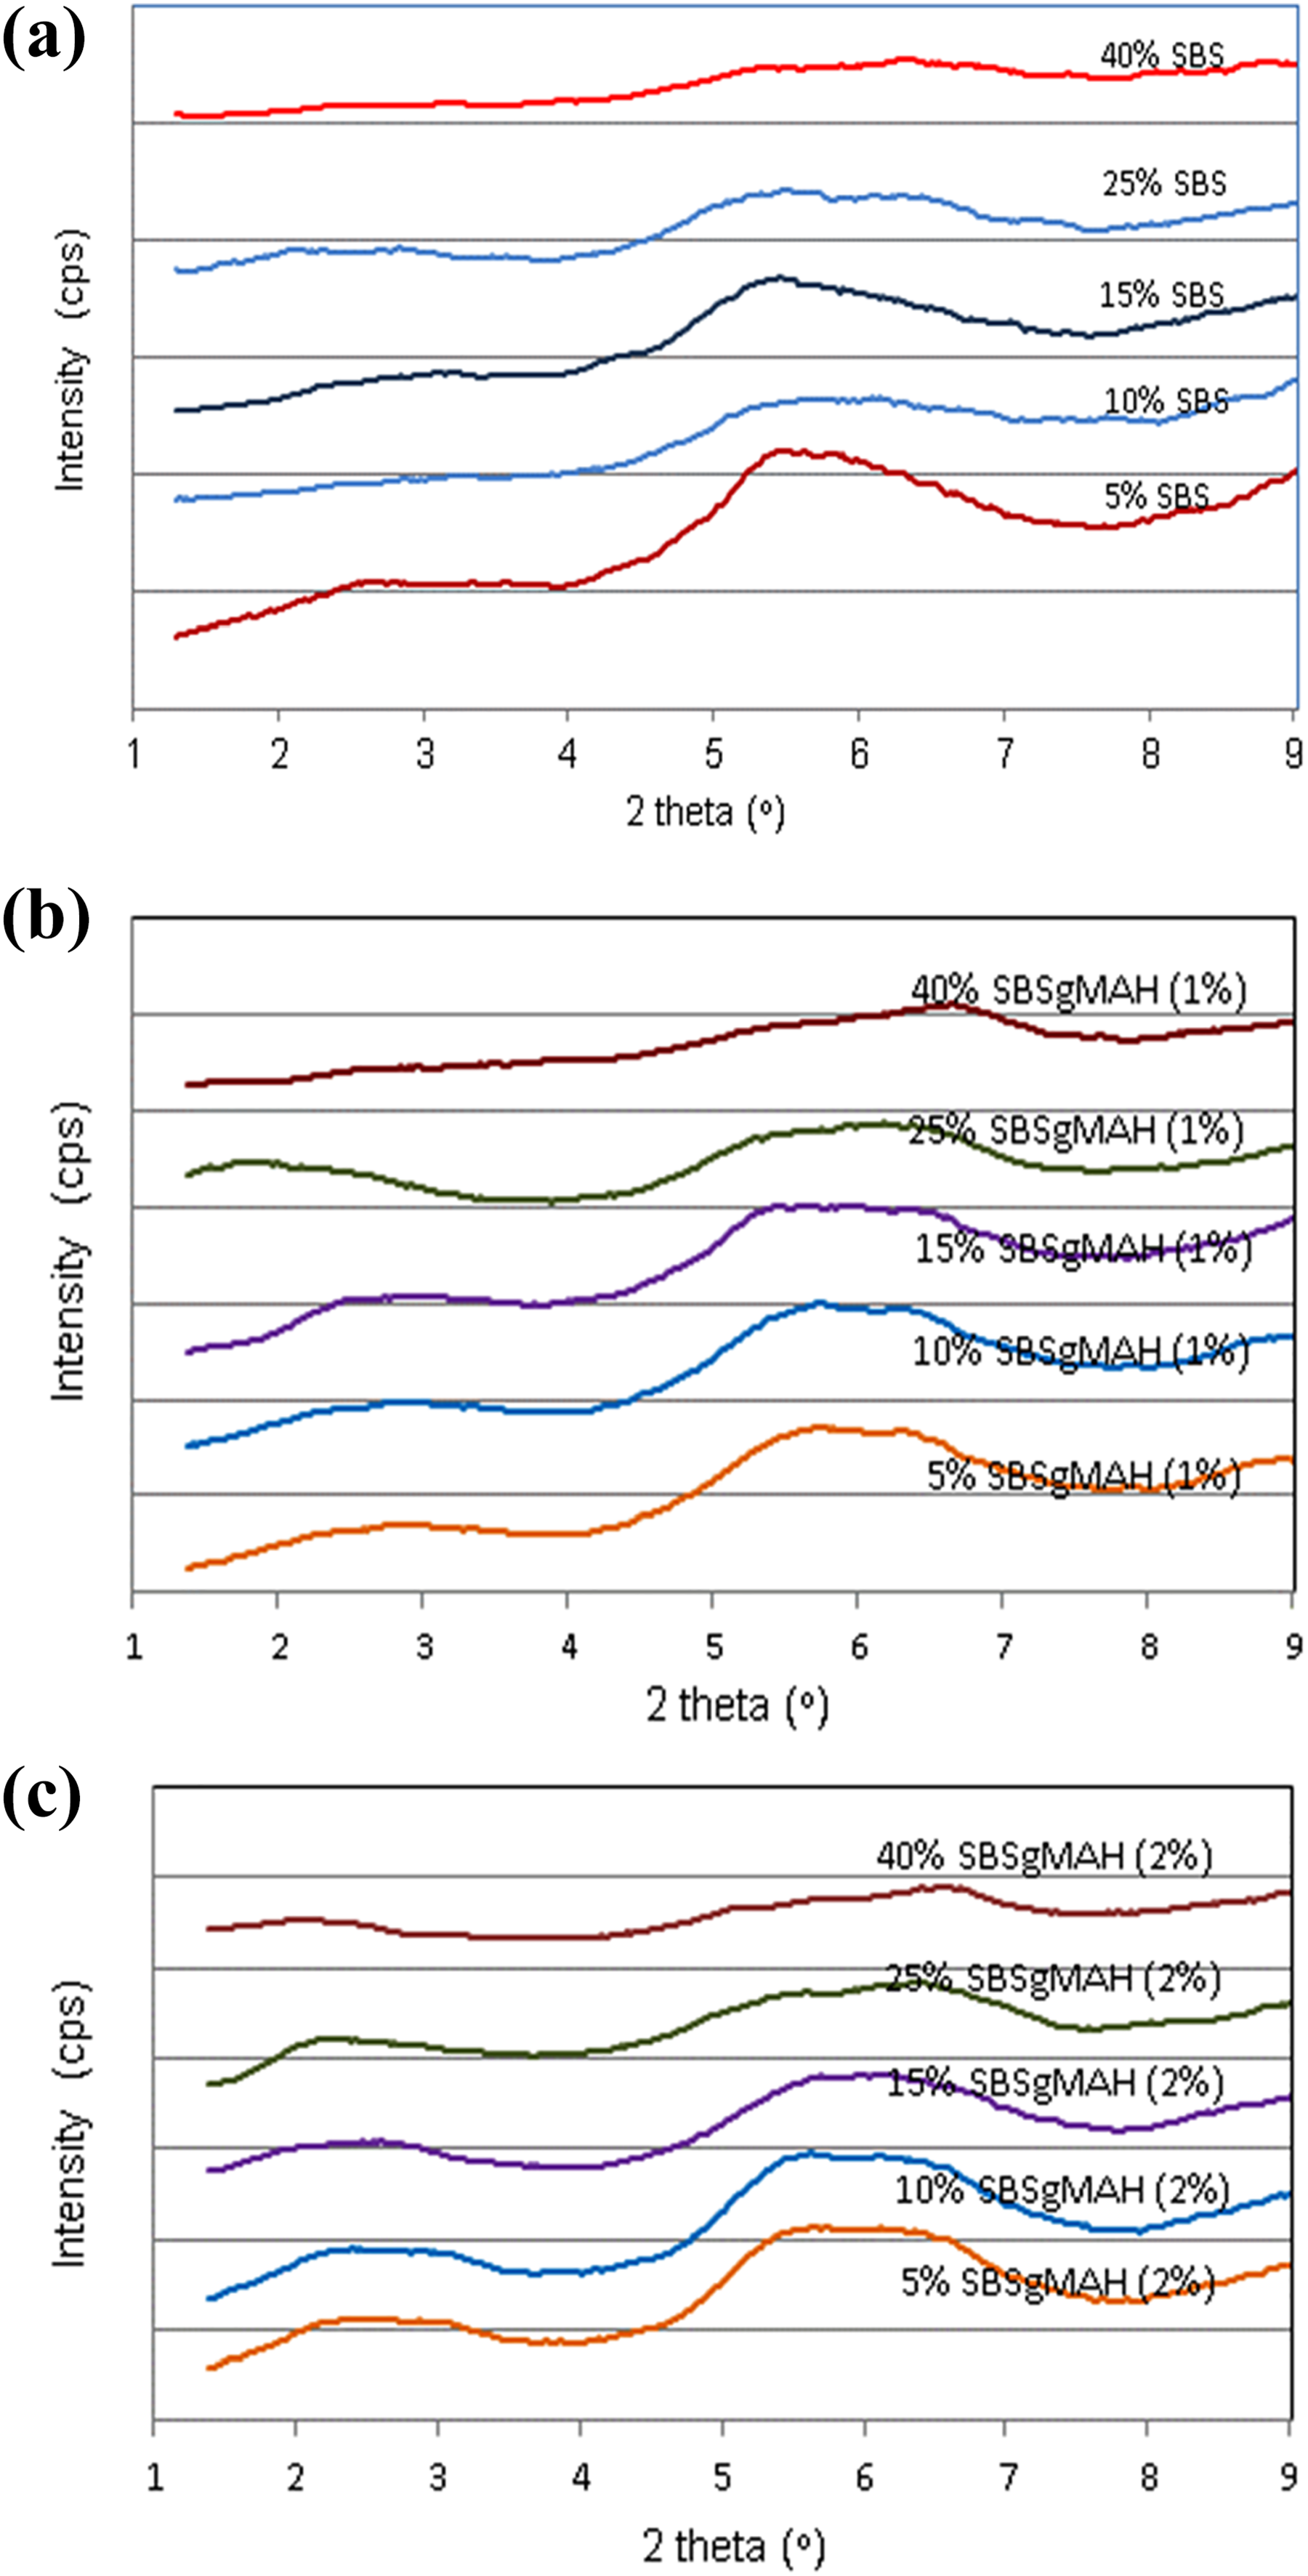
XRD patterns of the nanocomposites containing organoclay and different ratios of pure SBS (a), 1 wt% SBS-g-MAH (b), and 2 wt% SBS-g-MAH (c).
SEM analysis
The fracture surface of composites and blends were examined by SEM analysis in order to investigate the effect of elastomer and organoclay additions on the morphology of PS. Image J software (ImageJ2 developed by NIH and LOCI, University of Wisconsin) was used to analyze the dispersion of the elastomeric phase in the PS matrix. In order to obtain accurate results, about 50–100 domains were analyzed and average domain sizes (d av) of each sample were calculated. The calculated d av values are indicated on SEM photographs for each sample as displayed in Figure 2. According to SEM images, domains in PS matrix are formed from dispersed droplets. As shown later by TEM results, clay particles mostly reside at the interphase between PS and elastomeric domain. As the amount of the dispersed phase increases, the average domain size increases and a less uniform domain distribution is observed. This is related with droplet coalescence during melt mixing, which results in broadening of the domains. Since the elastomeric phase has a higher viscosity than PS matrix, its presence increases the viscosity of the blend and the shear stress applied on the clay platelets during extrusion. 41 The concentration where the co-continuous phase morphology becomes observable is called the “phase inversion” point. As seen from the SEM results, PS/SBS and PS/SBS-g-MA blends exhibit inversion between 25% and 40% content of elastomeric phase. In general, the ternary nanocomposites have larger domain sizes than the binary blends that have the same PS/elastomer ratio and no organoclay. If the organoclay particles were completely dispersed in the PS matrix, the clay platelets would suppress the agglomeration of the elastomeric domains. 42,43 However, in this study, the average domain size increases with organoclay addition, no matter whether it is well dispersed or not, because the clay particles mostly reside at the interphase between PS and elastomeric material. Due to filler effect of the clay particles, viscosity of the elastomeric phase increases. Increasing viscosity of the elastomeric phase may cause formation of larger elastomeric domains in the PS matrix. According to Figure 2, in nanocomposites containing SBS-g-MA (2 wt%), elastomeric domain sizes were in general lower than in the nanocomposites with SBS or SBS-g-MA (1 wt%). This case can be explained by the creation of new bonds due to MA. 44 MA group has ability of reacting with the hydroxyl groups of the clay surface and also forming hydrogen bonds. These bonds restrict the increase of elastomeric domain size. As in the case of 5 and 10 wt% elastomer-containing nanocomposites, the addition of organoclay makes the elastomeric domains larger. When the SEM micrographs of nanocomposites containing 40 wt% elastomer are considered, the interconnected structure of the minor component can be seen. The entire minor component incorporates into a single continuous phase network inside the PS matrix and a fully co-continuous morphology is observed. Since a co-continuous structure is observed at 40 wt% elastomer content, it can be said that the phase inversion occurs between 25 and 40 wt% elastomer content. According to these results, it is obvious that the phase inversion point shifts to lower dispersed phase content with the addition of organoclay. This is an indication of the dispersion of clay layers at the PS-elastomer interphase and also in the elastomer phase. Since clay particles lead to enlargement of the domains, the phase inversion in PS/SBS/Cloisite® 30B nanocomposites occurs at lower elastomer content in comparison to binary nanocomposites.
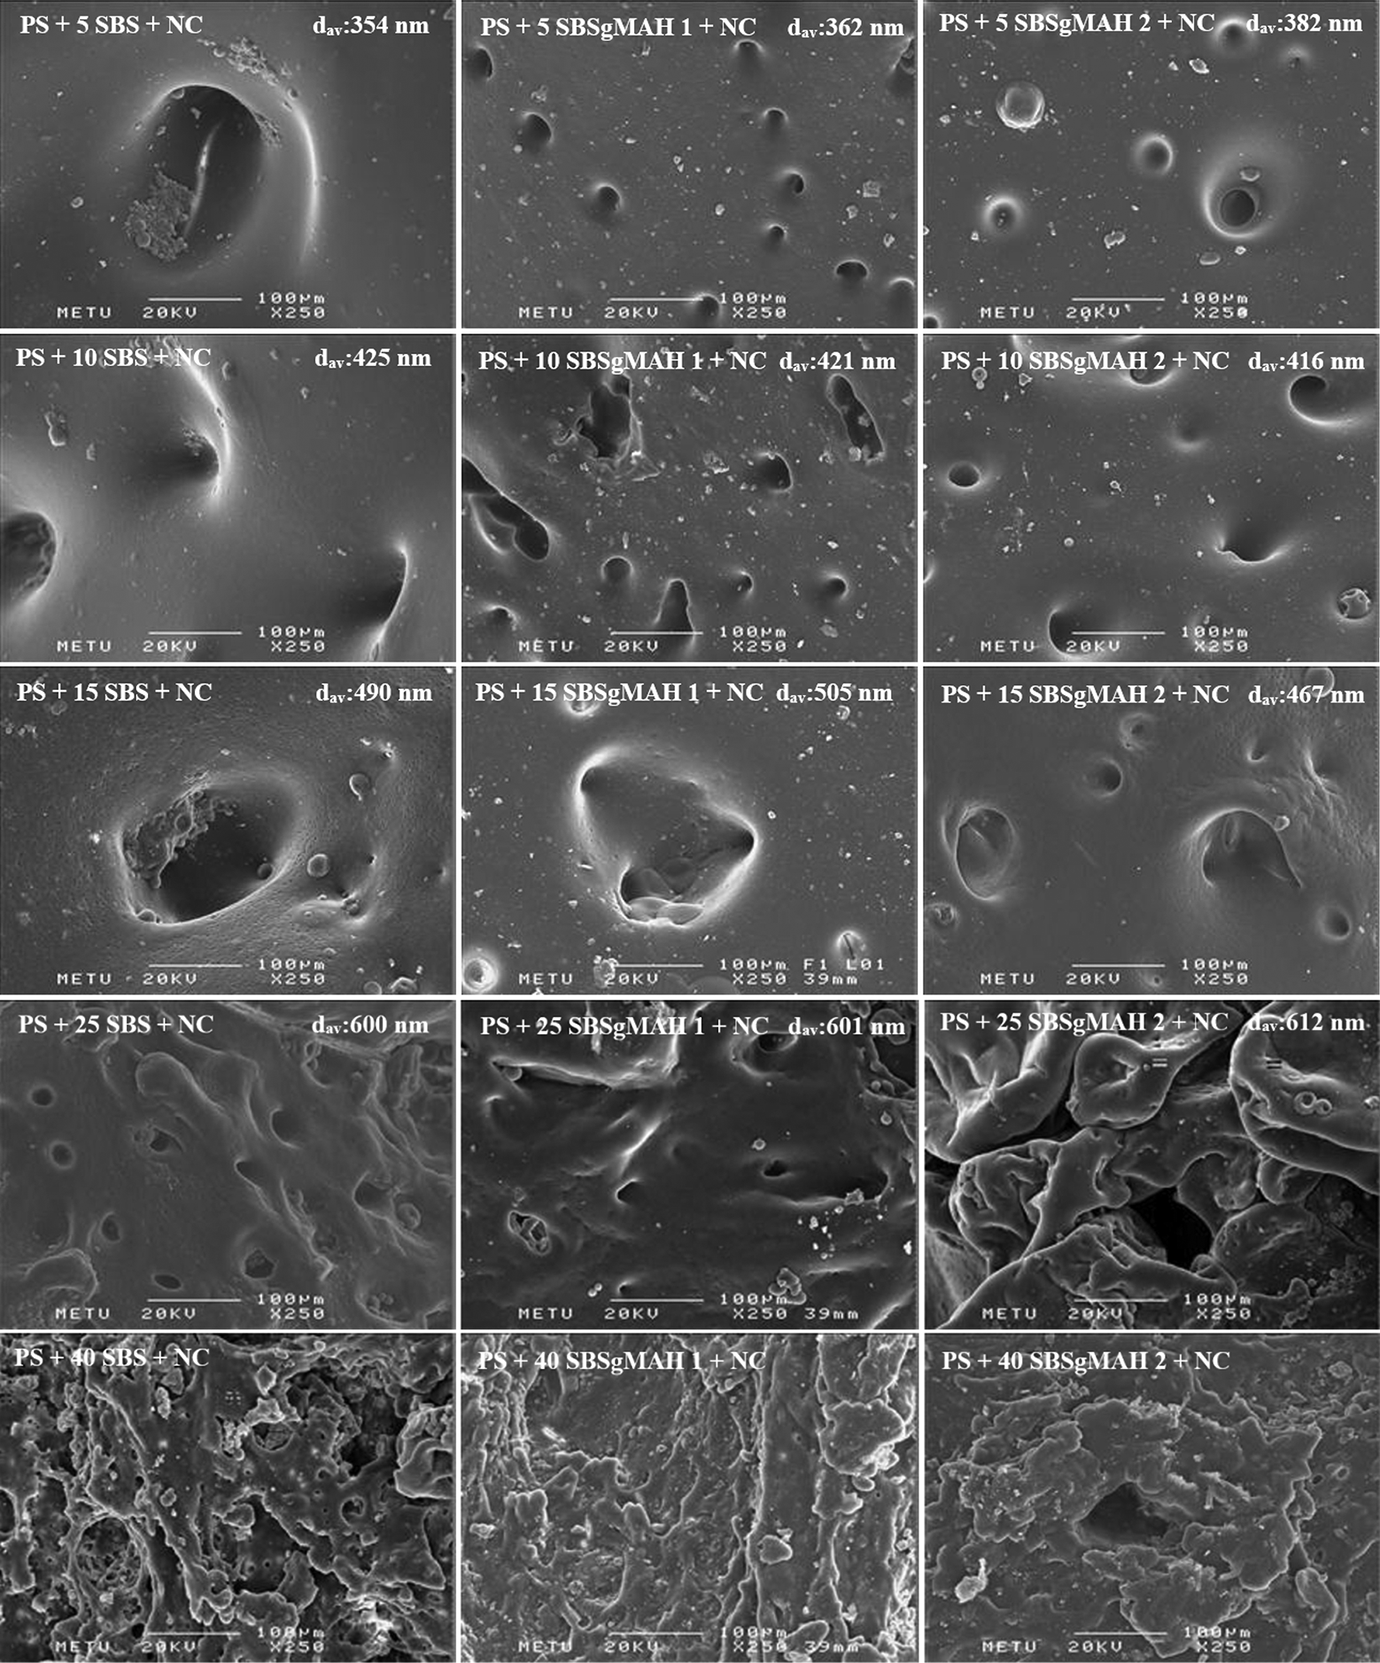
SEM photographs of the nanocomposites.
TEM analysis
TEM study is performed to validate the internal nanometer scale structure and morphology of the nanocomposites by providing the distribution of various phases, through direct visualization. TEM images of the ternary nanocomposites containing organoclay are shown in Figure 3. The visible black domains represent the agglomerated clays in TEM images. If the dispersion of clay layers is well, these domains appear as ribbons that indicate the delaminated layers of clay. Beside this, the gray areas represent the PS matrix and white domains represent elastomeric phase which are dispersed in the PS matrix. As can be seen from Figure 3, the clay particles are localized both at the interphase between the PS and the elastomeric material and inside the domains of elastomeric material. Although domains appear in circular shape in SEM images represented previously in Figure 2, they appear as elliptical shape in TEM images. The reason of this difference may be explained by the cutting direction. The TEM samples were cut parallel to the direction of injection molding, whereas the SEM samples were analyzed perpendicular to this direction. As compared to TEM images of nanocomposites containing SBS, it appears that better dispersion of the clay platelets was obtained in the nanocomposites containing SBS-g-MA. Dispersion of clay layers in nanocomposites containing 25 wt% of elastomer is better than the nanocomposites containing 5 wt% of elastomer. However, exfoliated structures are not observed in any of the samples. The reason for this observation may be the encapsulation of clay particles by the elastomeric phase and the restricted dispersion of elastomeric phase in the PS matrix. Figure 3 also indicates that the dispersion of clay layers gets better as SBS-g-MA content increases.
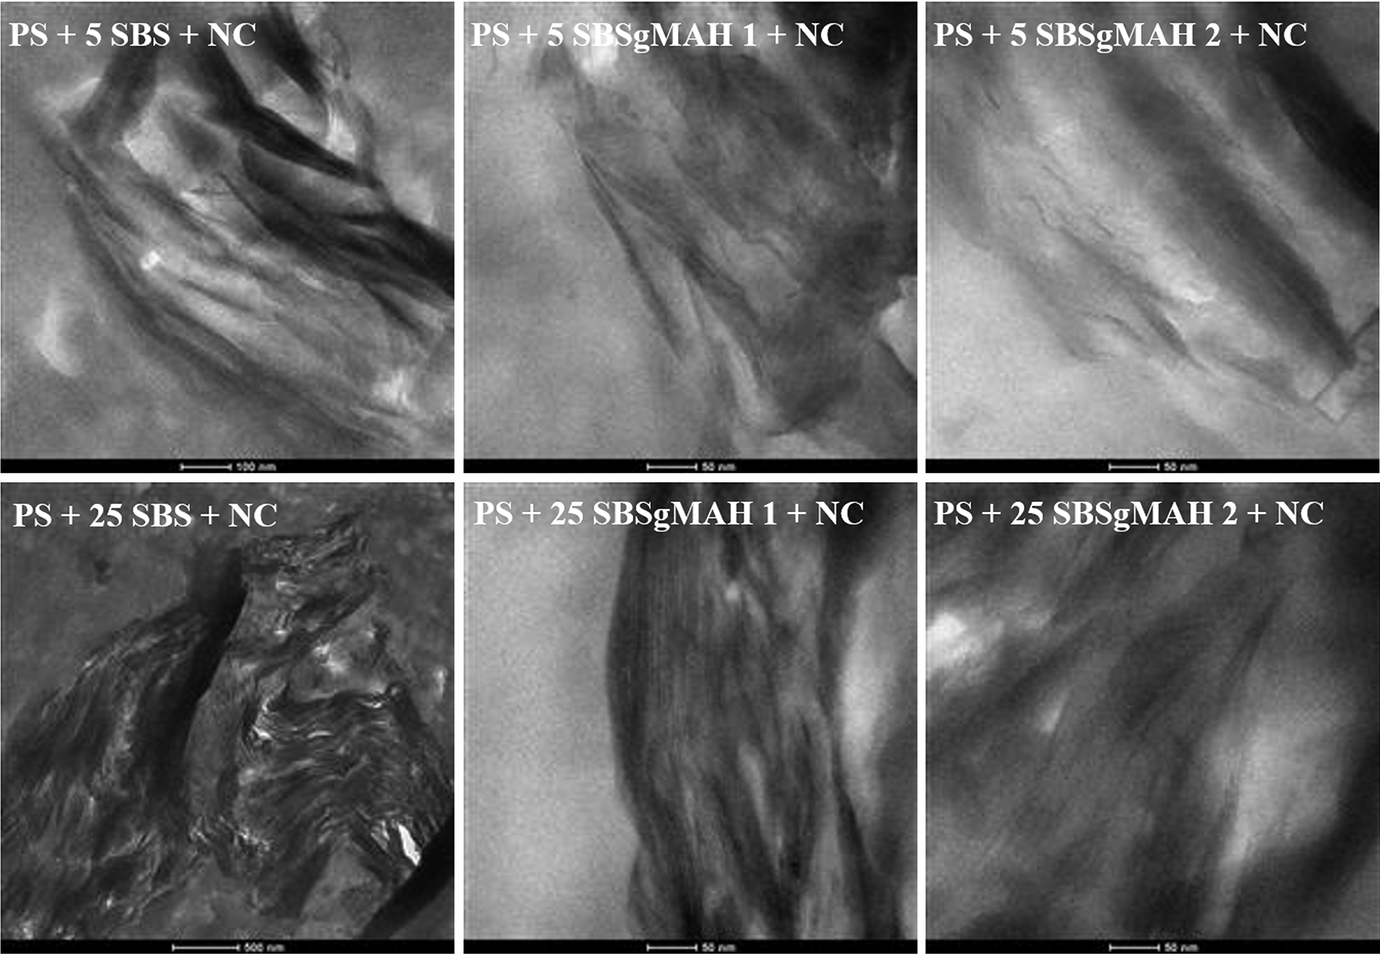
TEM images of the nanocomposite
Capillary viscometry study
Capillary viscometer was used to obtain the melt viscosity values of the raw materials. Measurement of viscosity was made at 200°C. The apparent and Rabinowitsch corrected melt viscosity data of the raw materials used in this study are shown in Figure 4. PS has a higher viscosity than SBS. It can be said that viscosity ratio for PS/SBS blends does not change abruptly at high shear rates. The reason for the lower viscosity of SBS-g-MA (1%) in comparison to the viscosity of SBS-g-MA (2%) is that MA also acts as a plasticizer at low concentrations. As the MA concentration increases, branching occurs and this results in increase in viscosity that is observed in the viscosity of SBS-g-MA (2%). SBS and SBS-g-MA chains can easily penetrate between the clay layers owing to their higher mobility than the PS chains, since PS matrix has higher viscosity than SBS and SBS-g-MA.
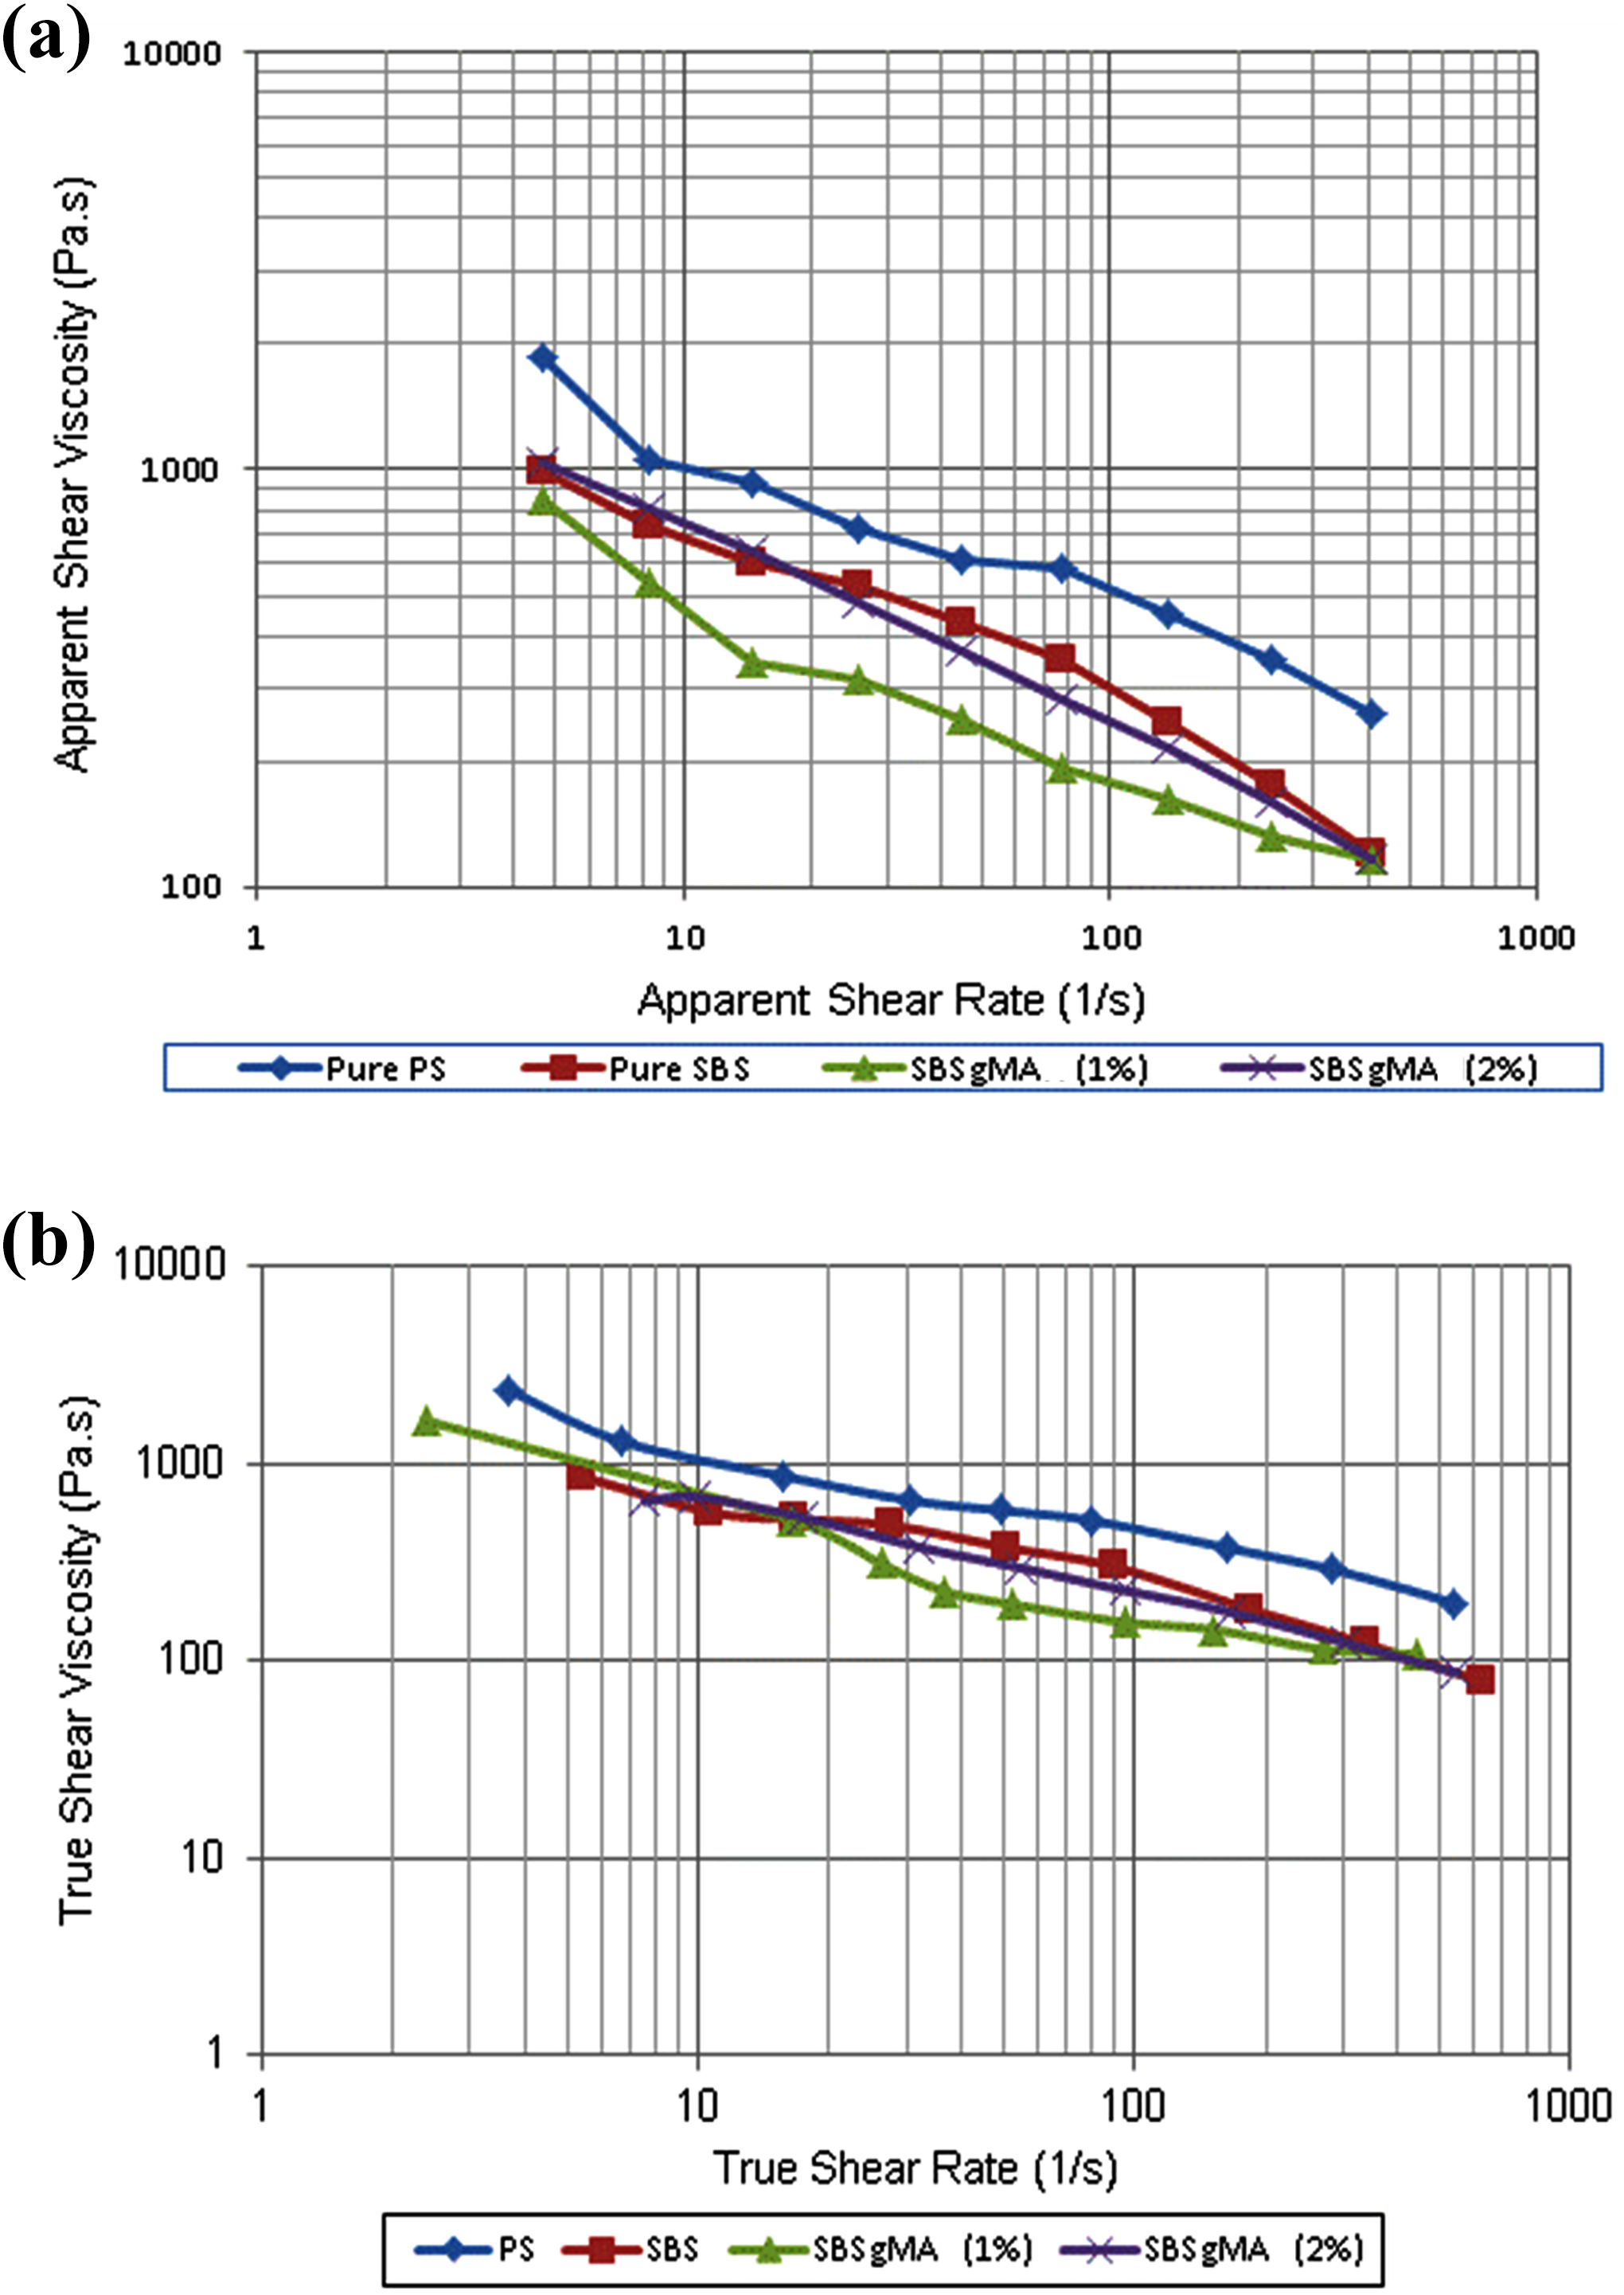
Apparent (a) and true (b) viscosity measurements of the materials.
MFI measurements
MFI test was performed to investigate the flow processing behavior of the thermoplastics. MFI values of the samples are shown in Table 2. It was found from capillary viscometry results that PS has higher viscosity than SBS. However, Table 2 indicates that in MFI tests both of the components have close MFI values. This situation can be explained by the different behavior of the materials under different shear rates, and the nature of capillary measurements and MFI tests. In capillary measurements, the shear rate is constant. However, in MFI tests, the shear rate varies through the test. Although PS, SBS, and SBS-g-MA have similar MFI values, blends prepared with these materials have higher MFI values than the constituents. In some cases, polymer blends show nonideal behavior. If two polymers are miscible, a maximum can be seen in the MFI values. On the contrary, if the polymers are immiscible, a minimum MFI value can be seen. 45 As seen from Table 2, blends of PS/SBS and PS/SBS-g-MA have higher MFI values in comparison to MFI values of pure PS, pure SBS, or pure SBS-g-MA. This result shows that PS is miscible with both SBS and SBS-g-MA. It can also be said from the results in Table 2 that MA acts as a plasticizer and decreases viscosity, thus it increases the MFI values of the samples containing SBS-g-MA in comparison to SBS. As expected, the addition of organoclay to the PS/SBS and PS/PS-g-MA blends decreases the MFI (increases the viscosity) slightly. If the clay layers were exfoliated totally, the melt viscosity would have increased significantly. However, due to poor dispersion of the clay in the PS matrix, the decrease in MFI values (increase in viscosity) is small. Intercalation and exfoliation of the clay platelets require diffusion of polymer chains into the silicate layers. Also, the bottom and top clay layers peel away as promoted by the application of shear stress and by the polymer adsorption. 46 As the viscosity increases, the shear stress applied on the clay platelets also increases and cause separation of the clay layers. MFI values of the nanocomposites studied are lower compared to the MFI values of the respective blends, since the clay platelets mostly act as fillers and restrict the flow of molten polymer. 47 –49
MFI test results.
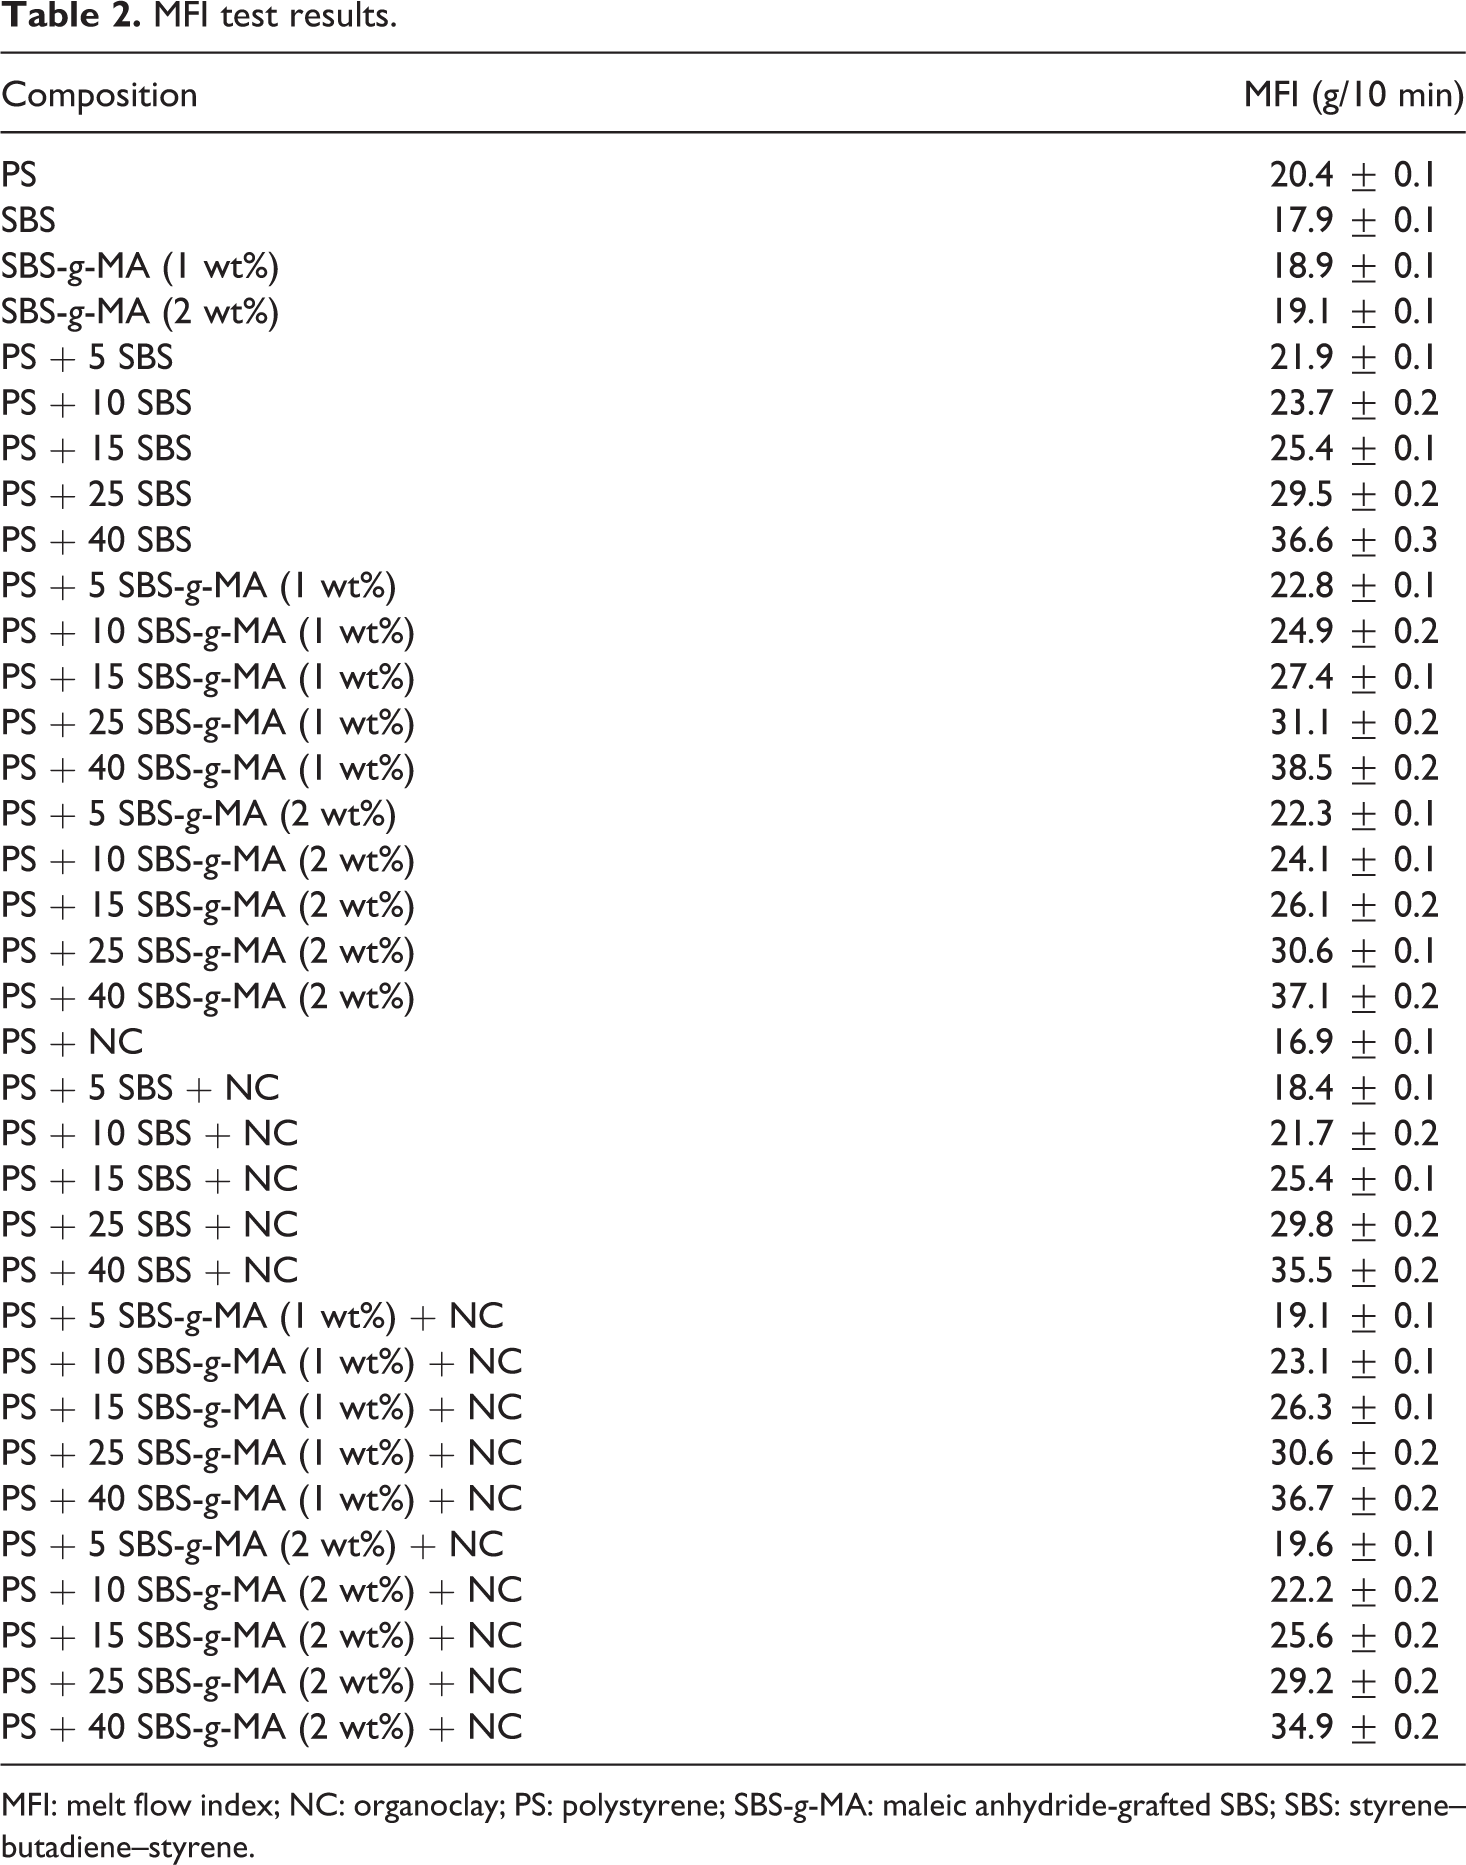
MFI: melt flow index; NC: organoclay; PS: polystyrene; SBS-g-MA: maleic anhydride-grafted SBS; SBS: styrene–butadiene–styrene.
Tensile test
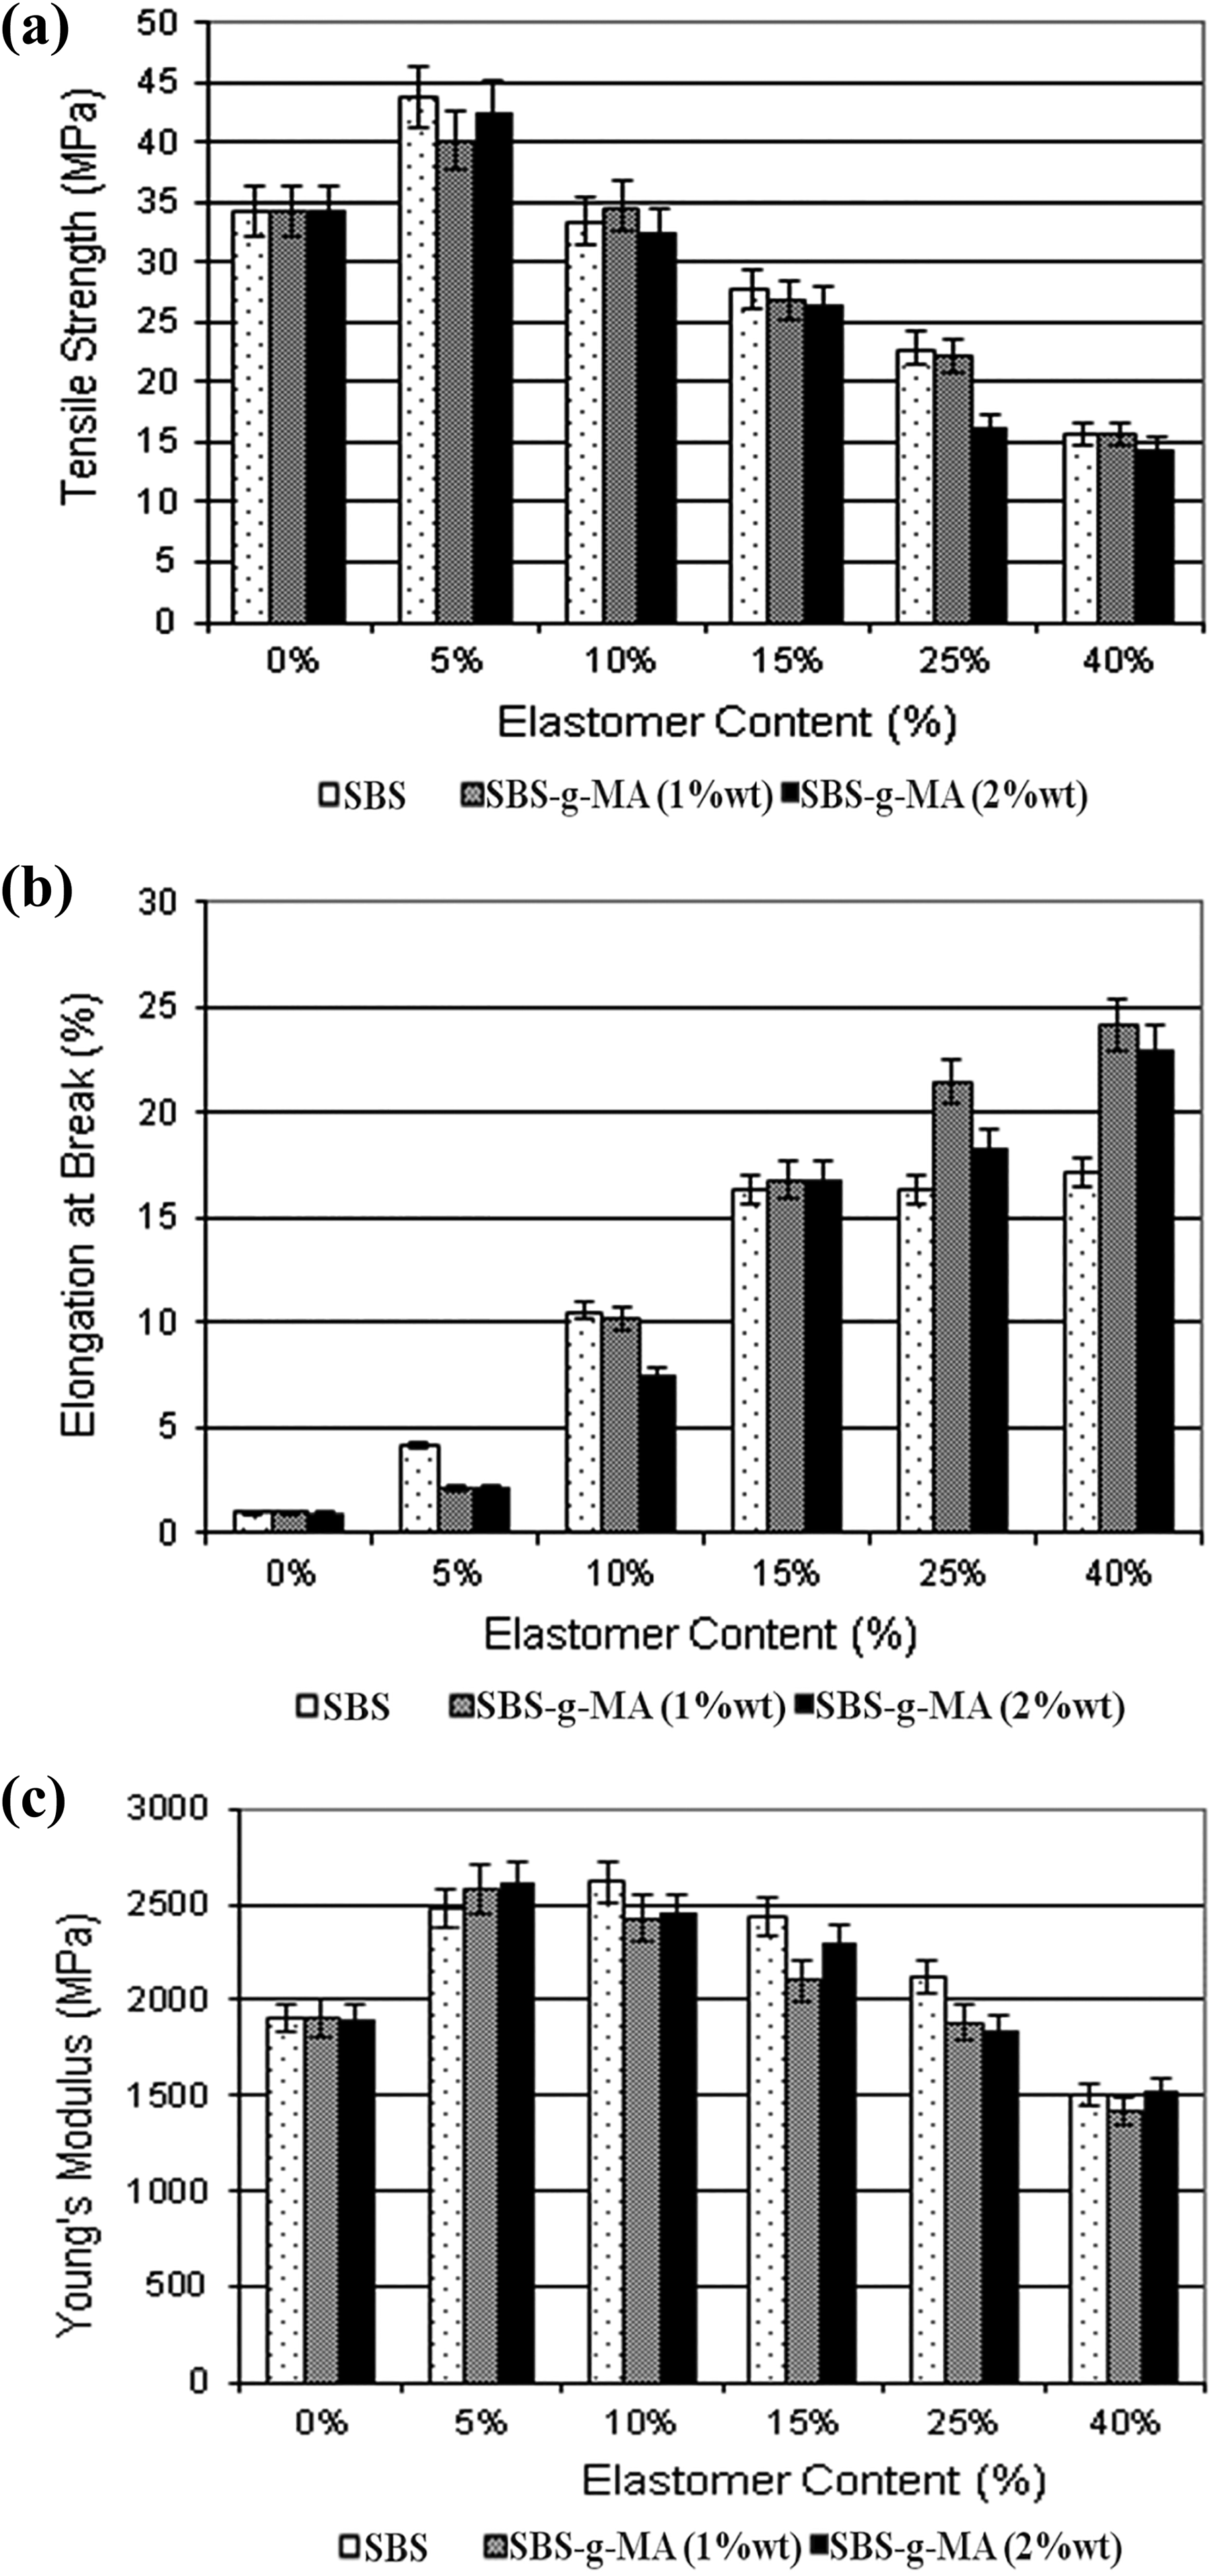
Figure 5 represents the tensile properties of PS/SBS and PS/SBS-g-MA blends with increasing elastomer content. SBS has lower tensile strength and Young’s modulus values compared to pure PS. When they are incorporated, elastomeric materials impart dilution effect. While impact energy (as shown later) and elongation at break values increase, tensile strength and Young’s modulus values decrease due to this effect. Selection of suitable elastomer and optimum elastomer content are important factors to prepare nanocomposites having good mechanical properties. In order to find the proper elastomer and optimum elastomer content, various elastomers have been added to PS at different ratios. Although 5% elastomer addition results in maxima in tensile strength and Young’s modulus, it is not enough to obtain materials with high impact strength (as shown later) which is one of the aims of this study. Thus, in this study, it was decided to increase the elastomer content up to 40%.

Tensile test results of binary composites: (a) tensile strength, (b) elongation at break, and (c) Young’s modulus.
Tensile properties of the nanocomposites containing organoclay and various amounts of elastomer are shown in Figure 6. Comparison of Figures 5 and 6 indicates that when SBS or SBS-g-MA is added to PS/NC composite, the elongation at break values increase continuously, due to the dilution effect, whereas the tensile strength and Young’s modulus values show maxima at 5 wt% elastomer content. The trends with the increasing elastomer content are similar to the ones observed in Figure 5. Organoclay addition makes the polymer matrix stiffer owing to the high aspect ratio and high rigidity of the clay layers. The observed reinforcement effect of the organoclay addition can be explained by the high strength of the clay as well as the increase in the contact area between the organoclay and polymer matrix. 50,51 These results can be partially attributed to the better dispersion of the clay particles in the presence of elastomeric phase as supported with the XRD results. Although the clay addition increased the tensile strength and the Young’s modulus values of the PS/SBS and PS/SBS-g-MA blends, it decreased the elongation at break and impact strength (as shown later) values, since organoclay particles cannot be elongated as much as the matrix can. Among all the samples, the best improvement in the tensile strength value was obtained for the nanocomposites containing clay and 5 wt% SBS. The improvement in tensile strength was about 32% with respect to pure PS. The same composition shows 46% improvement in Young’s modulus and 270% improvement in elongation at break in comparison to pure PS. Thus, it is observed that nanocomposites can show improvement in all the three mechanical properties.
Tensile test results of ternary composites: (a) tensile strength, (b) elongation at break, and (c) Young’s modulus.
Impact test
The impact strength values of the nanocomposites are displayed in Figure 7. Figure 7(a) refers to compounds with no organoclay and Figure 7(b) refers to compounds with 2 wt% organoclay. Figure 7 shows that SBS-g-MA is better than SBS in improving the impact energy in samples with or without organoclay. This is due to higher interaction with the PS matrix provided by SBS-g-MA in comparison to SBS. In samples with organoclay, SBS-g-MA has higher molecular attraction with organoclay in comparison to SBS does. It is also observed that, in general, the ternary nanocomposites have higher impact strength than their binary blend counterparts that have the same elastomer content. The addition of organoclay increases the impact strength owing to the crack-stopping action of the organoclay. Also, the clay particles increase the size of the elastomeric domains that absorb the impact energy and restrict the propagation of the cracks. 52 –54 Composites containing 15 wt% SBS or SBS-g-MA displayed the optimum average domain size, resulting in high impact strength without deteriorating the tensile strength and modulus values.
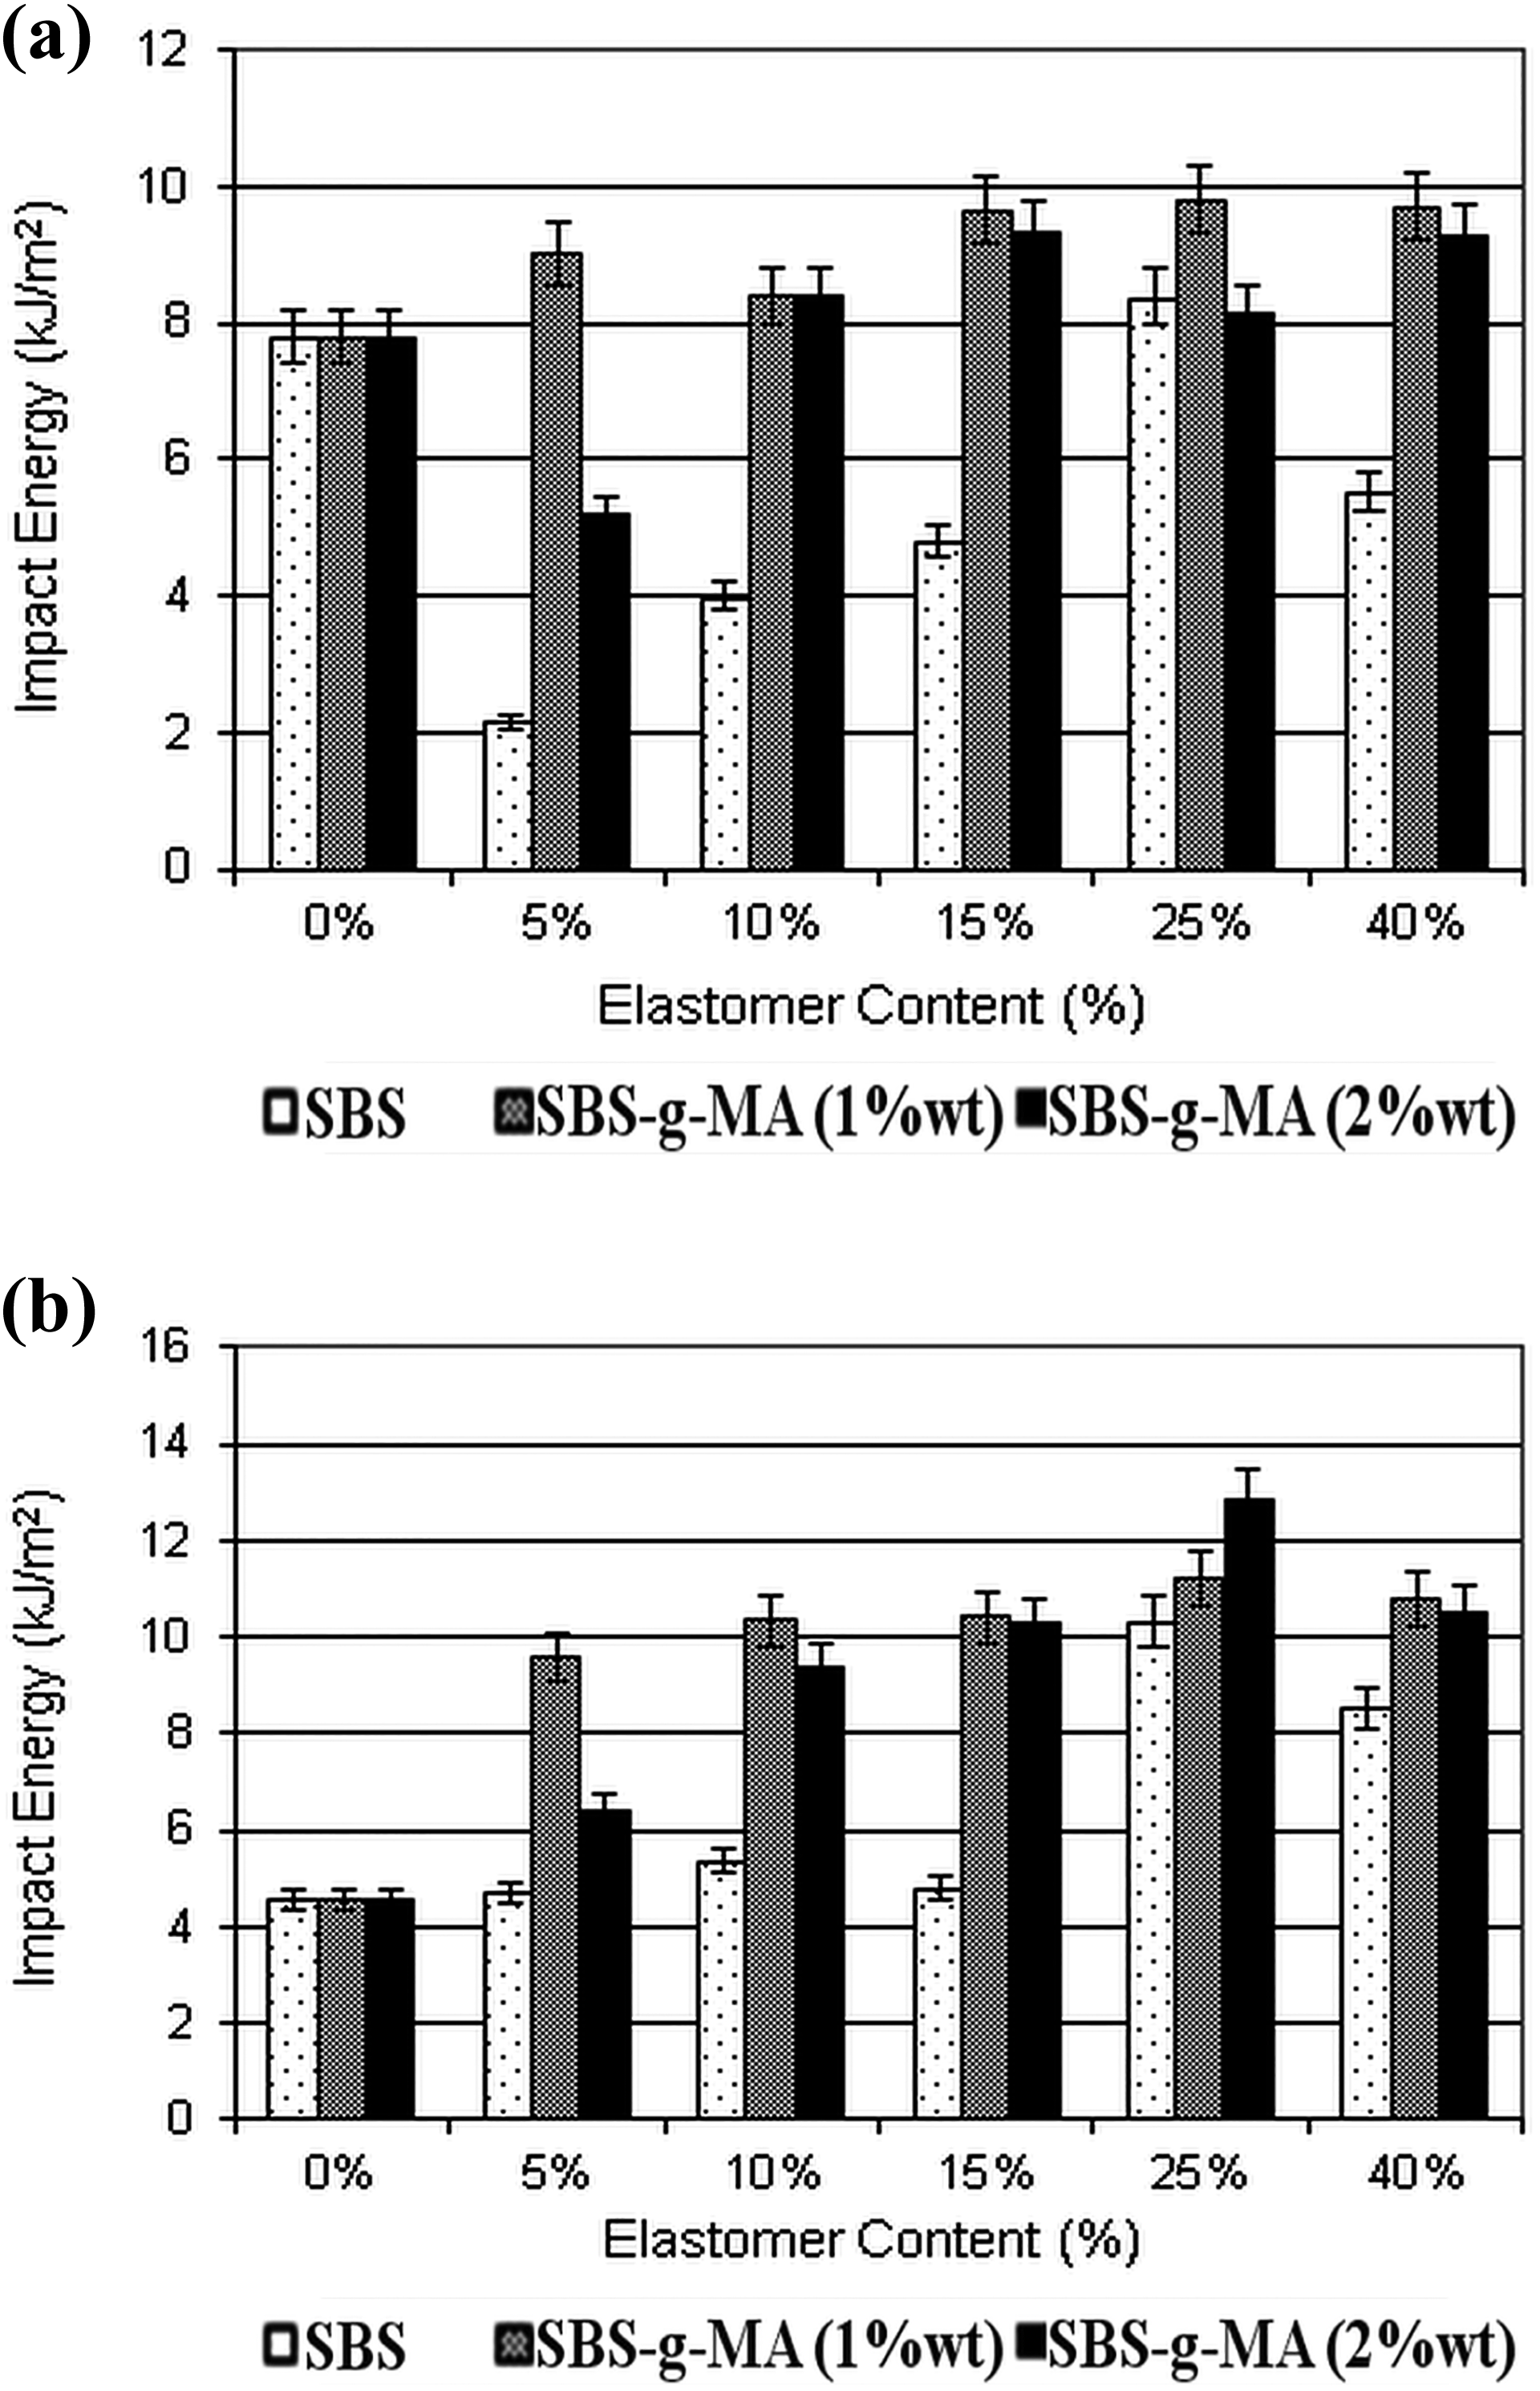
Impact test results of the nanocomposites with no organoclay (a) and 2 wt% organoclay (b).
DSC analysis
In order to observe the effects of organoclay and elastomer additions on the thermal properties of blends and composites, DSC analysis were performed. The measured T g values are shown in Table 3. According to these data, organoclay addition shifts T g of unfilled PS to higher temperatures. Segmental motion of the PS chains may be prevented by the intercalated or exfoliated clay layers and this may lead to increase in T g values. 55 –58 As temperature increases, segmental motion of the polymer chains also increases and it becomes significant above the T g. If the butadiene domains in SBS mix with the PS chains on a molecular level, it would be expected that the addition of elastomeric material into the PS matrix would decrease the T g of PS. However, according to the results given in Table 3, in general, increasing elastomer content resulted in higher T g. This result may be due to branching/cross-linking of elastomer with the matrix PS. Cross-linking and branching of elastomer creates steric hindrance that causes immobility of the polymer chains and increases the T g. According to Table 3, incorporation of 2 wt% organoclay does not significantly affect the melting temperature (T m) of PS. However, the T m values of the neat PS and organoclay-filled PS decrease slightly with increasing elastomer content. The highest crystallization temperature (T c) is observed for PS, and the addition of organoclay slightly decreases the T c. However, the T c values of the neat PS and organoclay-filled PS decrease significantly with increasing elastomer content due to the high mobility of the elastomeric chains in the melt state. In the case of enthalpy of melting (ΔH m), addition of organoclay to PS matrix gives lower enthalpy values. ΔH m of PS also exhibits a decreasing trend by the addition of the elastomers.
DSC test results.
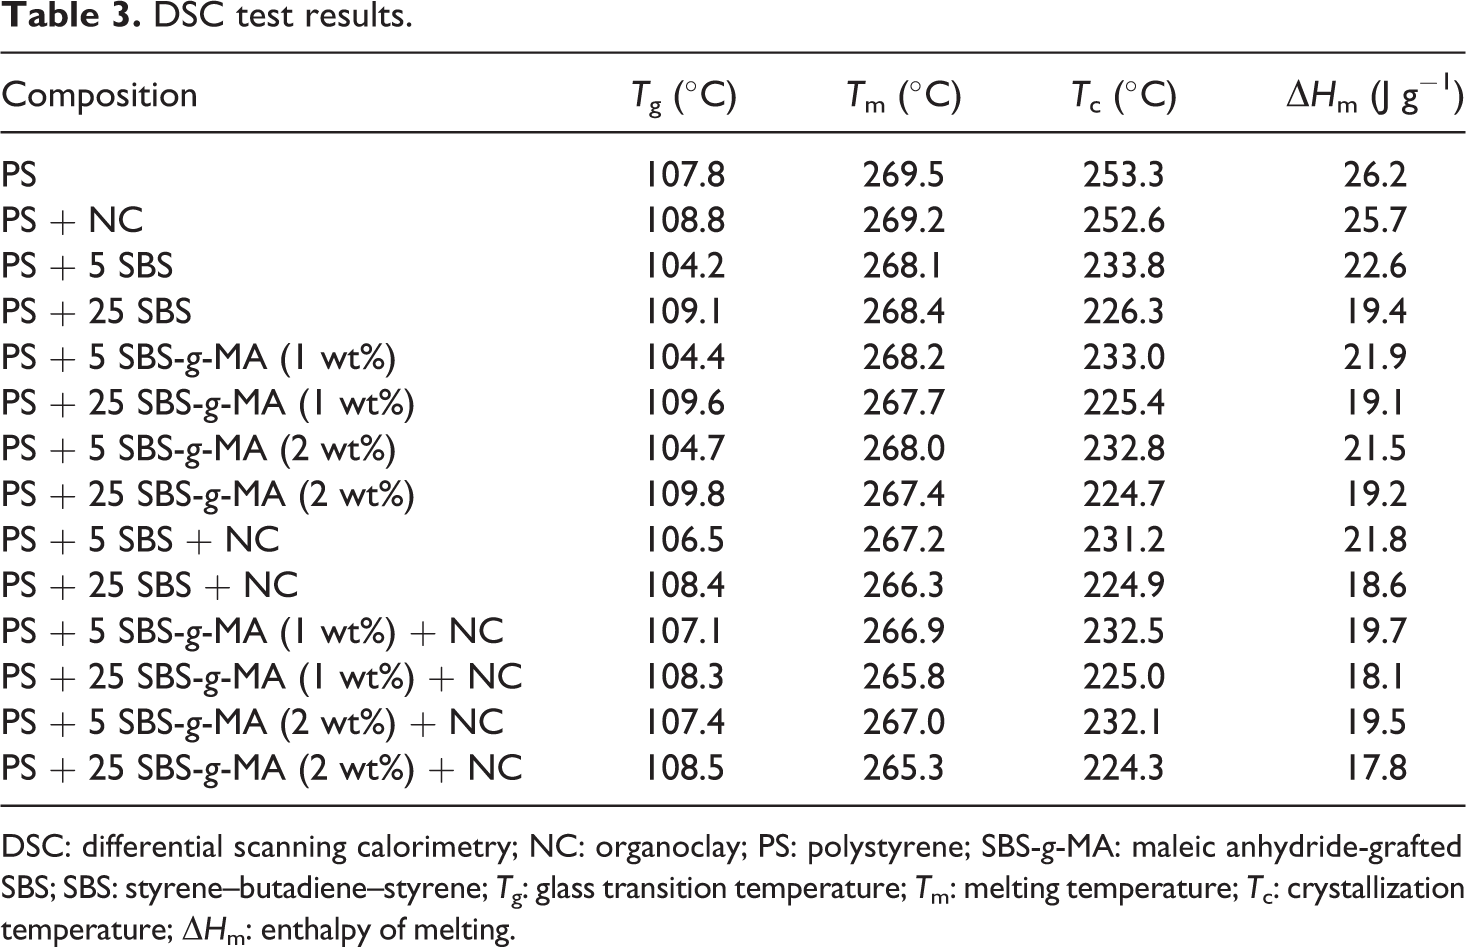
DSC: differential scanning calorimetry; NC: organoclay; PS: polystyrene; SBS-g-MA: maleic anhydride-grafted SBS; SBS: styrene–butadiene–styrene; T g: glass transition temperature; T m: melting temperature; T c: crystallization temperature; ΔH m: enthalpy of melting.
Conclusion
In this study, an aromatic thermoplastic elastomer, SBS, was used as the rubber phase for its blends of PS. MA was also grafted onto SBS at 1 and 2 wt% ratios, and these SBS-g-MA elastomers, as well as SBS, were used as compatibilizers in organoclay-added PS. Compounding of the PS, elastomeric compatibilizers, and 2 wt% organoclay was done by a corotating twin-screw extruder. XRD patterns indicated that the peaks of the organoclay were broader when SBS-g-MA was used instead of SBS which means the interlayer spacings of the organoclay became larger when SBS-g-MA was used. Thus, it can be said that SBS-g-MA acted as a better compatibilizer for PS/NC composites than SBS did. As observed from SEM analysis, increasing the elastomer content increased the average domain sizes of the binary blends of PS and elastomers, as well as the ternary nanocomposites, due to droplet coalescence at high elastomer content. At the same elastomer content, the elastomer domain sizes were higher in the ternary nanocomposites in comparison to the domain sizes of the binary blends. This was attributed to the presence of the clay particles in the elastomeric phase. Another conclusion which is made from the SEM analysis is on the phase inversion point. It was found that phase inversion occurred between 25 and 40 wt% elastomer content.
PS exhibited a higher viscosity than SBS did. It can be said that the viscosity ratio of PS/SBS blends did not change significantly at high shear rates. Addition of elastomer or organoclay decreased the MFI values. PS/SBS and PS/SBS-g-MA had higher MFI in comparison to MFI of pure PS or pure SBS. This result shows that PS is partially miscible with both SBS and SBS-g-MA phases. Organoclay addition makes the polymer matrix stiffer due to the high aspect ratio and high rigidity of the silicate layers. However, due to poor dispersion of the silicate layers in the PS matrix, the addition of organoclay into PS resulted in slight increase in stiffness, and the tensile strength of PS/NC was the same as that of pure PS. However, as the elastomers were added to PS/NC to produce ternary nanocomposites, it was observed that the tensile strength and modulus of the nanocomposites increased. This result can be attributed to the better dispersion of the clay particles in the presence of the elastomeric phase, as supported with the XRD results. Among all the nanocomposites, the highest improvement in the tensile strength value was obtained for the nanocomposites containing NC and 5 wt% SBS. The improvement in tensile strength, modulus, and strain at break were about 32%, 46%, and 270% highest respectively, with respect to pure PS. DSC analysis showed that addition of the elastomers increased T g of the samples due to interaction of the elastomer with the PS matrix.