
Abstract
Usage of discontinuous glass fibers in injection- and compression-molded resin components is rapidly increasing to improve their mechanical properties. Since added fiber contributes to more strength along the fiber direction compared with transverse direction, the mechanical properties of such components strongly depend on the fiber orientation. Therefore, it is important to estimate the fiber orientation distribution in such materials. In this article, we are presenting a recently developed method to estimate fiber orientation using micro computerized tomography (CT) scan-generated three-dimensional (3-D) image of fibers. However, the large size of the CT scan-generated 3-D image often makes it difficult to separate each fiber and extract end point information. In this article, a novel method to address this challenge is presented. The micro-CT images were broken into finite volume, reducing data size, and then each fiber was reduced to its own centerline, using Mimics® Innovation Suite (Materialise NV), further reducing the data size. These 3-D centerlines were then used to quantify the second-order orientation tensor. The results from the proposed method are compared with the measurements using well-established industry standard approach called the method of ellipses for validation. The key challenges in estimating the fiber orientation are identified and future improvements are proposed.
Introduction
Due to stricter Corporate Average Fuel Economy requirements, there has been great interest in reducing vehicle weight in recent years. One approach to reduce the vehicle weight involves using lightweight, but higher strength materials, such as fiber-reinforced polymers. There are many variations of fiber-reinforced polymers available. 1 Depending on the type of fiber, type of polymer, and condition of the fibers, the fiber-reinforced polymer can show significantly higher mechanical properties, as compared to steel. In the automotive industry, because large volume and low cost are key considerations, there is strong interest in injection- and compression-molded, chopped fiber thermoplastic materials. Depending on the shape of the fibers, they are considered either short fiber thermoplastic (SFT) or long fiber thermoplastic (LFT). In general, we consider SFT to be straight, while LFT can be curved, due to higher aspect ratio. 2,3
The mechanical properties of chopped fiber thermoplastic material greatly depend on the following: (1) mechanical properties of the fibers; (2) mechanical properties of the thermoplastic resin material; (3) condition of the chopped fibers in the composite material; and (4) fiber–resin interface condition. 4 –6 Assuming that the fibers are well dispersed, the main criteria for fiber condition are fiber length, fiber orientation, and volume fraction of the fiber in the polymer.
The fiber volume fraction can be easily measured, and for uniformly dispersed fibers, the effect of these fibers on the mechanical properties can be easily estimated using well-known proportionality laws. 7 The measurement of adhesion between the fiber and thermoplastic material can be quite laborious. A survey of such methods is presented by Sockalingam and Nilakantan. 8
The effect of fiber length on mechanical properties of the fiber-reinforced thermoplastic materials was investigated by Thomason and Vlug 9 in 1990s. They showed that increasing fiber length results in improvement of the mechanical properties until a certain “optimum” fiber length, after which point the improvement flattens. Typically, for glass fibers, a fiber length of 10–20 mm is considered optimal. Since the improvement in the mechanical properties of the composite material is along the fiber, it is very important to measure the orientation of fibers in the finished parts.
The fiber orientation in the injection- and compression-molded chopped fiber resin material depends of the melt flow and the velocity gradient of the flow. It has been shown by numerous researchers, for example, Osswald, 10 that when highly viscous thermoplastic material melt flows through thin walls, fountain flow is induced due to cooling on the surface. This typically results in five layers, that is, skin (top/bottom), shell (upper/lower mid), and core (mid), with each layer having a different orientation of fibers. Therefore, the material properties in each layer will differ depending on the fiber orientations. Thus, the chopped fibers, depending on their orientation, add directionality to the material properties.
In order to design and optimize the lightweight components using chopped fiber-reinforced thermoplastic materials, it is imperative to use the material properties such as strength, stiffness, and coefficient of thermal expansion, which are based on fiber length and fiber orientation in the part. These material properties can be estimated using homogenization methods, for example, extended Mori Tanaka, described by Brassart et al. 11 However, the homogenization method requires knowledge of fiber length distribution and fiber orientation tensors along with fiber and resin material properties.
This brings the next challenge. How to measure the orientation for the fibers that are embedded in the resin? The challenge of measuring fiber orientation was first addressed by Hine et al. 12 They developed a method to estimate fiber orientation from the study of cross section of fiber-reinforced material. The sample is cut and ground into a finely polished surface and then observed under optical microscope to gather images of fiber tips on the surface. The fiber tips are observed as different sizes of ellipses. Image processing methods are used to estimate the minor and major axis of this ellipse to estimate the orientation of the fibers, assuming that the fibers are perfect circle to start with. An automated system to scan the cross-section and process images to estimate fiber orientation tensor over the section was developed in the 1990s at The University of Leeds. One such system, called Leeds system, is in operation at Oak Ridge National Laboratory.
Other methods that can help in getting three-dimensional (3-D) image from section such as confocal microscopy are possible but they require a sample preparation for each layer which is quite expensive. 13 Confocal laser scanning microscopy, which allows controlled focusing and image gathering at the desired depths point by point using a laser, 14 may be used to get images through thickness. Unfortunately, they do need the use of florescence or transparent matrix materials, which is not always practical with glass fibers.
With improvements in the computer and scanning capabilities, there is a strong interest in using the computer tomography to get a 3-D image of the fiber-reinforced polymer and process these images to find the ends of fibers to measure the orientations. In the past, such attempts have been made; however, there are two major challenges that need to be overcome. First, the resolution of the scanning process needs to be such that the fibers can be identified clearly. For example, a resolution of about 4 μm or lower is necessary to make sure that single fiber with diameter of about 15 μm is observed in the image. Second, the extraction of fiber ends to measure the fiber orientation from the data. This has been proven to be a major road block, as typical computerized tomography (CT) scan data is quite large. For example, small 10 × 5 × 4 mm3 sample at 3-μm resolution may result in scanned image of 6–7 GB. Most algorithms to separate fiber and their end points from such a large data have been unsuccessful.
In this article, the challenge of dealing with the large size of data from CT scan is addressed in two ways. First, the large volume of CT scan data is broken into smaller volumes, that is, typical volume we analyze will be around 500 × 500 × 300 μm3. The fiber orientation calculations are carried out independently in such small volumes on smaller size data. Second, the size of the data in the selected volume is reduced by reducing the fiber geometry from surface of the fiber to only the centerline. Since the diameter of the fiber is known, there is no effective loss of information for calculation purposes. These two are the key enablers that help in successfully extracting the fiber end points from large-size CT scan data. Finally, the orientation angle of each fiber is calculated using basic geometric equations. Once the orientations of the fibers are known, the orientation tensors in the selected volume can be calculated using the approach described by Advani 15 and Bay. 16 –18 This approach helps in expressing fiber orientation in a given volume numerically, which opens the opportunity to account for the effect of fiber orientation in the material properties for calculations.
Just for completion, we would like to mention some practical aspects of the fiber orientation measurements. Ideally, we would like to measure fiber orientation at all the locations in a part. However, the actual measurements are possible at only few locations due to the large numbers of fibers in a part. For example, in a 1-mm3 30% glass-fiber-reinforced resin material, assuming fibers have 15-μm diameter and 500-μm average length, there could be more than 2000 glass fibers, making measurement of all the fibers in a part impractical. Therefore, in practice, the fiber orientations are obtained from the simulation of injection or compression molding process using commercial software. The measurement of fiber orientation at few selected locations in the part is used to verify the validity of the process simulations results.
In the next sections, a new CT-scan-based method to measure the fiber orientation is introduced, and the results are compared with the current optical microscope image analysis-based approach called “method of ellipse.”
Materials and methods
Conceptually, the orientation of a straight fiber can be described as a pair of angle (θ, φ) the fiber makes with two axes as shown in Figure 1.
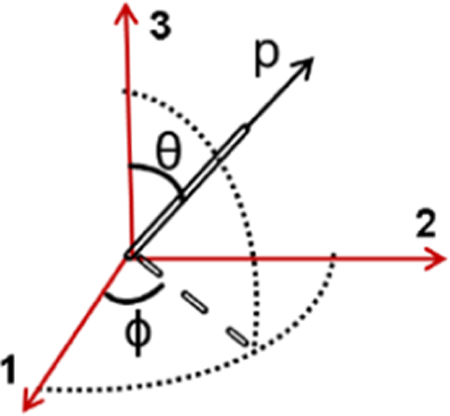
Vector definition of a single straight fiber.
These angles can be used to form a unit vector for a single straight fiber:

Accounting for all the fibers in a realistic part is impractical; therefore, a description of fiber orientation distribution is used in practice. Early efforts 19,20 to use the probability distribution function to express fiber orientation in a given volume were not successful, as probability distribution function is difficult to use numerically. Advani and Tucker 15 –18 developed a novel method to express the fiber orientation in a given volume as tensors. The method to calculate second-order orientation tensors is presented below:
The orientation tensor is defined as:

Where A
ij represents average tensor of the unit vector
Materials
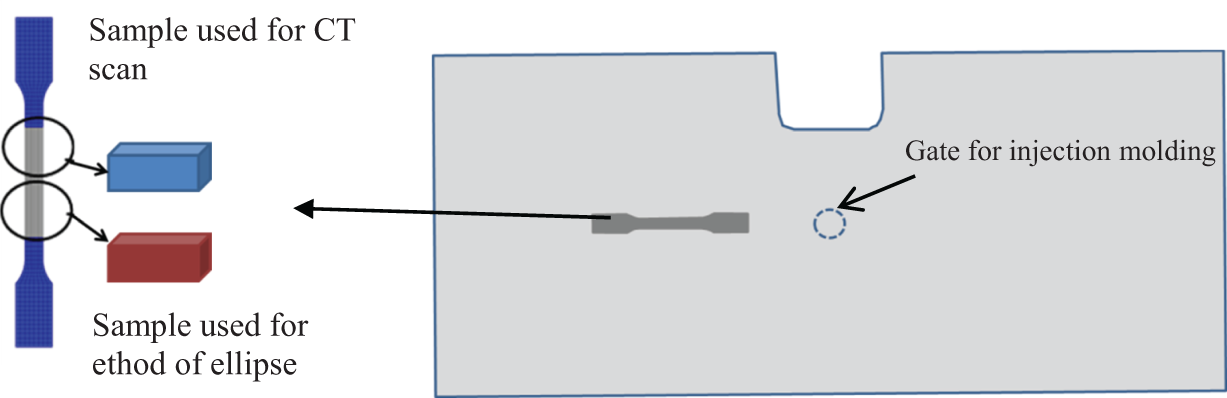
To demonstrate the proposed method, the plaques are prepared using chopped glass fiber in polypropylene material using injection as well as compression molding process. Samples at the location indicated in the Figure 2 were selected and fiber orientation is measured using the method of ellipse at Oak Ridge National Laboratory. The method of ellipses is an established method 13 –15,17 for the measurement of injection-molded short glass fibers. Therefore, it is used as reference to compare the proposed micro-CT scan method.
Plaque used for the study was 1000 × 400 × 4 mm3 thick with 30% glass fiber in polypropylene.
Methods
Method of ellipse
This technique has been extensively studied and applied for short fiber-reinforced thermoplastics. Key steps are presented in Figure 3. Bay and Tucker 15 –18 provided a detailed mathematical background with examples. Automation of this method is described by Hine et al. 12 The detail of the physical sample preparation is presented in Figure 4. Essentially, any metallographic technique is acceptable as long as fiber fracturing and fiber pullout is minimized, providing a smooth surface for etching. Eberle et al. 19 provided a detailed guide for sample preparation using thermoplastic binder. This procedure results in a sample with a flat surface and minimal contrast between fiber and matrix. To increase the contrast to allow for automated fiber orientation measurement, the sample is etched to generate a rougher and less reflective matrix. Oxygen plasma etching was used to retain good control over the process. Automated microscopy is used to collect image for a large cross section as shown in Figure 4. The fiber orientation is estimated from digital image processing.
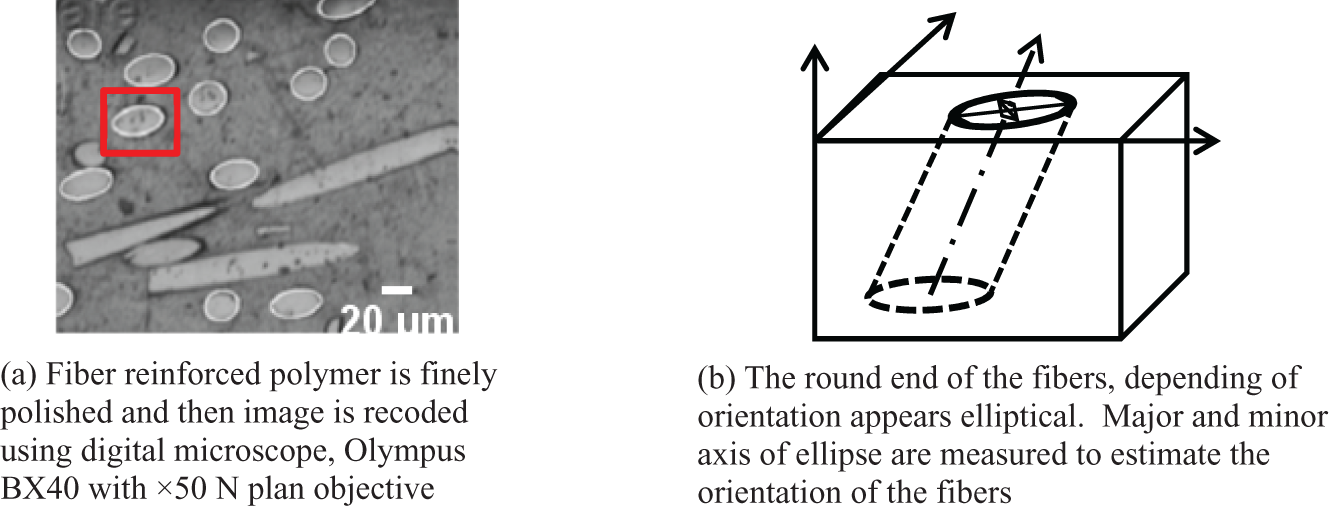
Key steps in method of ellipse.
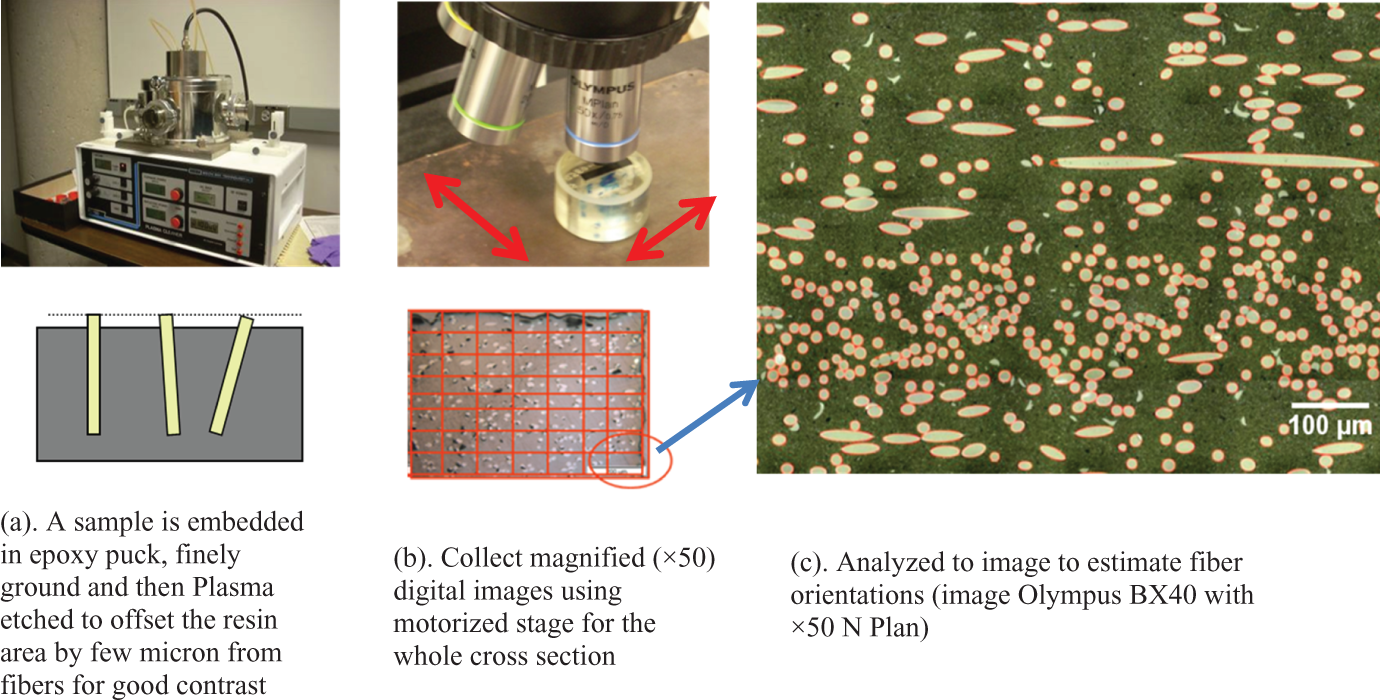
Details of the sample preparation and data collection for the method of ellipse.
Second-order orientation tensor defined in equation (2) is approximated by summation over a finite set of discrete fibers as follows:
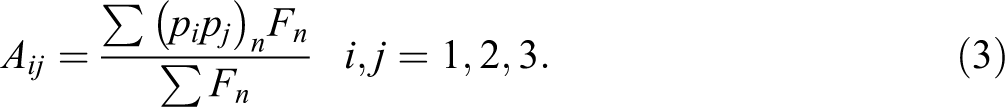
Where the weighting function Fn is used to correct a bias caused by higher probability of finding fibers with nearly circular cross section compared with the probability of finding a fiber with elongated ellipse cross section. We have followed Bay 18 and used:

It should be noted that this technique has been perfected and validated for injection-molded short and long fiber materials.
CT scan method
In this method, a glass fiber polymer sample is cut from the part of interest and used to collect micro-CT image at 3-μm resolution. Since the glass fibers are 14–17 μm in diameter, the resolution of 3 μm is considered sufficient to capture single fiber in the image accurately. The micro-CT images are processed using Mimics® Innovation Suite (Materialise NV, Belgium) to obtain the fiber centerlines. 21
The key challenge, acknowledged by other research, 13 is how to extract the end points of fibers to estimate the fiber orientations from such a large size data. Since quantifying the centerlines on the entire dataset would be computationally very expensive, a number of regions of interest are selected along the thickness and width of the sample (Figure 5(b)). Next, the selected regions are imported in Mimics where the fibers are segmented using a gray value threshold resulting in a mask containing the voxels that represent the fibers. From this mask, a triangulated surface model of fibers is calculated (Figure 5(c)). Next, the “Fit Centerline” function in Mimics is used to determine the centerline of each fiber in the regions of interest (Figure 5(d)). Finally, the centerlines from the Mimics are exported and separated into non-connected segments. The orientation and length of each fiber segment are calculated from these measurements. Using the formulas in equations (5) and (6), the fiber orientation tensor for the selected region (volume) is estimated. A special program to extract the end points and calculate the fiber orientation and length was written in Matlab (The Mathworks, Natick, Massachusetts, USA; Figure 5(e)).
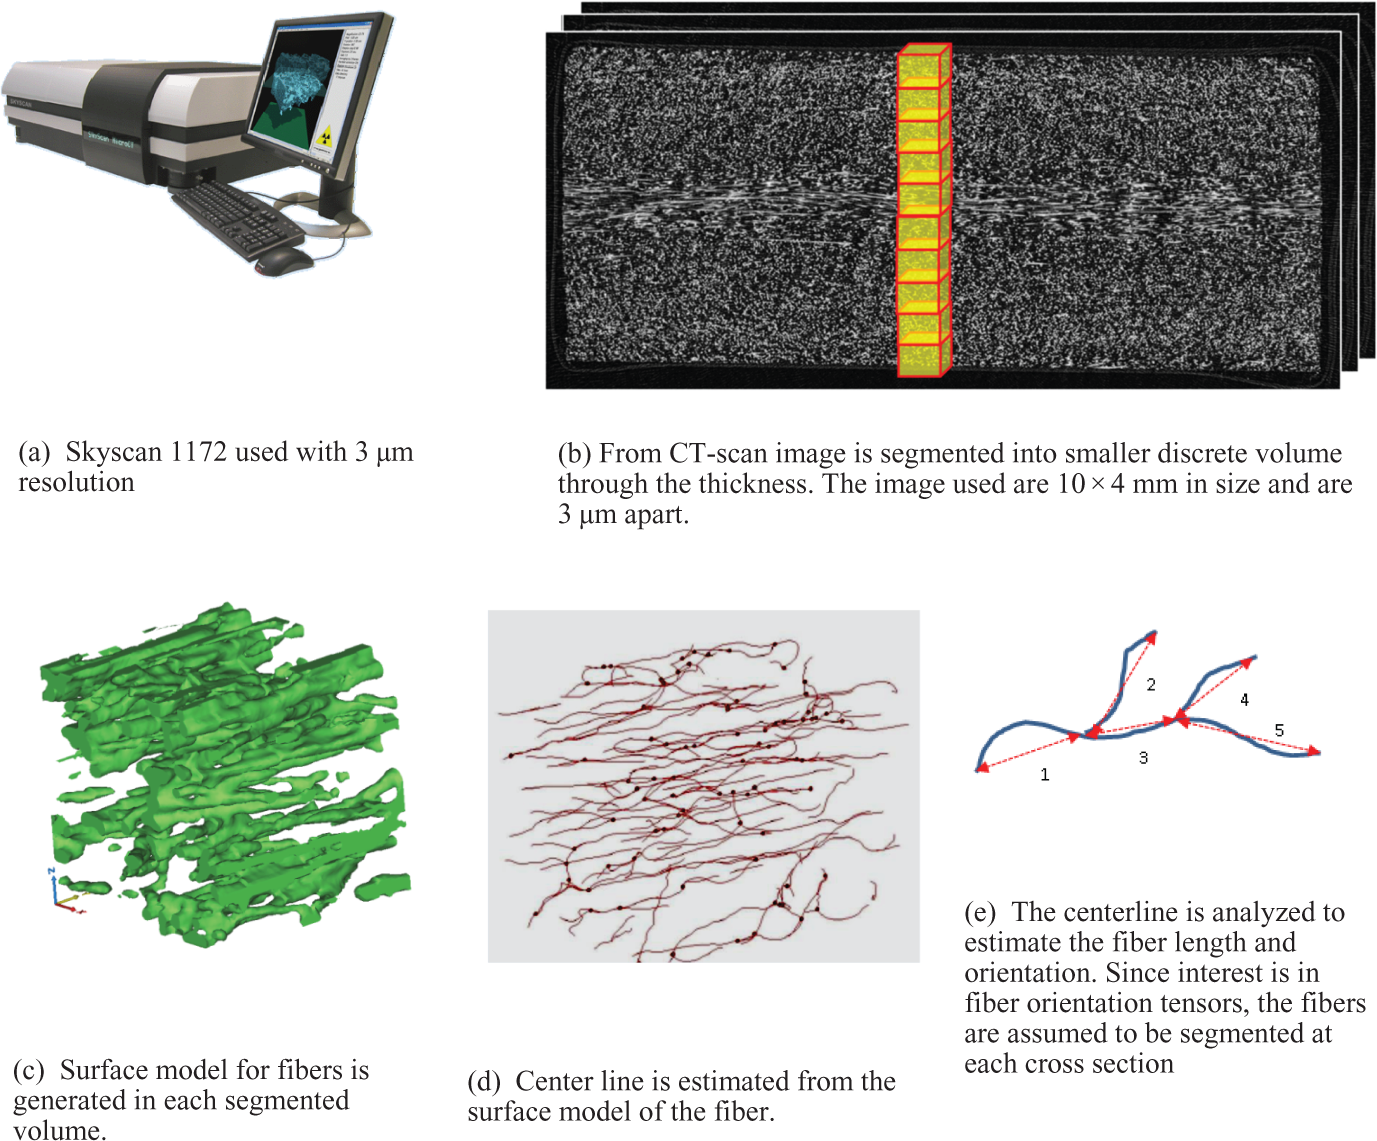
CT scan method to measure the fiber orientations. CT: computerized tomography.
Once the orientation of each fiber is available, the components of an orientation tensor “A”, which are approximation of orientation probability distribution, can be calculated, according to Bay and Tucker 15 –18 , using second-order tensor given in equation (2):
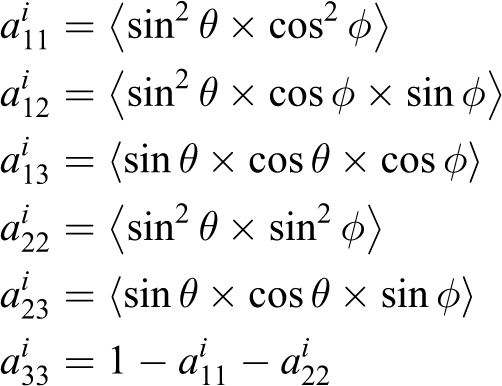
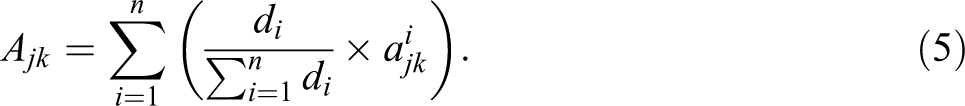
Where d i is the length of the ith fiber and i = 1 to n, where n is the number of fibers in the volume. j,k = 1, 2, 3.
Orientation tensor (symmetric):
While using the CT scan image and reconstructing the 3-D glass fiber geometry, depending of the process and gray value threshold selected, there is a possibility of 1–2 pixel error due to noise. Since we know that the glass fibers are 14–17 μm in diameter, we used this knowledge as a priori information to reduce the estimation error while estimating the centerline. We observe that for a fiber length of 200 μm, one pixel offset, which is 3 μm, will cause an error of 0.6° in the measured angle. Typically, most fibers in a given volume are longer than 200 μm, which means lower error. Therefore, we considered this acceptable. Also for each volume, the tensor calculations are based on large number of fibers, so effect of such error on the orientation tensor tends to be smaller.
Results and discussion
Two types of plaques are investigated, injection molded and compression molded. An ISO tensile specimen is cut using water jet process. 22 Two adjacent samples of size 10 × 5 × 4 mm3, as shown in Figure 2, are selected from tensile specimen to compare the two fiber orientation measurement methods. For convenience, only A 11 components of the orientation tensor are presented in the Figures 6 and 7. Since orientation of most of the fibers is in plane, A 33 is quite small and A 11 + A 22 + A 33 = 1 is already known, and A 11 alone is considered good indicator of the fiber orientations. A higher value of A 11 means higher alignment of fibers along A 11 at that depth.
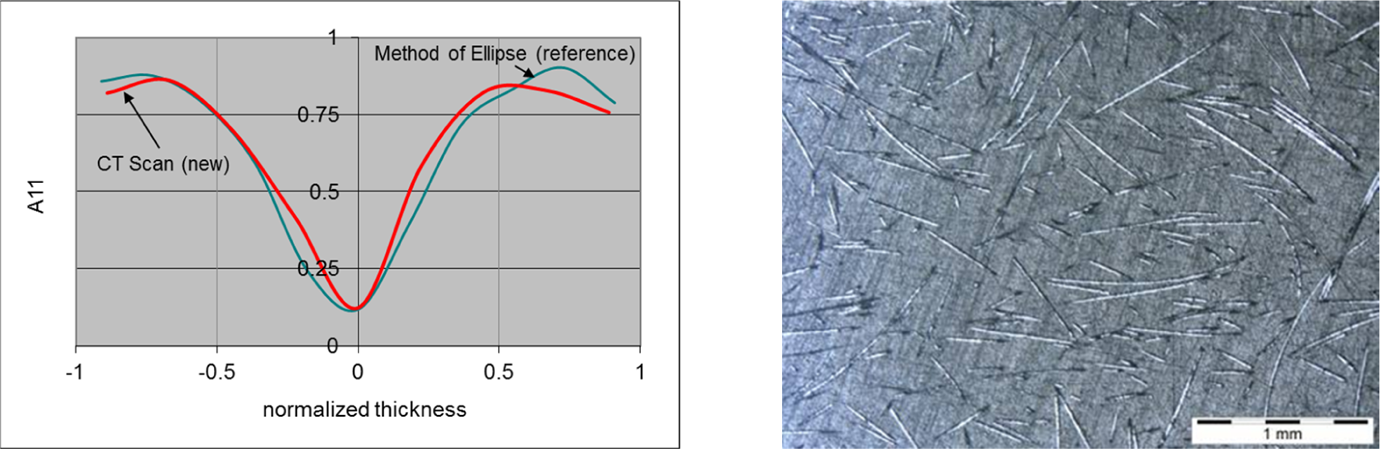
Comparison of fiber orientation from CT scan and method of ellipse for injection-molded specimen. The fibers for injection-molded specimen are short and straight (Image Olympus BX40; ×30). CT: computerized tomography.
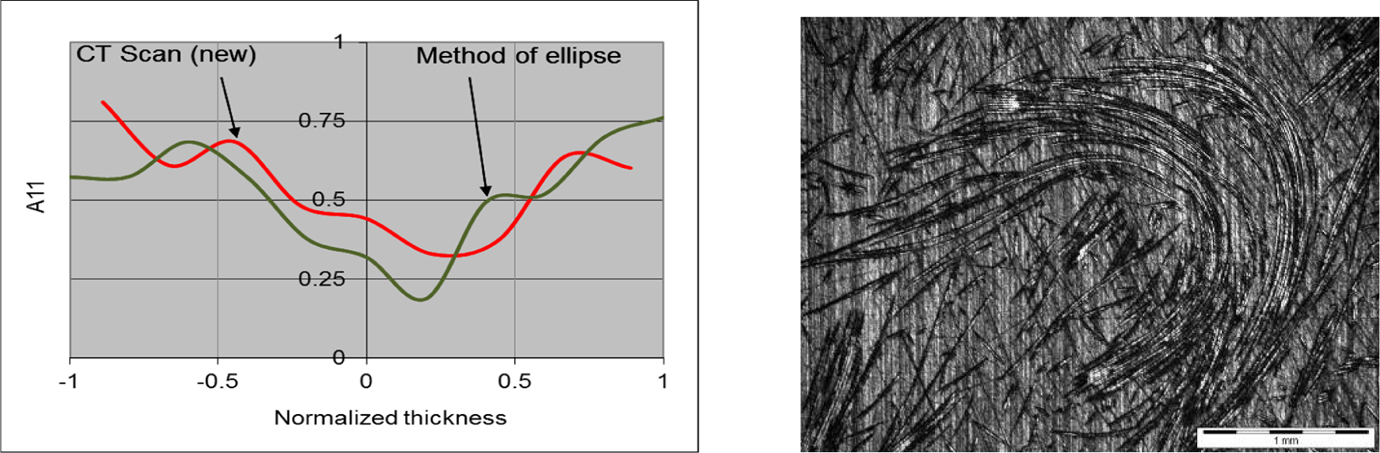
Comparison of fiber orientation from CT scan and method of ellipse for compression-molded specimen. The fibers for compression-molded specimen are long and curved (Image Olympus BX40; ×30). CT: computerized tomography.
For the sample from injection-molded plaque, as shown in Figure 6, it is observed that A 11 measured using two different methods, that is, the method of ellipse and the proposed CT scan method, match quite well. Both the studies were carried out independent of each other on two adjacent samples from the same specimen. The method of ellipse was used at Oak Ridge National Laboratory using the Leeds equipment. The CT scan analysis was conducted by Materialise.
For the sample from compression-molded plaque (see Figure 7), we observe that the A 11 component of tensor is close and shows similar trend but does not match well with measurements from the injection-molded sample.
The main reason for the difference is condition of the fibers. The fibers in the injection-molded part are short and straight. For the straight fibers, the method of ellipse and CT scan approach are dealing with the same geometry, and therefore both match well (Figure 8(a)). However, the compression-molded plaque fibers are longer and curved, which means the orientation measurement based on both elliptical cross section and two end points is different, as shown in Figure 8(b). In general, we have observed that the fibers tend to start curving with higher aspect ratios.
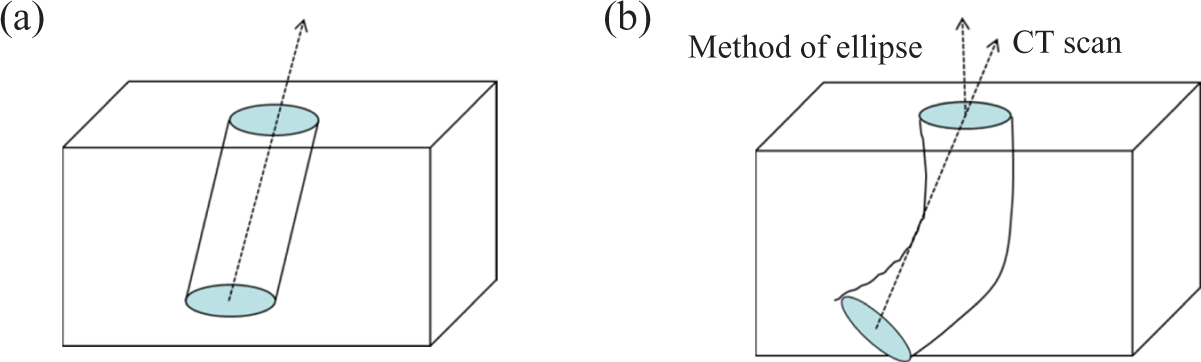
(a) Fiber orientations straight fiber method of ellipse and CT scan are same. (b) Fiber orientations curved fiber method of ellipse and CT scan are different.
For curved fibers, the question of orientation is complex because the orientation (tangent) changes at each point along the length. The orientation angle, for method of ellipse, will depend on the location of the measurement. For the CT scan approach, the orientation will depend on the location and size of small volume selected for the calculations. For the curved fibers, one approach can be to discretize the fibers into small straight segments as shown in the Figure 9 and then use CT scan on each of the small volume. Since our interest in measuring the fiber orientation is to estimate the material properties, the idea of breaking the CT scan image into smaller segments and then using the orientation in each segment to estimate material properties can be very practical in addressing the curved fibers.
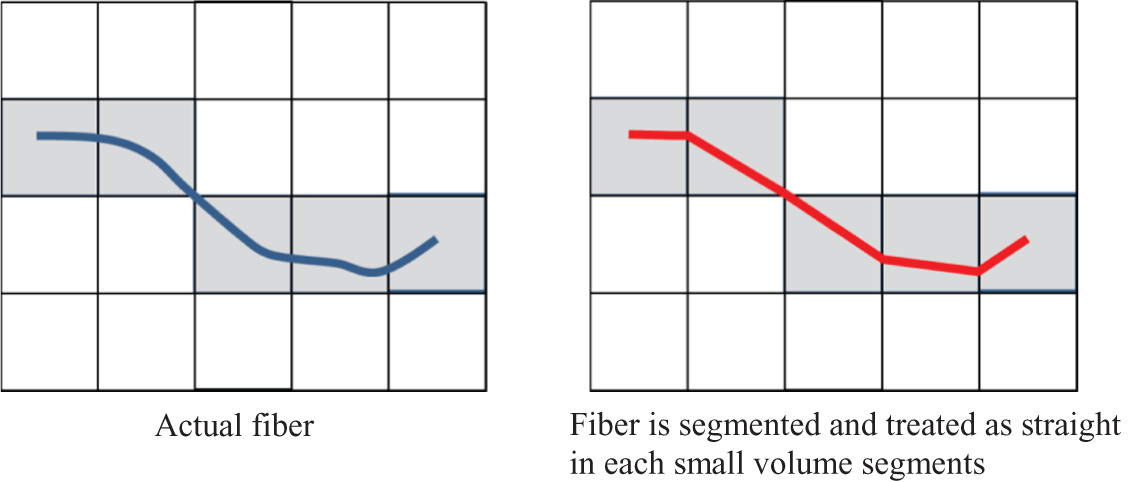
Long curved fibers can be considered as piecewise linear. In this case, the fiber will be part of all the shaded volume segments (five) and contribute toward orientation tensor in each of the five volume segments.
Sensitivity study of the measurements
Since the CT scanned volume is broken into smaller volume segments and only selected segments are analyzed, it is important to understand the effects of segment size as well as segment locations. In the following paragraphs, effect of changing size of volume segment and location is investigated.
Effect of segment size to the final fiber orientation
Three different cubic sizes are chosen, all of them with same depth and height, that is, 300 and 200 μm, respectively, but with different width, that is, 400, 800, and 1200 μm. The fiber orientation results with different segment sizes are shown below in Figure 10. We observe that the effect of different widths does not change the measured values of orientation tensors. Also the goal of the choosing window is not to cover complete fiber. As any two points on the straight fiber will result in the same orientation information.
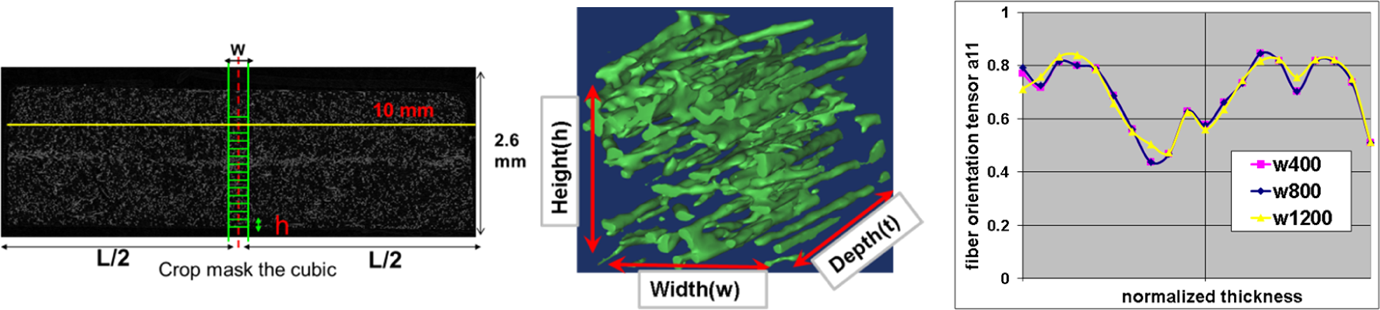
Effect of segment size to the fiber orientation.
Effect of segment location to the final fiber orientation
The location of the segment is also investigated in this study. In Mimics, the segment location usually is picked up by default in the center of the image. In this study, the segment size is same except that the location of the measurement in the cross section varies from the left side to the center of the image and to the right side of the image. The results in Figure 11 show the effect of location on the final fiber orientation. The width of the cross section is 10 mm and the selected locations are 2.5 mm apart. Since the injection melt flow at different locations is slightly different, the fiber orientation is also slightly different. To get better perspective of what the orientation tensor means, we also calculated the elastic modulus (E), for the section, Location 1: 6573 MPa, Location 2: 6907 MPa, and Location 3: 6789 MPa, which is within 5% and considered within testing variations.
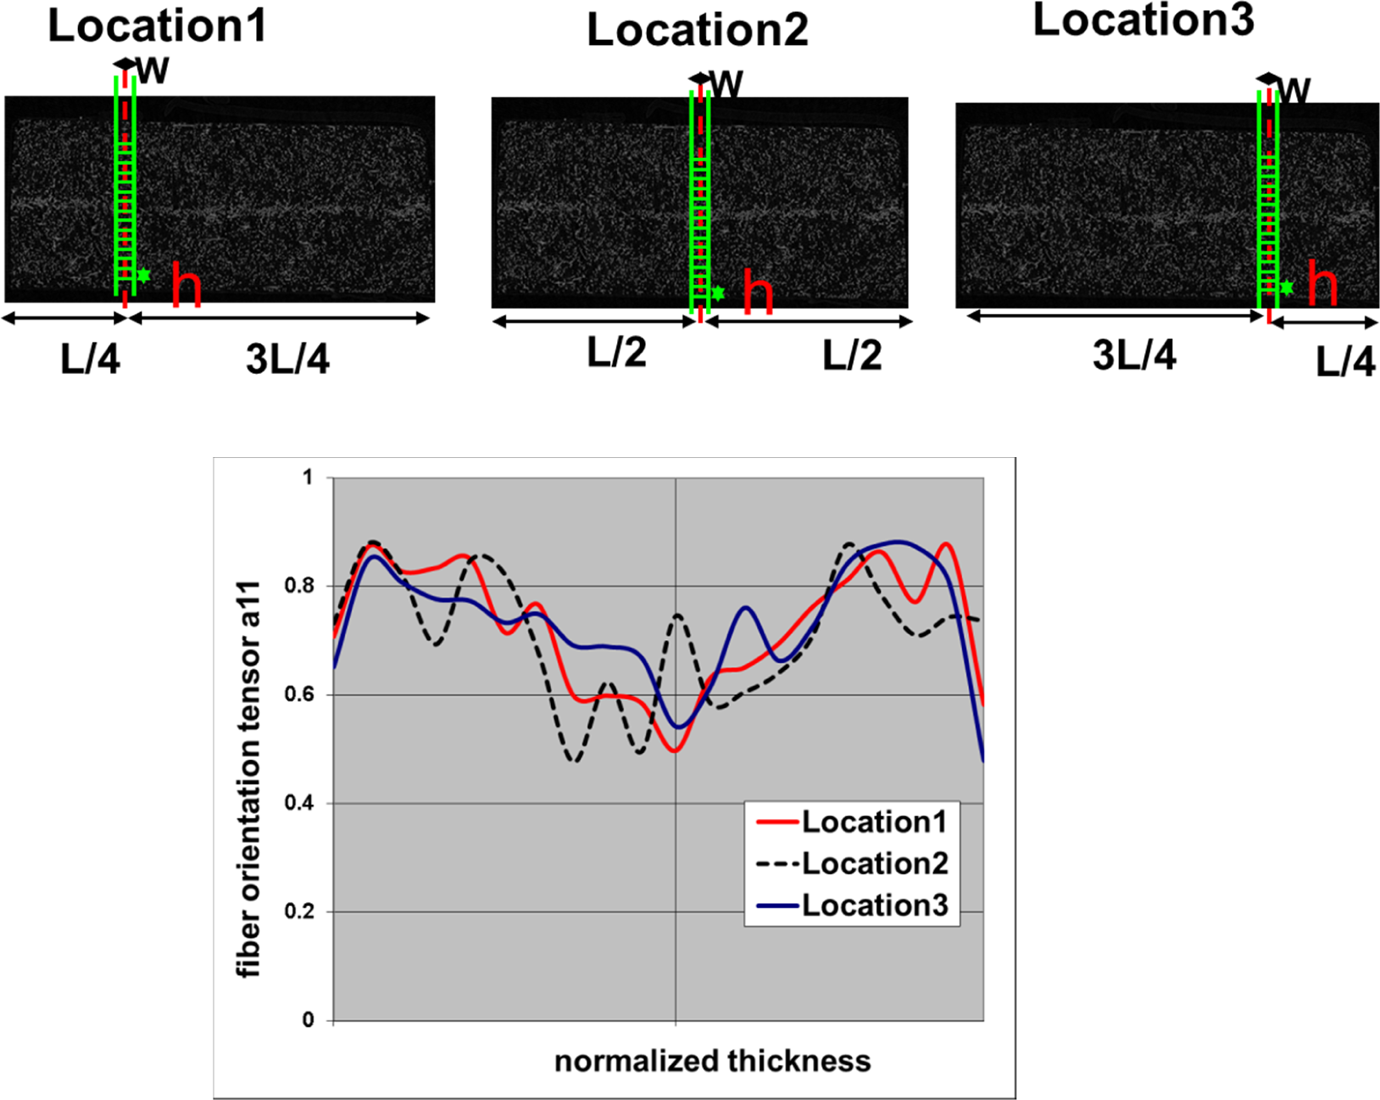
Effect of segment location to the fiber orientation.
Conclusions
A method to measure fiber orientation tensor for a given sample using CT scan images for the fiber-reinforced polymer is demonstrated. The key challenge of handling large data size of CT scan images is addressed by breaking the scanned images into smaller volumes and reducing the geometry details, that is, 3-D surface of fibers into 3-D lines. The results indicate that for straight fibers the fiber orientation from proposed CT scan approach matches well with the conventional method of ellipse. For the curved fibers, however, there is a discrepancy between the methods, likely due to fundamental difference in measurement approach between the two methods. Method of ellipse measures tangent at a point on fiber at selected cross section, whereas CT scan method measures fiber orientation based on two ends. This explains the good correlation for straight fibers but not for the curved fibers.
At this time, both the methods show similarity in terms of cost and time. With advancement in computers and image processing technology, we expect that the methods based on CT reconstruction will become faster and easier. Also, we expect that the CT scan-based method may be used to address the long curved fibers, for example, break the long curve fiber into linear segments and measure the orientation tensor for each segment. Finally, different material property can be used for each segment.
Footnotes
Declaration of Conflicting Interests
The author(s) declared no potential conflicts of interest with respect to the research, authorship, and/or publication of this article.
Funding
The author(s) disclosed receipt of the following financial support for the research, authorship, and/or publication of this article: This research was partially funded by Oak Ridge National Laboratory’s High Temperature Materials Laboratory; User Program was sponsored by the US Department of Energy, Office of Energy Efficiency and Renewable Energy, Vehicle Technologies Program. The fiber-reinforced plaques used in this study were built by Magana Corporation.