
Abstract
Starch platelets of micro particle size in the range of 10–100 µm were extracted from potato by acid hydrolysis. Two types of starch-reinforced composites, one with poly(vinyl alcohol) (PVA) and the other with poly(lactic acid) (PLA), were prepared by solvent casting and hot press molding methods, respectively. Mechanical properties of the starch/PVA and the starch/PLA composites were determined, and the maximum tensile and yield strength obtained were around 19.7 MPa for 6% starch/PVA composite and around 7.2 MPa for 6% starch/PLA composite, correspondingly. The structure of both the composites were characterized by Fourier transform infrared spectroscopy, X-ray diffraction, thermogravimetric analysis (differential thermal analysis/differential thermogravimetric analysis), thermomechanical analysis, and scanning electron microscopy. Finally, antimicrobial test was conducted to assess the potentiality of both the composites to be used for biomedical applications and only starch/PVA composite was observed to inhibit microbial growth against both a gram-positive (Bacillus subtillis) and a gram-negative (Escherichia coli) bacteria.
Introduction
Bioabsorbable polymer composites made of various reinforcements with moderate mechanical properties have been researched for the last few decades for biomedical applications because of their favorable degradation rate, minimum risk of foreign body reactions, and stress shielding to the traditionally used metal fixations. 1
Many types of bioabsorbable composites have been prepared by many researchers using natural polymers as reinforcements such as starch, 2 –4 cellulose, 5 chitin and chitosan, 6 soy protein, 7 wheat protein, 8 egg protein, 9 lignin, 10 and sodium alginate 11 . Among the above-mentioned natural polymers, starch is one of the most promising materials to be used in bioabsorbable composites because of its abundant supply, low cost, good processability, biodegradability, and ease of physical and chemical modifications. 2,12 Starch is thermally processable simply by using water in it as a plasticizer. Being blended with various materials, it changes the performance and properties of the ultimate blend due to its hydrophilicity. 13 Moreover, starch and its derivatives have better reactivity than the other biodegradable natural biopolymers, such as cellulose and chitin. 14,15
A variety of bioabsorbable polymers such as poly(vinyl alcohol) (PVA), poly(lactic acid) (PLA), poly(glycolic acid) (PGA), and poly(caprolactone) (PCL) have excellent characteristics for certain biomedical applications. 16,17 Among them, PVA is a technologically potential polymer due to its water solubility. 18 It has excellent film-forming, emulsifying, adhesive, and mechanical properties. 13 It is odorless and nontoxic as well as it has high oxygen and aroma barrier properties. 19 PVA has been used in several biomedical applications like drug delivery, contact lenses, artificial organs, wound healing, cartilage, and so on. 20 However, it has limited durability and bonding ability to tissues. 21 A biodegradable starch/PVA blend film had successfully been used as a coating onto the soluble granular fertilizer and the structure was confirmed by X-ray diffraction (XRD). 22 PVA/corn starch blend films were prepared and characterized using thermogravimetric analysis (TGA), and it was observed that the thermal decomposition of the composites shifted slightly toward lower temperature compared to that of pure PVA. 18 Films made from a blend of potato starch and PVA along with clay as a filler showed a significant increase in mechanical strength compared with the unfilled one owing to the addition of nanoclay filler into the films. 23 However, Siddaramaiah et al. determined the structure–property relation of corn starch and PVA composites and observed that with the addition of 10% corn starch into PVA matrix increased the tensile strength around 5%, which was probably for the formation of hydrogen bonds between the –OH groups of PVA and starch. 24
PLA is another very promising bioabsorbable polymer material that has sufficient mechanical strength, comparatively lower degradation rate after being implanted into human body, moderate stiffness, and good thermal stability. However, its high cost sometimes limits its applications in general use. High-molecular-weight PLA is a colorless, glossy, stiff thermoplastic polymer. Nowadays, PLA is commonly used in biomedical applications, and it was the first commodity plastic from fully renewable resources. 25 In addition, the processability and mechanical properties of PLA is considered to be broadly similar to those of conventional petroleum-based polymers. 25 PLA and starch are two potential candidates for the preparation of biodegradable polymer blends. 26 –32 PLA and etherified starch (EST) composite was obtained by extrusion and uniaxial orientation processing with a pretreated mixing procedure. 33 The products were examined using Fourier transform infrared (FTIR) spectroscopy technique, which revealed that small amount of PLA molecules have strong interaction with EST due to the esterification between the carboxyl groups of PLA and hydroxyl groups in EST. 33 PLA/starch copolymers were successfully obtained by reactive blending of varying starch compositions from 0% to 60% with PLA; however, microhardness and dynamic mechanical analysis(DMA) showed that PLA/starch blend did not have sufficient interfacial adhesion. 34
A number of studies have already been completed for the preparation of composites either from starch/PVA or starch/PLA blends. However, no study so far has been observed in the literature regarding the use of micro particle size of potato starch in PVA and PLA polymer matrices. This research completely investigated the mechanical, thermal, physicochemical, morphological, and antimicrobial properties of starch/PVA and starch/PLA composites. Furthermore, this work also made a comparison study between the two composites and recommended the possible use of them in biomedical applications.
Experimental
Materials
Potato (Solanum tuberosum) was collected from local market. PVA (pellets, Sigma Aldrich, St Louis, Missouri, USA) and PLA (3251D, NatureWorks, Blair, Nebraska, USA), sodium hydroxide (NaOH; pellets), and sulfuric acid (H2SO4; 95-97%; E. Merck, Germany) were used without further treatment.
Extraction of starch from potato
The potatoes, after removing adhering dirt and soil by washing, were peeled off and washed with distilled water. Then, 25 g of peeled potatoes were cut into small pieces and subjected to blending in water for 10 min. The blend was then acid hydrolyzed using 6 M H2SO4 at 45–60°C for 4–5 h on the basis of 10 mL solution per 1 g of sample. After the hydrolysis, this blend was neutralized by 2% NaOH and then distributed in the vials and centrifuged (High-Speed Refrigerated Centrifuge (H-9R), Kokusan Corporation, Japan; 20,000 r min−1 (max)) repetitively for 3 times at 10,000 r min−1 for 45 min at each time. After every centrifugation, the wash water was decanted. Lastly, starch platelets obtained from the vial were dried in a freeze dryer.
Preparation of starch/PVA composites
Starch solutions of different concentrations (3–15%) were prepared in dimethyl formamide (DMF) as shown in Table 1. The PVA solution was prepared by adding PVA in 10 mL of water by heating at 45–50°C for about 1 h. The starch solution was then mixed with PVA solution and heated for 1 h at 45–50°C to obtain a thick bioblend solution. The solution was then cast into petri dishes, followed by drying in a vent oven at 50°C for 3 days. The composites thus prepared (compositions shown in Table 1) were kept in conditioning desiccators of 43% relative humidity for 1 week at room temperature to ensure equilibrium moisture content in them prior to various characterizations.
The starch/PVA composites of different compositions.
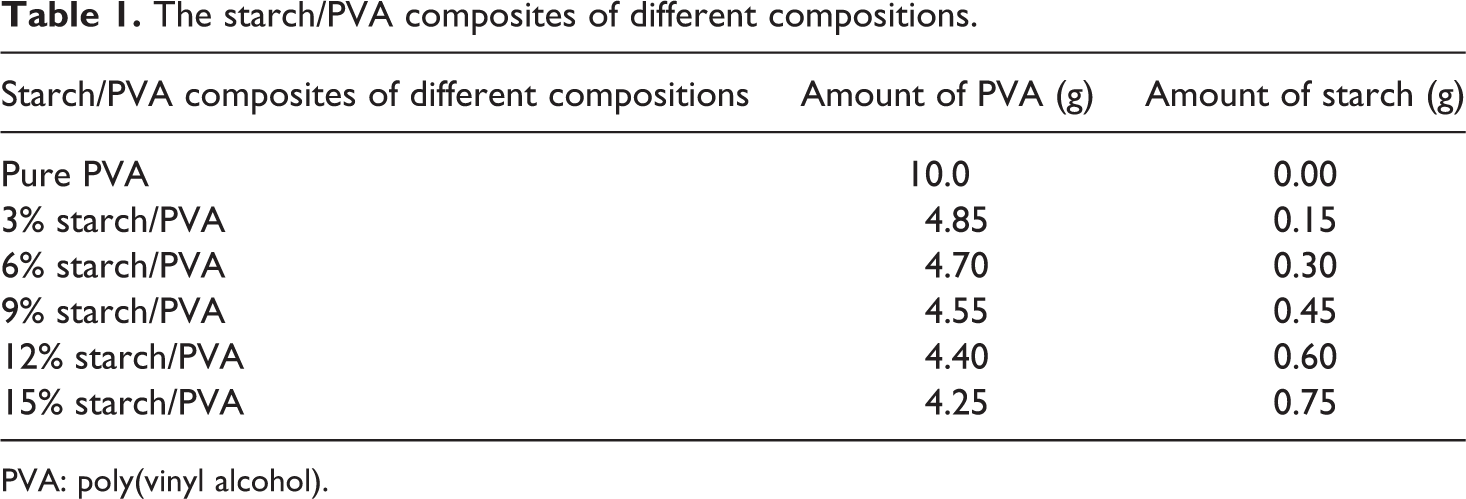
PVA: poly(vinyl alcohol).
Preparation of starch/PLA composites
The PLA pellets were kept in a vacuum oven for at least 24 h at 45°C to remove absorbed moisture. The moisture-free PLA were then fed into the extruder (Dynisco, Japan, orifice 1/8 inch LME stand header, 20 r min−1) through a feed hopper along with starch at different ratios to prepare composites of different compositions as shown in Table 2. Temperature and screw speed of the extruder were 170°C and 20 r min−1, respectively. The extruded strands of the composites collected from the orifice of the extruder were cooled and then chopped into small pieces (about 10 mm). The chopped strands were then placed into a round-shaped stainless steel mold (height 2 cm and diameter 8 mm) and heated up to 165°C under pressure of 20 psi for 1–2 min and finally allowed to cool at room temperature.
The starch/PLA composites of different compositions.
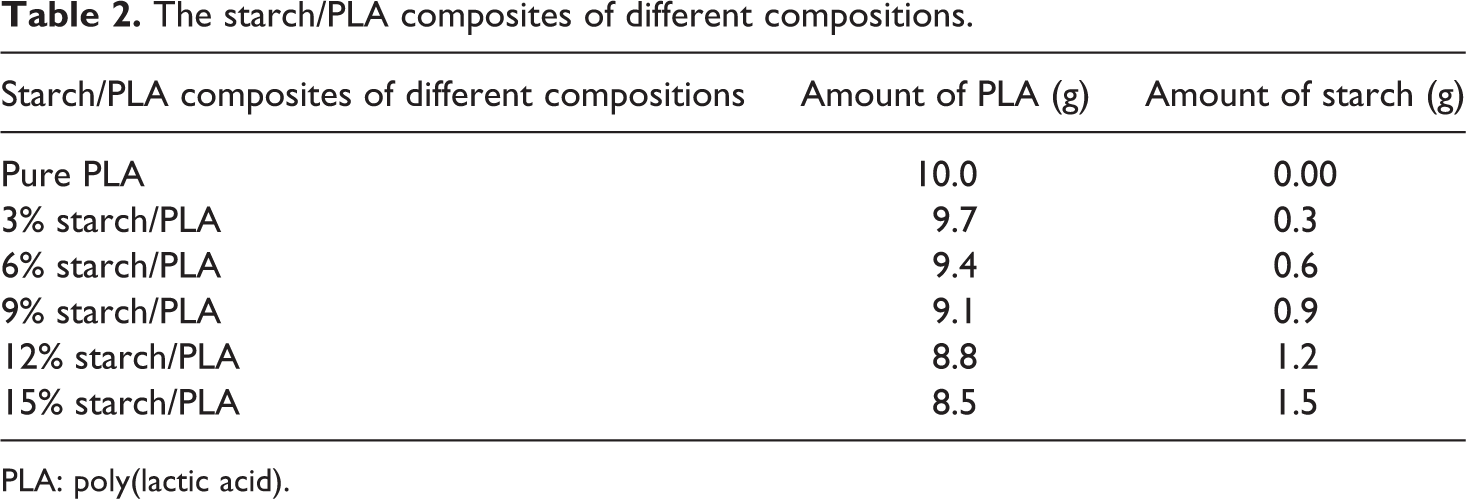
PLA: poly(lactic acid).
Tensile properties
Tensile strength (TS), percentage of elongation at break (Eb), and tensile modulus (TM) of the starch/PVA composites were measured with a universal testing machine(UTM) (Hounsfield, model H50 Ks 0404, UK) according to ASTM method D-3039 having efficiency within ±1% using Instron series IX software (Norwood, Massachusetts, USA). The composites were cut into a rectangular size of dimension (10 × 1 cm2). For testing, the machine speed was 100 mm min−1 with gauze length and load of 8 cm and 500 N, respectively. Minimum eight replicates were tested to take an average of any data. The starch/PLA composites were obtained brittle in nature so that the composites could not be measured by UTM. This is why, a Vicker’s indenter (Vickers hardness tester, Akashi Corporation, Japan, model HMV-2) was employed to measure microhardness of these composites according to ASTM E-384 method, which gives an allowable range of loads for testing with a diamond indenter. The resulting indentation was measured and converted to a hardness value (VH%) and yield strength (MPa).
XRD analysis
A D8 Advance X-ray diffractometer (model JDX-8P, JEOL Ltd, Tokyo, Japan) employing copper Kα radiation of wavelength, λ = 1.54 and a graphite monochromator with a current of 30 mA and a voltage of 40 kV was used to evaluate the specimen. The samples (starch, pure PVA, pure PLA, 6% starch/PVA composite, and 6% starch/PLA composite) were measured in a 2θ range between 5° and 30°.
FTIR spectroscopy
The dried samples(starch, pure PVA, pure PLA, 6% starch/PVA composite, and 6% starch/PLA composite) were analyzed by attenuated total reflectance-FTIR spectrophotometer(model no. 01831, Shimadzu Corp., Japan). Every sample was first embedded in potassium bromide pellets and then analyzed. The spectra were recorded in the absorption band mode in the range of 4000–400 cm−1.
TG/DTA/DTG analyses
TGA/differential thermal analysis (DTA)/differential thermogravimetric analysis (DTG) of starch, pure PVA, pure PLA, 6% starch/PVA composite, and 6% starch/PLA composite were conducted using TG/DTA EXTAR 6000 STATION (Seiko Instruments Inc. Japan). The TG/DTA module used a horizontal system balance mechanism. Around 2.5 mg of each sample was placed in an aluminum cell and then heated up to 600°C at a heating rate of 10°C min−1 under nitrogen atmosphere.
Thermomechanical analysis
Thermomechanical analysis (TMA) of starch, pure PVA, pure PLA, 6% starch/PVA composite, and 6% starch/PLA composite were carried out using a Shimadzu TMA-50 analyzer. Each sample (4 × 4 mm2) placed in an aluminum crucible with a lid was analyzed under a constant load of 100 mN, heated up to 140°C at a heating rate of 5°C s−1 under nitrogen atmosphere.
Moisture analysis
Moisture content of pure PVA, pure PLA, starch/PVA composites, and starch/PLA composites (each sample of 0.3 g) were determined by a computerized moisture content analysis machine (KERN RH 120-3, max. 120 g, Germany) at 105°C to constant weight.
Scanning electron microscopy
The micrographs of the starch, smooth and fracture surfaces of 6% starch/PVA composites, 6% starch/PLA composites were obtained using scanning electron microscope (JEOL JSM-6490LA machine, Japan) at 20 kV with carbon coating onto the samples.
Antimicrobial sensitivity analysis
The measurement of the antimicrobial activity of pure PVA, pure PLA, and both types of composites was done by Mueller-Hinton agar disk diffusion susceptibility testing method according to Clinical and Laboratory Standard Institute. 35 Two bacterial strains including selected gram-positive (Bacillus subtillis) and gram-negative (Escherichia coli) were selected to asses susceptibility pattern. The nutrient agar plates were incubated at 37 ± 1°C for 18 h. After incubation, the diameter (millimeter) of the clear zones as growth of inhibition were measured.
Results and discussion
Tensile properties
Tensile properties such as TS, Eb, and TM of pure PVA and the starch/PVA composites obtained are presented in Table 3. The TS, Eb, and TM of pure PVA obtained were 16.7 MPa, 160%, and 52 MPa, respectively. With the addition of 3% starch into PVA, the TS, Eb, and TM of the composite decreased. However, addition of more starch up to 15% increased the TS than that obtained from 3% starch/PVA composite. Nevertheless, the TS of the composites were obtained within the range of the TS of pure PVA. The Eb of starch/PVA composites of different concentrations showed increase up to the addition of 9% starch and after that with the incorporation of more starch the Eb decreased. On the contrary, the TM of starch/PVA composites of various concentrations showed a constant increase up to the addition of 15% starch into PVA.
TS, Eb, and TM of pure PVA and starch/PVA composites.
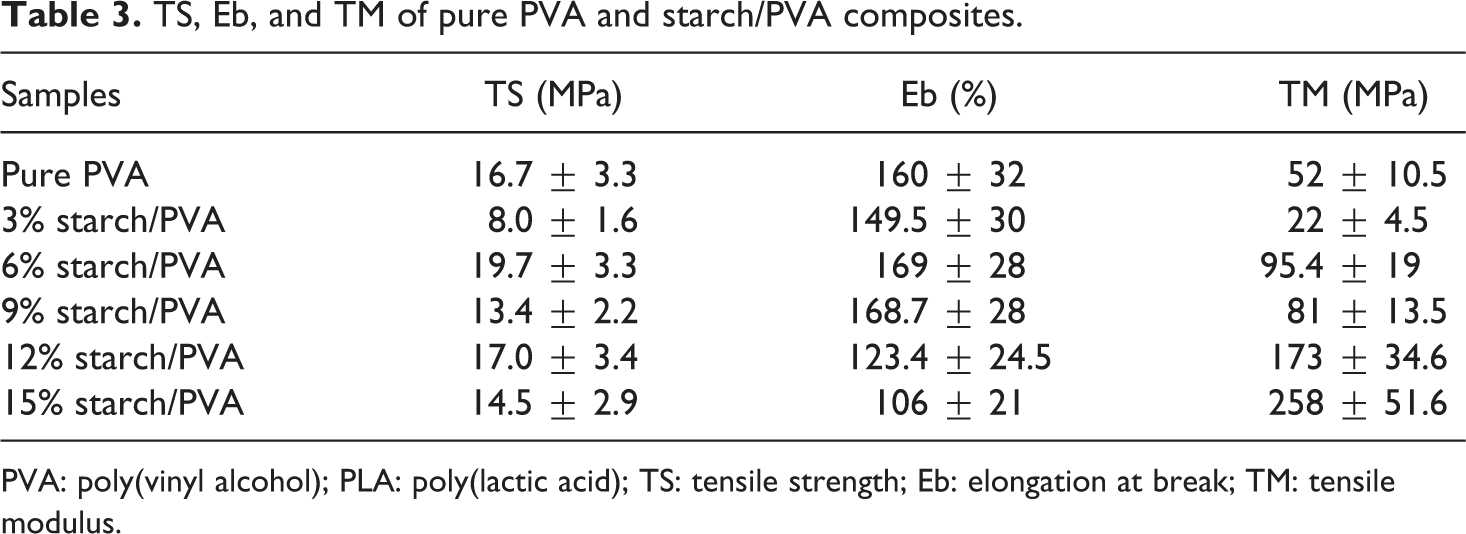
PVA: poly(vinyl alcohol); PLA: poly(lactic acid); TS: tensile strength; Eb: elongation at break; TM: tensile modulus.
The lesser in TS, Eb, and TM of 3% starch/PVA from pure PVA was most likely due to its insufficient reinforcement. Yu et al. has demonstrated that TS and Eb of the starch/PVA blends decreased as starch content increased, but no significant difference was observed. 36 While, in this study, with the addition of more starch (up to 9%) into the composites then the tensile properties were observed to increase other than Eb. 6% Starch/PVA composites were observed having the greatest TS and Eb. Addition of starch more than 9% (for the case of 12% and 15% starch/PVA composites) in the composites showed a decreasing trend of Eb. The enhanced TS and TM of the composites may be resulting from the interfacial adhesion of the reinforcement with PVA. 21
Vicker’s hardness
Vicker’s hardness (VH) and yield strength (YS) of pure PLA and starch/PLA composites of various concentrations are presented in Table 4. VH and YS of pure PLA were 6% and 2 MPa, respectively. After adding up starch in to PLA matrix, both VH and YS were found to be increased considerably. 6% starch/PLA showed the highest VH (20%) and YS (7MPa). However, there was no significant change observed for increasing starch concentrations from 3% to15%. Since hardness test is a surface-based indentation, small change in concentration showed no momentous change on the surface of the composites. 37
VH and YS of pure PLA and starch/PLA composites.
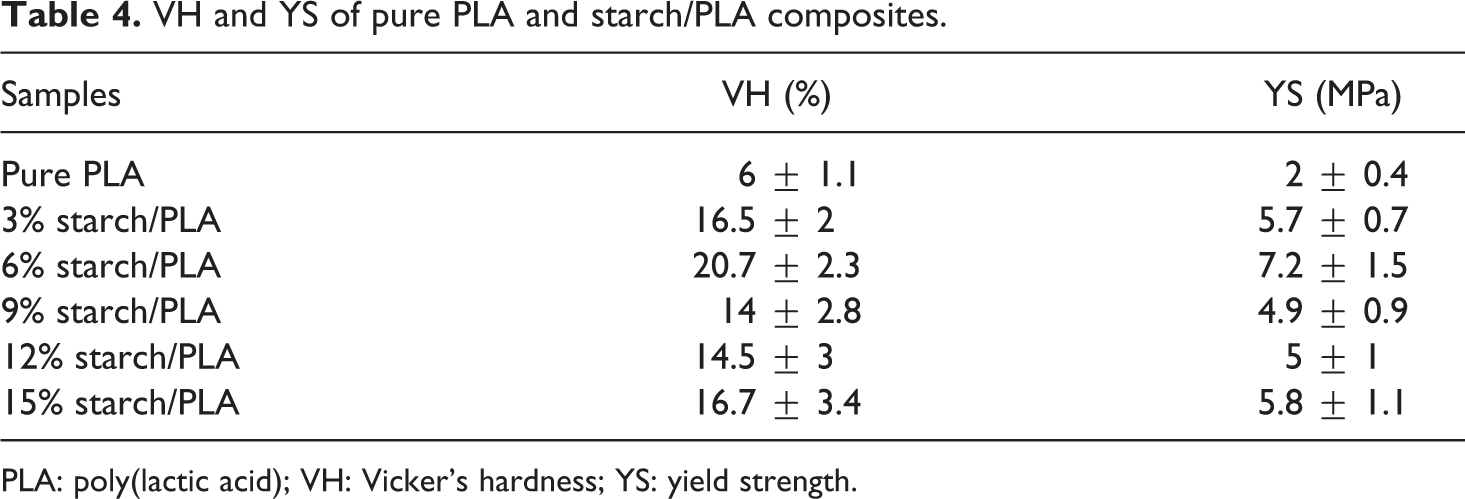
PLA: poly(lactic acid); VH: Vicker’s hardness; YS: yield strength.
XRD analysis
The XRD patterns of starch, pure PVA, and 6%starch/PVA composite are represented in Figure 1(i). In the figure, pure starch showed one strong intensity peak at 16.8° and four weak peaks at 14.8°, 19.4°, 22.1°, and 23.8°. According to Chen et al., native pea starch exhibited two strong intensity peaks at 17.8° and 19.4°, and two weak intensity peaks at 14.8° and 21.2°. 38 However, after acid hydrolysis treatment their nanocrystals showed a change in the diffraction pattern. All new peaks at 11.4°, 17.8°, 22.9°, and 23.8° appeared eliminating the corresponding peaks for native pea starch. The XRD analysis of potato starch obtained in this work hence confirmed that the starch platelets prepared were in the range of nano- and microsize. PVA showed a maximum intensity diffraction peak at 19.8°, indicating the presence of a typical semicrystalline structure, consistent with the studies of Géminarda et al., 39,40 6% starch/PVA composite demonstrated that most of the XRD peaks of starch were not observed in the composites and the diffraction patterns were very close to that of pure PVA. Chen et al. stated that this was due to the destruction of crystalline structure of starch granules as a result of gelatinization during the blending process with PVA. 38 It also indicated that the crystalline structure of starch had been strongly inhibited by PVA. 38,39
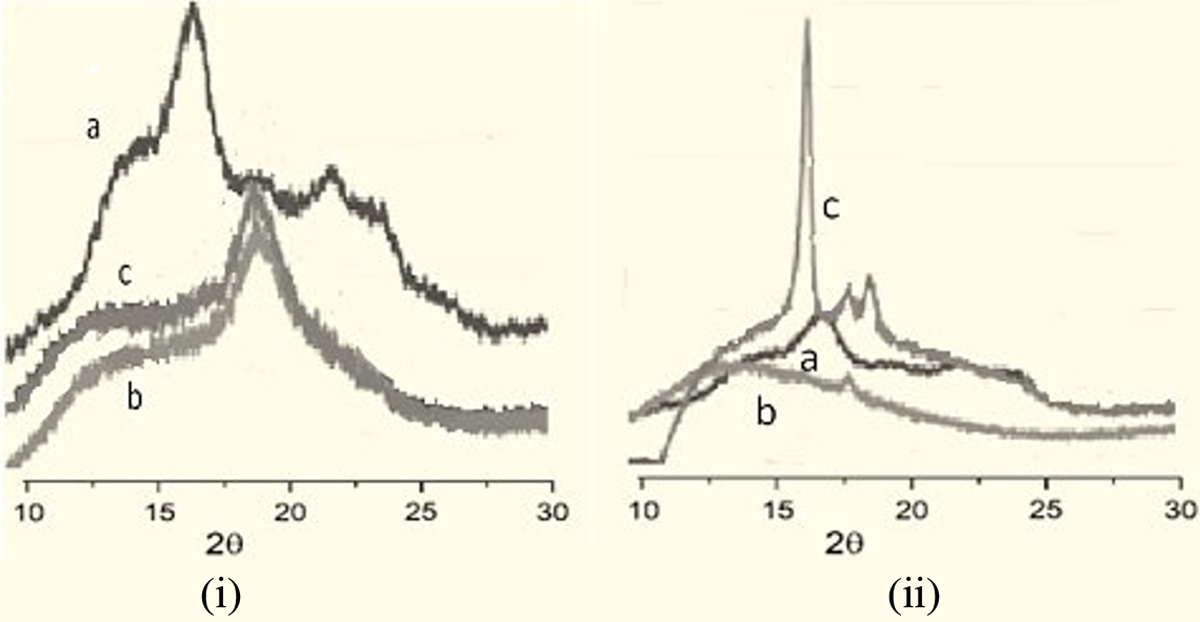
(i) XRD patterns of (a) starch, (b) pure PVA, and (c) 6% starch/PVA composite, and (ii) XRD patterns of (a) starch, (b) pure PLA, and (c) 6% starch/PLA composite. XRD: X-ray diffraction; PVA: poly(vinyl alcohol); PLA: poly(lactic acid).
Figure 1(ii) shows the XRD patterns of starch, pure PLA, and 6% starch/PLA composite. The characteristic diffraction peaks of starch observed in this figure are similar to those of it as obtained and discussed above in the case of Figure 1(i). Pure PLA showed a broad peak at 13.9° and a small peak at 17.9°, which were consistent with the result of Rahman et al. and Tsuji and Ikada, respectively. 25,41 However, 6% starch/PLA showed three peaks at about 16.3°, 17.8°, and 18.8°, respectively. The additional peaks observed at about 16.3° and 18.8° for the composite may be due to a change in the coordinate property of PLA molecules when starch was blended with it. 42 The diffraction pattern of the PLA/starch composites therefore showed that starch was physically dispersed in the PLA matrix.
FTIR studies
FTIR spectra of pure starch, pure PVA, and 6% starch/PVA composites are represented in Figure 2(i (a-c)). In the figure, pure starch showed the presence of –OH stretching (3310–3425 cm–1), –CH stretching (2936 cm–1), the intramolecular hydrogen bonding(1646 cm–1), –CH2OH stretching (1260 cm–1), and C–O–C ring vibration (928 cm–1), which are similar to the observation of Han et al. from the FTIR studies of starch in starch/PVA blend. 22 The characteristic IR absorption peaks of PVA were observed at about 3440 cm−1 (–OH stretching), 2956 cm−1 (–CH stretching), 1611 cm−1 (hydrogen bonding), 1110 cm–1 (–C–O–C group), and 922 cm–1 (–CH stretching). 21 In the case of the 6% starch/PVA composite, the crystallinity-dependent peak at around 1100 cm–1 weakened and the peak at around 922 cm−1 disappeared. The changes in these characteristic absorption peaks observed in the composites may be because of the interaction of –OH groups in the starch and PVA. 22
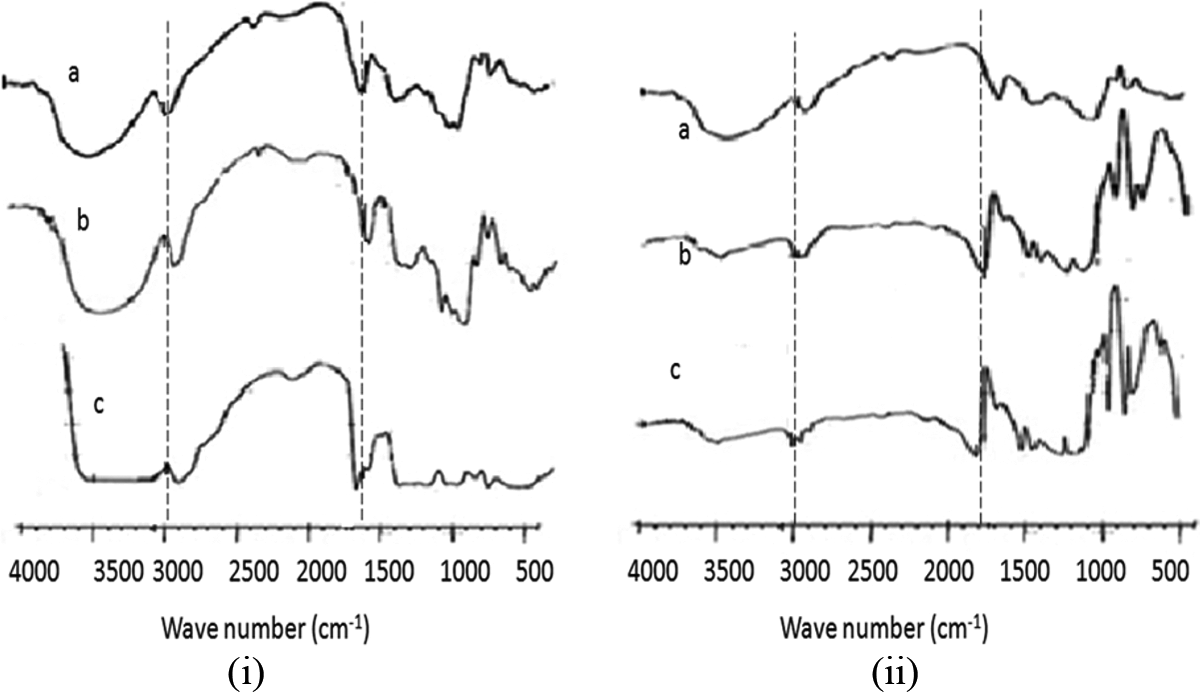
(i) FTIR spectra of (a) starch, (b) pure PVA, and (c) 6% starch/PVA composite and (ii) FTIR spectra of (a) starch, (b) pure PLA, and (c) 6% starch/PLA composites. FTIR: Fourier transform infrared; PVA: poly(vinyl alcohol); PLA: poly(lactic acid).
FTIR spectra of starch, pure PLA, and starch/PLA composites are presented in the Figure 2(ii (a-c)). The characteristic IR absorption peaks of starch had been observed in similar wave number ranges as discussed above in the case of Figure 2(i). Pure PLA showed a distinctive absorption peak at 1745 cm−1 corresponding to the stretching vibration of carbonyl group (–C=O) and peaks in between (1080–1180 cm−1 were due to –C–O– stretching vibration. The peaks at 2956 cm−1 in the PLA spectrum was because of –CH stretching vibration in the chain. 25 Almost similar peaks were also observed for 6% starch/PLA composites. However, for the composites, the peaks at 1745 cm−1 had shifted to a higher wave number of around 1760 cm−1 compared to that of pure PLA. It is assumed that this was due to the development of intermolecular H-bonding between PLA and starch. 43
Thermogravimetric analysis
Figure 3(i) represented the TG, DTA, and DTG thermograms of (a) starch, (b) pure PVA, and (c) 6% starch/PVA composite. The TG thermogram of the starch as given in Figure 3(i) showed a 10% initial loss of weight at around 141°C due to evaporation of absorbed moisture. The maximum degradation was around 61% at around temperature of 313°C. Pure PVA showed around 6% initial loss of weight due to removal of moisture at about 182°C in Figure 3(i). Then the mass was continuously losing having initial slower rate and ending in a faster rate. The maximum degradation was about 65% at around 343°C. In the TG thermogram, 6% starch/PVA composite showed (Figure 3(i)) an initial weight loss of 6% at around 165°C due to absorbed moisture and maximum degradation was around 65% at temperature 334°C. The weight loss pattern of the composite was observed very close to that of PVA, this is probably due to incorporation of a small amount of starch (only 9%) in the PVA matrix.
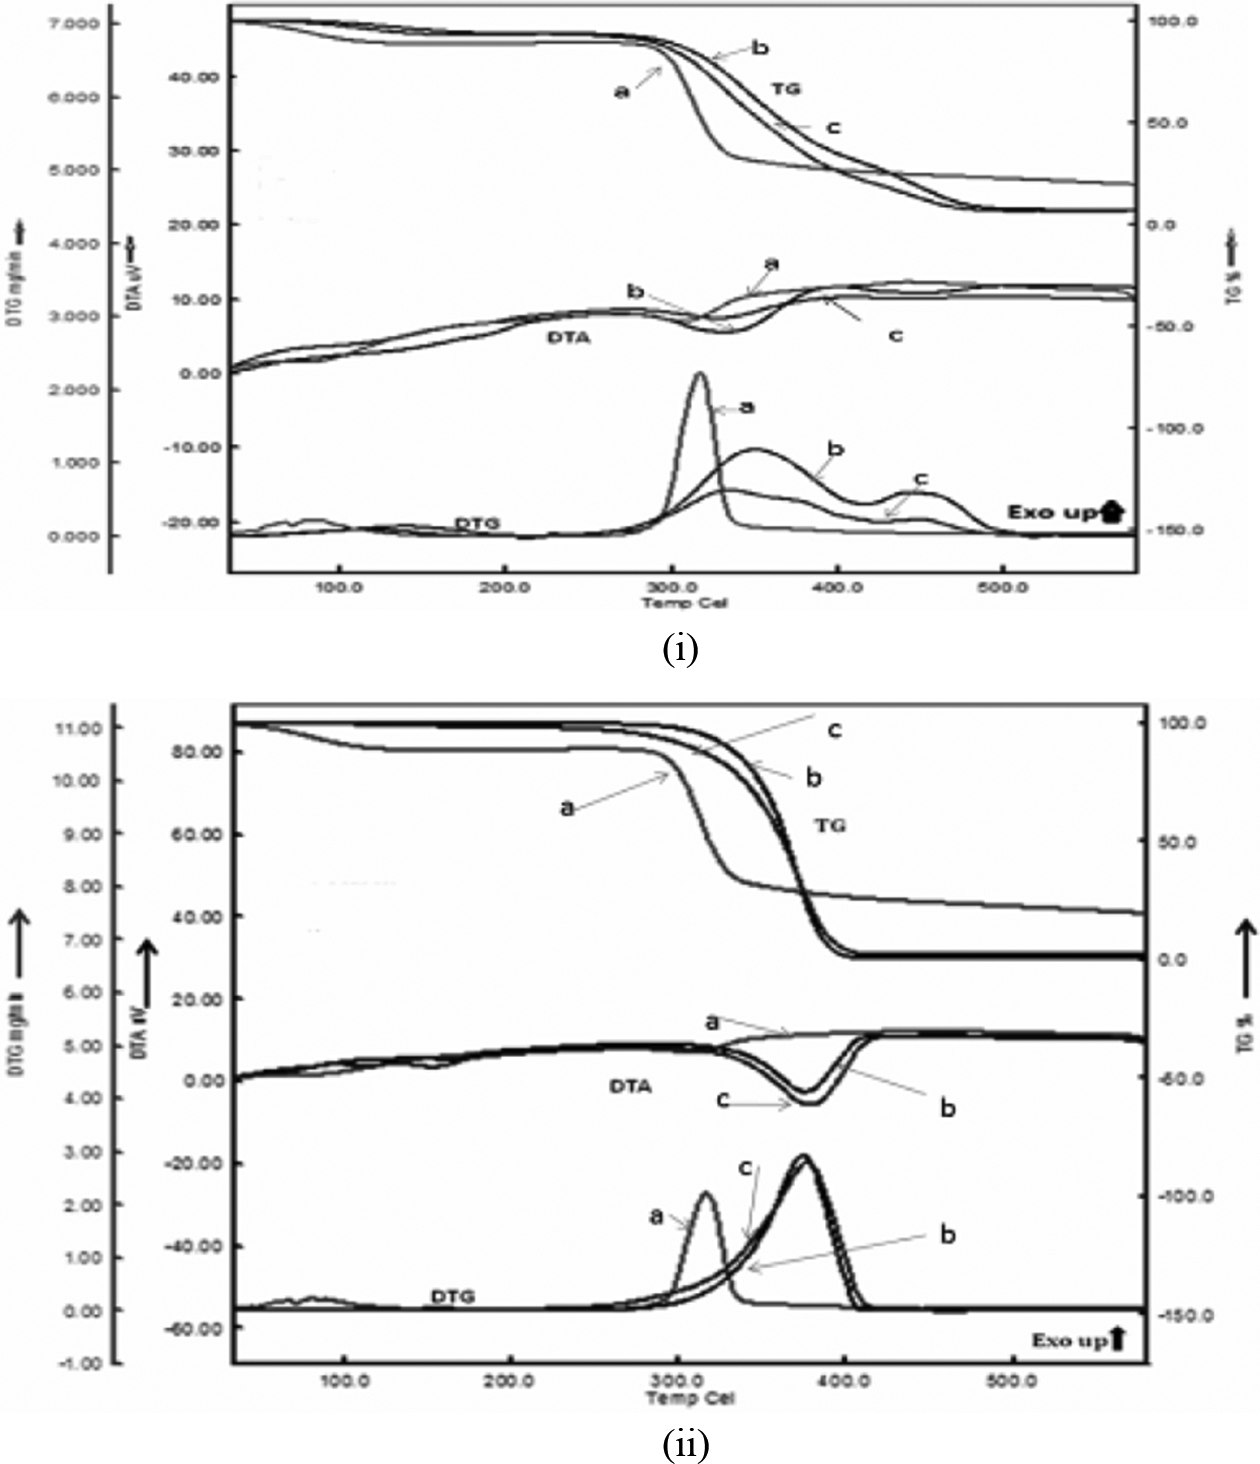
(i) TG, DTA, and DTG thermograms of (a) starch, (b) pure PVA, and (c) 6% starch/PVA composite and (ii) TG, DTA, and DTG thermograms of (a) starch, (b) pure PLA, and (c) 6% starch/PLA composite. TG: thermogravimetric; DTA: differentialthermal analysis; DTG: differential thermogravimetry; PLA: poly(lactic acid).
The DTA curve showed two endothermic peaks for starch (Figure 3(i)) at around 81°C and 307°C. In the DTA thermogram, pure PVA showed two endothermic peaks at around 202 and 448°C, indicating the melting and decomposition temperatures, respectively. 44 The 6% starch/PVA composite also showed two peaks at around 191 and 334°C due to their melting and thermal decomposition, respectively. Homogeneous polymer mixtures with a crystallizable component usually show a decrease in experimental melting points with the addition of the amorphous component because the interaction of the two polymers reduces the crystallite size. 44 Hence, the decrease in melting temperature of the composite compared to the pure PVA, suggested some interactions between starch and PVA.
From the DTG thermogram of starch, maximum degradation occurred at 316°C with the rate of 2.2 mg min−1 due to depolymerization, dehydration, and decomposition of hydroxyl units, followed by the formation of a char, while the degradation above this temperature can be described to the oxidation and breakdown of the char to lower molecular weight gaseous products. 44 In DTG thermogram, PVA showed the maximum degradation at around 349°C with a rate of 1.2 mg min−1. 6% starch/PVA composite showed the maximum degradation around 337°C; however, the degradation rate was 0.63 mg min−1, which was lower than that of pure PVA. Parvin et al. observed similar DTG curve as obtained in this study for starch/PVA-based film depicting two peaks at 370°C and 437°C, with the maximum degradation rate of 0.62 mg min−1. 44
Figure 3(ii) represented the TG, DTA, and DTG curves of starch, pure PLA, and 6% starch/PLA composite. TG, DTA, and DTG thermograms of starch obtained in Figure 3(ii) were identical as described in the case of Figure 3(i). The maximum degradation of pure PLA was around 30% around 375°C. For 6% starch/PLA, the TG curve also showed the maximum degradation of roughly 28% at about 375°C.
The DTA thermogram of pure PLA showed three endothermic peaks around 82, 161, and 375°C removal of moisture, melting, and thermal decomposition, respectively. Similarly, the DTA thermogram of 6% starch/PLA composite showed three endothermic peaks around 68, 155, and 376°C due to removal of moisture, melting, and thermal decomposition, respectively. As discussed above for the DTA thermogram of starch/PVA composite, addition of starch into PLA also lowered the melting point of the final composite compared to that of pure PLA.
The DTG curve of pure PLA exhibited the maximum degradation around 373°C with the rate of 2.9 mg min−1, whether the composite showed the maximum degradation around 376°C with the rate of 2.8 mg min−1. As already discussed for the case of 6% starch/PVA composite, the PLA composite also showed somewhat lower degradation rate in the DTG thermogram compared with the pure PLA.
TMA analysis of pure PVA and starch/PVA composites
TMA thermograms provide a description of the behavior of a material under load when it is heated from its glassy state. As the temperature increases, the material softens to its glass transition temperature (Tg). Figure 4(a) showed that softening of pure PVA started at around 47°C and continued up to around 178°C followed by its expansion at 216°C. Finally, pure PVA melted down at 243°C. This result was similar with the observation made by Rahman et al. 21 The composite of 6% starch/PVA started softening around 29°C, which is lower than that of the pure PVA and it continued up to 175°C. The expansion of the composite started at 202°C and finally melted down at 234°C (Figure 4(b)). On the other hand, the softening of pure PLA started around 60°C and melted down at 157°C (Figure 4(c)). 30 6% starch/PLA composite showed Tg around 44°C and the expansion started around 150°C (Figure 4(d)). From the TMA thermograms, it was clearly noticeable that after adding starch either into PVA or PLA, both the cases the composites showed comparatively lower Tg and melting temperature than those of pure PVA and PLA. 45,46
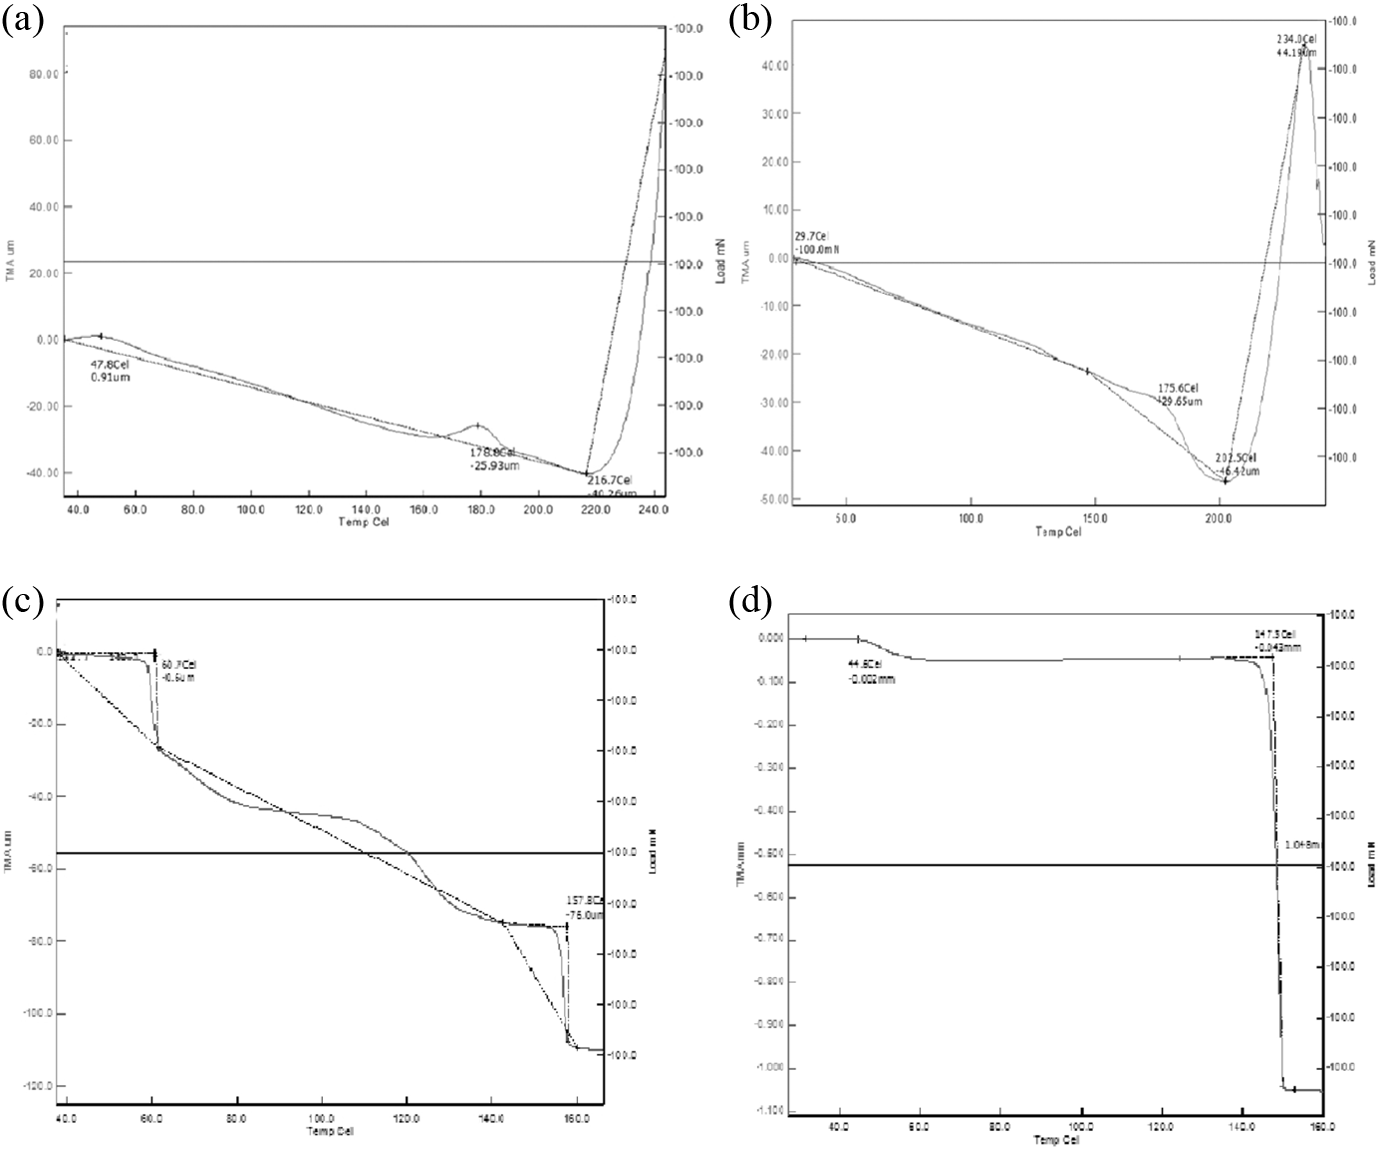
TMA thermograms of (a) pure PVA, (b) 6% starch/PVA composite, (c) pure PLA and, (d) 6% starch/PLA composite. TMA: thermomechanical analysis; PVA: poly(vinyl alcohol); PLA: poly(lactic acid).
Moisture content analysis
Moisture content of the samples were determined by TAPPI standard method (Kern) involves heating a known weight of dried material, then after cooling the loss of weight were determined. Heating was generally done in several stages until a constant weight was obtained. Table 5 represents the moisture contents of pure PVA, pure PLA, starch/PVA composites, and starch/PLA composites. The moisture content of starch and pure PVA obtained were about 11% and 12%, respectively. There was a slight reduction in moisture uptake of PVA after starch addition was observed and this was possibly because of increased bulk crystallinity of the composites. However, with the variation of starch content within the composites there was no significant change in moisture content observed. PLA being hydrophobic showed comparatively lower moisture content (4%) than those of starch and PVA. In the case of starch/PLA composites, with the addition of hydrophilic starch into PLA matrix, the composites showed a significant increase in moisture content (8–9%). The high moisture content of 3% starch/PLA composite may be subjected to improper handling. The amount of moisture content in composites significantly impacted on the mechanical properties of the films due to its weakening effects. 47,48 In this study, there was no substantial variation observed in moisture content due to the variation in the amount of starch either in starch/PVA or starch/PLA composites. Thus, the moisture content assessment confirmed that there is no effect of moisture in the measurement of tensile properties of the composites.
The moisture contents of pure PVA, pure PLA, starch/PVA composites, and starch/PLA composites.
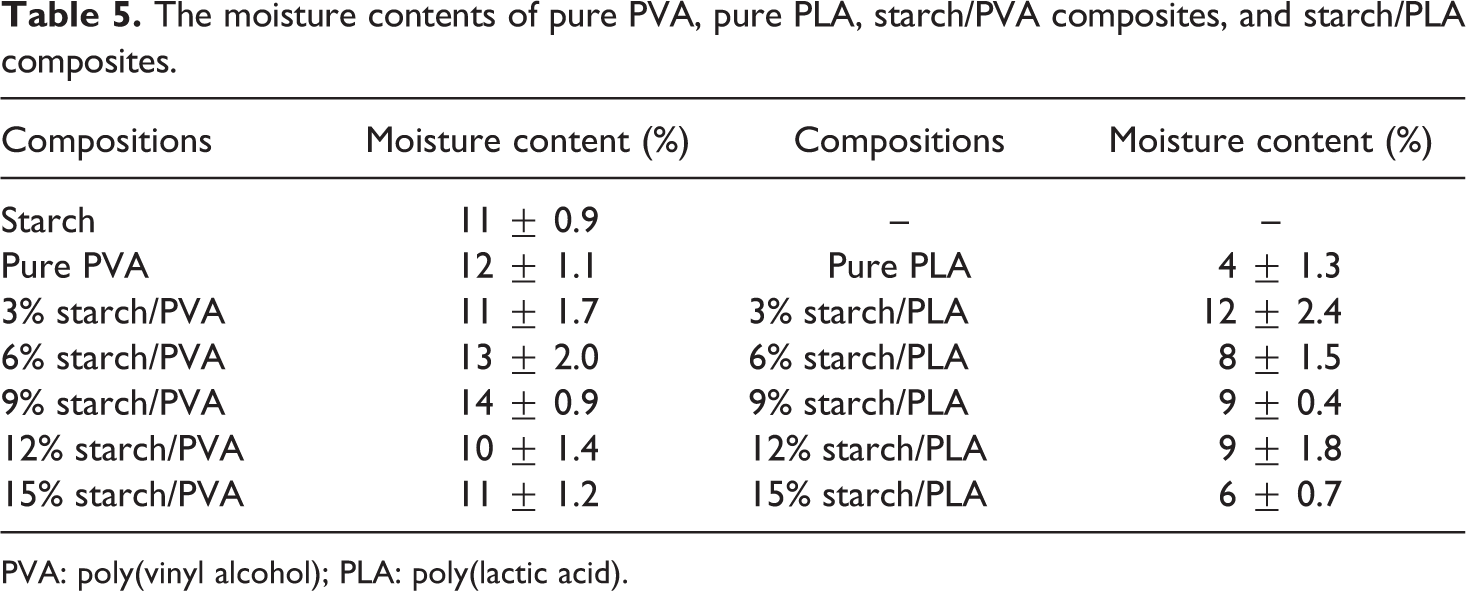
PVA: poly(vinyl alcohol); PLA: poly(lactic acid).
Morphology of the starch and composites
It was observed from the SEM images (Figure 5(a)) that starch particles were mostly within the range of 10–50 µm and a few below 10 µm and above 100 µm in size. The 6% starch/PVA and 6% starch/PLA composites were also examined using SEM to study the morphology as shown in Figure 5(b) to (e). The surface of starch/PVA composites showed that there were some starch platelets on the surface and some holes as well, which may be due to artifacts (Figure 5(b)). These artifacts of the composites may cause some irregularities in the tensile properties of them. However, the SEM images of the fracture surface of the sample after tensile test showed that the starch platelets were reasonably bonded and in uniform distribution throughout the PVA matrix (Figure 5(c)). Figure 5(d) and (e) represents the micrographs of the surface of starch/PLA composite and its fracture surface, respectively. The surface of this composite was not very smooth and it also showed the presence of some platelets on the surface like starch/PVA composite (Figure 5(b)). As this composite was not tested by UTM, the sample was fractured manually before taking its fracture surface micrographs, and it was observed that in this case the fracture surface was fairly smooth, which indicates poor adhesion between starch and PLA (Figure 5(e)). The observation of fracture surfaces of both the composites supported the TS results presented above in this article.
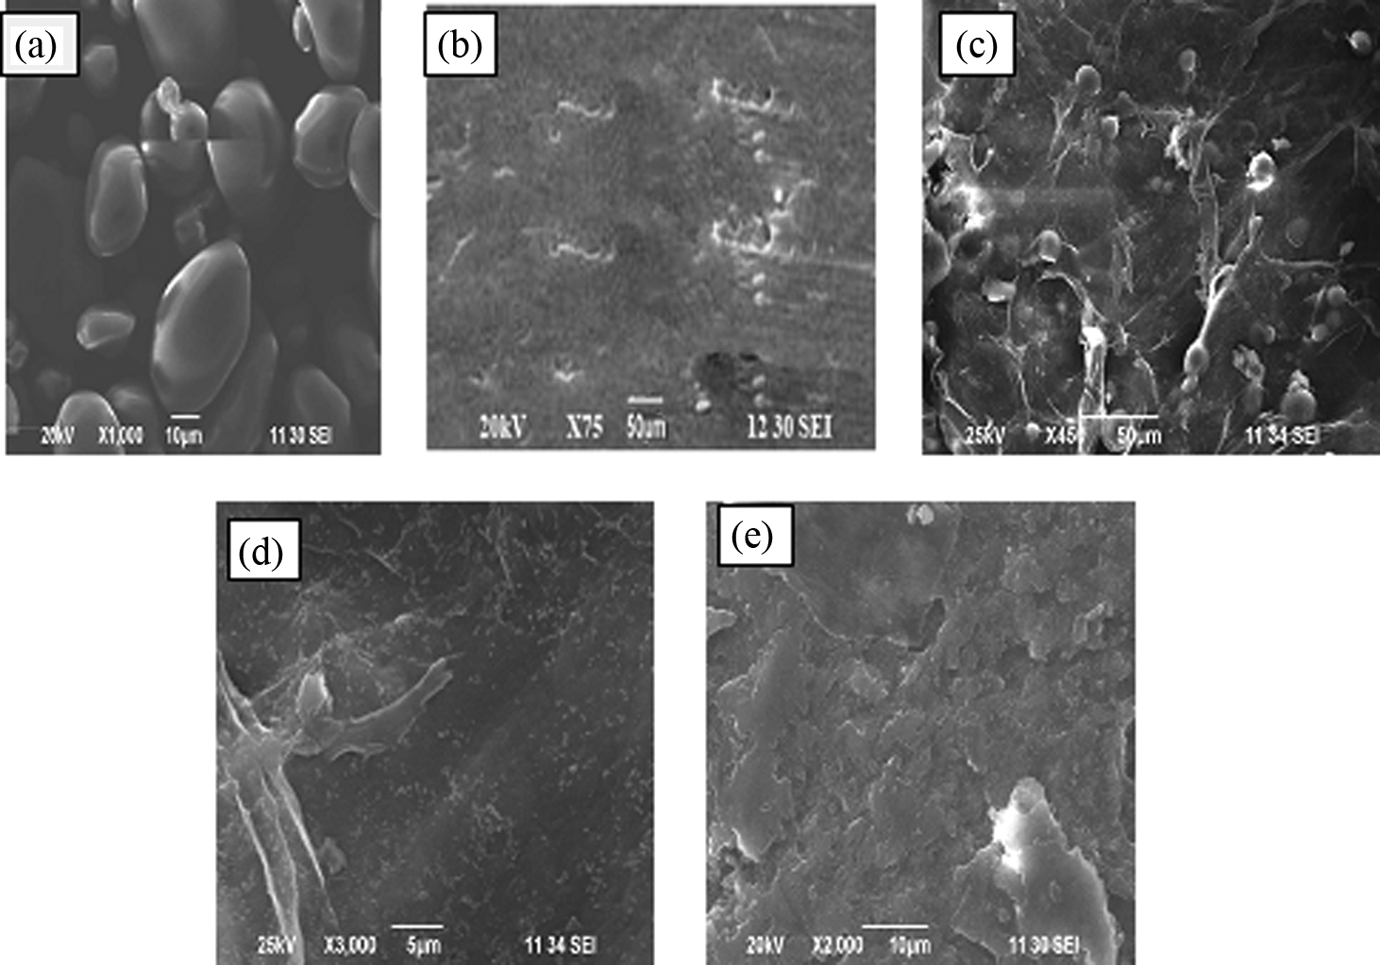
SEM images of (a) potato starch, (b) 6% starch/PVA composite surface, (c) 6% starch/PVA composite fracture surface, (d) 6% starch/PLA composite surface, and (e) 6% starch/PLA composite fracture surface. SEM: scanning electron microscopy; PVA: poly(vinyl alcohol); PLA: poly(lactic acid).
Antimicrobial sensitivity test
Two bacterial strains, gram-negative E. coli and gram-positive B. subtillis bacteria, were selected to asses susceptibility pattern of the antimicrobial activity of pure PVA, starch/PVA composites, pure PLA, and starch/PLA composites. 49 Figure 6(a) and (b) shows track no. 1 (pure PVA), 2 (3% starch/PVA), 3 (6% starch/PVA), 4 (9% starch/PVA), and 5(12% starch/PVA) against E. coli and B. subtillis, respectively, where track no. 1 in both the cases indicated clear zones around it. However, the clear zone produced may be due to melting of pure PVA in the autoclave used for the test at 37°C. Although pure PVA showed a problem of quick melting during the test, clear zone of growth of inhibition was observed for the track nos 2 and 4 (11 and 13 mm respectively) against E. coli in Figure 6(a) and also for the track nos 2, 4, and 5 (9, 11 and 14 mm) respectively against B. subtillis in Figure 6(b). The observation undoubtedly indicated that the addition of starch in PVA made the composites to be antimicrobial. Figure 6(c) and (d) shows that track nos 1 (pure PLA), 2 (3% starch/PLA), 3 (6% starch/PLA), 4 (9% starch/PLA), and 5(12% starch/PLA) against E. coli and B. subtillis, respectively. For both types of bacterial strains, no clear zones were found either in pure PLA and starch/PLA composites.
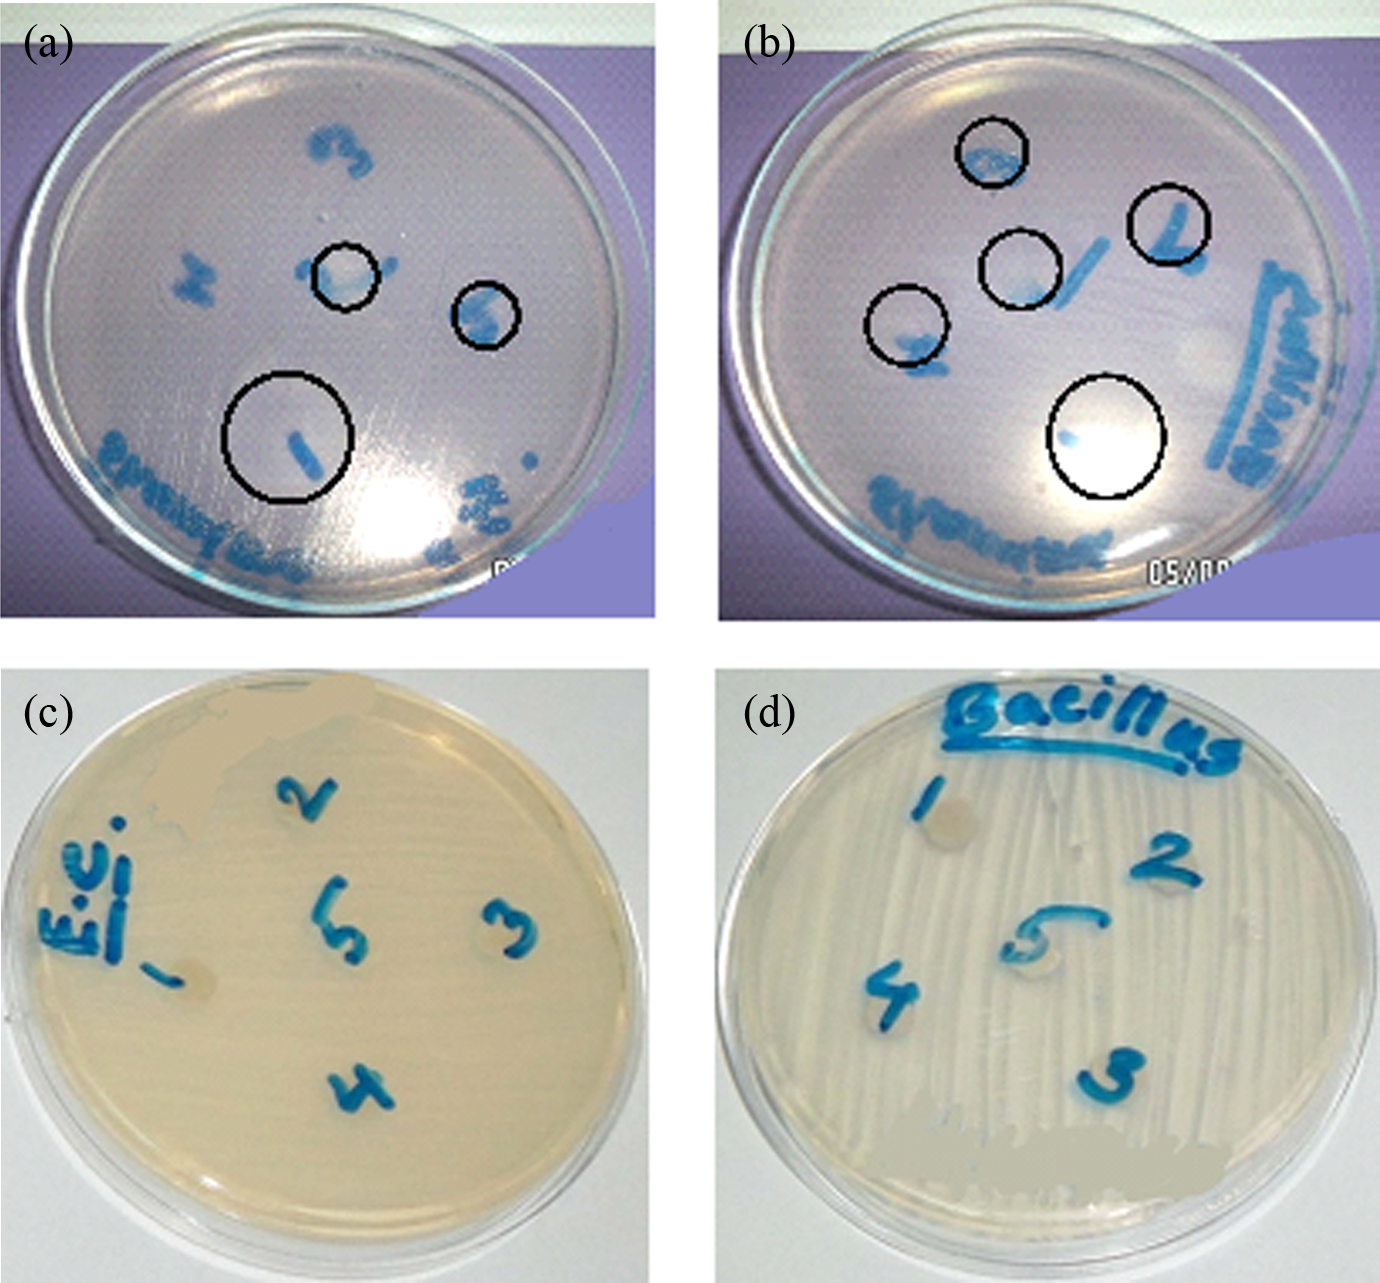
Antimicrobial sensitivity of (a) pure PVA and starch/PVA composites against Escherichia coli, (b) pure PVA and starch/PVA composites against Bacillus subtilis, (c) pure PLA and starch/PLA composites against Escherichia coli, and (d) pure PLA and starch/PLA composite against Bacillus subtilis. PVA: poly(vinyl alcohol); PLA: poly(lactic acid).
Conclusions
The study described the preparation method of nano-/microsize starch from potato, and it was successfully embedded into PVA and PLA matrices separately to fabricate the final composites. Starch/PVA composites showed a better mechanical properties (TS: 19.7 MPa, Eb: 169%, and TM: 95 MPa) over the starch/PLA composites(72 MPa). XRD confirmed the crystallinity pattern of the starch platelets as well as those of the composites. FTIR clearly represented the chemical bonding between starch and the matrices. For both types of composites, thermal stability was observed from TGA, DTA, DTG, and TMA. SEM images identified the size of the starch produced and the fracture surface images supported the tensile data obtained. Starch/PVA composites were found to have antimicrobial properties whether it was not observed for starch/PLA composites. On the basis of investigation of both the composites, it can certainly be concluded that starch/PVA composites possess more suitable properties to be applied in biomedical applications than those of starch/PLA composites.
Footnotes
Declaration of Conflicting Interests
The author(s) declared no potential conflicts of interest with respect to the research, authorship, and/or publication of this article.
Funding
The author(s) disclosed receipt of the following financial support for the research, authorship, and/or publication of this article: The authors acknowledge the Ministry of Science, Information and Communication Technology of the government of Bangladesh for the support of this study by a research grant (number and date of sanction order: 39.009.002.01.00.041.2011-2012/EAS-3/1008, dated 3 October 2011).