
Abstract
A thermal power station fly ash (FA) was mechanochemically activated by high-energy ball milling that yielded nanostructured FA. This nanostructured FA was incorporated into biodegradable poly(vinyl alcohol) (PVA) matrix by solution mixing and ultrasonication. Transmission electron micrographs revealed that the smooth spherical particles of FA were changed into irregular and rough ones; in addition, the particle size of FA was reduced to a few hundred nanometers, and its specific surface area value increased after the high-energy milling process. All these factors, in turn, led to a thermodynamically favorable interaction between the mechanochemically activated FA and PVA as evidenced by Fourier transform infrared spectroscopy. The incorporation of a very small amount of the nanostructured FA led to an increase in crystallinity of the polymer matrix. The glass transition temperature of the PVA matrix increased by about 18°C when 5 wt% of the nanostructured FA was used as the reinforcement.
Introduction
Fly ash (FA), a ceramic material, often called as pulverized fuel ash, is obtained as a by-product of combustion of coal. It solidifies in suspended state from the exhaust gases and is collected by either electrostatic precipitators or filter fabric bag houses. 1,2 FA consists of inorganic, incombustible matter present in coal that fuses during combustion into a glassy, amorphous structure. Depending upon the source and composition of the coal being burned, the components of FA vary considerably. But compositions of FAs are heterogeneous, which include substantial amounts of the oxides of silicon (both amorphous and crystalline), aluminum, calcium, and iron. It is important to reduce its accumulation and ensure its safe disposal, as FA contains traces of toxic elements, such as arsenic, beryllium, boron, cadmium, chromium, cobalt, lead, manganese, mercury, molybdenum, selenium, strontium, thallium, and vanadium, which have negative effects on environment and health of humans. 3,4
Utilization of FA has received a great deal of attention over the past two decades. FA has been widely used as a reinforcement in polymer matrix composites. In addition, it was earlier used in various polymers, such as poly(etheretherketone), 5 polypropylene, 6,7 epoxy, 8 poly(vinyl alcohol) (PVA), 9 high-density polyethylene, 10 and ethylene–octene copolymer. 11
The usage of nanoparticles as fillers for polymers presents a new dimension in the development and application of advanced materials. The major parameters affecting the final properties of a nanocomposite are particle size of filler, and extent of distribution and dispersion of the filler particles in the polymer matrix, aspect ratio and volume fraction of filler, and the adhesion between surfaces of filler particles and polymer chains. Fillers play an important role in modifying properties of polymers and reducing the cost of composites. 12
PVA is a water-soluble semicrystalline polymer produced by the alcoholysis of poly(vinyl acetate). 13,14 Solubility of PVA in water is known to depend on its degree of crystallinity and crystalline morphology, which, in turn, depends on its stereoregularity and molecular weight. 15 PVA is one of the most interesting biodegradable plastics and has been widely used in paper coating, textile sizing, flexible water-soluble packaging films, and other industrial applications. This is due to its environment-friendliness, nontoxicity, recyclability, low cost, and susceptibility to biodegradation. 16 PVA–matrix composites with a wide variety of inorganic nanofillers, such as silver sulfide, 17 cadmium selenide–zinc sulfide quantum dots, 18 zinc oxide, 19 sodium montmorillonite, 20 and bacterial cellulose have been reported in the literature. 21
Mechanochemical activation of FA particles by high-energy milling is considered as a potential pathway to achieve further enhancement of mechanical strength in polymer/FA composites. 22 –24 High-energy milling involves repeated welding, fracturing, and rewelding of powder particles for fabrication of several advanced materials. 25 There are some inherent advantages in processing nanomaterials via high-energy ball milling technique, such as excellent versatility, scalability, and cost-effectiveness. Milling parameters, such as type of mill, extent of vial filling, milling temperature, type and size of balls, ball to powder weight ratio, and time of milling, influence the characteristics of nanoparticles. 26 Wet milling process assisted by a surfactant has been found to result in reduction of agglomeration of milled particles. Mechanochemical activation of FA is considered as an efficient way of synthesizing nanoparticles in large quantity. 27
In this study, a thermal power station FA was mechanochemically activated by high-energy ball milling in the presence of toluene and an anionic surfactant. The resultant FA particles were used as a nanostructured reinforcement in biodegradable PVA matrix. The mechanical, morphological, and crystallization characteristics of PVA/fresh FA and PVA/mechanochemically activated FA composites were studied, and the results have been reported in this article.
Experimental details
Materials
The thermal power station FA was kindly provided by Tuticorin Thermal Power Station (Thoothukudi, Tamil Nadu, India). PVA (
Mechanochemical activation of FA
The as-received FA had a carbon content of approximately 4% by weight. To remove the carbon present in the as-received FA, it was washed with distilled water and dried at 100°C for 5 h. This FA is mentioned as fresh FA. Fresh FA was sieved using British Standard Sieve, and FA fractions that passed through mesh no. 170 but got retained on mesh no. 200 were collected as it gave 25% by weight of the total FA taken for sieving; this FA was further subjected to manual magnetic separation to remove the uncombined magnetic impurities. The resultant FA will hereafter be mentioned as sieved FA.
High-energy planetary ball mill (PM 100; Retsch, Germany) was used for mechanochemical activation of the sieved FA. The milling conditions were as follows: the milling vial and the media were of tungsten carbide, ball-to-FA ratio of 10:1 was used, and the ball diameter was 10 mm. The milling was carried out in toluene medium along with 1 wt% of SLS for 30 h and 60 h. The rotation speed of the planetary carrier was 300 rev min–1 as calculated using equation (1):
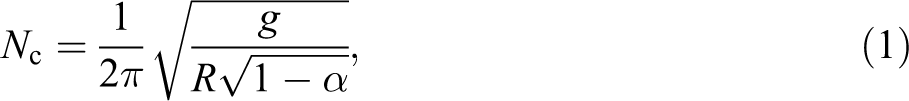
where g is the acceleration due to gravity, R is the inner radius of the vial, and α is the volumetric filling ratio of the particles. 29
Preparation of composites
Three sets of PVA matrix composites, containing 1, 3, and 5 wt% of fresh FA and FA that was mechanochemically activated for 30 and 60 h (MCA-FA), were prepared by solution casting method. Neat PVA was dissolved in demineralized water at 80°C under vigorous agitation in a covered beaker to prepare a 6% (w/v) solution. For the preparation of cross-linked composite films, 1 N hydrochloric acide (50 μL) and 1 wt% GLA solutions (0.50 mL) were added. A predetermined amount of filler was added to the PVA solution, and the mixture was ultrasonicated for 30 min. The solution was then transferred to a clean petri dish and dried at ambient temperature. Subsequently, they were kept in a vacuum oven for 4 h at 60°C to remove the residual solvent until a constant weight was obtained. After the complete evaporation of the solvent, the films were peeled off the glass petri dishes and used for testing and characterization. The thicknesses of the films were approximately nearly 0.3 mm. The designations of the composites are given in Table 1.
Designations of the samples.
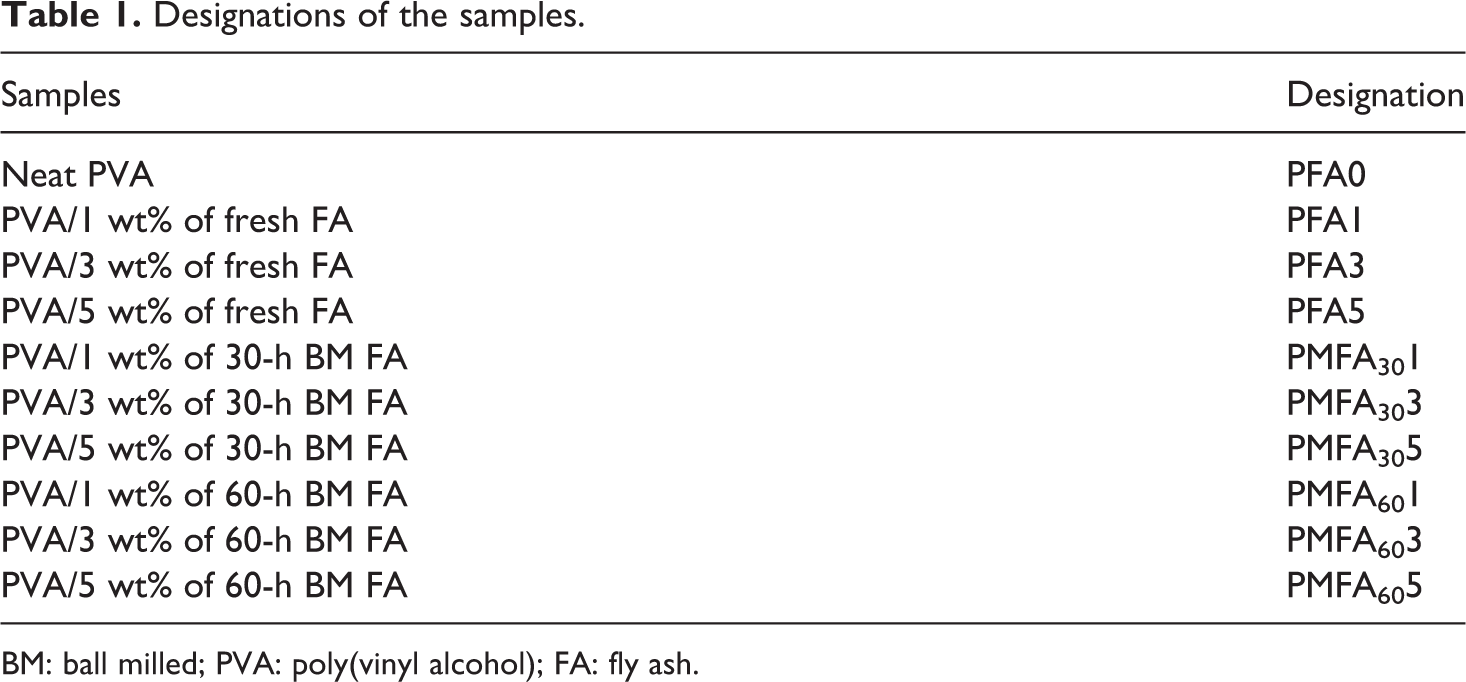
BM: ball milled; PVA: poly(vinyl alcohol); FA: fly ash.
Characterization of fresh FA, MCA-FA, and their composites with PVA
A transmission electron microscopy (TEM; JEOL-JEM 2100 TEM, Japan) was used to study the particle morphology as well as surface texture of the MCA-FA. The MCA-FA particles were dispersed in ethanol under sonication and a drop of this dispersion was transferred onto a 200-mesh carbon-coated copper (Cu) grid. The TEM images were obtained at an accelerating voltage of 120 kV, and the selected area electron diffraction (SAED) patterns were also obtained to study the crystalline nature of MCA-FA.
The effect of surface modification of the MCA-FA by the surfactant was analyzed by dispersing it in demineralized water in 10-mL vials. The vials were ultrasonicated, and digital photographs were snapped to assess the extent of dispersion of MCA-FA in water. In addition, a dynamic contact angle analyzer (FTÅ 200, First Ten Angstroms, Portsmouth, Virginia, USA) was used to study the surface wettability of fresh FA and MCA-FA pellets obtained using a hydraulic press. Ten microliters of the test liquid (double-distilled water and PVA solution) was dispensed using a micropipette onto the surfaces of the pellets. The images of the liquid spreading were recorded at different intervals of time. The captured images were analyzed by FTA software to determine the static contact angles of the droplets on the pellets.
Dynamic light scattering (DLS) (Scatteroscope I, Qudix Inc, South Korea) was used to analyze the hydrodynamic sizes and size distributions of fresh FA and MCA-FA particles in aqueous or glycerol media.
The specific surface area of the MCA-FA was measured by a computerized surface area analyzer (Smart Sorb 92/93, Smart Instruments, Dombivli, Maharashtra, India) as per ASTM D-3037 standard. About 1 g of the sample was used, and the surface area of MCA-FA was calculated at an accuracy of ±5% by Brunauer–Emmett–Teller (BET) method. The sample was first regenerated to remove the adsorbed gases and moisture from the surface by heating under a vacuum at 350°C. A gaseous mixture of helium (70%) and nitrogen (30%) was passed over the sample contained in a tube. Sample was then dipped in liquid nitrogen (LN2). Regenerated sample exposed to N2 gas at LN2 temperature adsorbs N2 and forms a single molecular layer of N2 on the surface of the powder. After confirming that adsorption was over, the sample tube was dipped in water kept at ambient temperature. This led to desorption of adsorbed N2 from sample, which was quantitatively determined using a thermal conductivity detector coupled with an in-built electronic integrator. Surface area was calculated by measuring the volume of N2 adsorbed using a modified single-point BET equation.
X-ray diffraction (XRD) patterns of the composites were recorded using a goniometer (JEOL DX-GE-2P, Japan) using Cu K
α radiation (λ = 1.542 Å) at an accelerating voltage of 30 kV and current of 20 mA. The samples were scanned at a speed of 2 deg min−1 in the 2θ range of 10°–35° at 25°C. The average crystallite size was calculated from the full width at half maximum (FWHM) of the XRD peak using the Scherrer’s formula: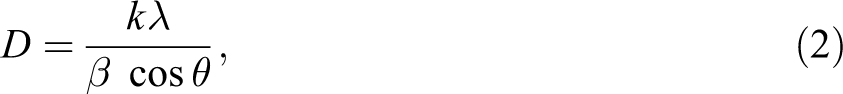
where D is the crystallite size, λ is the wavelength of the X-rays, β is the FWHM of the diffraction peak, θ is the diffraction angle, and k is the Scherrer’s constant of the order of unity for usual crystals. 30
The texture and morphology of fresh FA, MCA-FA, and their composites were determined by a scanning electron microscope (SEM; JEOL-JSM-6380LA SEM, Peabody, Massachusetts, USA) equipped with an energy dispersive X-ray spectroscope (Link ISIS-300 Micro-analytical System, Oxford Instruments, UK). Prior to fractography studies of the composites, the tensile fracture surfaces were sputtered with gold using a sputtering unit (JEOL JFC 1600, auto fine coater, USA) to make their surfaces conductive. The images were recorded at suitable accelerating voltages for the best possible resolution using secondary electron imaging. The degree of dispersion of fresh FA and MCA-FA in PVA composites was determined by elemental mapping through energy dispersive X-ray spectroscopy (EDS).
A Fourier transform infrared (FTIR) spectrometer (Jasco FTIR-4200, Japan) was used to examine the polymer–filler interaction. The vibrational spectra in the ATR mode were acquired in a wave number range of 4000–650 cm−1 with a spectral resolution of 1 cm−1 and an average of 32 scans was recorded.
The mechanical properties, such as tensile strength, elongation at break, and stress at 100% strain (denoted as M100) were measured using a universal testing machine (H25KS, Hounsfield, UK). The tests were performed on dumbbell specimens (ASTM D 412-06a die 31 ) of the composites at 25 ± 2°C as per ASTM D638-10 standard 32 at a crosshead speed of 50 mm min−1. The reported values of mechanical parameters are the averages of five values, and the maximum deviations in tensile strength, M100, and elongation at break were ±5%.
Differential scanning calorimetry (DSC) was carried out on approximately equal 5 mg of the samples loaded in hermetically sealed aluminum pans using a Netzsch DSC 200 F3 Maia® analyzer. Heating was done in the range of 0–250°C at a rate of 10°C min−1 under a dynamic N2 atmosphere flowing at a rate of 50 mL min−1. The % crystallinity (X
c) of the samples was calculated using equation (3):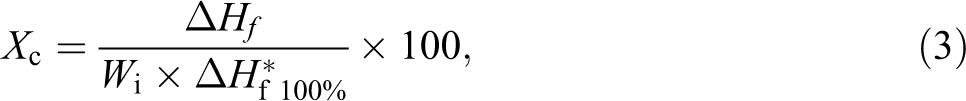
where
Results and discussion
Characterization of FA and MCA-FA
TEM results
Figure 1(a) shows the SAED pattern of 60-h MCA-FA. The diffraction spots are randomly distributed, but then fall on rings of constant radii even after 60 h of milling. This indicates that individual crystals are at different orientations in a polycrystalline material. 36 Figure 1(b) illustrates the morphology of MCA-FA, in which individual particles in nanometer range with rough surface and irregular shape are seen. The nano-FA has a large number of crystals included in the diffraction aperture, leading to continuous diffraction rings in the SAED pattern.
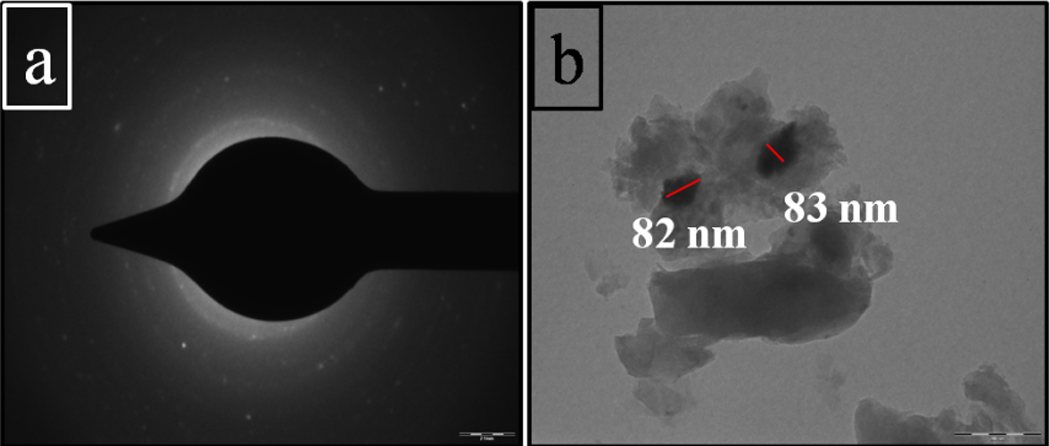
(a) SAED pattern and (b) TEM micrograph of 60-h MCA-FA. SAED: selected area electron diffraction; TEM: transmission electron microscopy; MCA-FA: mechanochemically activated-fly ash.
The surfactant layer on the surfaces of nano-FA particles is expected to play a significant role in reducing the agglomeration of particles, which, in turn, is supposed to improve the mechanical strength of the composites based on nano-FA.
Wettability study
The silanol groups on the surface of fresh FA particles make them hydrophilic. To demonstrate the change in the nature of FA surface upon its mechanochemical activation, the fresh FA and MCA-FA were mixed with demineralized water in three different vials of 10-mL capacity. The vials were ultrasonicated for 15 min and then digital photographs were snapped (Figure 2). It can be seen from Figure 2 that the MCA-FA particles float on water, while that of the fresh FA are found dispersed in water. The surface chemistry of fresh FA allows its particles to be wet by water through formation of hydrogen bonds with water.
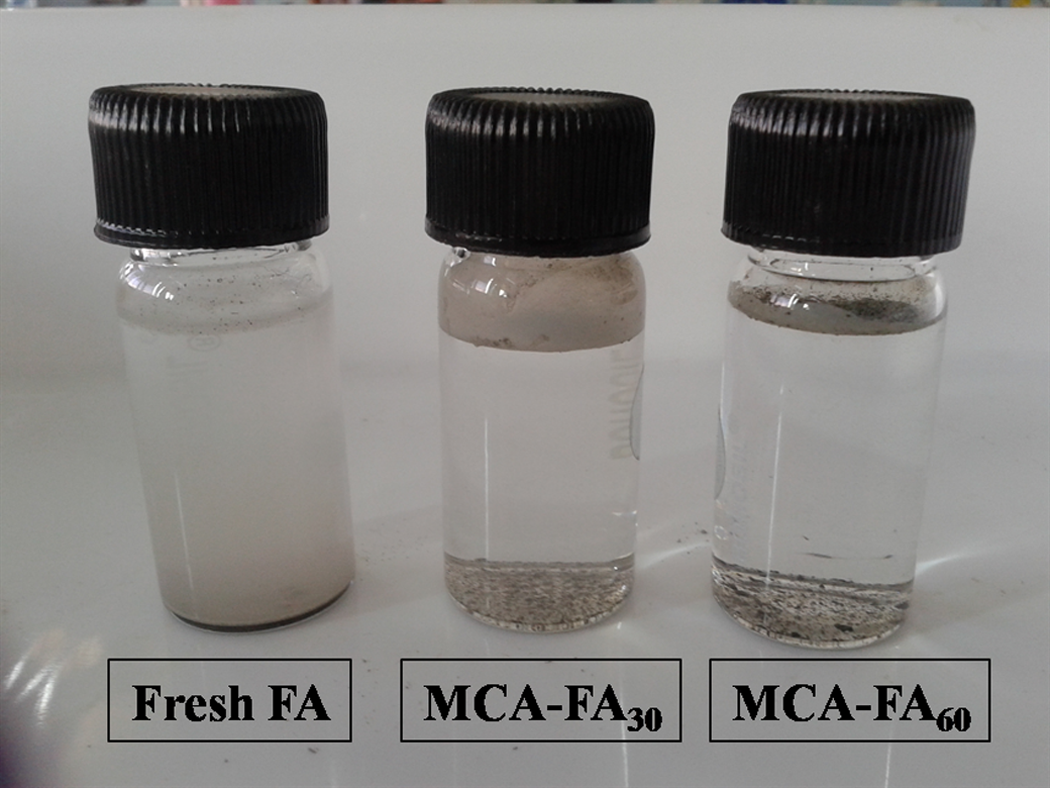
Dispersion behaviors of fresh FA, 30 h and 60 h MCA-FA in demineralized water. FA: fly ash; MCA-FA: mechanochemically activated-fly ash.
The wettability of MCA-FA by water is less as the surfactant molecules are adsorbed on to the surfaces of FA particles, decreasing their surface tension, which, in turn, favors the dispersion of nano-FA in water. This results in a partially hydrophobic surface of MCA-FA. From Figure 2, it can be seen that some fraction of MCA-FA sinks in water due to the agglomeration taking place during the ball milling process, which may be due to nonuniform adsorption of surfactant molecules over individual FA particles. Behavior of a surfactant at the interface is determined by a number of forces, including electrostatic attraction, covalent bonding, hydrogen bonding, and hydrophobic bonding. 37 This interpretation is substantiated by the contact angle measurements (Figure 3(a)), where the surface tension of the fresh FA surface is greater than that of water due to which the water droplet spread rapidly and got absorbed by the pellet. In contrast, as the critical surface tension of the 60-h MCA-FA is less than that of water, the water droplet is repelled (Figure 3(b)). The contact area between the water droplet and surface is minimized in MCA-FA, which is attributed to the presence of the surfactant layer on the MCA-FA particles. 38 The surfactant-coated MCA-FA particles are hydrophobic. The surfactant coating reduces water pickup and aids in better dispersion of the MCA-FA in the PVA matrix.
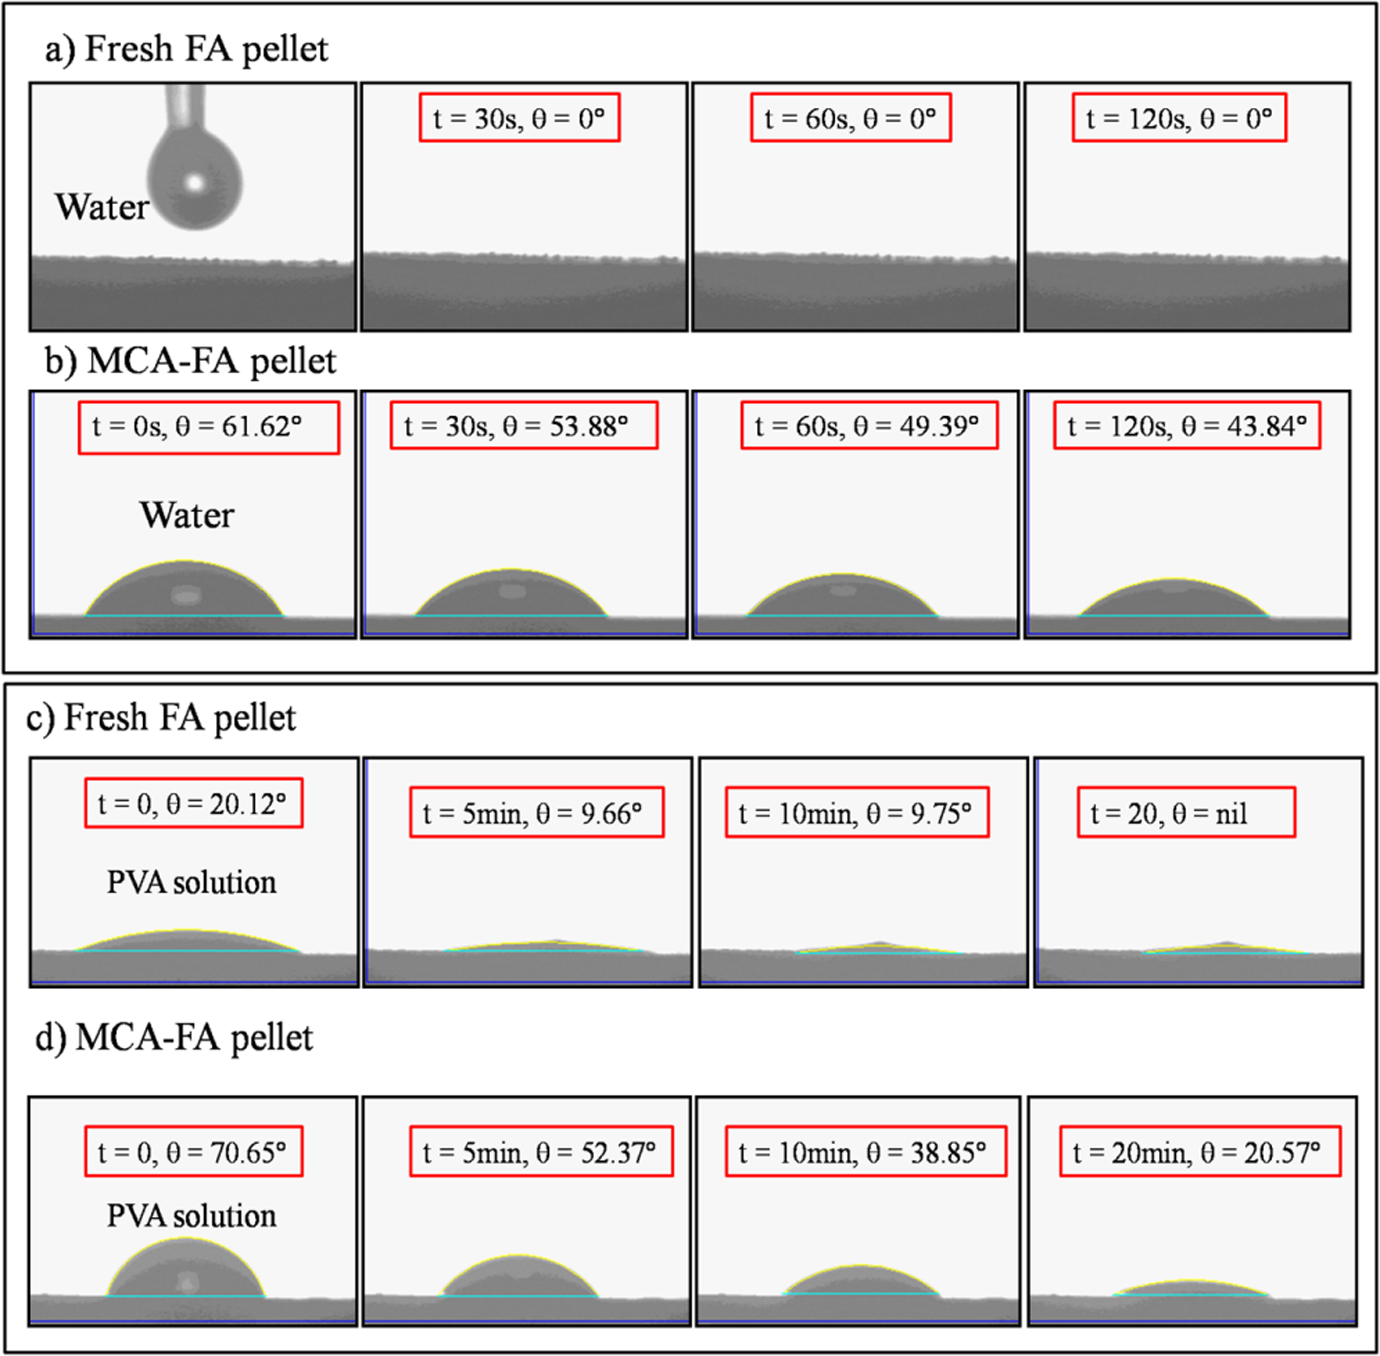
Static contact angle measurements on fresh FA and MCA-FA pellets with water and PVA solution. FA: fly ash; MCA-FA: mechanochemically activated-fly ash; PVA: poly(vinyl alcohol).
Figure 3(c) and (d) shows the contact angle measurements of PVA solution on fresh FA and MCA-FA pellets, respectively. Initially a contact angle of 20.12° was observed for the PVA droplet on the fresh surface of FA pellet, which gradually decreased to 9.75° after 10 min. But, the PVA droplet initially made a contact angle of 70.65° on the MCA-FA pellet surface, which then decreased to 20.57° after 20 min. This implies that PVA behaves similar to water, as it is a polar polymer. In addition, after modification, the filler surface became rough, which, in turn, leads to an increment in contact angle.
Particle size analysis
The effects of mechanochemical activation on the particle size of the FA samples are represented graphically in Figure 4. The figure represents the variation in particle diameter (in meter) with respect to intensity distribution. From the distribution curves obtained, values of D 10, D 50, and D 90, representing the sizes, from which 10%, 50%, and 90% (by volume% and by number %) of the particles in the sample were smaller or greater than, could be determined. D 50 represents the median of the respective distribution.
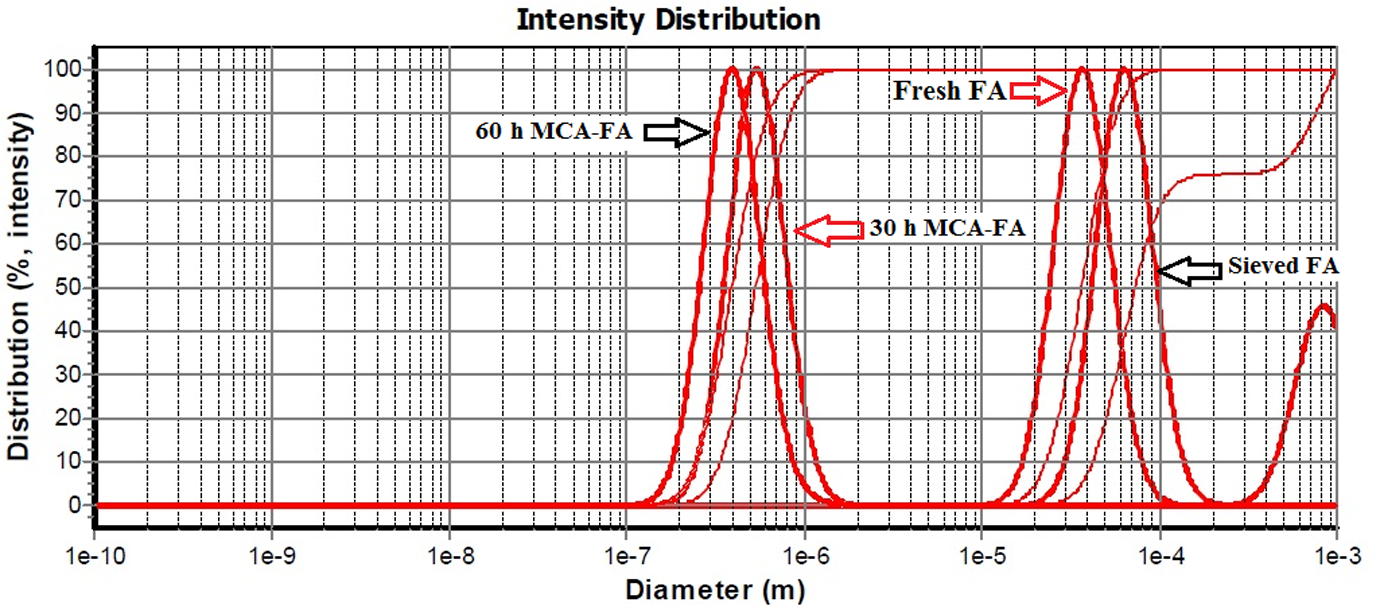
Particle size distribution of fresh FA, sieved FA and 30- and 60-h MCA-FA. FA: fly ash; MCA-FA: mechanochemically activated-fly ash.
The effect of mechanochemical activation on the particle size distributions (by volume/number) was also investigated by taking into consideration the size span of the particles, which is defined as follows
39
:
Span is a measure of the width of the size distribution, and smaller span values are obtained when narrower distributions exist.
In this study, the average particle size of fresh FA is 36.5 μm at D 50 (median size), which implies that 50% volume of the particles is less than 36.5 μm and remaining 50% is greater than 36.5 μm. Mechanochemical activation for 30 and 60 h intensified the reduction in particles size of sieved FA from 79.4 μm (D 50) to 538 nm and 392 nm, respectively. The particle sizes at D 10, D 50, and D 90 of FAs are shown in Table 2. The broad bimodal distribution of sieved FA particles changed to monomodal (Figure 4) for milled FA because of the continuous collision between grinding media and FA particles. This is more vigorous for higher milling hours, which lead to tremendous stress energy being imparted on the particles, resulting in massive strain in the particles. This trend provides evidence supporting that more plastic deformation and disordering of the FA particles occur under intensive grinding, resulting in nanoscale dimensions. 40,41 Further, the use of surfactant and toluene as process-enhancing agents in the milling clearly offers the potential for reduction in particles size.
Particle sizes at D 10, D 50, and D 90 of FA and MCA-FA.
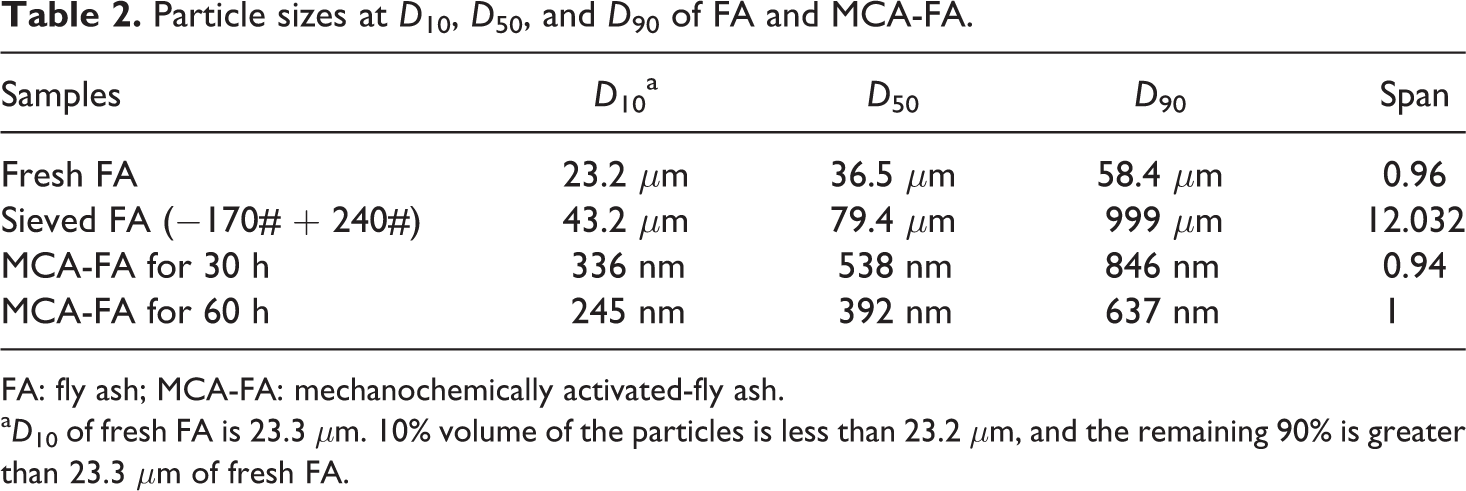
FA: fly ash; MCA-FA: mechanochemically activated-fly ash.
a D 10 of fresh FA is 23.3 μm. 10% volume of the particles is less than 23.2 μm, and the remaining 90% is greater than 23.3 μm of fresh FA.
The specific surface area has increased from 12.35 m2 g−1 for 30-h MCA-FA to 18.87 m2 g−1 for 60-h MCA-FA (specific surface area of fresh and sieved FA could not be determined due to experimental difficulties). The presence of an organic coating on the surface of MCA-FA facilitated its dispersion in the polymer matrix; the change of the particle size and surface area enhanced the mechanical property of the PVA/MCA-FA composites as discussed in the Mechanical properties section.
Characterization of the composites
Elemental mapping of filler distribution and dispersion
Figure 5 shows the silicon elemental maps and standard deviation measurement of filler distribution in the PVA/fresh FA and PVA/MCA-FA composites. The technique of grid quadrant counting was used to analyze the degree of dispersion of particles in the PVA-based composites.
42
Each EDS map was divided into nine equal regions of a sample area of 150 × 150 μm2. The number of particles in each area was analyzed using Image-J software, and the degree of inhomogeneity of the dispersion was quantified as the standard deviation (σ). The standard deviation among the number of particles per unit area was estimated by the following equation: Silicon elemental mapping and standard deviation of particle size distribution of PVA composites. PVA: poly(vinyl alcohol).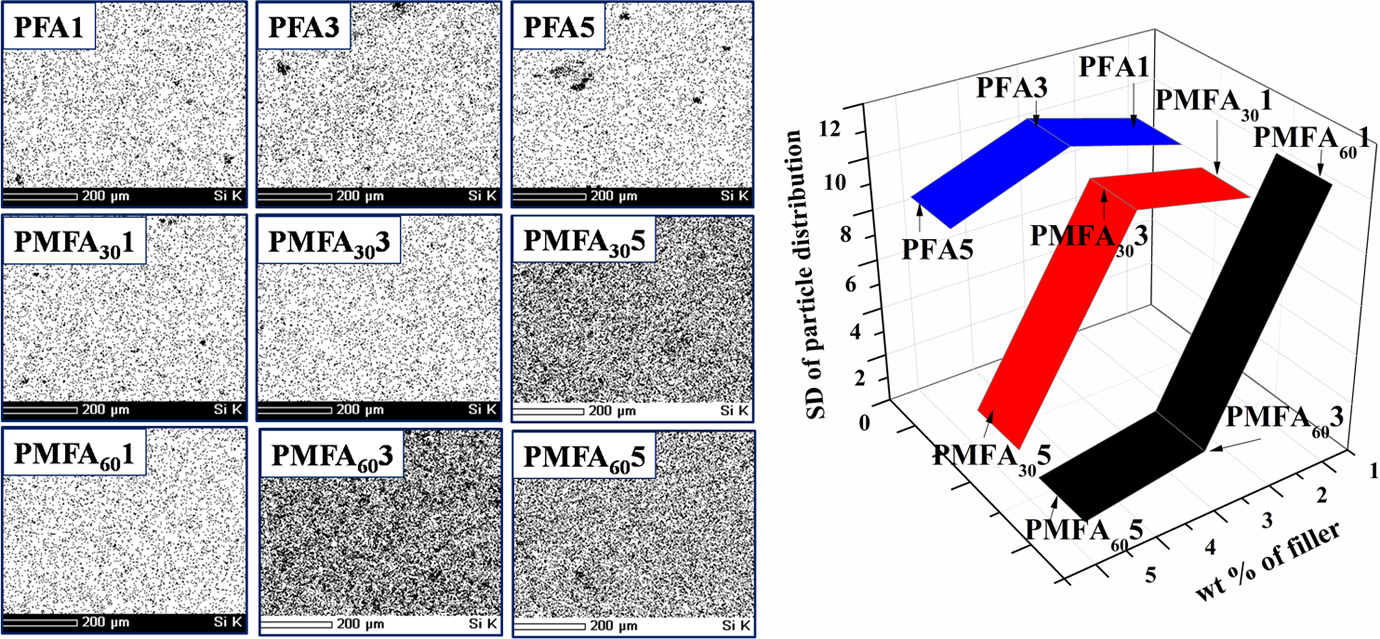
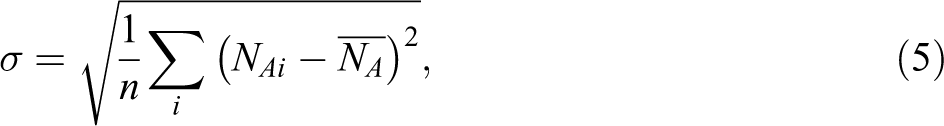
where
σ: standard deviation, a degree of inhomogeneity of the dispersion.
The maximum homogeneity is characterized by the minimum standard deviation, and the degree of homogeneity increased with a decrease in the standard deviation.
Each spot in the elemental maps represents a filler particle, and as the filler loading is increased, the number of particles is more and so is the number of agglomeration. The σ values decreased with higher filler loading, which signifies that the agglomerated particles are considered as individual particles. This super saturation of FA concentration has resulted in a decline of mechanical properties as discussed in mechanical properties section. The clustering of fillers due to particle–particle interaction, and nonuniform distribution of surfactant led to lower load transfer between matrix and filler that resulted in stress generation in the composites before failure.
FTIR spectroscopy
Figure 6 shows the FTIR spectra of neat PVA and its composites containing 5 wt% fresh FA and 30- and 60-h MCA-FA. All major peaks related to hydroxyl and acetate groups were observed. The intense peaks observed between 3550 cm−1 and 3200 cm−1 are due to O–H stretching arising from the intermolecular and intramolecular hydrogen bonds. The vibrational band observed at 2920 and 1727 cm−1 refer to the C–H stretching from alkyl groups and C=O stretching from acetate group of neat PVA, respectively. O–H bending and C–O–C stretching peaks appeared at 1423 and 1256 cm−1, respectively. 43,44
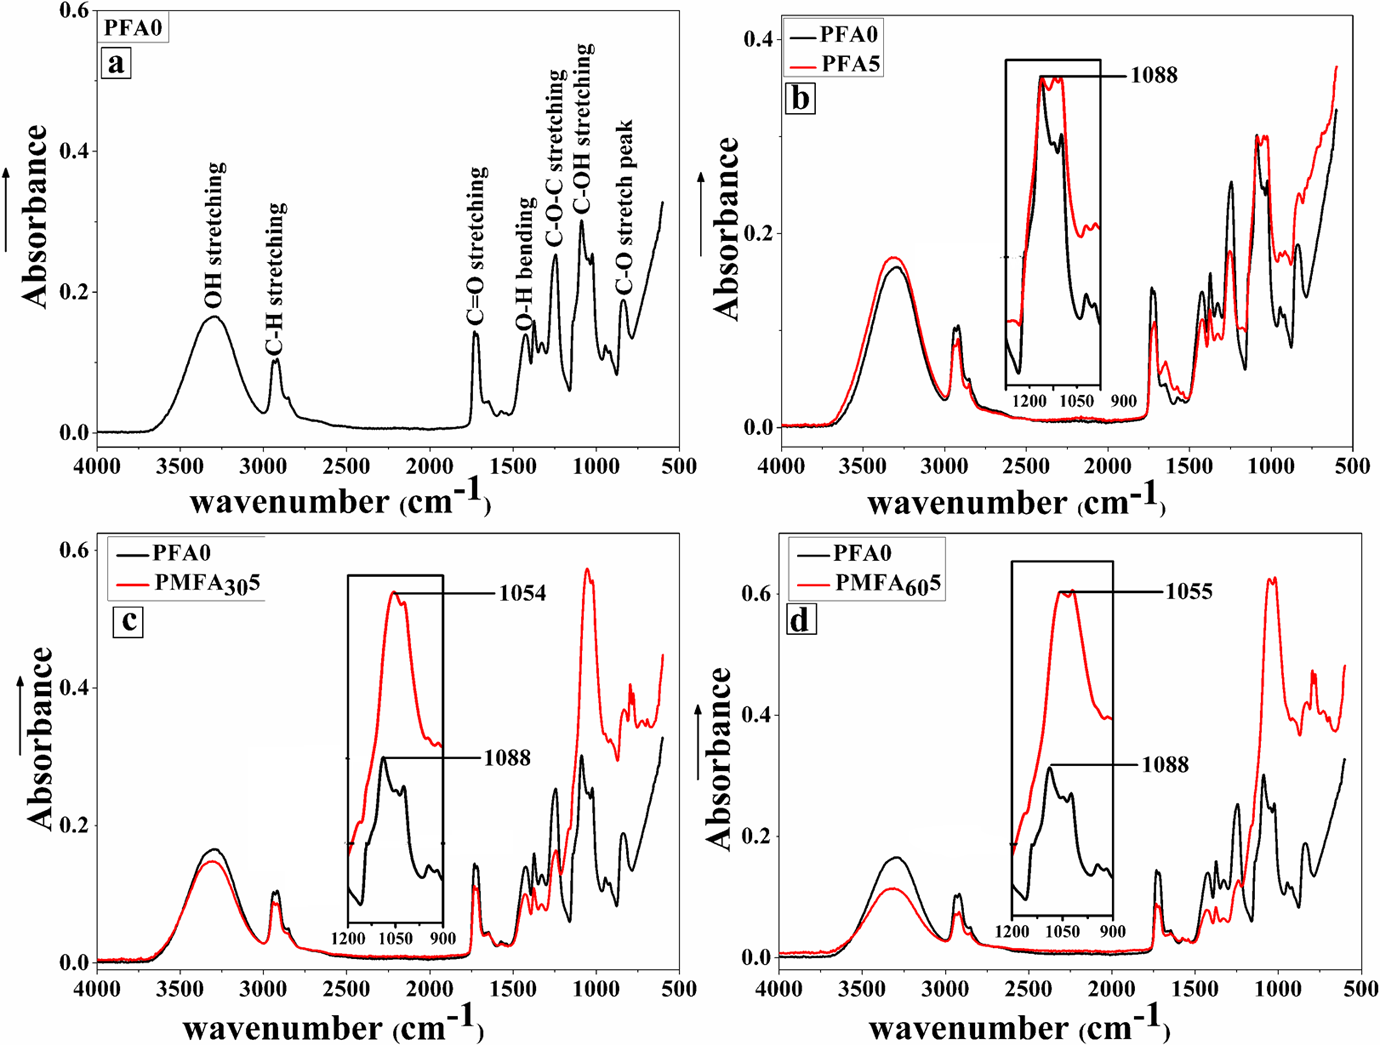
FTIR spectra of neat PVA and PVA composites with 5 wt% of fresh FA, 30- and 60-h MCA-FA. FTIR: Fourier transform infrared; MCA-FA: mechanochemically activated-fly ash; PVA: poly(vinyl alcohol).
The composites containing MCA-FA, in comparison with the neat PVA, exhibited significant peak shifts to lower wave numbers with increased intensities. The peak shift is observed at 1088 cm−1 of C–O stretch of secondary alcoholic groups C–OH stretching to 1054 cm−1 and 1055 cm−1, respectively. This attributes to the intermolecular H-bonding between the C–OH group of PVA and Si–O–Si group of MCA-FA (Figure 6(c) and (d)). 45 This is explained by a plausible mechanism shown in Figure 7. Meanwhile, the PVA/fresh FA composite did not show any such peak shift (Figure 6(b)). This indicates that the mechanochemical activation process leads to enhanced polymer–filler interaction in the PVA-based composites. The effective polymer–filler interaction combined with good dispersion and distribution of the filler is expected to help in enhancing the mechanical properties of these composites.
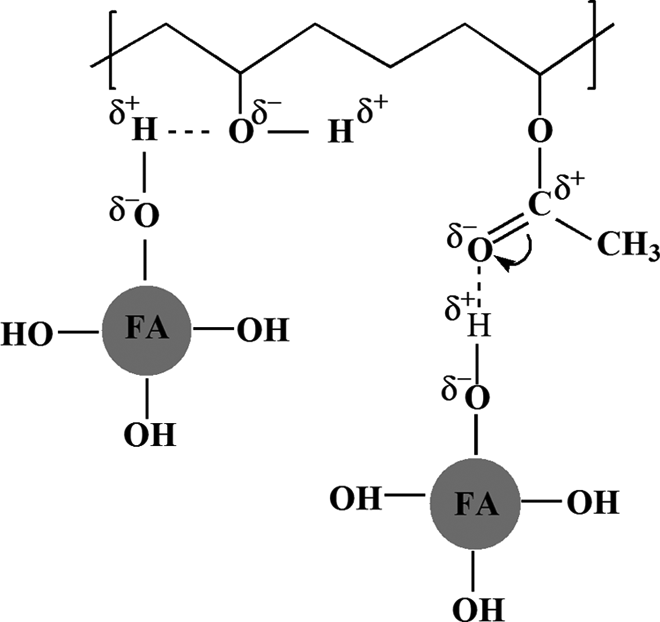
Plausible mechanism of hydrogen bonding between PVA and FA based on the FTIR results of the composite films. PVA: poly(vinyl alcohol); FA: fly ash; FTIR: Fourier transform infrared.
To quantify the interaction and compatibility between the polymer matrix and the nanofiller, Fowkes’ equation (equation 6) was employed, which relates the change in IR peak position with enthalpy of interaction between the phases in a multiphase polymer system such as a blend or composite.

where ▵H is the enthalpy of interaction between the phases in the binary polymer system, and
The ▵H values of interaction between PVA and MCA-FA in the composites containing 30- and 60-h MCA-FA were calculated to be −8 and −7.8 kcal mol−1, respectively. The change in Gibbs free energy is related to the enthalpy change as follows:
▵G value is negative, when either ▵H is negative or ▵S is positive. When ▵G value is negative, the interaction between the filler and polymer is thermodynamically favored. 46 Thus, in this study, the interaction between PVA and MCA-FA is thermodynamically favored.
Mechanical properties
The variation in tensile strength, elongation at break, and modulus at 100% elongation of PVA composites with 1, 3, and 5 wt% of fresh FA and 30- and 60-h MCA-FA are presented in Figure 8(a) to (c). The key factor for improvement in tensile properties is the good interfacial interaction between the filler and the polymer matrix, which facilitates stress transfer from matrix to reinforcement. In PVA/fresh FA composites (Figure 8(a)), the tensile strength increases initially at a filler loading of 1 wt% and then decreases at a higher filler loading. The decrease in strength at a higher filler loading is possibly due to extensive filler–filler interaction rather than the filler–polymer interaction, which attributes to the slippage of the polymer chains over the smooth surfaces of the spherical particles of fresh FA. There is a possibility of super saturation of FA concentration, which results in the reduction of intimate contact area between fresh FA and PVA. 47 A similar trend is also observed for elongation at break (Figure 8(b)), leading to transformation from ductile-to-brittle fracture of composite.
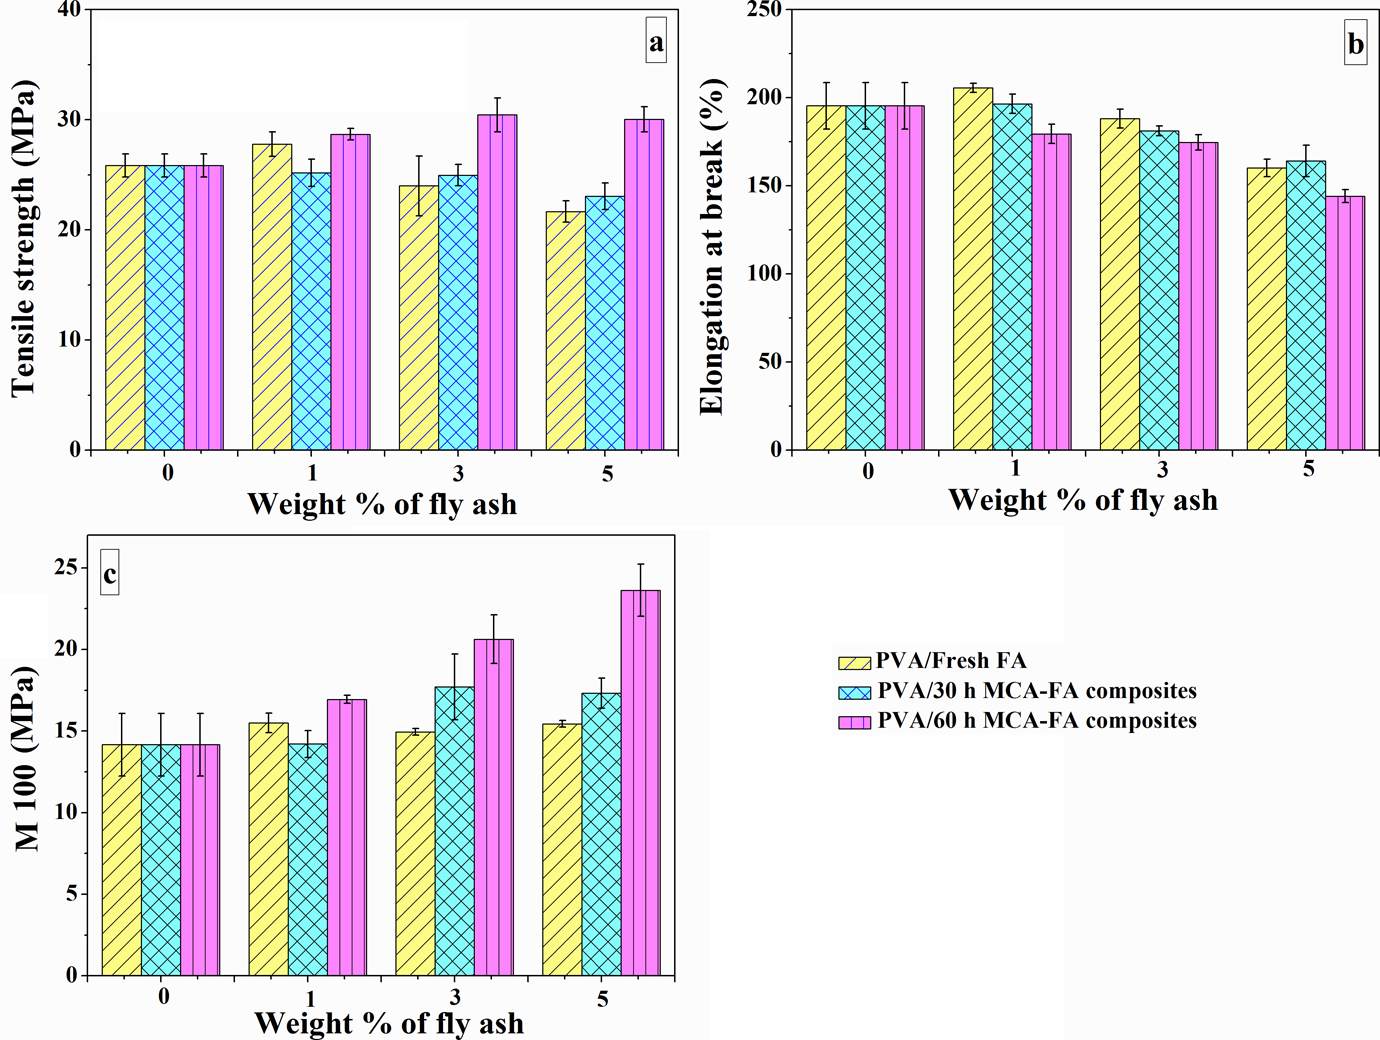
Variations in mechanical properties of PVA/fresh FA, PVA/30-h MCA-FA, and PVA/60-h MCA-FA composites as a function of weight % of filler (a) tensile strength, (b) elongation at break, and (c) modulus at 100%. PVA: poly(vinyl alcohol); FA: fly ash; MCA-FA: mechanochemically activated-fly ash.
Figure 8(a) shows a decrease in tensile strength with 30-h MCA-FA due to an uneven distribution and agglomeration of filler particles, which were inferred from the SEM elemental mapping. This effectively weakens the number of available reinforcing particles. On the other hand, tensile strength values of the composites containing 60-h MCA-FA are higher than those of the other systems. This attributes to the fact that there is good dispersion of the 60-h MCA-FA particles in the PVA matrix and the existence of efficient filler–polymer interaction as confirmed by the FTIR results. MCA-FA nanoparticles arranged on the nanometer scale with a high aspect ratio and/or an extremely large surface area into polymers matrix significantly improves their mechanical performance. 48 The stiffness of the filler contributes to the immobilization of polymer phase by molecular interaction as discussed by Kader et al. 49 This mechanism may proceed through two different pathways. In the first one, the aggregated cluster of particles breakdown in the aqueous PVA solution and the polymer chains can penetrate into the asperities on the surface of MCA-FA. In the second one, the polymer chains get entrapped into the MCA-FA wrapped with surfactant during the vigorous stirring and sonication processes.
The ongoing discussion is corroborated by the results of TEM, DLS, and elemental mapping, which reveal the presence of rough, irregular nanosized filler particles in MCA-FA that got uniformly distributed and dispersed in the PVA matrix. These factors, in turn, help in strengthening of the PVA matrix by the MCA-FA particles.
An attempt has been made to explore the relationship between strain at break and filler volume fraction in these composites using Nielsen’s equation
50
:
where ε c is strain at break of the composite, ε m is the strain at break of the polymer matrix, and V f is the volume fraction of filler.
The theoretical and experimental values of elongation at break with respect to volume fraction of the filler were compared as shown in Figure 9(a) to (c). It is observed that on reinforcing PVA with fresh FA and 30-h MCA-FA, elongation at break decreases with an increase in volume fraction of the filler (Figure 9(a) and (b)). But, there is a close match between the theoretical and experimental values of elongations at break of these composites. Interestingly, the abrupt decrease in elongation at break in the composite with 1 wt% of 60-h MCA-FA (Figure 9(c)) signifies interruption of crack propagation through the polymer matrix by the filler particles. This is due to strong polymer–filler interaction as discussed before. Nicolais and coworkers 51 indicated that some fillers might promote craze formation in polymer matrices and that, in turn, might give rise to an increase in ultimate elongation at higher filler loading, which is observed at a filler loading of 5 wt% of 60-h MCA-FA. 11
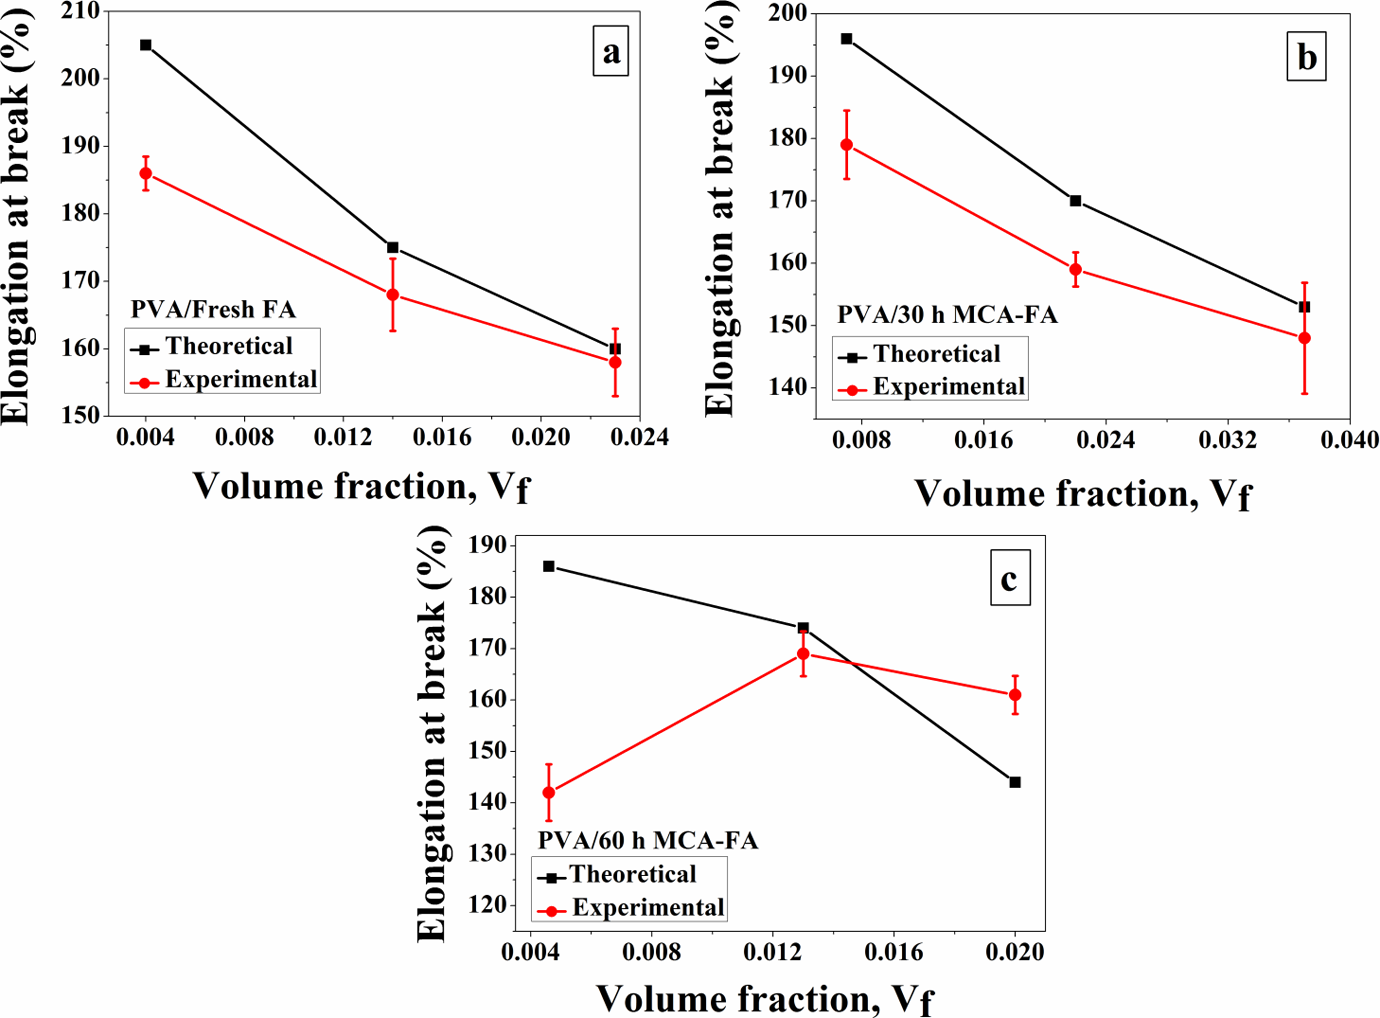
Elongation at break versus volume fraction of filler of (a) PVA/fresh FA, (b) PVA/30-h MCA-FA, and (c) PVA/60-h MCA-FA composites. PVA: poly(vinyl alcohol); FA: fly ash; MCA-FA: mechanochemically activated-fly ash.
Fractography of the composites
SEM images were analyzed to determine the nature of adhesion, failure, and the relationship between morphology and mechanical properties of the tensile-fractured surfaces of these composites. Figure 10(a) to (f) displays the SEM micrographs of the fresh FA, MCA-FA, and tensile-fractured surfaces of the PVA composites with 3 wt% of filler loading.
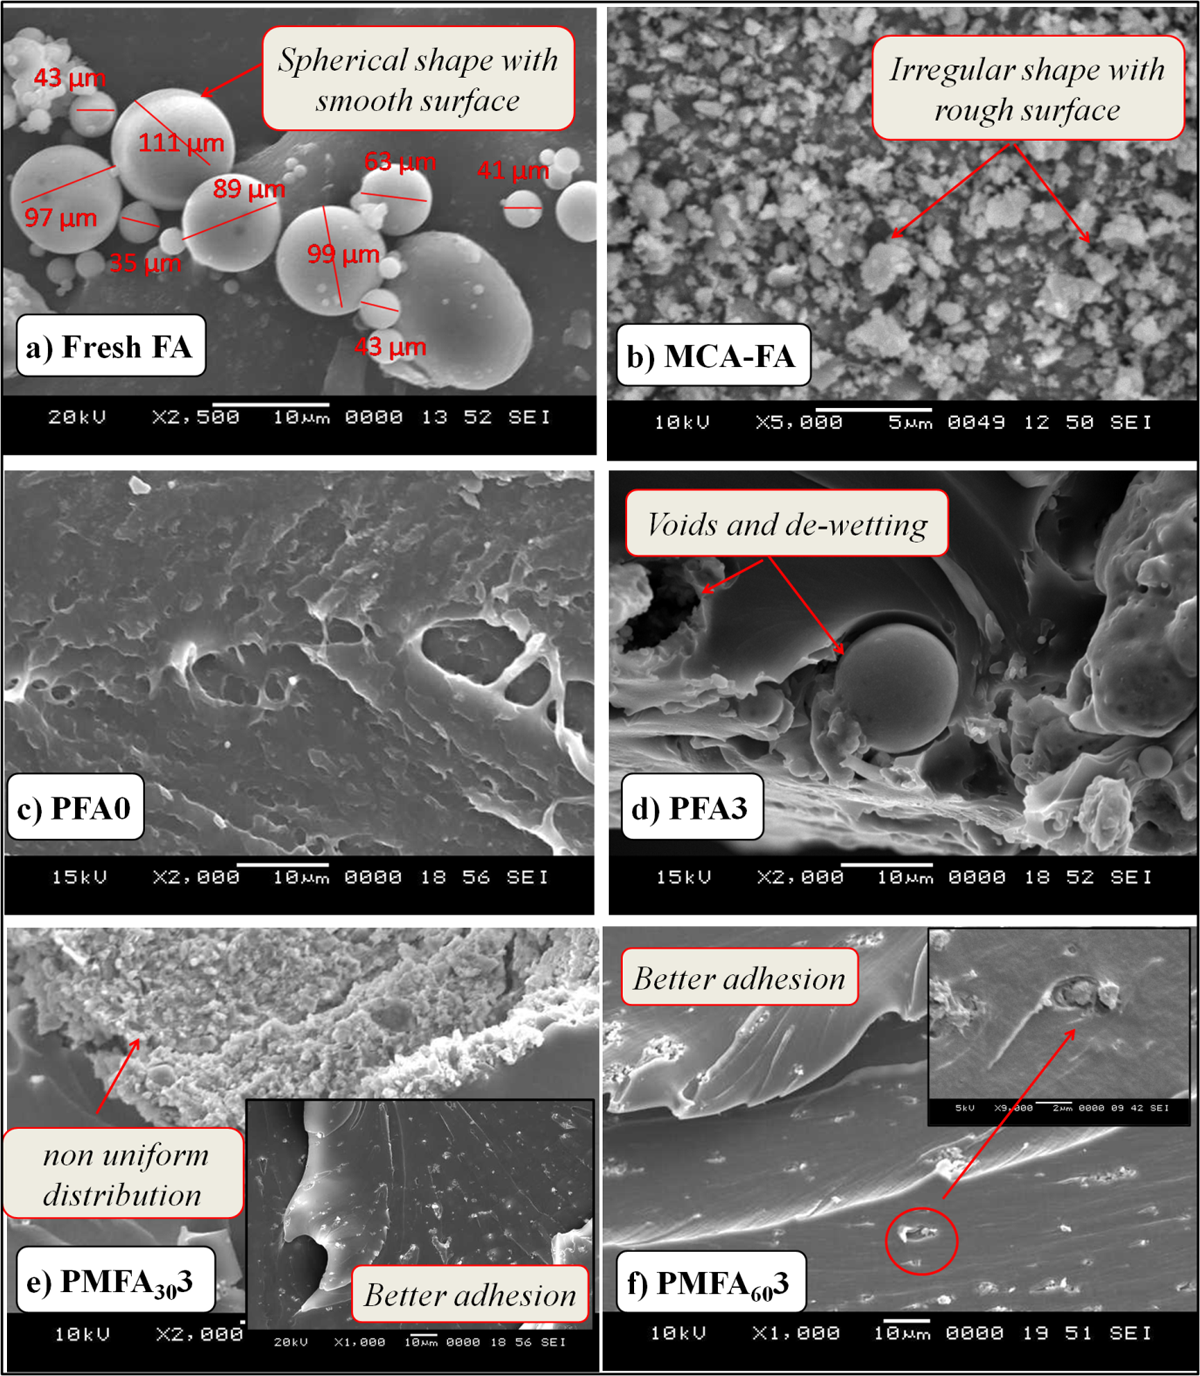
Scanning electron micrographs of fresh FA, 60-h MCA-FA, and tensile fracture surfaces of neat PVA and PVA composites with 3 wt% of fresh FA, 30-h MCA-FA, and 60-h MCA-FA. PVA: poly(vinyl alcohol); FA: fly ash; MCA-FA: mechanochemically activated-fly ash.
In Figure10(a), the particles with smooth surface and spherical shape belong to fresh FA with diameters in the range of a few tens of micrometers. On the other hand, MCA-FA particles are irregular in shape with rough surfaces, and their sizes are few hundred nanometers after ball milling for 60 h as shown in Figure 10(b).
Tensile fracture surfaces of neat PVA showed the presence of two distinct regions, initial region with a very smooth and flat surface and other region with surface roughness and presence of conical marks due to less crystal flows of semi-crystalline PVA (Figure 10(c)).
Figure 10(d) illustrates the fractured surface of the PVA/fresh FA composites showing brittle failure and poor filler–matrix adhesion. The presence of the interfacial voids and debonding at the interface occurred probably due to the selective chemical reaction of –CHO groups of glutaraldehyde and –OH groups of PVA in the formation of acetal ring and ether linkage. The bulky acetal rings might occupy considerable space that retards the intimate contact of PVA chains and FA particles. 52 In addition, it was observed that many of the randomly oriented FA particles subjected to tensile stress are acting perpendicular to the plane; therefore, the crack propagation occurs parallel to the plane. 10,53
Conversely, the morphologies of the PVA composites reinforced with 3 wt% of 30- and 60-h MCA-FA (Figure 10(e) and (f)) displayed better polymer–filler adhesion. The superior performance of PVA/MCA-FA composites in mechanical testing attributes to the uniform distribution and efficient packing of MCA-FA. This attributes to the wrapping of surfactant on MCA-FA particles and filler size in nanoscales, which makes the surface highly accessible to the PVA chains (Figure 11).
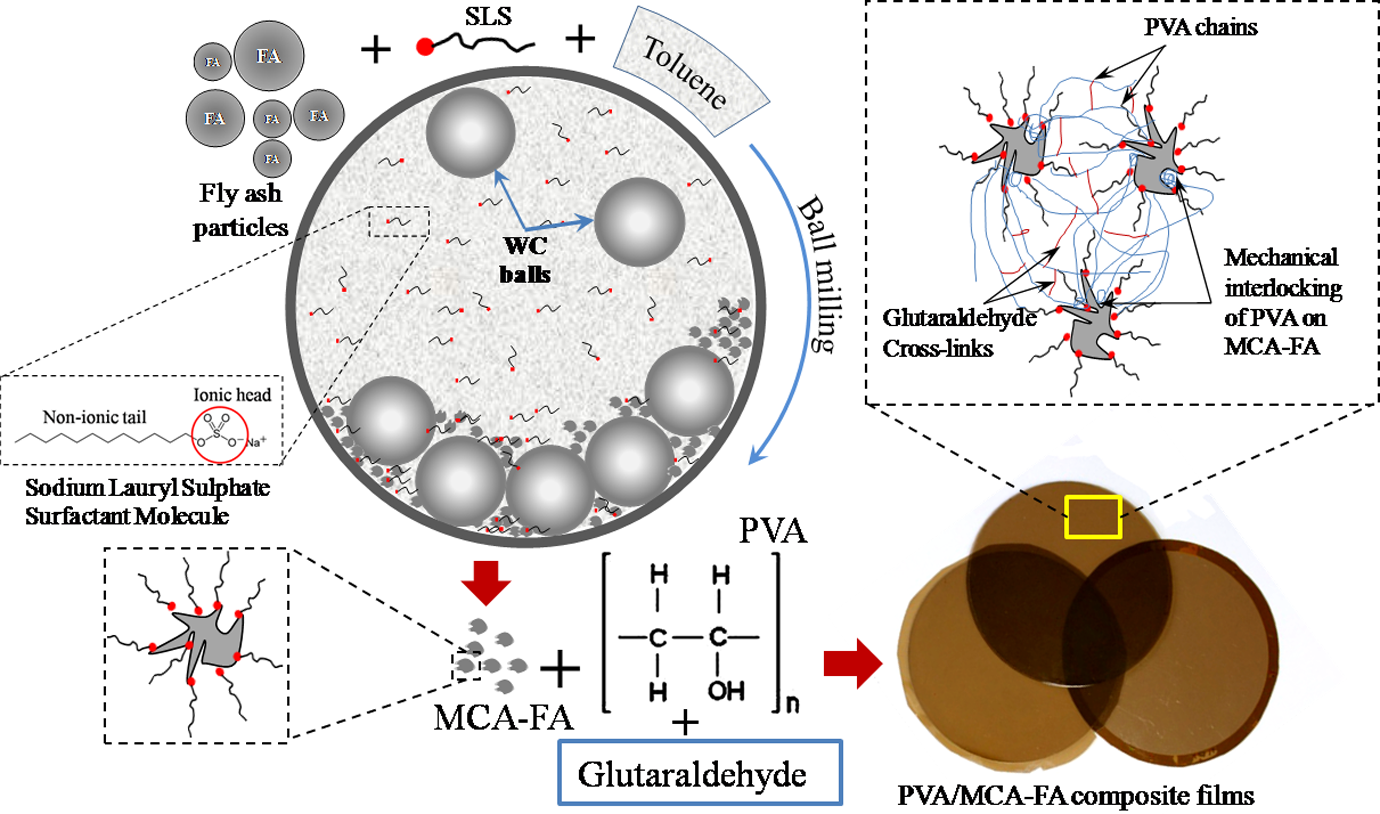
Preparation of PVA composites reinforced with MCA-FA. PVA: poly(vinyl alcohol); MCA-FA: mechanochemically activated-fly ash.
XRD results
The XRD patterns of neat PVA, PVA/fresh FA, and PVA/MCA-FA composites with the loading of 1, 3, and 5 wt% of filler are shown in Figure 12(a) to (c). The appearance of a sharp reflection at 2θ angle of 19.5° and a diffuse scattering between 15° and 25° is observed for a neat PVA film, which, respectively, is the characteristic of crystalline and amorphous phases of conventional semicrystalline polymers. The crystallinity index depends on the synthetic process and the physical aging of polymers. 54,55
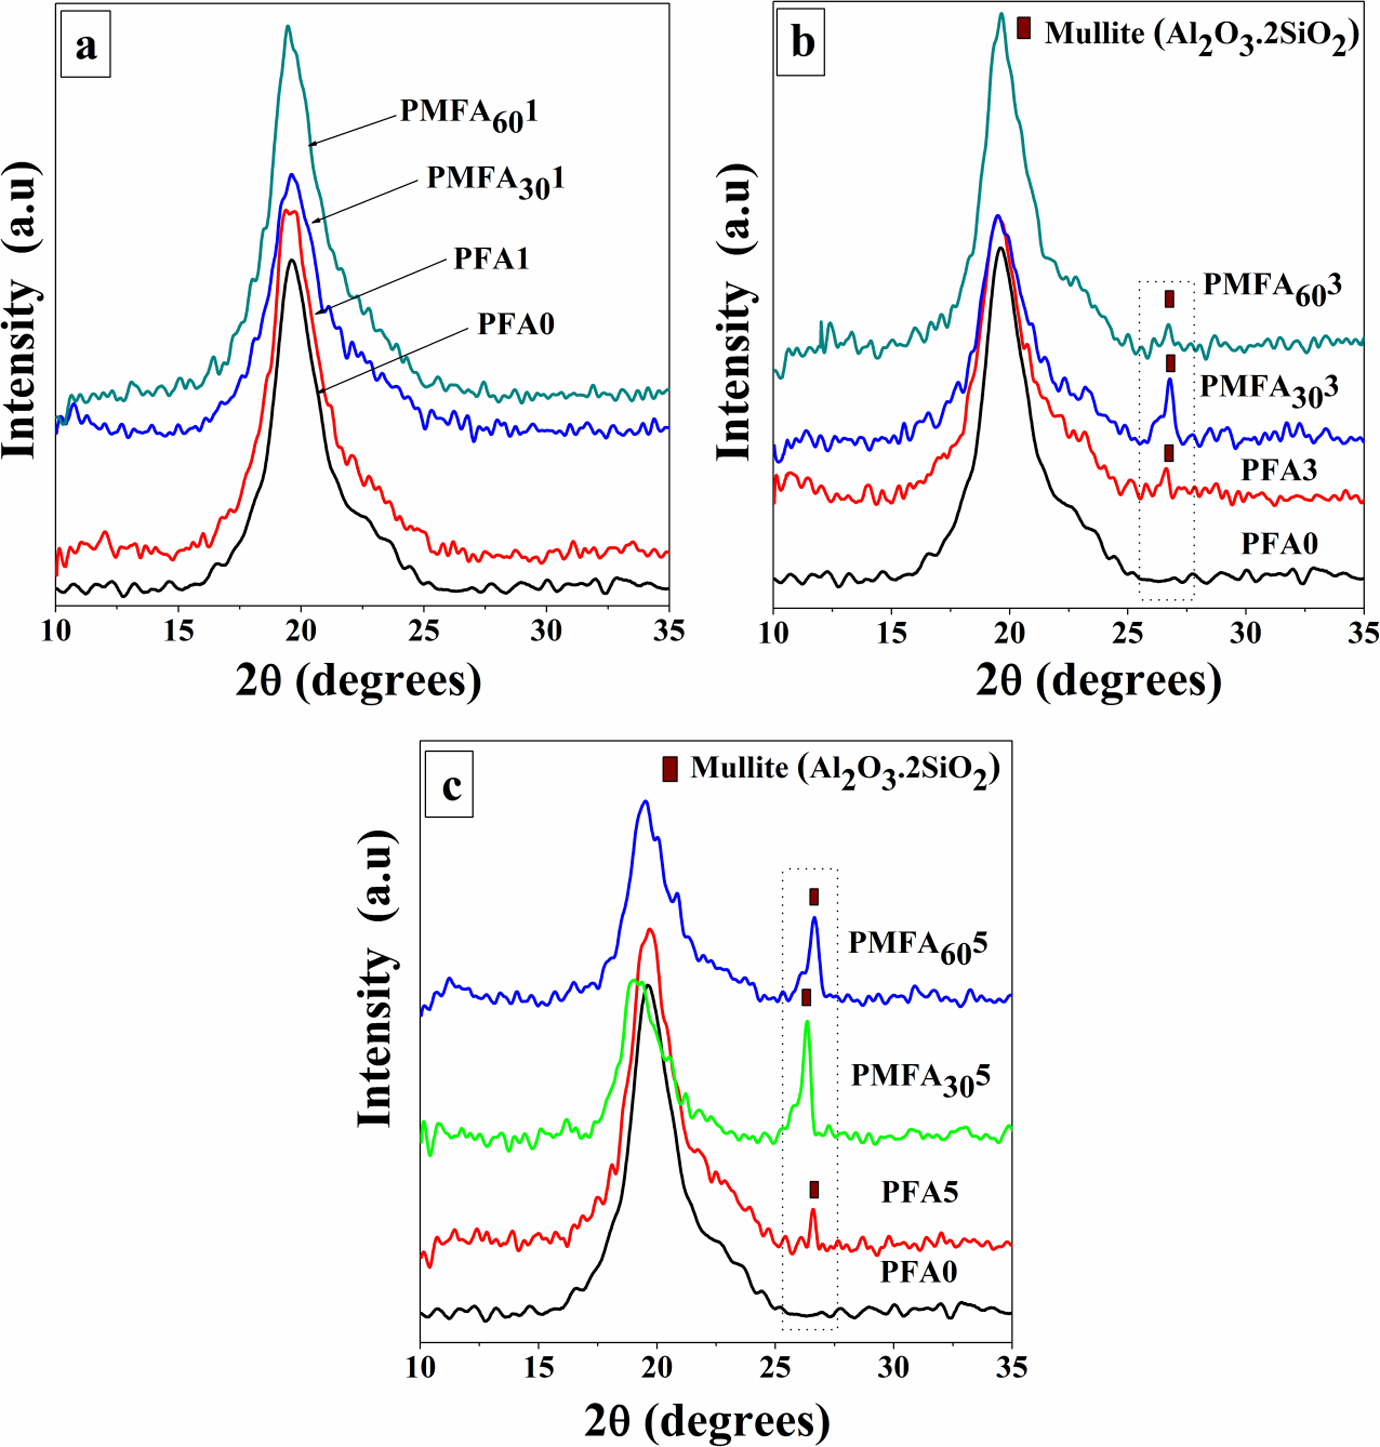
XRD patterns of neat PVA and PVA composites with (a) 1% w/w, (b) 3% w/w, and (c) 5% w/w of fresh FA and 30-h and 60-h MCA-FA. XRD: X-ray diffraction; PVA: poly(vinyl alcohol); MCA-FA: mechanochemically activated-fly ash.
The XRD patterns of the composites with filler loading of 3 and 5 wt% of fresh FA, 30- and 60-h MCA-FA exhibit prominent crystalline peaks at 2θ angle of 26.5° with the d spacing of 3.4 Å (Figure 12(b) and (c)). This peak corresponds to the mullite phase of FA (3Al2O3·2SiO2) as reported by the software X’Pert High Score Plus (ref code: 00-002-0428) having an orthorhombic crystal system with a = 7.52 Å, b = 7.65 Å, and c = 2.89 Å. At 1 wt% of filler loading, there is no significant crystalline peak showing the presence of FA (Figure 12(a)), which may be due to the lower concentration of filler. More specifically, the absence of peak might be misinterpreted. There are many factors, such as concentration and order of the filler, which can influence the XRD patterns. For example, samples where the filler is not uniformly distributed will fail to produce a Bragg diffraction peak.
The incorporation of the fresh FA and 30- and 60-h MCA-FA influenced the crystallite size of PVA as shown in Table 3. There is only a marginal change in crystallite size; this is probably due to the nucleating effect of MCA-FA.
Crystallite size of PVA composites from XRD analysis.
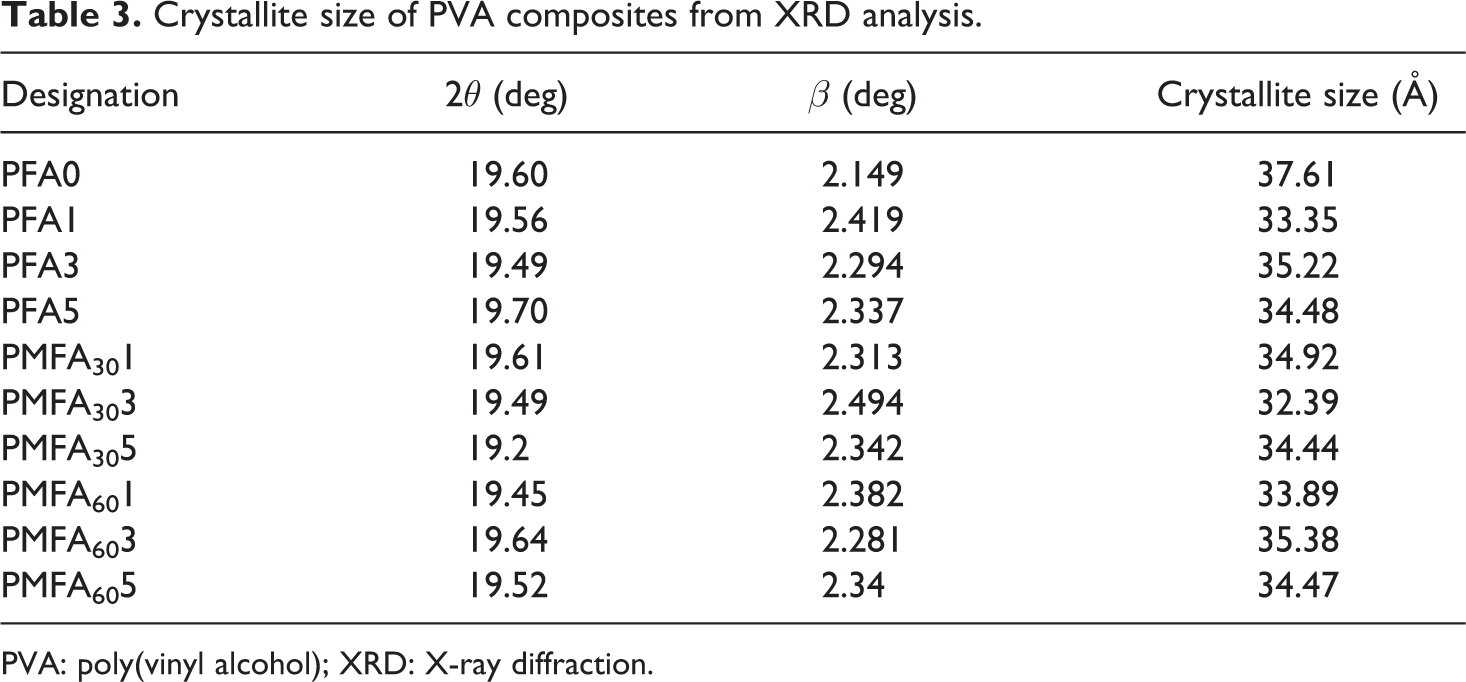
PVA: poly(vinyl alcohol); XRD: X-ray diffraction.
DSC results
Figure 13(a)–(c) shows the DSC traces of neat PVA and its composites reinforced with 1, 3, and 5 wt% of fresh FA, 30- and 60-h MCA-FA. The DSC results (Figure 13(a) to (c)) refer to the second heating cycles of the samples, as the first heating was done to eliminate the thermal history of the samples. PVA is a semicrystalline polymer exhibiting both a glass transition temperature (T g; characteristic of amorphous phase) and a melting endotherm (T m; characteristic of crystalline phase) due to high physical interchain and intrachain interactions of hydroxyl groups by hydrogen bonds. 56,57 The discontinuity at 5–10°C is due to the glass transition of PVA, and the sharp endothermic peak in the range of 170–200°C is attributed to the melting of the crystallites of PVA. 35,58 The values of melting temperature, heat of fusion, and degree of crystallinity (X c%) of the composite samples are summarized in Table 4.
▵H f and X c values and degree of crystallinity of the composites from DSC analysis.
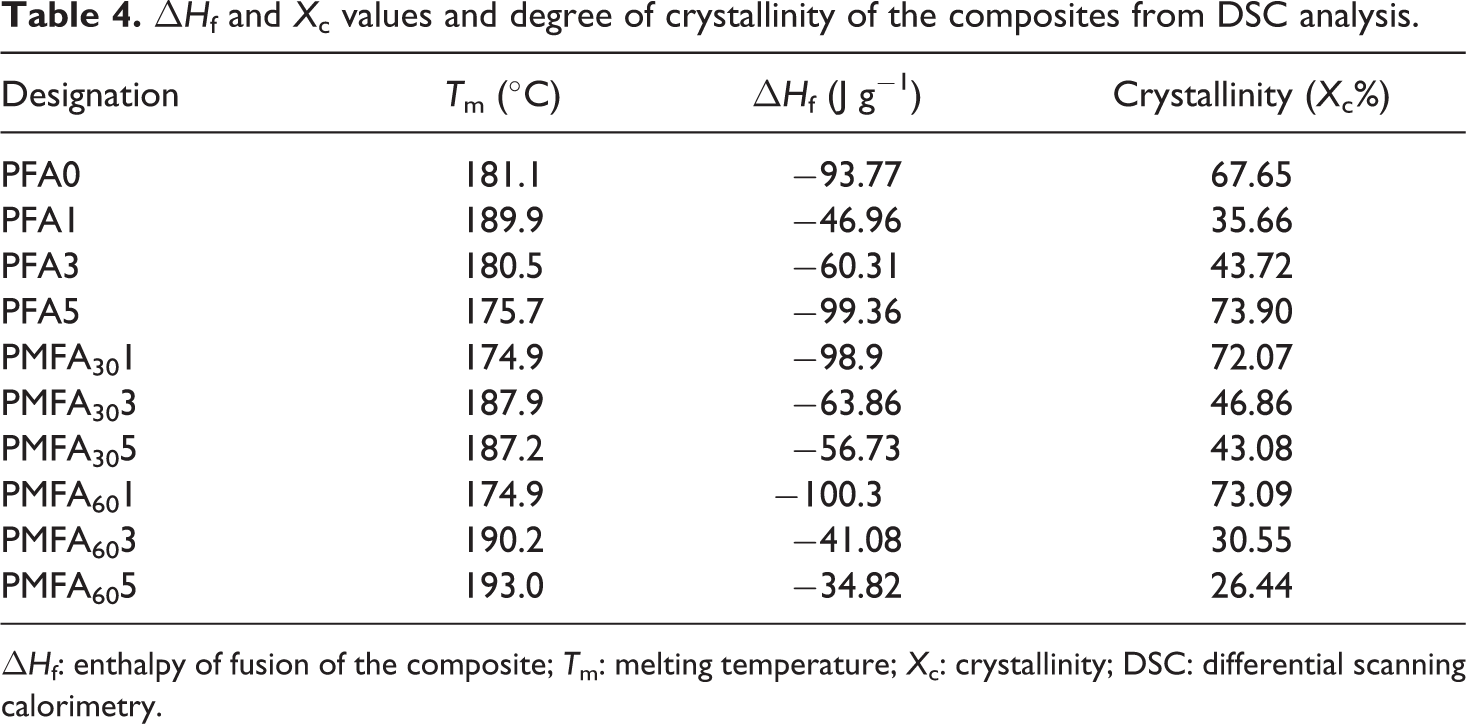
▵H f: enthalpy of fusion of the composite; T m: melting temperature; X c: crystallinity; DSC: differential scanning calorimetry.
The nominal value of crystallinity, obtained from the DSC curve of pure PVA, is about 67%. The crystallization peak of PVA shifts to a higher temperature and X c% decreases at a filler content of 1 and 3 wt % of fresh FA. The crystallinity slightly increases at a fresh FA loading of 5 wt%. At a lower filler content (1 wt%) of 30-h MCA-FA and 60-h MCA-FA, the melting point is less than that of pure PVA. But, X c% value is more. This could be due to the nucleating effect of the MCA-FA, which induces the formation of a large number of crystallites that have a broad size distribution. 15,59
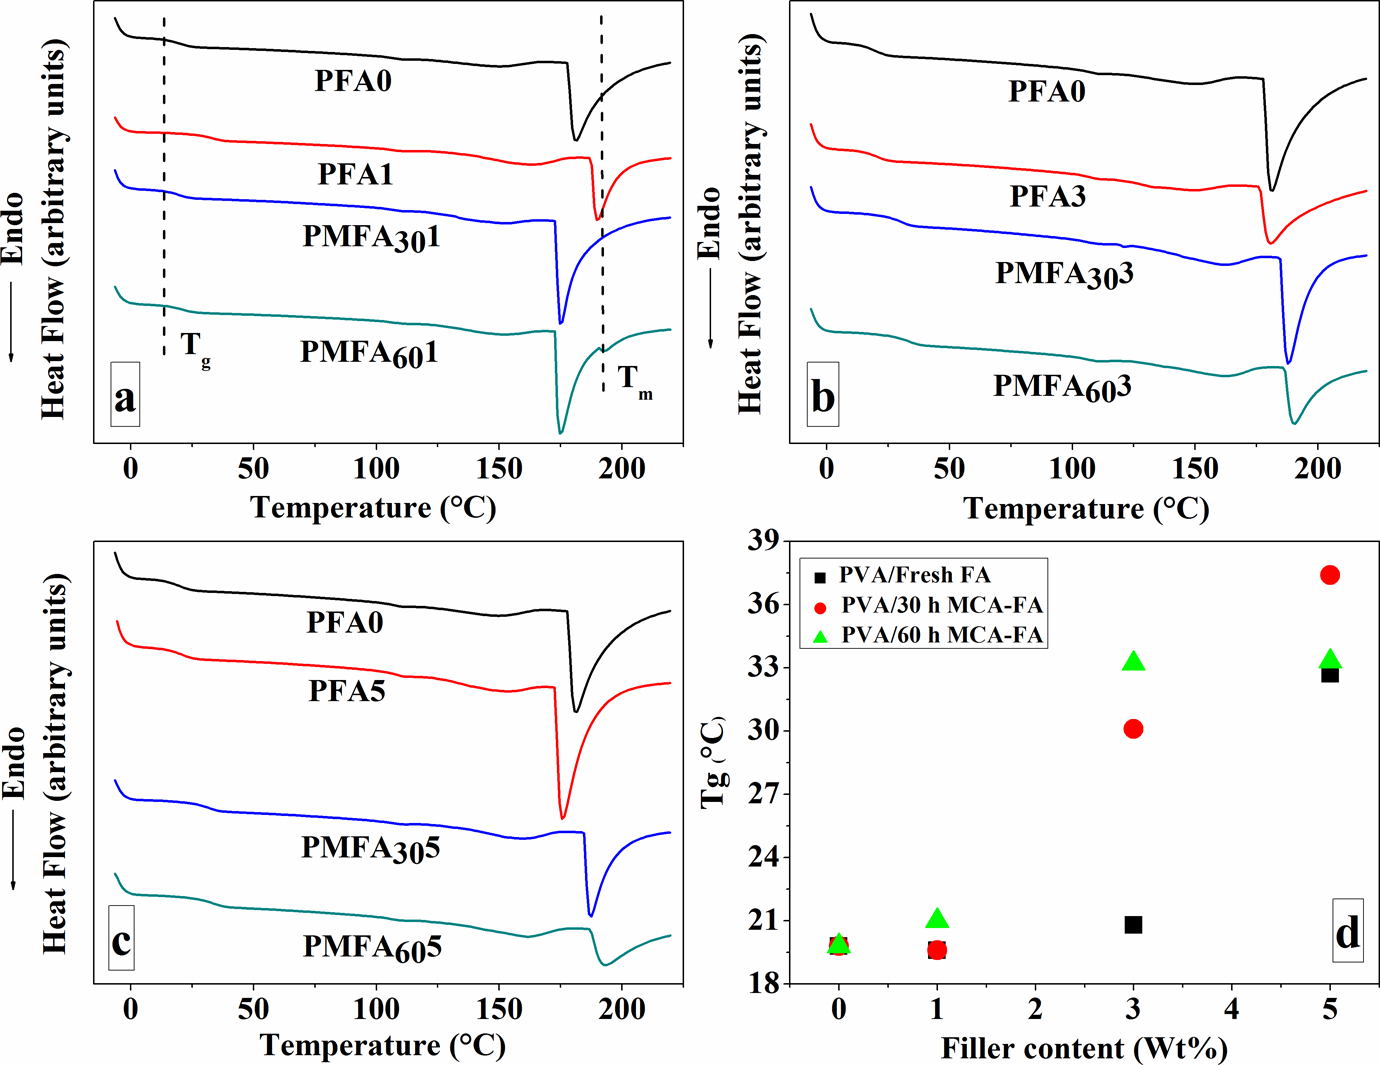
DSC traces of neat PVA and PVA composites with (a) 1 wt%, (b) 3 wt%, (c) 5 wt% of fresh FA and 30- and 60-h MCA-FA, and (d) T g values of PVA composites as a function of their filler content. DSC: differential scanning calorimetry; PVA: poly(vinyl alcohol); FA: fly ash; MCA-FA: mechanochemically activated-fly ash; T g: glass transition temperature.
The incorporation of a higher amount of filler increases the Tg values of these composites (Figure 13(d)). This phenomenon attributes to the reduced mobility of the polymer chains by the presence of the filler. It should be emphasized that the filler geometry could play a critical role in affecting the T g. The polymer chains could adsorb onto or entangle with the spherical particles of fresh FA, as the diameters of the filler particles are comparable with the radii of gyration of the polymer chains. This may lead to a decreased packing density of the polymer chains. The restricted mobility originated from the denser chain packing results in higher T g values for composites containing irregular-shaped MCA-FA particles. The MCA-FA affects the distribution of polymer chain segments, considerably higher than the typical radii of gyration of polymer chains. As a consequence, the polymer chains could wrap the MCA-FA in three dimensions, and there was no free volume and voids for the chain segments. 16,60 The maximum increase in the glass transition temperature of the PVA matrix was approximately equal to 18°C when 5 wt% of the nanostructured FA was used as the reinforcement.
Conclusions
There is growing trend toward the development of competent composites with low environmental impact and good commercial viability. The results of this investigation indicated that the particle–particle interaction forces in MCA-FA are reduced, which plays a significant role in enhancement of filler dispersion in the present composite systems. The mechanochemical activation considerably reduced the size of a single particle to a few hundred nanometers with a rough surface and an irregular shape. The average particle size of fresh FA is 36.5 μm, which got reduced to 538 nm and 392 nm after 30 and 60 h of mechanochemical activation, respectively. The specific surface area value increased from 12.35 m2 g−1 for 30-h MCA-FA to 18.87 m2 g−1 for 60-h MCA-FA. The polymer–filler interaction in these composites is thermodynamically favored as revealed by the FTIR spectroscopy. The effective polymer–filler interaction combined with good dispersion and distribution of the filler helped in enhancing the mechanical properties of these composites. The nanostructured FA acts as a nucleating agent for PVA at small loading. The maximum increase in the T g of the PVA matrix was about 18°C when 5 wt% of the nanostructured FA was used as reinforcement. Overall, this study proves that mechanochemically activated FA could be used as value-added filler for biodegradable PVA.
Footnotes
Acknowledgments
Prof K Narayan Prabhu and Ms. Mrunali Sona, Department of Metallurgical and Materials Engineering, are acknowledged for their assistance in contact angle measurements.
Declaration of Conflicting Interests
The author(s) declared no potential conflicts of interest with respect to the research, authorship, and/or publication of this article.
Funding
The author(s) disclosed receipt of the following financial support for the research, authorship, and/or publication of this article: This work was funded by Science and Engineering Research Board, Department of Science and Technology, Government of India through project no. SF/FTP/ETA-132/2010, dated 14 March 2012.