
Abstract
The aim of this study was to investigate the effects of foaming on the electrical properties of carbon nanotube (CNT)-reinforced polystyrene (PS). A pseudo-three-dimensional (3D) model based on random walk simulation was developed for predicting the electrical properties of CNT nanocomposites. The electromagnetic interference shielding effectiveness (EMI SE) of foamed PS/CNT composites was also studied through a network analyzer, measuring the EMI SE of specimens through reflection and absorption mechanisms. Six types of nanocomposites, including foamed and nonfoamed PS/CNT composites with a CNT loading of 2.1 vol% and different void contents, were manufactured using compression molding and leaching techniques. To realize the effects of foaming on the electrical conductivity of PS/CNT composites, electrochemical impedance spectroscopy analyses were carried out and compared with the pseudo-3D model. We also found that foaming via the leaching method improved the EMI shielding properties of the composites up to 24%.
Introduction
There is a growing demand for electrically conductive polymeric composites in electronic devices. Compared with metallic materials, polymer-based composites offer corrosion preventability, lightness, cost-effectiveness, and easy shaping. 1 To achieve high electrical conductivity in polymer composites, different kinds of additives such as metal fillers, carbon black, graphite, and carbon fibers have been used. 2,3
Due to their high aspect ratio, low density, and outstanding electrical, thermal, and mechanical properties, carbon nanotubes (CNTs) have recently been established as an effective and desirable additive; and, there has been growth in the incorporation of CNTs into thermoplastics. 4 The influence of CNTs on the electrical conductivity of polymers is significant, particularly when compared with conventional additives. 5,6 To attain high electrical conductivity, uniform dispersion of CNTs in a polymeric matrix is critical. 7
Two mechanisms are responsible for generating the conductive paths through a CNT-reinforced polymer: CNT-to-CNT junctions 8 and the tunneling of electrons between two neighboring CNTs through polymer gaps smaller than 1.8 nm. 9,10 An important criterion in these established conduction mechanisms is the critical filler concentration, called the percolation threshold, at which a stable electrically conductive network is formed. 11 The electrical conductivity of composites with spherical and high aspect ratio fillers have been established with models developed by Kirkpatrick 12 and Celzard et al., 13 respectively.
Another method for simulating CNT networks is developing pseudo three-dimensional (3D) models. These pseudo-3D models represent thin layers of nanocomposites and were developed using Monte Carlo simulations by Behnam et al. 14 Random networks of rod-shaped additives within an insulating matrix have been mimicked by 3D simulations. 15,16 The effects of CNTs’ orientation on the electrical conductivity of nanocomposites were investigated by Bao et al. in a 3D model. 17
The use of CNTs for fabricating electrically conductive polymers has led to extensive attempts to apply polymeric nanocomposites in electromagnetic interference (EMI) shielding applications. 18 Shielding of EMI refers to an enclosure that confines an electronic product and acts as a barrier for unwanted electromagnetic radiations. 19,20 It has been reported that by increasing electrical conductivity, the EMI shielding effectiveness (SE) of materials increases. 2,21 Multilayered conductive polymeric composites have also been used to enhance EMI SE by increasing the multiple reflections at the internal interfaces. 22,23 Zhang et al. 24 stated that internal multiple reflections are due to the scattering influence of the material’s internal inhomogeneity.
Being lightweight is another essential requirement for a practical and effective EMI shielding material. 2 There are some established methods for decreasing the density of polymeric composites, such as foaming via chemical or physical agents, which also leads to high mechanical energy absorption, and is relatively low cost, while maintaining modest mechanical performance. 25 Motlagh et al. 26 reported that foaming of carbon fiber-loaded polymers using a chemical blowing agent leads to enhanced electrical conductivity, due to increases in fiber orientation. Very recently, Ameli et al. 27 foamed polypropylene/carbon fiber composites using nitrogen gas as a physical blowing agent and reported that this type of foaming was also able to improve the electrical conductivity and EMI SE of polymer composites. In foamed composites, voids can be effective in enhancing the EMI shielding capabilities of polymer composites as the internal reflections of electromagnetic waves are increased. 28 The reflection of electromagnetic waves is related to the impedance mismatch between air and the composite. 29 Molenberg et al. 30 utilized foamed CNT/polymer composites for EMI shielding applications. They showed that foaming of CNT-loaded polymers resulted in the manufacture of shielding materials with a relatively high SE. In other research works, foamed polystyrene (PS) composites with carbon nanofibers and CNTs were used for shielding applications; and, it was shown that these nanocomposites achieved a high SE through foaming. 2 Although foamed CNT/polymer nanocomposites show good potential for EMI shielding applications, a survey of the literature found that very few research works have been conducted using these nanocomposites for EMI shielding applications.
In addition to other conventional foaming techniques, such as using chemical and physical agents, the salt leaching method is used for microporous foaming. 31,32 In this method, soluble fine particles, such as sodium chloride (NaCl) crystals, are mixed with the molten composite. After molding, the material is soaked in a solvent (e.g. water) to dissolve the soluble particles, allowing the desired inner voids to appear.
The main objective of this study is to evaluate the effects of foaming on electrical properties of CNT-based nanocomposites. A pseudo-3D computational model based on the moving random walkers within the CNT network was used to investigate the electrical behavior of composites with different void percentages. For incorporating the effects of voids on the electrical behavior of a representative volume element (RVE), some hollow circular voids were added to the subjected RVE. It was thought that the addition of these voids may lead to the reduction of the number of CNTs, which may result in a decrease in electrical conductivity. Different volume percentages of voids were created within the specimens through the leaching method. It was assumed that the presence of hollow structures inside the specimens may lead to internal reflection of electromagnetic waves and improvement of the EMI SE. Another advantage of the internal voids in the foamed specimens is their lower weight compared with the nonfoamed PS/CNT specimens.
Modeling
A computational pseudo-3D model for measuring the equivalent electrical resistance of CNT networks based on random walk on finite networks was developed. A random walker in this method is simulated by a particle in an electrical network by others. 33,34 In the presented model, particles are imported a complex circuit from the highest potential nodes called sources. Such particles move through the network to the lowest potential nodes called sinks or drains (Figure 1). The pathway chosen by the particles depends upon the probability of each possible path connected from one node to another. The model counts the number of particles and calculates iteratively the corresponding current and voltage of each node. The total electrical current passing and resistivity through the CNT network are then computed.
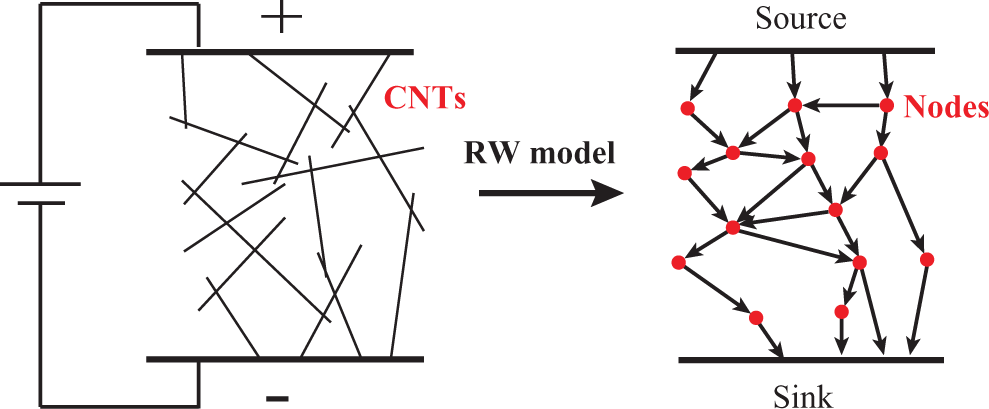
Schematic representation of using the random walk model for measuring the resistivity of CNT networks. CNT: carbon nanotube.
In CNT-based nanocomposites, each CNT can have a connection with a neighboring CNT by either direct contact or electron tunneling. The electron tunneling effect is possible if the insulating layer of the polymer is sufficiently thin; however, the resistance offered is certainly higher than direct contact connections. 35 In the presented model, the conduction of particles through direct contact and tunneling is taken into consideration.
Using the random walk simulation with different volume percentages of CNTs, the volume resistivity considering RVE’s geometry is measured in 1000 random walkers. A comparative graph, including random walk model results and other published models and experimental results, is shown in Figure 2.
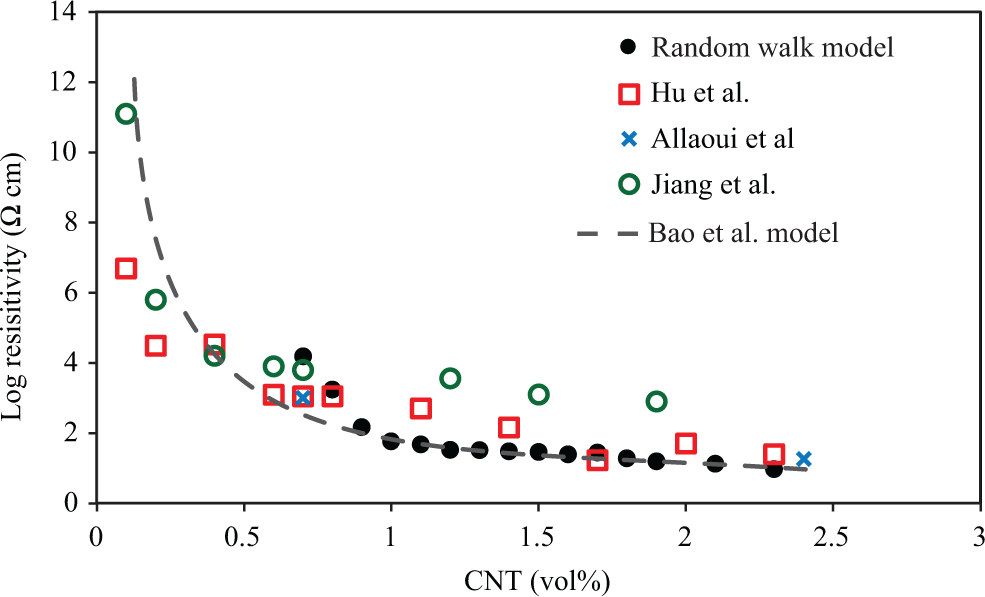
Volume resistivity of nanocomposites versus CNT (vol%). CNT: carbon nanotube.
It can be interpreted from Figure 2 that the results of the random walk model are very similar to those presented by Bao et al. 17 The current model is also shown to be in agreement with other experimental results. 36 –38 However, as can be seen in Figure 2, the presented model is unable to calculate the electrical resistivity of RVE prior to reaching the percolation threshold. The variations observed may be attributed to the higher number of contact connections among CNTs in the current model and the dissimilarity of the intrinsic conductivity value of CNTs. To mimic the effects of internal foam structure on the electrical resistivity of nanocomposites, internal voids associated with the different specimens are added to the RVEs and their electrical conductivity is calculated. The performed stages for this task are described.
In this model, the first step is the generation of a random distribution of CNT lengths, considering the volume percentage and mean length (1 µm) of the nanotubes, as derived in equation (1) and is as shown in Figure 3.
39
Differences in the lengths of CNTs, which have straight stick shapes, are due to nanotube breakage during the manufacturing of the nanocomposites.
40

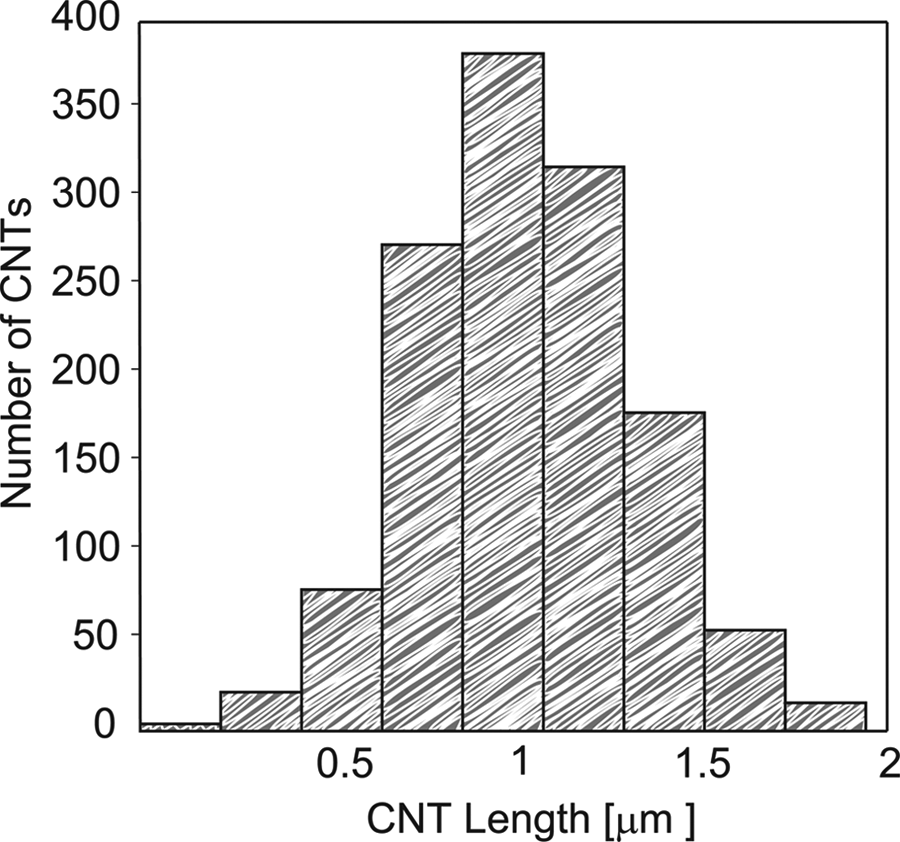
A histogram of 1340 randomly generated CNTs. CNTs: carbon nanotubes.
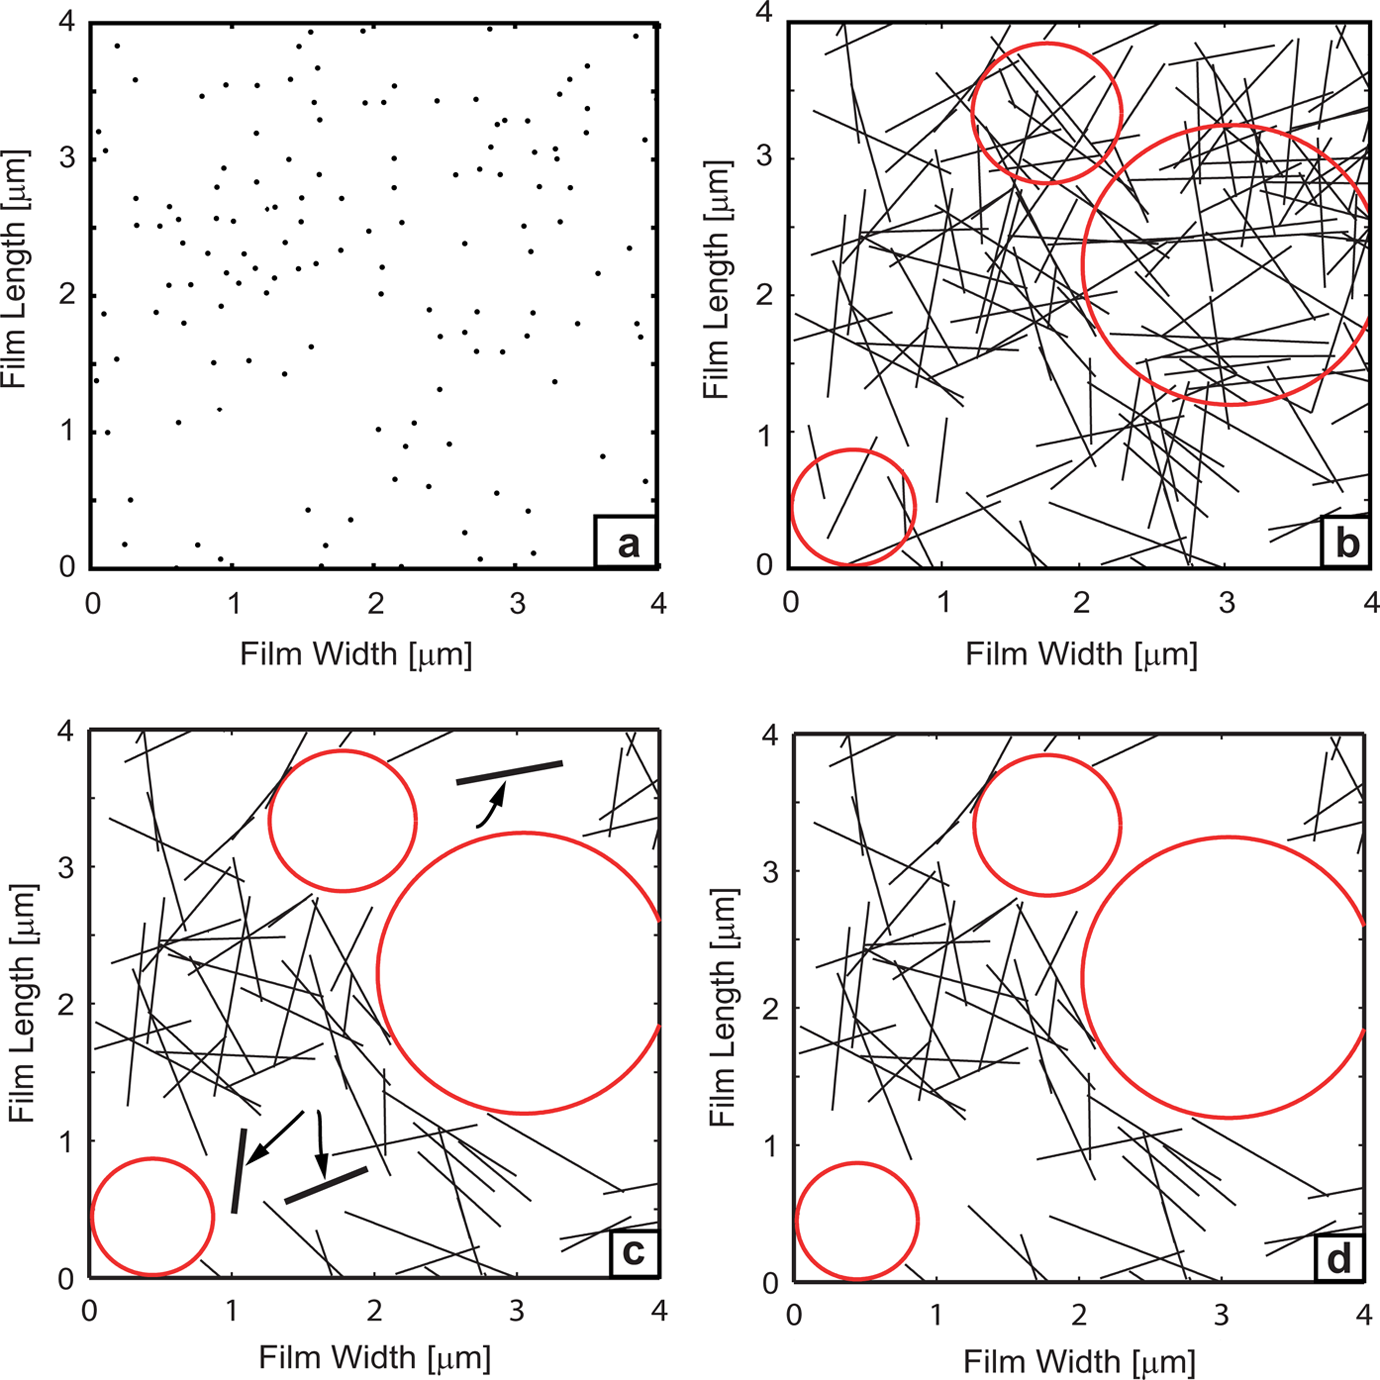
Four steps of CNTs’ dispersion in a foamed RVE: (a) random dispersion of CNTs’ initial points, (b) generation of CNTs and voids, (c) elimination of CNTs that interact with the voids, and (d) elimination of CNTs without any connection (CNTs without connections are given in bold vertical lines). CNT: carbon nanotube; RVE: representative volume element.
For foamed samples, which have some voids inside the composite RVE, CNTs should not interact within empty circular voids. After distribution of CNTs within the RVE, the program finds segments that interact within voids and/or without any connections and eliminates them. The number of CNTs in the RVE is reduced, due to the presence of voids. These steps are shown in Figure 4.
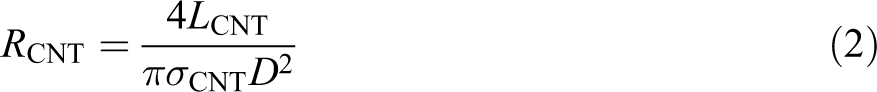
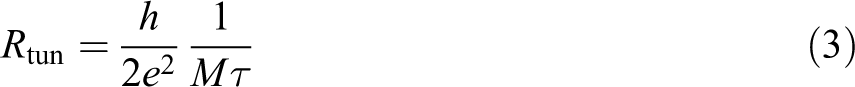
The required equations for measuring intrinsic, contact, and tunneling resistances (in ohm) of CNTs are presented in equations (2) and (3):
17
Finally, the resistivity values of each connection inside the CNT network are computed based on their shortest distance and stored in a square conductance matrix. For measuring the electrical resistivity of an RVE, the random walk method is used. 33 For CNT networks with large numbers of nodes, the conductance matrix, which is required for finding the probabilities, is determined by finding the connections among CNTs. A block diagram depicting the modeling steps is presented in Figure 5. In the diagram, the steps that are performed based on random selection (stages a, b, and f) are given as bold vertical lines; and the tasks carried out deterministically occur in stages c, d, e, g, and h.
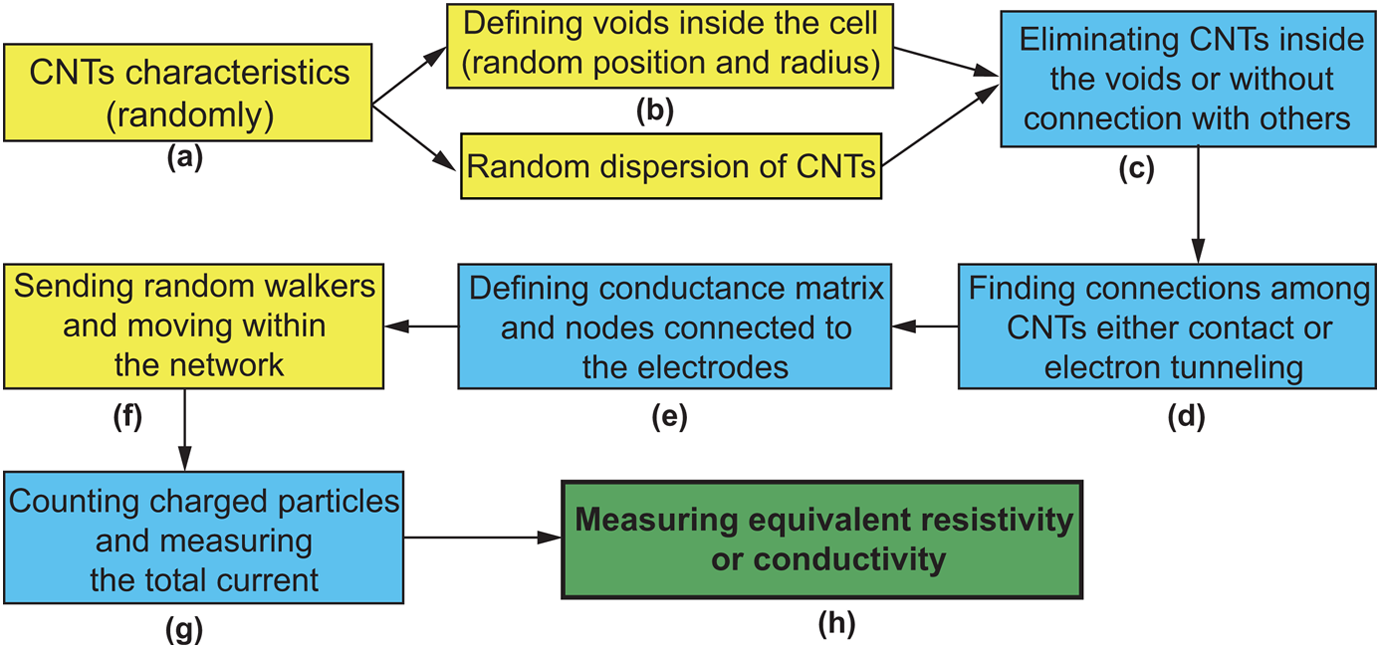
Illustration of the eight stages of modeling with the random walk method.
A smooth curve fitting the percolation probabilities of the RVE versus different volume fractions of CNTs is shown in Figure 6 to relate the influence of void addition, or more accurately leaching, to the RVE. Although the percolation threshold for the RVE without voids was found to be around 1 vol% of CNTs, the addition of voids shifts this value to higher CNT contents. 42
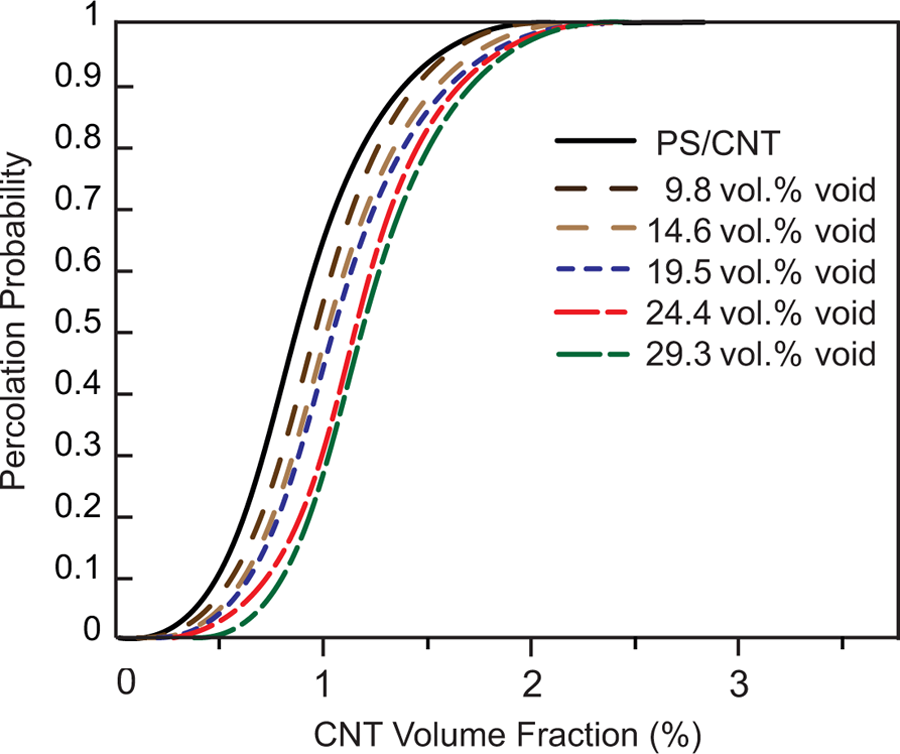
Percolation probability of specimens versus CNT volume fraction (specimens with different void contents). CNT: carbon nanotube.
In Figure 6, each curve represents an RVE with a different void volume percentage resulting from leaching. The number of CNTs in the RVE reduced after the addition of voids. The reduction in the percolation probability of CNTs within the composites with voids subsequently decreased the electrical conductivity of the RVE.
The random walk model in pseudo-3D form was found to be in good accordance with some other earlier models and experimental electrical conductivity measurements. The expansion of the model to a true 3D form, due to the nature of this model, which is based on the conductance values among CNTs, is feasible for achieving more accurate electrical results. In addition, very large CNT networks can be simulated with the random walk method.
Experiments
The methods of production of specimens in both foamed and nonfoamed specimens are explained in the following subsections. The materials and equipment used for the production of the specimens and the equipment incorporated for characterizing the properties are described. From a masterbatch of 20 wt% multiwalled CNT (MWCNT)/PS pellets (Hyperion Catalysis, Cambridge, Massachusetts, USA), a sample amount was diluted to 3.5 wt% (2.1 vol%) using a twin-screw extruder. Pristine PS (Styron 610, Americas Styrenics LLC, The Woodlands, Texas, USA), with a density of 1.04 g/cm3 and a melt flow index of 10 g/10 min (at 200°C), was used to dilute the masterbatch. The MWCNTs were vapor-grown with lengths in the range of 1–10 μm and an approximate density of 1.75 g/cm3. Fine and sieved commercial sea salt crystals—2.17 g/cm3 in density and maximum length of 1 µm—were used for foaming of the composites through the leaching technique.
Utilizing a grinding machine (Brinkmann, Germany), PS/CNT granules were ground and mixed with fine NaCl crystals to produce a uniform distribution of NaCl crystals and PS/CNT granules. Before further processing, the resulting materials (with different NaCl contents) were kept for 8 h in an oven at 80°C for evaporation of any moisture. Using a compression molder (model 4122, Carver Inc., Wabash, Indiana, USA), the final specimens were then fabricated (25 × 15 × 1.8 mm3). Specimens were compression molded for 10 min, while the temperature of platens and the pressure were maintained at 215°C and 80 MPa, respectively. Three specimens were manufactured for each type of nanocomposite.
After the production of composites with six different NaCl percentages (0, 20, 30, 40, 50, and 60 wt%), the required tests were conducted on the samples. The NaCl/PS/CNT composites were immersed in water (24 h), so that water could penetrate into the composite structure and dissolve the NaCl crystals. Before and after the immersion stage, samples were weighed using a weighing scale (model VIC-303, Acculab, Danvers, Massachusetts, USA), in order to measure the reduction in the mass of composites resulting from the dissolution of NaCl crystals. After immersion, all the NaCl crystals were dissolved, and specimens with significant inner porosity were created. The higher the NaCl content, the higher the possibility of creating a widespread NaCl network. 31
For testing the electrical properties of the specimens, a laboratory electrochemical impedance spectroscopy (EIS) test instrument (Biologic SP-150, Bio-Logic, France) was employed in the frequency range of 1–106 Hz. Copper tapes were attached to two sides of the square-shaped sample to serve as EIS electrodes.
The EMI SE measurements of foamed and nonfoamed samples were performed in the X-band frequency range (8.2–12.4 GHz), utilizing a network analyzer (model E5071C, Agilent Technologies, Santa Clara, California, USA). To explore the morphology of the foam structures, some images were taken with a digital microscope with a maximum magnification of 230 times (model AM313, Dino-Lite, Torrance, California, USA).
Results and discussion
The morphology of composites is explained using cross-sectional and surface images of specimens. The EIS results of composites, including electrical conductivity with different void contents, are then presented. Finally, the results of the permittivity measurements and EMI shielding capabilities of specimens are also discussed.
Morphology
Cross-sectional and surface images of composites taken using a digital microscope are presented in Figure 7. Due to the highly brittle behavior of the foamed specimens, they were simply broken at ambient temperature for observation of their cross-sections. The foam structure fabricated in this study was open cell, which has been shown and explained in previous research works. 32
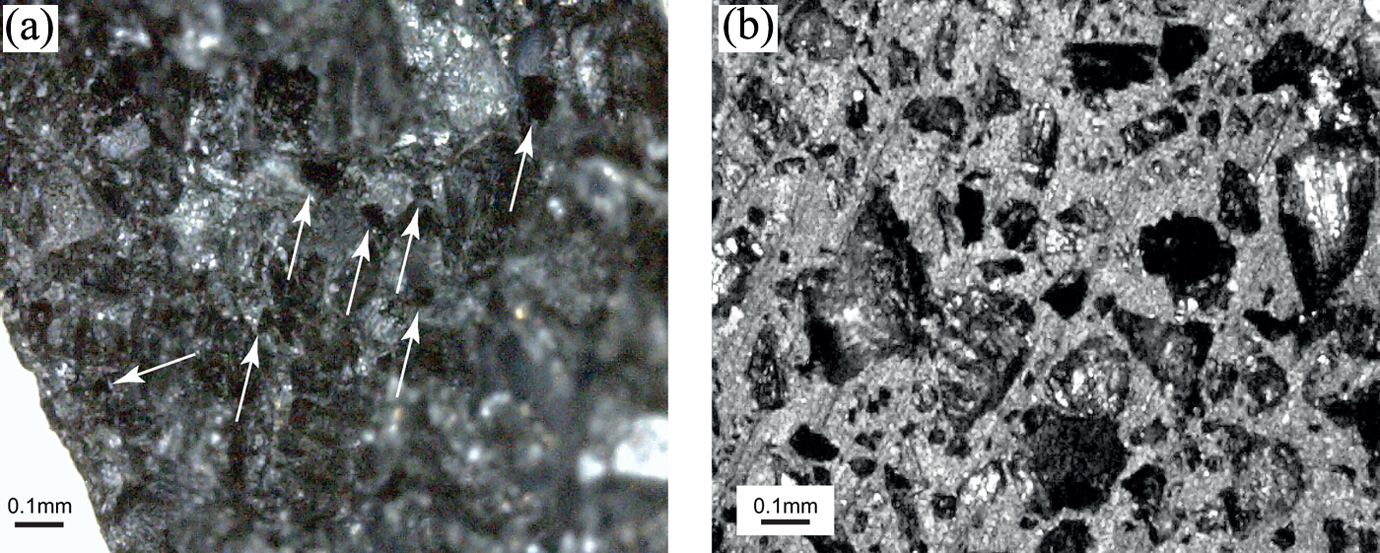
Images of a foamed specimen (with a void content of 29.3 vol%) after 24 h immersion; (a) cross-section of a broken sample and (b) surface of the specimen.
In Figure 7, voids are indicated by arrows. It can be seen that there is no sign of NaCl residues inside the specimens (with a NaCl content of 60 wt%). However, in specimens with low NaCl contents, NaCl residues remained in the composite structure. This can be attributed to the encapsulation of NaCl crystals using a thermoplastic similar to other fillers: composites such as NaCl/PS/CNT possess less than the minimum NaCl content to form a continuous network throughout the composite to leach NaCl using water. 31,43
Water penetration into the composites and the dissolution of the NaCl crystals, that is, leaching of NaCl, were easier in composites with higher NaCl contents, because there were more possible paths for the solvent to seep through the NaCl network. This is why voids were not only observable on the surface of the samples but also in the cross-sections of the samples. The irregular shapes of the hollow structure were the result of the random sizes and shapes of the NaCl crystals. After the fabrication stage, electrical conductivity measurements of nanocomposites were conducted on them.
Electrical properties
The electrical impedances of samples were measured using the EIS setup. The electrical resistivity values of the samples after 24 h immersion in water, with standard deviations of void percentages, are shown in Table 1. In addition, the weight variations of the compression-molded samples with different NaCl contents are indicated. NaCl-filled samples lost their weight after they were kept in water for 24 h.
Electrical resistivity of specimens after 24 h immersion in water measured via EIS (direct current values).
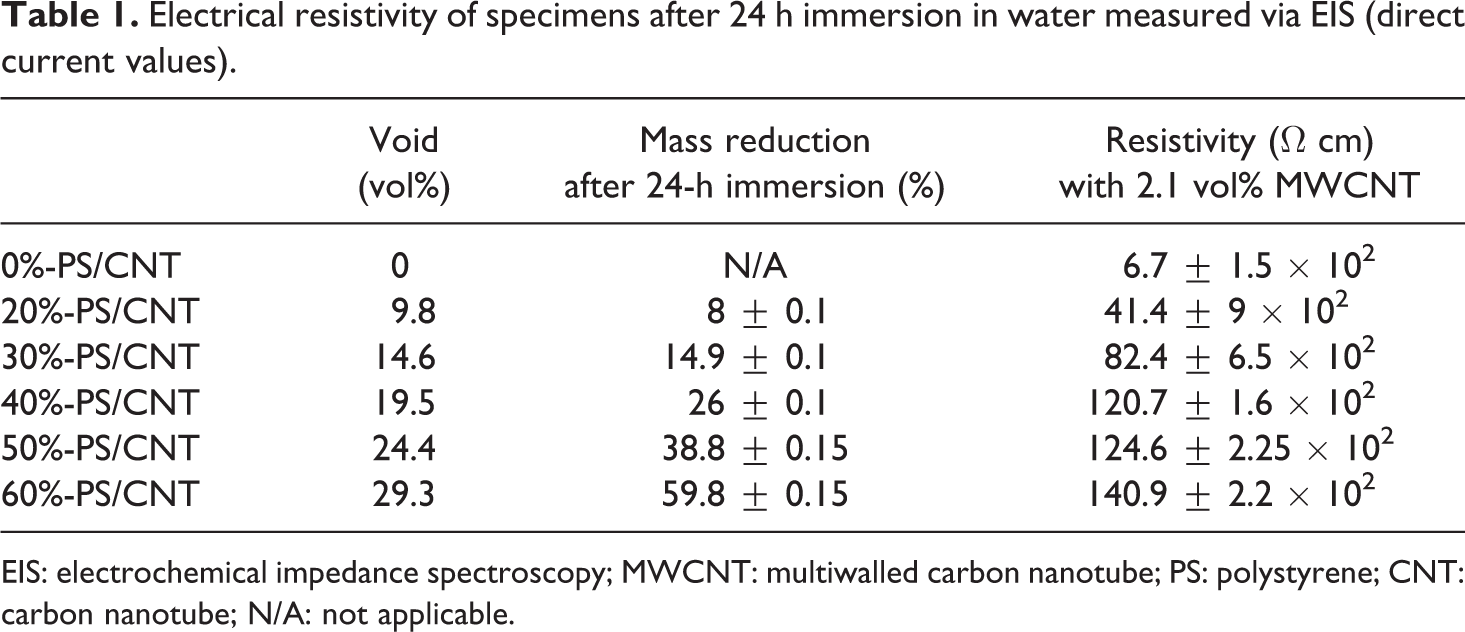
EIS: electrochemical impedance spectroscopy; MWCNT: multiwalled carbon nanotube; PS: polystyrene; CNT: carbon nanotube; N/A: not applicable.
Table 1 shows that the general trend increased the electrical resistivity values with increased void volume percentage. However, specimens with void contents of 19.5 and 24.4 vol% had similar resistivity values. Overall, the values changed from 6.7 Ω m (PS/CNT) to 140.9 Ω m (60%-PS/CNT). This may be attributed to the increase in insulating voids or to NaCl residues within the composite even after 24 h of immersion in water. The electrical resistivity increased since the composites with hollow inner structures had less conductive material to carry the electrical charge.
The experimental results were also compared with the random walk model and are shown in Figure 7. As stated, processes such as compression molding may shorten the length of CNTs. 40 In addition to shortening the CNTs, the pseudo-3D modeling and the straight shape of CNTs are the most relevant parameters in the dissimilarities between the experimental and modeling results.
In Figure 8, the ratios of resistivity of foamed specimens with respect to those of nonfoamed specimens are plotted. As can be seen, both curves show increases in resistivity with increased void content. Increases in electrical resistivity of the random walk model can be related to the results of the percolation probability of foamed nanocomposites presented in Figure 6. The addition of voids to the simulation RVE led to a lower probability of CNT percolation and creation of a conductive pathway of CNTs, which may result in the decreased electrical conductivity of the whole specimen.
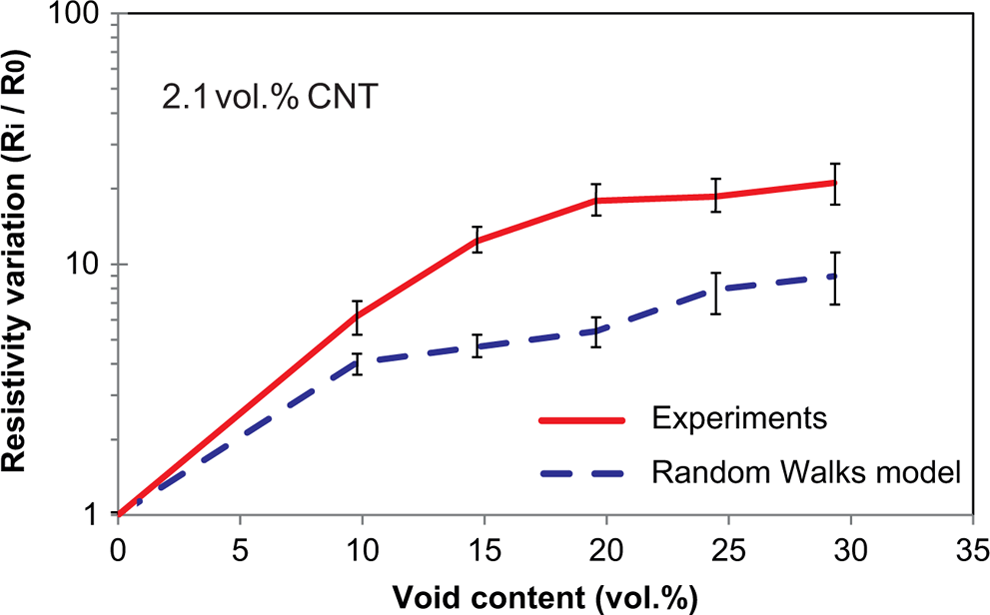
Variation in electrical resistivity of the specimens versus the void (vol%).
In addition to electrical conductivity, the internal structure of nanocomposites may also affect the EMI shielding capability. The dielectric behavior of materials is another effective factor in EMI SE. These properties of specimens were investigated and are discussed in the subsequent subsection.
EMI shielding and dielectric permittivity
Once the specimens were mixed with NaCl and immersed in water for 24 h, the EMI shielding capabilities of foamed and nonfoamed PS/CNT composites were investigated. The effects of void addition on EMI SE, especially on the absorption portion of the EMI shielding, are examined and discussed. The results of the dielectric permittivity of specimens are also presented.
The overall EMI SE is the sum of reflection and absorption SE values. EMI SE values for the samples obtained using the network analyzer are presented in Figure 9. The EMI SE of the composites was measured in the X-band range of frequencies. Figure 9 shows the EMI SE values after 24 h immersion in water. Adding voids to PS/CNT composites led to improved EMI SE values of the specimens (11.3 dB for PS/CNT specimens). The values for the absorption part of the SE are also plotted in Figure 9 and are found to be approximately 70% of the total SE. Both of these curves have similar trends in the improvement in EMI SE with void content, that is, increased void content results in increased SE. The variation of the values in the curves for different void contents, which were almost the same, suggests that the dominant influence in SE is the absorption mechanism, rather than reflection. The voids created by applying the leaching method may be the reason for the increase in the EMI SE of specimens. This possibility is discussed in equations (4) to (7).
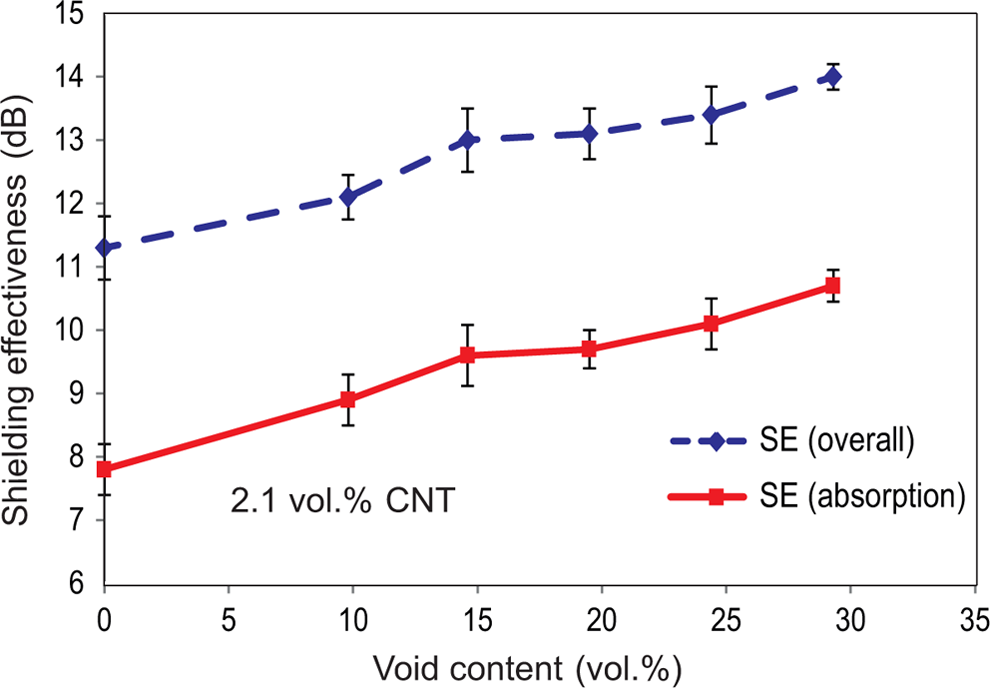
Experimental EMI SE of the specimens versus void content. EMI: electromagnetic interference; SE: shielding effectiveness.
A possible explanation for the enhancement in EMI SE of foamed composites over that of nonfoamed ones is the entrapment of electromagnetic waves within the foamed composite and increased multiple internal reflections of the wave. In other words, once an electromagnetic wave hits the foamed PS/CNT nanocomposite, a portion of that wave is reflected by the surface and the other portion penetrates into the composite. The inner surface of voids then acts like a reflector due to the internal voids (air) and the electrical impedance mismatch between air and PS/CNT, leading to an increase in wave pathways through the material. 24,28,29 This may intensify the absorption of electromagnetic waves in nanocomposites with inner porosity. Therefore, with an increase in the absorption of waves within the composite, the ratio of the transmitted electromagnetic wave to the input wave decreased. 44
The ratio of the reflection of wave strongly depends on the difference between the impedance of the media.
29
The reflection coefficient (RC) at the interface can be expressed as:
44,45
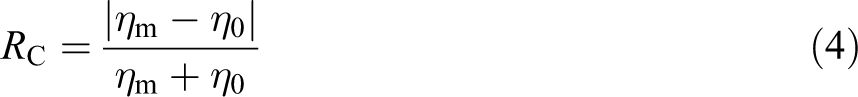
Based on equation (4), a lower impedance of shield leads to higher RC values, indicating higher reflections. Therefore, assuming air as an ideal insulator, the intrinsic impedance of air can be found using equation (5):
29
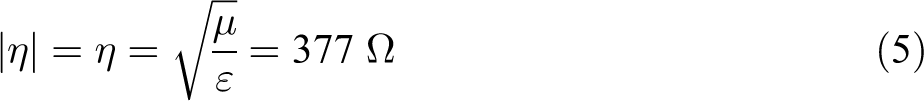
The magnitude of the intrinsic impedance of a 2.1 vol% PS/CNT nanocomposite, which is classified as a semiconductor, is:
29
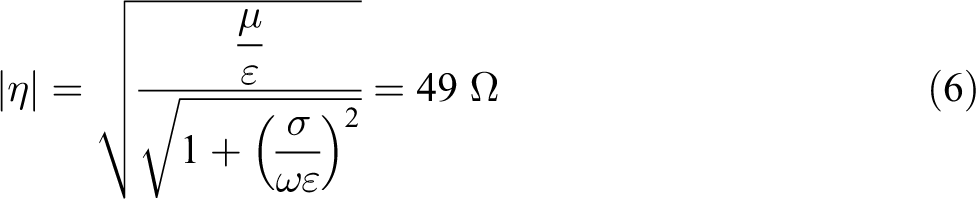
The average intrinsic impedance of 2.1 vol% PS/CNT nanocomposites, based on the stated equations and values of permeability and permittivity measured via the network analyzer, is about 49 Ω. Accordingly, the value of RC between air and PS/CNT nanocomposites is 0.77 (equation (4)). The measured value of RC is from both primarily reflections and multiple internal reflections. These internal reflections result in longer paths for the incident wave and greater electromagnetic wave absorption, as shown in Figure 10.
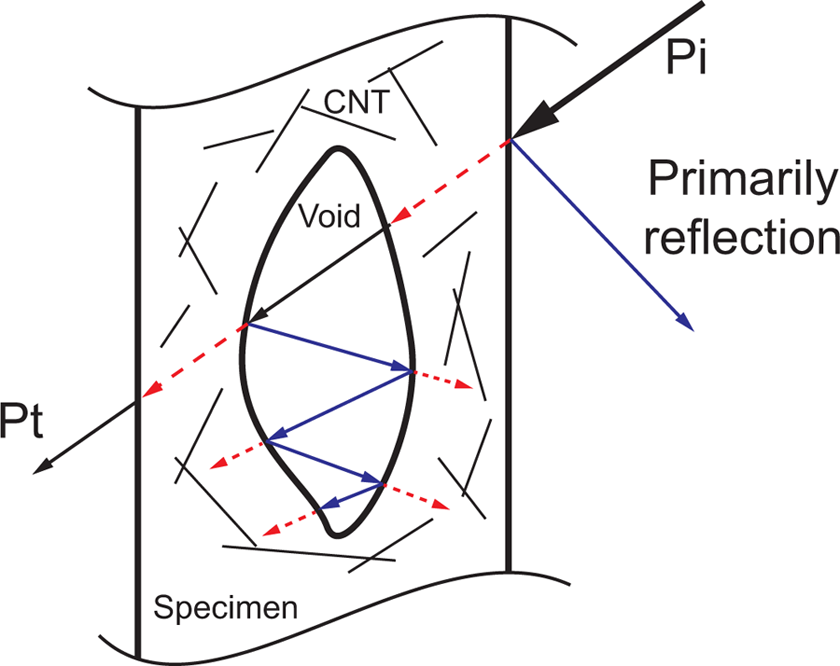
Schematic representation of electromagnetic wave absorption in foamed nanocomposites due to internal reflections. Incident (Pi) and transmitted (Pt) electromagnetic waves are shown with internal reflections.
For foamed specimens fabricated with the leaching techniques, some NaCl residues remained within the nanocomposites after immersion in water (Table 1). Due to the insulating behavior of NaCl residues, the same equation for measuring intrinsic impedance was used (equation (5)), and the value of 317 Ω was achieved for NaCl.
The RC between salt and PS/CNT materials following equation (4) was 0.73, which is close to that for air and PS/CNT materials. Therefore, due to similarity of RC values for both air–PS/CNT (RCair = 0.77) and NaCl–PS/CNT (RCNaCl = 0.73), it can be said that the NaCl residues and empty voids may have similar behavior with respect to internal reflections.
For practical EMI shields, being lightweight is an important technological requirement; 2 therefore, the EMI shielding capabilities of materials were measured, considering the effects of foaming on the weight of the specimens. The ratios of EMI SE to the mass of specimens are presented in Table 2.
EMI SE of 2.1 vol% CNT composites with respect to mass.
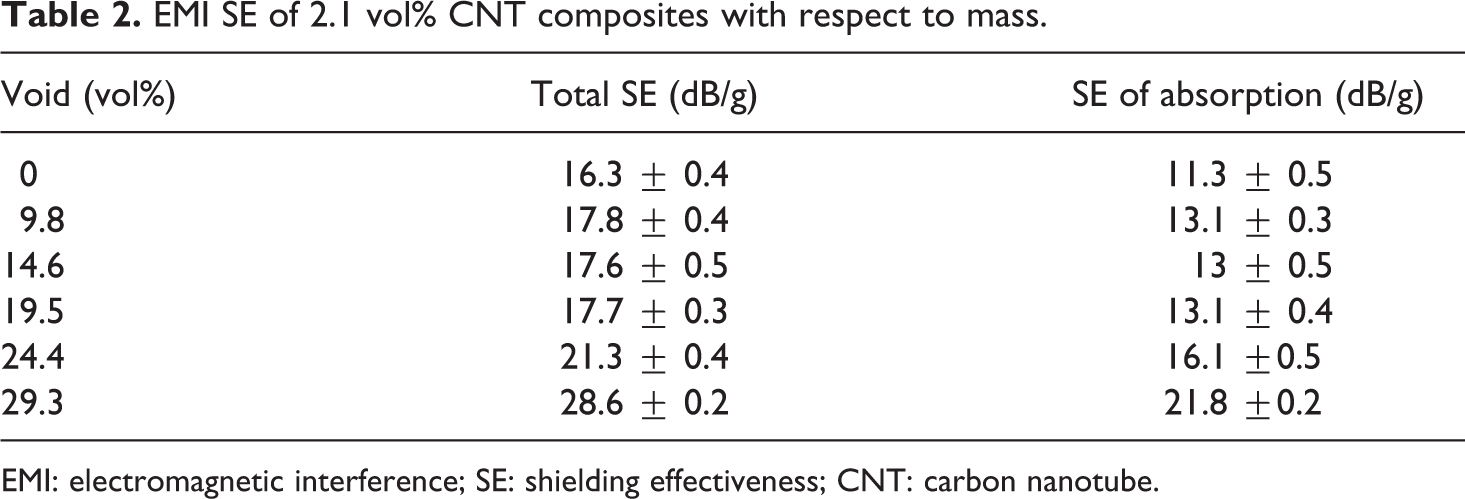
EMI: electromagnetic interference; SE: shielding effectiveness; CNT: carbon nanotube.
The results presented in Table 2 show that addition of voids to the PS/CNT nanocomposites led to increases in the ratio of EMI SE to mass. These results indicate a better understanding of changes in both EMI SE capabilities and the weight of the fabricated nanocomposites. As can be seen in Table 2, the ratios of EMI SE to mass in nanocomposites with the highest void content (29.3 vol%) were higher than those of nonfoamed nanocomposites.
It has been shown in earlier studies that an increase in the dielectric constant results in increased electromagnetic wave absorption of composites; 46 therefore, a higher dielectric permittivity of specimens leads to a higher degree of electromagnetic wave shielding.
The EMI SE measurement setup was also used for measuring the relative permittivity of the samples. Figure 11 shows the trend lines of the different nanocomposites’ real permittivity after 24 h immersion in water. Since the results had sinusoidal behavior, the trend lines of the relative permittivity were used to show the difference among specimens. The lowest dielectric permittivity values were observed for the nonfoamed PS/CNT specimen, similar to the previously reported results. 47
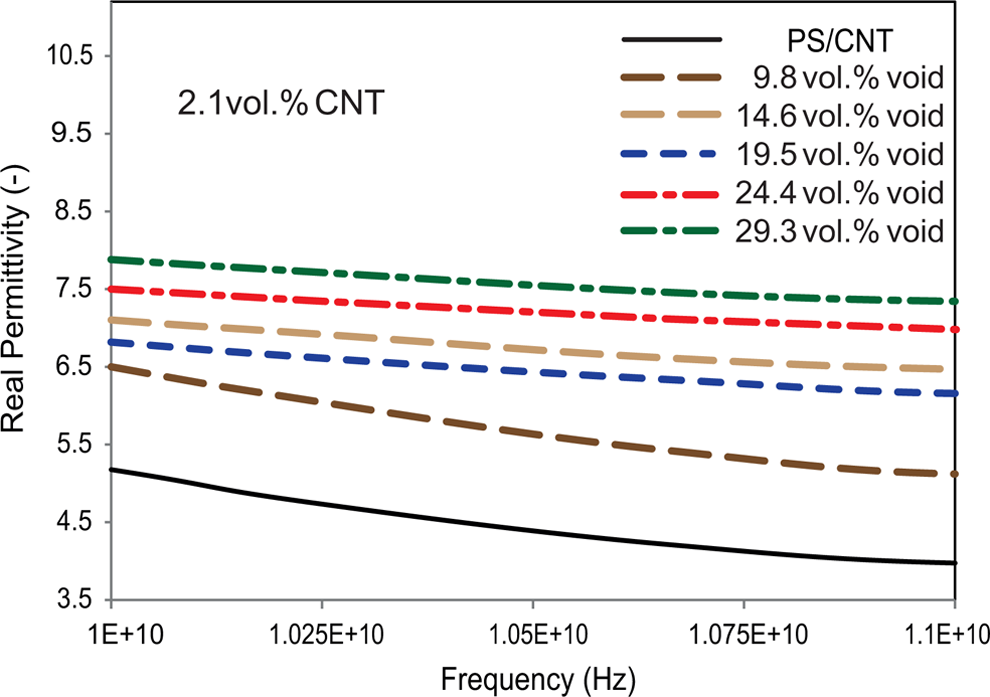
Real permittivity of nonfoamed composites and 24 h immersed composites.
In our study, the nonfoamed nanocomposite showed the minimum permittivity values for all the fabricated samples, which are in good agreement with the EMI SE values of this type of composite compared with the specimens with voids (Figure 9 and Table 2).
Increases in the void contents and permittivity also resulted in the improvement of the electromagnetic wave absorbance (Figure 9 and Table 2). At lower concentrations, the created network of NaCl is not large enough to connect every NaCl crystal to each other; therefore, some encapsulated crystals remain within the composites. Therefore, the dielectric constant of the NaCl residues, which is about 5.62, may have affected the overall dielectric properties of PS/CNT nanocomposites with lower concentrations of NaCl. 48
It was assumed that addition of internal and superficial porosities could entrap the incident electromagnetic waves and increase the absorption portion of the EMI shielding. Although it was determined that the presence of voids within the nanocomposites led to decreases in electrical conductivity, the EMI SE of specimens improved upon the addition of voids. With increased EMI SE, the weight of specimens was reduced, due to the presence of voids; therefore, this type of lightweight nanocomposite may have good potential as an EMI shielding material. In addition, the increased electrical conductivity of foamed specimens with increased CNT content and uniformity may be helpful in improving EMI shielding capabilities. These aspects can be investigated in future studies.
Conclusion
Using the compression molding and leaching techniques, six types of foamed and nonfoamed CNT nanocomposites with different void contents were fabricated. We have developed a pseudo-3D model based on the random walk simulations for measuring the electrical resistivity of a CNT network, which depends on contact and the tunneling resistances. The model considered the presence of voids in the foamed composites to investigate the effect of the addition of voids on the electrical conductivity. The experimental tests were performed using the EIS setup to measure the resistivity of samples and compared with the model. The model showed a similar trend as the experimental results.
The EMI SE and dielectric permittivity of specimens were also measured with a network analyzer in the X-band frequency range. Results showed that increasing the void content inside the composites increased both the electrical resistivity and relative permittivity of the PS/CNT composites. Similarly, an increase in porosity led to the formation of shield materials with higher ratios of EMI SE to weight than those of nonfoamed specimens due to greater amounts of internal reflection in voids. High ratios of EMI SE to weight of materials play a key role in selection of EMI shields. Therefore, the leached CNT-foamed nanocomposites would be good EMI shielding materials due to their high ratio of EMI SE to weight compared with the nonfoamed ones.
Footnotes
Acknowledgments
The authors would like to thank the members of Polymer Processing Group at the University of Calgary, Calgary, Canada for their assistance.
Declaration of Conflicting Interests
The author(s) declared no potential conflicts of interest with respect to the research, authorship, and/or publication of this article.
Funding
The author(s) disclosed receipt of the following financial support for the research, authorship, and/or publication of this article: This work is supported by the Korea Carbon Capture and Sequestration Research and Development Center and the Natural Sciences and Engineering Research Council of Canada Discovery grants.