
Abstract
Polypropylene (PP)/calcium carbonate (CaCO3) nanocomposites were prepared from masterbatch by melt blending in a twin-screw extruder. The effect of three different nano-CaCO3 loadings (5, 10, and 15 wt%) on the rheological/viscoelastic and mechanical properties of the nanocomposites was investigated. A scanning electron microscopy was used to study the morphology of the nanocomposites, whereas a differential scanning calorimetry was used to analyze the thermal properties. The rheological properties were characterized using an oscillatory rheometer, and the mechanical properties were characterized by a tensile test machine. In the melt rheological study, a frequency sweep test showed that the complex viscosity
Introduction
Polymer nanocomposites (PNCs) represent a new class of composite materials in which the reinforcement filler has at least one nanoscale dimension. The incorporation of these nanofillers at relatively low loading may significantly improve selected properties of the polymer (e.g. stiffness, gas barrier, flame retardancy, electrical conductivity, etc). 1,2 Among various nanofillers, two of the most extensively investigated materials are layered silicates/nanoclay and carbon nanotubes (CNTs), which are two- and one-dimensional geometrical elements and thus have a large aspect ratio. Recently, attention has also been given to nanofillers with three dimensions at the nanometer scale, such as spherical silica or calcium carbonate (CaCO3) nanoparticles, which both have a low aspect ratio. 3 The use of CaCO3 nanoparticles may be an interesting topic in the study of polymer–filler interactions. In addition, CaCO3 is inexpensive and widely available. Therefore, it can be used at a high level of loading. Furthermore, this material can be widely used as filler for almost all polymers. 4,5 Among the thermoplastic polymers that have been extensively investigated, one of the most widely used commercial polymers is polypropylene (PP) because of its low cost, low density, relatively high thermal stability, high rigidity, good mechanical properties, and recyclability. Isotactic PP has been used for many applications such as home appliances, automobile parts, construction, and other industrial applications. However, its range of application is somewhat limited for further expansion due to its poor impact toughness, especially at room temperature. PP is known for its good processability, which makes it compatible with many types of natural and synthetic fillers in producing particulate-filled composites. Incorporation of rigid inorganic particles like nano-CaCO3 into PP has resulted in lighter materials with improved properties such as tensile modulus (E), toughness, thermal properties, which makes them more desirable for the above-mentioned applications. 2,5 –9
Three main processes are most frequently used to prepare polymer nanocomposites, namely, in situ polymerization, intercalation from solution, and melt blending (melt intercalation). 2,9 –11 The melt blending or melt compounding technique has attracted great interest among researchers and is the focus of this work. This method is the most preferred method for fabricating nanocomposites because it is convenient and compatible with current industrial processes such as extrusion and injection molding. In addition, the absence of solvents will reduce the costs associated with solvents and their disposal and environmental impact. 5,12 This method may be more effective in PNC fabrication using masterbatch than techniques using bulk nanomaterials because masterbatch is considered a dust-free additive; thus, it has lower health and safety risks. Another advantage of masterbatch is its ease in the distribution and dispersion process. 13,14 Good distribution and dispersion of the fillers in the polymer matrix is a prerequisite for any enhancement of nanocomposites properties, especially mechanical properties. 15 Therefore, melt blending using masterbatch is considered to be one of the simplest and most economical methods in the processing of PNCs. To the best of our knowledge, there are few literature studies on PNC preparation using masterbatch compared with the conventional method (direct melt blending of bulk nanomaterials into the polymer matrix). Therefore, this method is an attractive area for research.
The rheological properties of PNCs, especially in the melt state, are key factors in understanding the melt processability and the internal structure/morphology of the composites. 11,16 The effect of nano-CaCO3 addition on the melt rheological properties of polymers has been investigated by numerous researchers. Karamipour et al. 17 studied the effect of nano-CaCO3 on the rheological properties of PP. They found that the complex viscosity of the nanocomposites increased with the nano-CaCO3 loading. Moreover, the effect of CaCO3 loading on the rheological behavior of the nanocomposites was more prominent at low frequencies. They suggested that the rheological response of the nanocomposites was caused by frictional interactions between the nanofiller and the nanofiller–polymer. Wang et al. 4 investigated nano-CaCO3-filled polycarbonate (PC) composites and found a remarkable rheology enhancement of the PC melt upon the addition of CaCO3 nanoparticles. Elleithy et al. 18 studied the properties of high-density polyethylene (HDPE)/CaCO3 nanocomposites prepared via melt blending. Although the dispersion of CaCO3 nanoparticles in the HDPE matrix was not good, they showed that the complex viscosity of the nanocomposites was higher than that of the HDPE matrix in a melt rheological study. It was suggested that the increase in the viscosity was due to the presence of CaCO3 agglomerates in the composites, which formed a “filler network.” 19 In the case of solid viscoelastic properties, Weon and Sue 20 reported the effect of temperature on dynamic mechanical properties. The dynamic mechanical thermal analysis (DMTA) results showed that the addition of CaCO3 nanoparticles to the high-crystallinity PP matrix significantly improved the storage modulus (G′) throughout the entire range of temperatures scanned. The increase in G′ was proposed to be due to the reinforcing effect of the CaCO3 nanoparticles.
Numerous studies have also reported an improvement in the mechanical properties of CaCO3-based nanocomposites. 1,2,5,8 –10,19 –27 Chan et al. 9 reported an enhancement in mechanical properties. In their work, the good filler dispersion has resulted in significant enhancement in elastic modulus of the nanocomposites (approximately 85%), while the ultimate stress and the yield stress and strain were not strongly affected by the presence of nano-CaCO3 particles. They postulated that the results of tensile tests were greatly influenced by two counterbalancing effects: the reinforcing effect of the filler and a decrease in the spherulite size of the PP matrix. In another study, Zuiderduin et al. 21 reported that the stiffness increased from 1840 MPa to 2700 MPa (approximately 46%) upon the addition of 19 vol% of CaCO3 to the polymer, whereas the yield stress decreased upon incorporation of the filler. The decrease was approximately 18.6% with the addition of 30 wt% of CaCO3. They suggested that the decrease in the yield stress was most likely due to the debonding of the CaCO3 fillers from the matrix polymer. Debonded particles reduce the yield stress. However, this debonding contributed to an improvement in the fracture energy, or in other words, it toughened the nanocomposites.
The aim of this work was to investigate the effect of CaCO3 nanoparticle loading on the rheological and mechanical properties of PP/CaCO3 nanocomposites as well as their morphological characteristics. The rheological properties were characterized using an oscillatory rheometer in the solid state (dynamic mechanical) and the melt state (melt rheology). A numerical analysis employing the Maxwell element method was also conducted to analyze the relaxation time spectrum and the relaxation modulus of the nanocomposites. It is known that the analysis and modeling of polymer processing often require the relaxation or retardation time spectra, G(t) or J(t), instead of the readily available dynamic mechanical data, G′ and G″. Therefore, in this study, it was necessary to convert the dynamic mechanical data (dynamic modulus, G′ and G″, which are easy to measure) from the frequency domain to the time domain (relaxation modulus, G(t), which is easy to interpret). The discrete relaxation spectrum is commonly related to the contributions of the relaxation times of finite Maxwell elements. 16,28 In addition, the mechanical properties were characterized by tensile, flexural, and Izod impact tests. Some of the properties, that is, the E value and the tensile strength, were modeled using several well-known equations as a function of filler concentration.
Experimental
Materials
PP was used as a matrix polymer for the nanocomposites investigated in this work. A commercial PP homopolymer (PP570, melt index = 8 g/10 min at 230°C and 2.16 kg) was acquired from a local manufacturer in the Saudi market. Commercial nano-CaCO3 masterbatch materials with an approximately 80 ± 3% concentration of nano-CaCO3 (Nano Filler 0189) were obtained from Wuxi Changhong Masterbatches Co. Ltd (China) for the nanofiller. The granule size for CaCO3 was approximately 20 nm–2 μm according to the data sheet from the supplier.
Preparation of nanocomposites
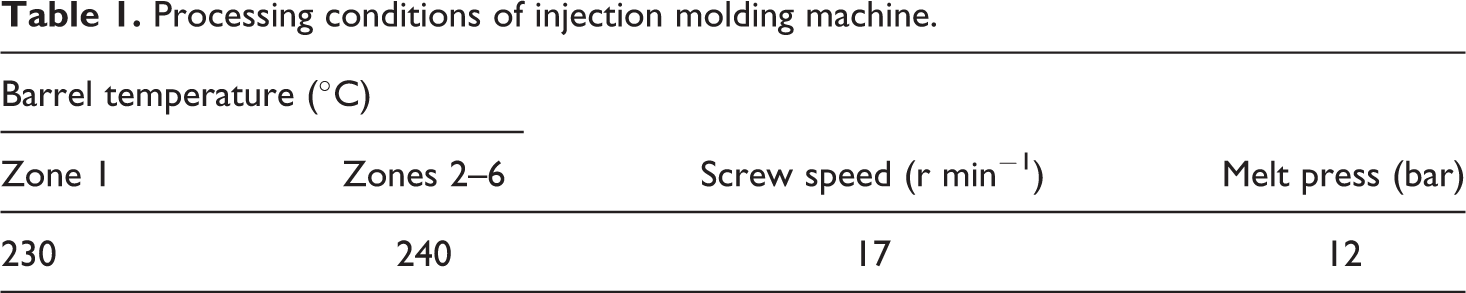
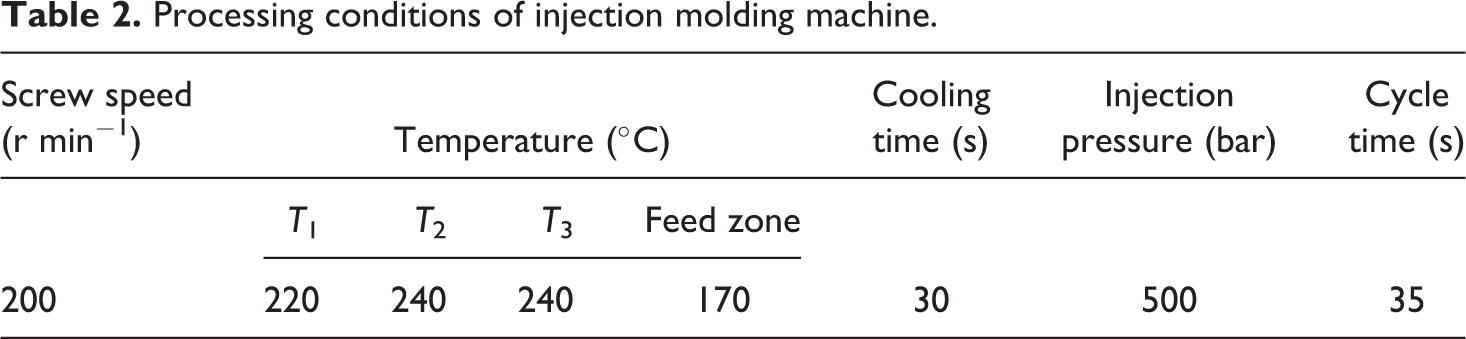
PP/CaCO3 nanocomposites were prepared by melt blending the nano-CaCO3 masterbatch and the PP matrix. The extruder was a corotating twin-screw extruder (TSE; model FTX-20, Farrel Limited, UK) with a screw diameter (D) of 26 mm and length to D ratio of 35. Prior to the melt compounding, both PP and the masterbatch were manually premixed with different concentrations of nano-CaCO3. Subsequently, they were dried in an oven at 55°C for 24 h to reduce the moisture content. Afterward, the premixed material was melt compounded using the TSE. The extrudate strand exiting from the die was rapidly quenched in a water bath (at approximately 20°C), air–dried, and pelletized by a cutting machine. The pellets were dried again in an oven (55°C, 24 h) and then melt compounded for a second time (recycled) to reduce the possibility of nano-CaCO3 agglomeration and to obtain well-dispersed and distributed nano-CaCO3 particles in the PP matrix. The recycled pellets were injection molded to construct a set of molded ASTM standard samples for characterization using a super master series SM 120 (Asian Plastic Machinery Co., Ltd., Taiwan) The details of processing conditions for the TSE and the injection molding machine are listed in Tables 1 and 2, respectively. Three different concentrations were used in this work: 5, 10, and 15 wt% of nano-CaCO3. The nanocomposite samples will be referred to as CC-5, CC-10, and CC-15, respectively. The same procedure was used with neat PP (referred to as CC-0) to compare the neat material with its nanocomposites.
Processing conditions of injection molding machine.
Processing conditions of injection molding machine.
Characterization of nanocomposites
Morphological analysis
A morphological characterization of fractured nanocomposite samples was performed using a JSM-6360A scanning electron microscopy (SEM) from JEOL (Tokyo, Japan). The molded bars were cryogenically fractured using liquid nitrogen to minimize matrix deformation during fracture. Afterward, the surface of these cryofractured bars was coated with a thin layer of silver by sputtering using a JFC-1600 autofine coater (JEOL) under vacuum. This coating increases the signal and surface resolution. The samples were examined by SEM at 10 kV under magnifications of 2000× and 20,000×.
Thermal analysis
The melting and crystallization behavior of the nanocomposites were analyzed using a differential scanning calorimetry (DSC; model DSC-60, Shimadzu, Tokyo, Japan). The temperature scale and heat flow was calibrated with high-purity indium. Samples of 5–7 mg were mounted on a typical aluminum pan and sealed. All the tests were performed in air environment under nonisothermal crystallization scheme. The samples were heated from 30°C to 200°C at a heating rate of 10°C min−1 and held for 5 min (first heating scan). Subsequently, the samples were cooled down to 30°C at a cooling rate of −10°C min−1 (cooling scan) and then heated again up to 350°C at a heating rate of 10°C min−1 (second heating scan). The corresponding thermograms were recorded and normalized to the unit weight of the samples. The DSC thermograms from second heating scan and cooling scan were used to analyze the melting and crystallization behavior of the nanocomposites.
Rheological/viscoelastic properties
The melt rheological properties of the nanocomposite samples were measured by a rheometer instrument AR G2 (TA Instruments, New castle, Delaware, USA), using a 25-mm diameter parallel plate geometry and a typical 2 mm gap constant in the oscillatory mode. Square plates with lateral dimensions of 25 mm and a thickness of approximately 3 mm obtained from injection molding were used for this test. The excess of the polymer melts were cleaned prior to the test to validate the measurements. The dynamic measurement was conducted at a constant oscillation stress of 10 Pa, which is within the linear viscoelastic region of the samples for frequencies ranging from 0.1 rad s−1 to 628.3 rad s−1. All the measurements were performed at a fixed temperature of 230°C. The data generated from this frequency sweep test were G′, the loss modulus (G″), and the complex viscosity
To study the solid viscoelastic properties, DMTA was conducted with the same apparatus, an AR G2 rheometer. We can ascertain the performance of the material for an applied stress and temperature by analyzing the storage modulus. The tests were conducted in the torsional oscillatory mode using the temperature sweep scheme. The fixed ω value was 1 rad s−1, and the strain amplitude was 0.5%. This strain was in the linear viscoelasticity region of PP and its nanocomposites. The temperature range studied was from 40°C to 160°C with temperature increment of 3°C. Solid rectangular samples approximately 3.25 (thickness) × 12.70 (width) × 63.5 (length) mm3 obtained from the injection molding machine were used for this test.
Mechanical properties
The mechanical properties of the nanocomposites were evaluated by tensile , flexural, and notched Izod impact tests. The tensile test was carried out in a Lloyd tensile testing machine (UK) at room temperature with a crosshead speed of 500 mm min−1, according to the ASTM D-638 standard. Dumbbell-shaped tensile bars fabricated by the injection molding machine were used in the test. The Young's modulus (E) value, the tensile strength, and the toughness were directly obtained from the stress–strain curves with the help of the integrated software. Flexural test was conducted with a Tinius Olsen testing machine (Horsham, Pennsylvania, USA) according to ASTM D 790-03 standard. A three-point bending loading system was used with support span length of 50.8 mm and crosshead speed of 3 mm min−1. For notched Izod impact testing, an XJF Multi Impact Tester 50J (Amse S.r.l., San Mauro Torinese, Italy) was used at impact energy of 5.5 J according to ASTM D 256-03 standard. The hammer elevation angle was 118°, while the hammer velocity was set at 3.5 m s−1. All the tests were carried out in an air-conditioned room (approximately 25°C). All the reported values were calculated as the mean of three to five specimens for each composition. In addition to Izod impact test, the impact fractured specimen (only CC-10) was examined using a field-emission SEM (model JSM7600F, JEOL) to study the fractography of the nanocomposites.
Results and discussion
Morphological analysis
The dispersion of the nanofiller in a polymer matrix must be evaluated because it will significantly affect the nanocomposites properties (e.g. rheological and mechanical properties). The dispersion of inorganic nanofiller in a polymer matrix is not an easy process due to the intrinsic aggregation characteristics of nanoparticles. 9 Figure 1 shows SEM images of the cryogenically fractured surface of PP/CaCO3 nanocomposite samples with different nano-CaCO3 concentrations (5 and 15 wt%) at two different magnifications. Both the CC-5 and CC-15 micrographs (Figure 1(a) and (b)) show that most of the CaCO3 nanoparticles were relatively well distributed and dispersed in the PP matrix, as indicated by the white particle in the dark areas of the PP matrix. This result may be due to the high shear stress to which the polymer melts were exposed during processing, which was induced by the twin-screw geometry and the temperature in the barrel. Additionally, the two cycles of melt compounding likely reduced the possibility of nano-CaCO3 agglomeration. With such processing, it is possible that most of the nano-CaCO3 agglomerates were broken down and dispersed into primary particles, which should maximize the interfacial interaction between the nanoparticles and the polymer.
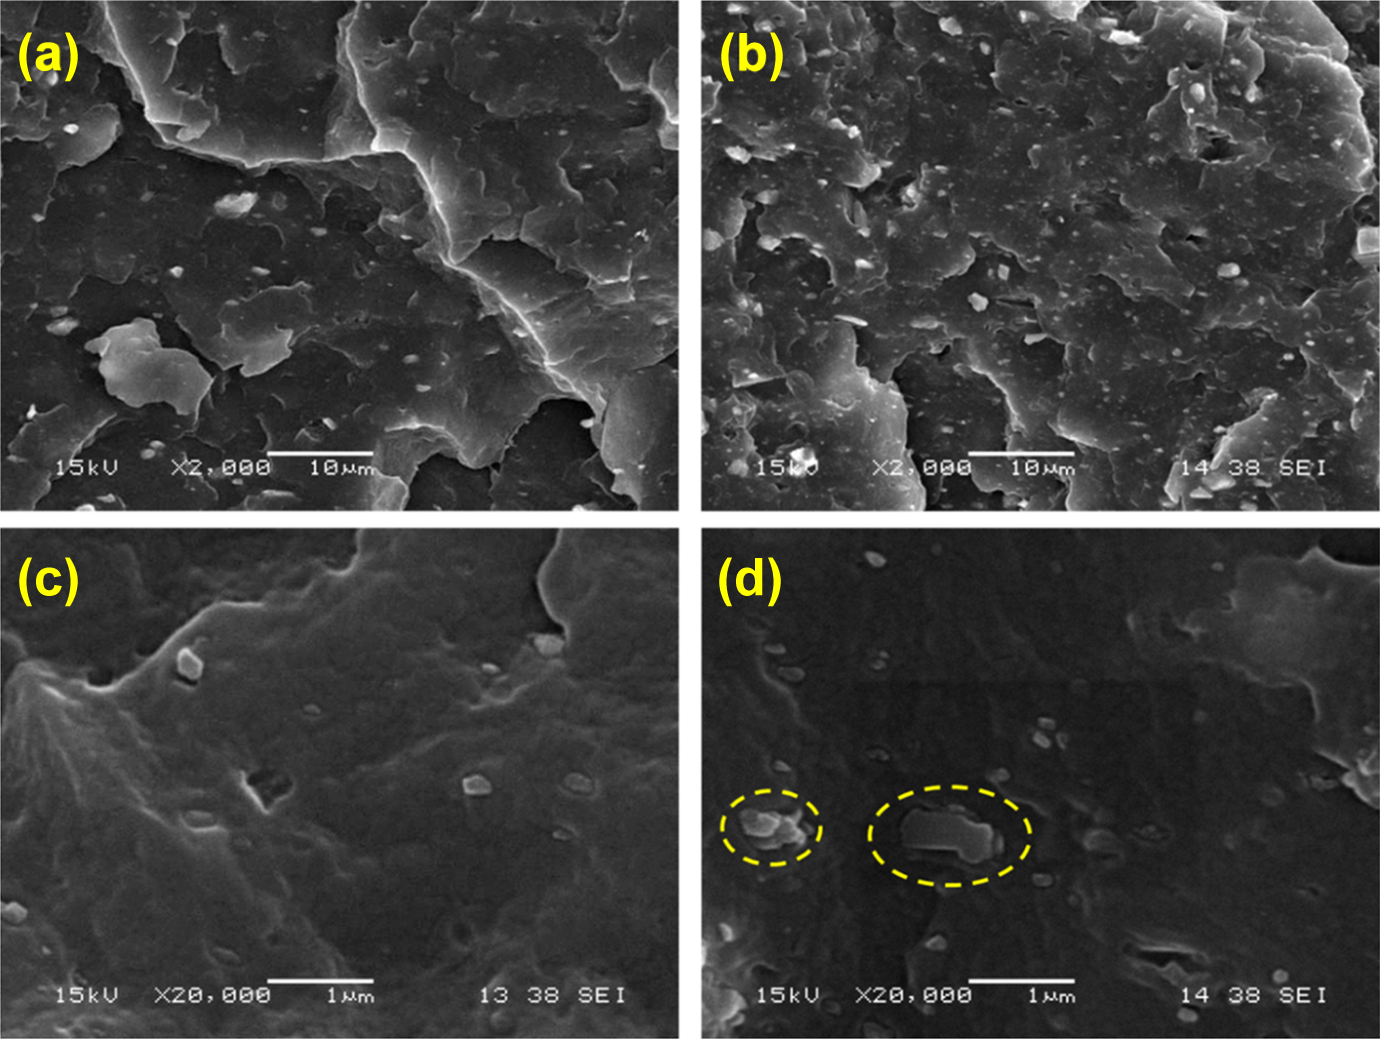
SEM images of CC-5 (left) and CC-15 (right) at different magnifications (a, b) ×2000 and (c, d) ×20,000. SEM: scanning electron microscopic.
Nevertheless, some of the nano-CaCO3 particles were found in the form of small agglomerated particles, especially in nanocomposites with a higher concentration (15 wt%), as indicated by the dashed line shown in Figure 1(d), which is reasonable because the distance between the nanoparticles was smaller at high CaCO3 concentrations; thus, flocculation of these nanoparticles could occur after the mixing is stopped, most likely due to the van der Waals bonds between the particles. 9 A similar phenomenon has been reported by Fuad et al. 15 ; at higher filler loading (15 wt%), large agglomerates were more apparent.
To further examine the morphology of the nanocomposites, a scan image analysis of the SEM images was performed using the commercial software SigmaScan (Systat Software Inc., San Jose, California, USA). In this work, we found the distribution of the particle areas. Figure 2(a) and (b) shows the distribution of CaCO3 nanoparticle areas for CC-5 and CC-15, respectively. As shown in the figure, it appears that the morphology of the PP/CaCO3 nanocomposites has a moderate distribution for all nano-CaCO3 loadings studied. The distribution covered only CaCO3 nanoparticles with an area greater 500 nm2. Smaller particles were not analyzed here due to the limitations of the SEM machine. More advanced microscopic techniques such as TEM must be used to analyze smaller particles. As shown in Figure 2(a) and (b), the highest number of CaCO3 nanoparticles had particle areas in the range of 0.5–1 μm2. The only difference between the two CaCO3 concentrations was the number of CaCO3 nanoparticles scanned. As expected, the number of CC-15 (15 wt%) particles was higher than that of CC-5 (5 wt%), which were 86 and 51, respectively. Additionally, the mean particle area (≥5 μm2) of CC-15 was much higher than that of CC-5, which was most likely due to the presence of CaCO3 agglomerates. In this scan image analysis, the CaCO3 aggregates were assumed to be individual large particles, as indicated by the dashed line in Figure 1(d).
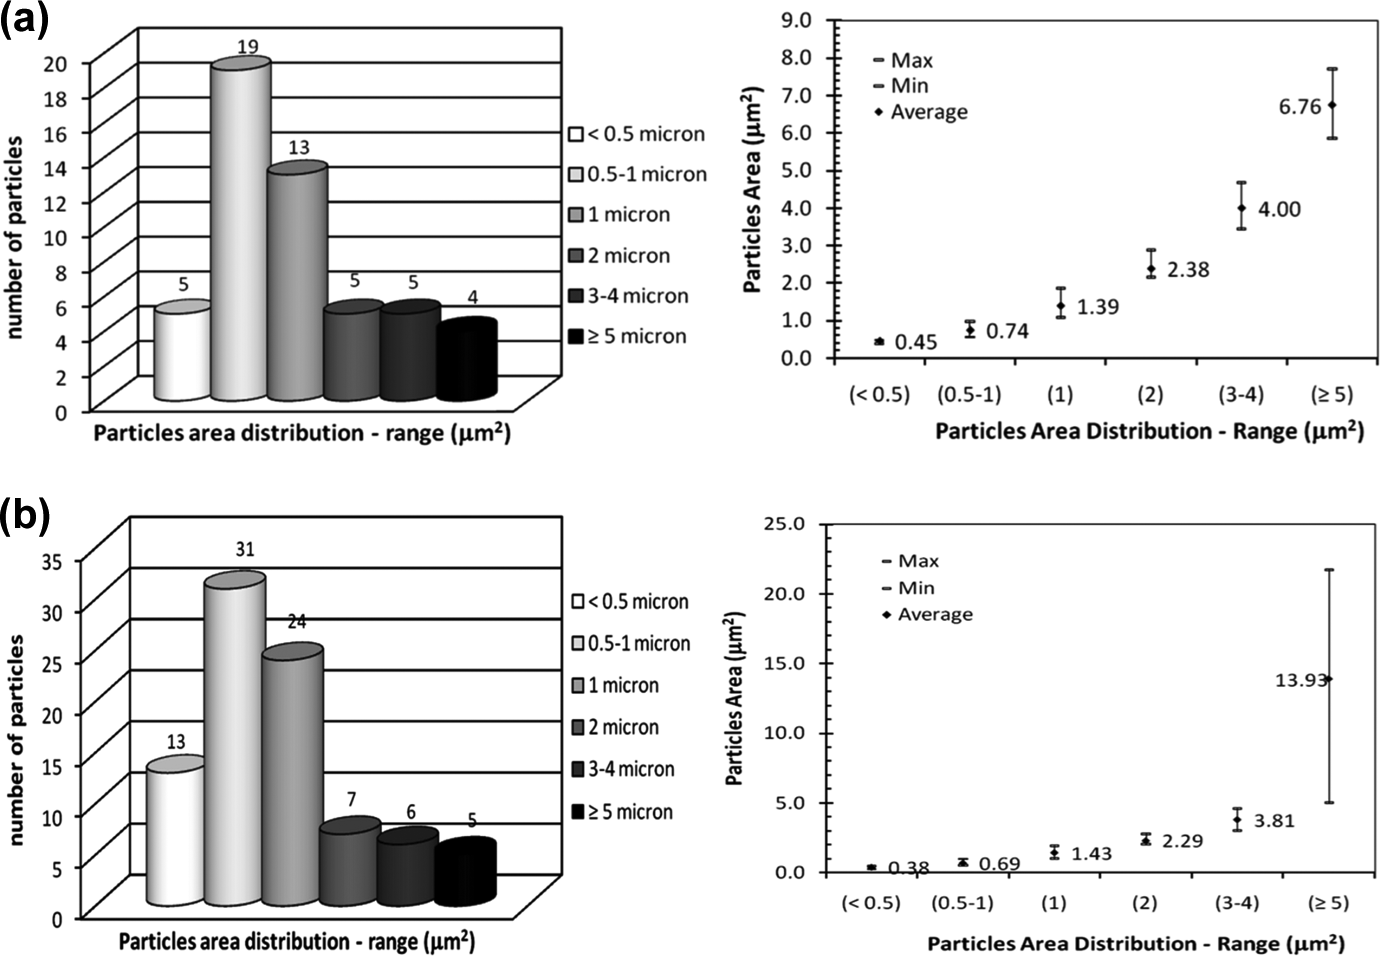
Distribution of the CaCO3 nanoparticle area in the nanocomposite samples: (a) CC-5 (scan image analysis result of Figure 1(a)) and (b) CC-15 (scan image analysis result of Figure 1(b)). CaCO3: calcium carbonate.
Thermal analysis
Figure 3 shows the DSC thermograms of PP/CaCO3 nanocomposites. The melting and crystallization behavior of the nanocomposites can be analyzed from the curves in Figure 3(a) and (b), respectively. From these curves, several parameters can be obtained such as melting temperature (T
m), percentage of crystallinity (X
c), and crystallization temperature (T
c). X
c can be calculated from equation (1)
29,30
: DSC thermograms of PP/CaCO3 nanocomposites: (a) melting curves (second heating scan) and (b) nonisothermal cooling curves (cooling scan). DSC: differential scanning calorimetry; CaCO3: calcium carbonate; PP: polypropylene.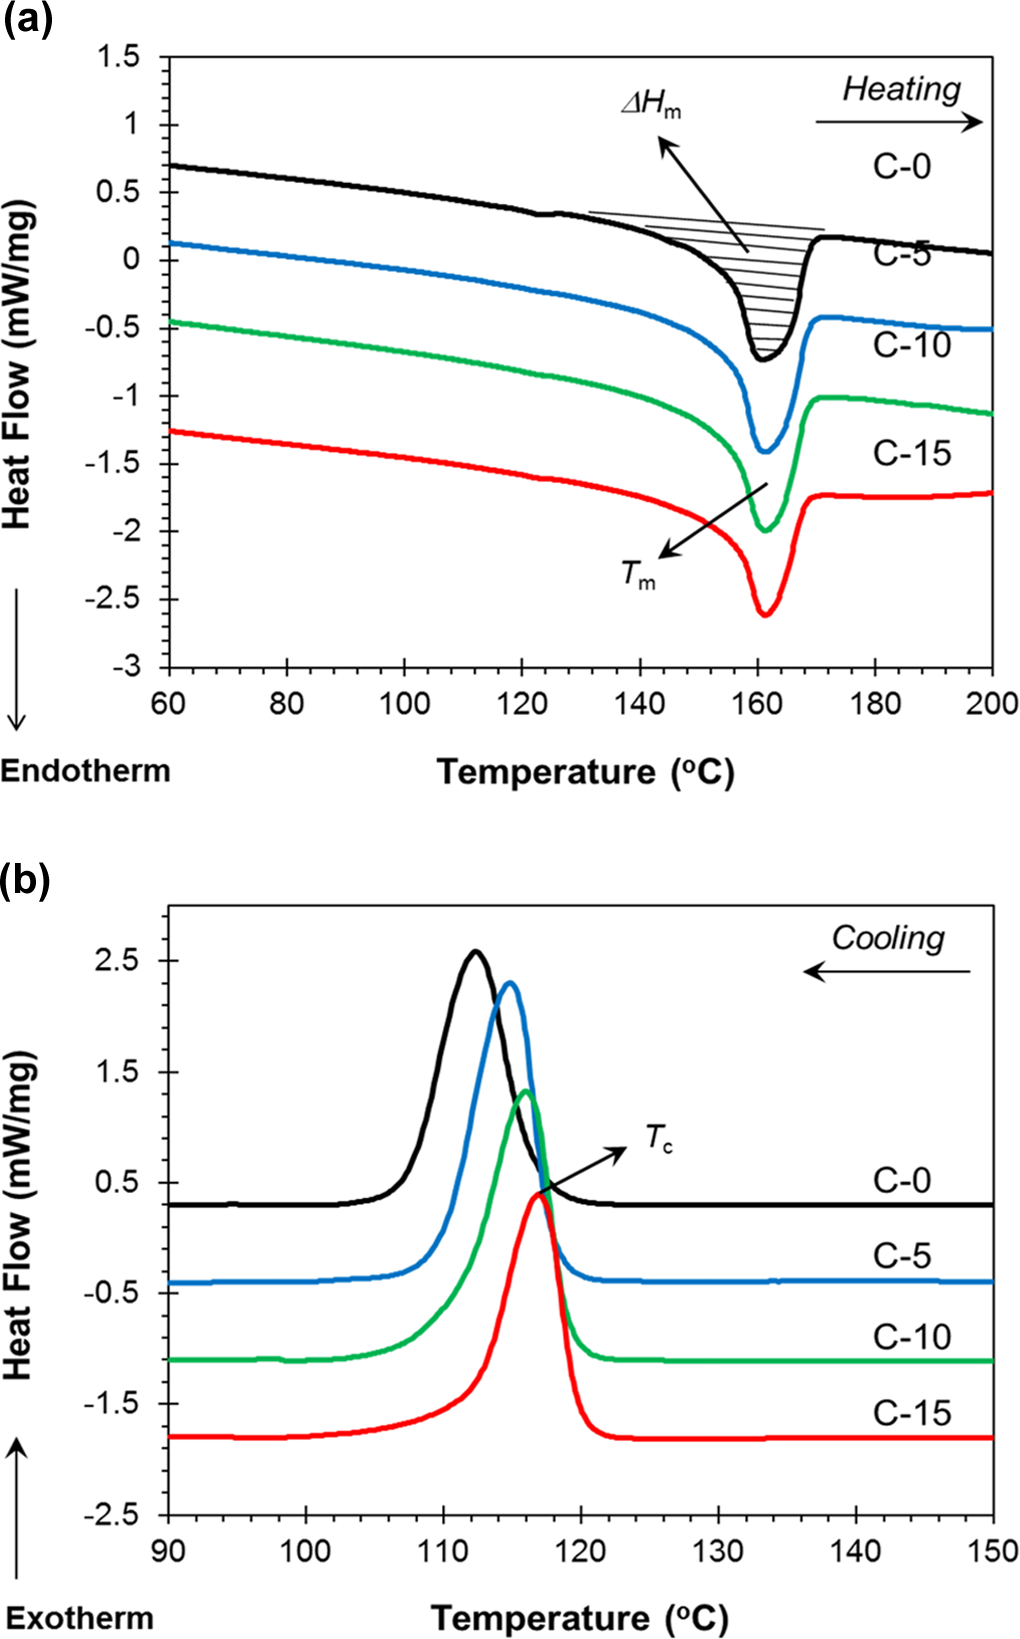

where,
All the parameters are listed in Table 3. As seen in Figure 3(a) and Table 3, the T m of the nanocomposites was not affected by the changes in nano-CaCO3 loading. On the other hand, X c value slightly increased with the addition of nano-CaCO3, which reached the maximum of 40.8% at 10 wt% nano-CaCO3 loading. This increase is most likely due to the nucleating effect of the CaCO3 fillers, which affected the crystallization of PP. 32 Thereafter, X c value decreased at higher concentration (15 wt%). The decrease of X c could be explained by the presence of large amount of the dispersed nano-CaCO3 fillers that could restrict the polymer chain mobility and, thus, retard crystal growth. 33 The combination of excessive nucleation sites by the dispersed nano-CaCO3 fillers and limited crystal growth is expected to produce small and imperfect spherulites. 32 Additionally, Figure 3(b) shows the DSC cooling curves of the nanocomposites. As seen in the figure and Table 3, the presence of nano-CaCO3 clearly affected the crystallization of PP. The value of T c of the nanocomposites shifted from 112°C to 117°C, indicating that nano-CaCO3 acted effectively as nucleating agent that promoted an earlier crystallization process. 8,9,27,34
Parameters of melting and crystallization properties of PP/CaCO3 nanocomposites.
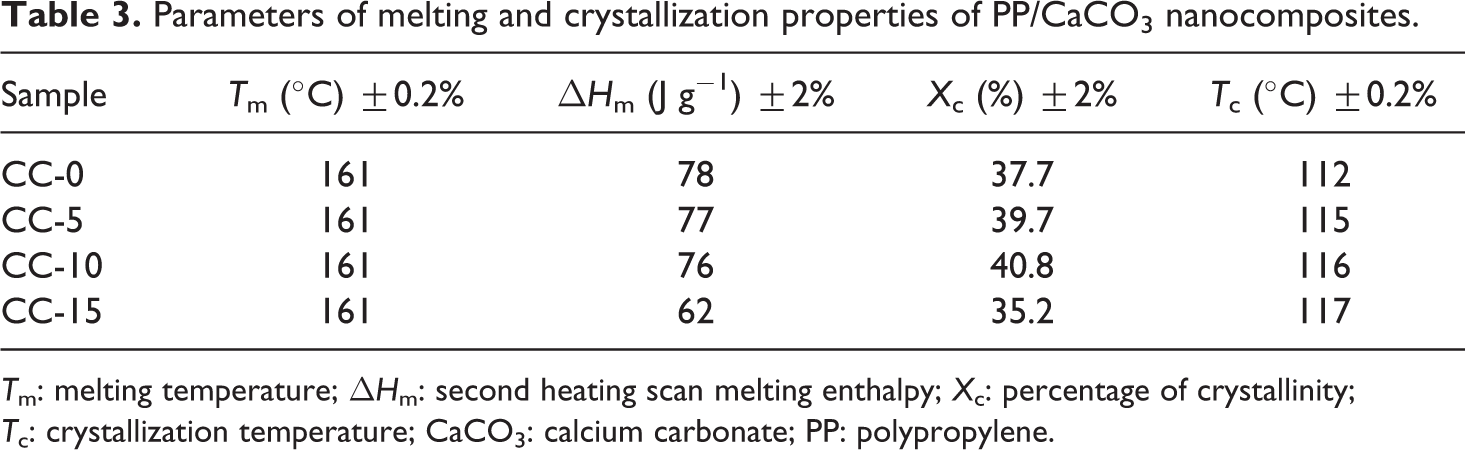
T m: melting temperature; ▵H m: second heating scan melting enthalpy; X c: percentage of crystallinity; T c: crystallization temperature; CaCO3: calcium carbonate; PP: polypropylene.
Melt rheological properties
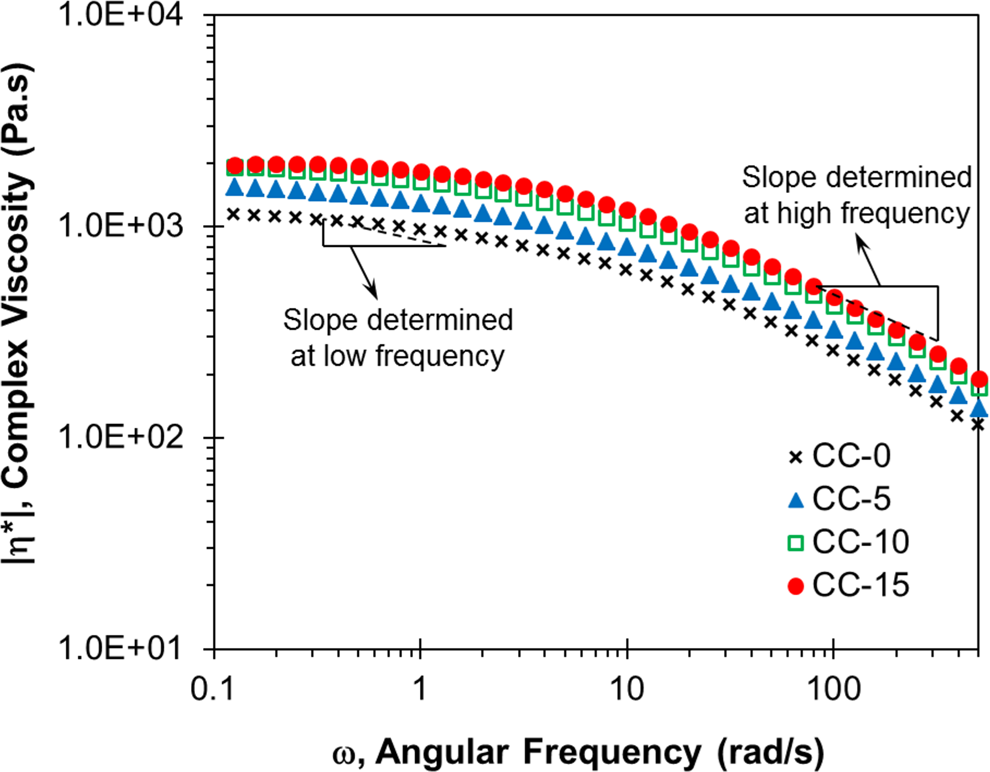
A melt rheological test was performed to analyze the effect of the nanofiller on the flow behavior of the nanocomposites. Figure 4 shows the melt complex viscosity
Dynamic
It is known that the melt rheological properties of nanocomposites may be directly related to the degree of dispersion of the nanofiller in the polymer matrix and the level of interfacial interactions between the nanofiller and polymer.
9
The increase in the complex viscosity was due to the restriction of molecular mobility and the reduction in free volume induced by the interaction and dispersion of nano-CaCO3 in the PP matrix.
18,35
The rheological response of the nanocomposites was also affected by the frictional interactions among the nanoparticles and between the polymer chains and the nanoparticles.
17
Thus, increasing the nano-CaCO3 concentration will increase the number of frictional interactions. Table 4 shows representative values of the
Representative complex viscosity of PP/CaCO3 nanocomposites at different angular frequencies.
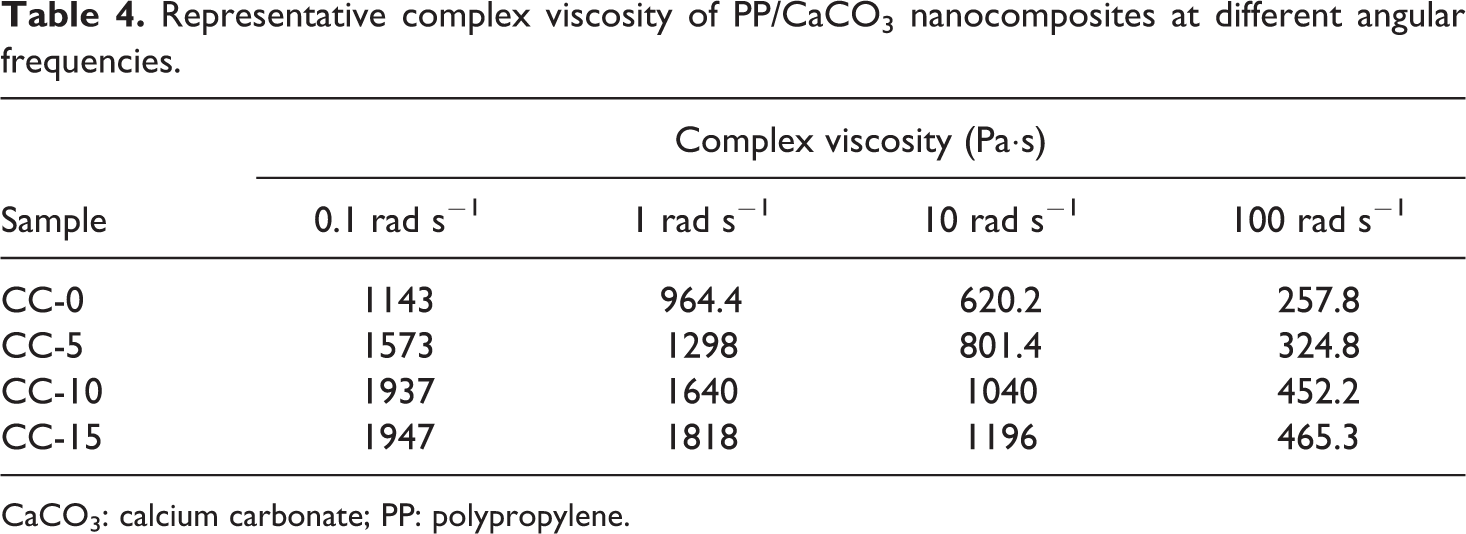
CaCO3: calcium carbonate; PP: polypropylene.
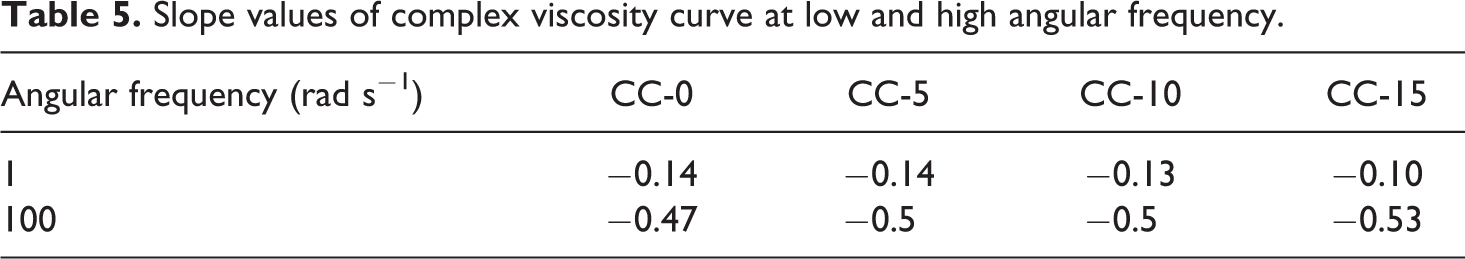
Additionally, all the curves in Figure 4 exhibited shear-thinning behavior. The curves can be divided into two regions: a low shear thinning rate at lower ω (0.1–10 rad s−1) and a high shear thinning rate at higher angular frequency (>10 rad s−1). Table 5 depicts the slope values of
Slope values of complex viscosity curve at low and high angular frequency.
Further results of the frequency sweep test are shown in Figure 5. As shown in the figure, G′ and G′′ of the PP/CaCO3 nanocomposites increased with increasing ω. To obtain more insight into the rheological properties of the nanocomposites, the relaxation spectrum was calculated from the experimental data for G′(ω) and G″(ω) (Figure 5).
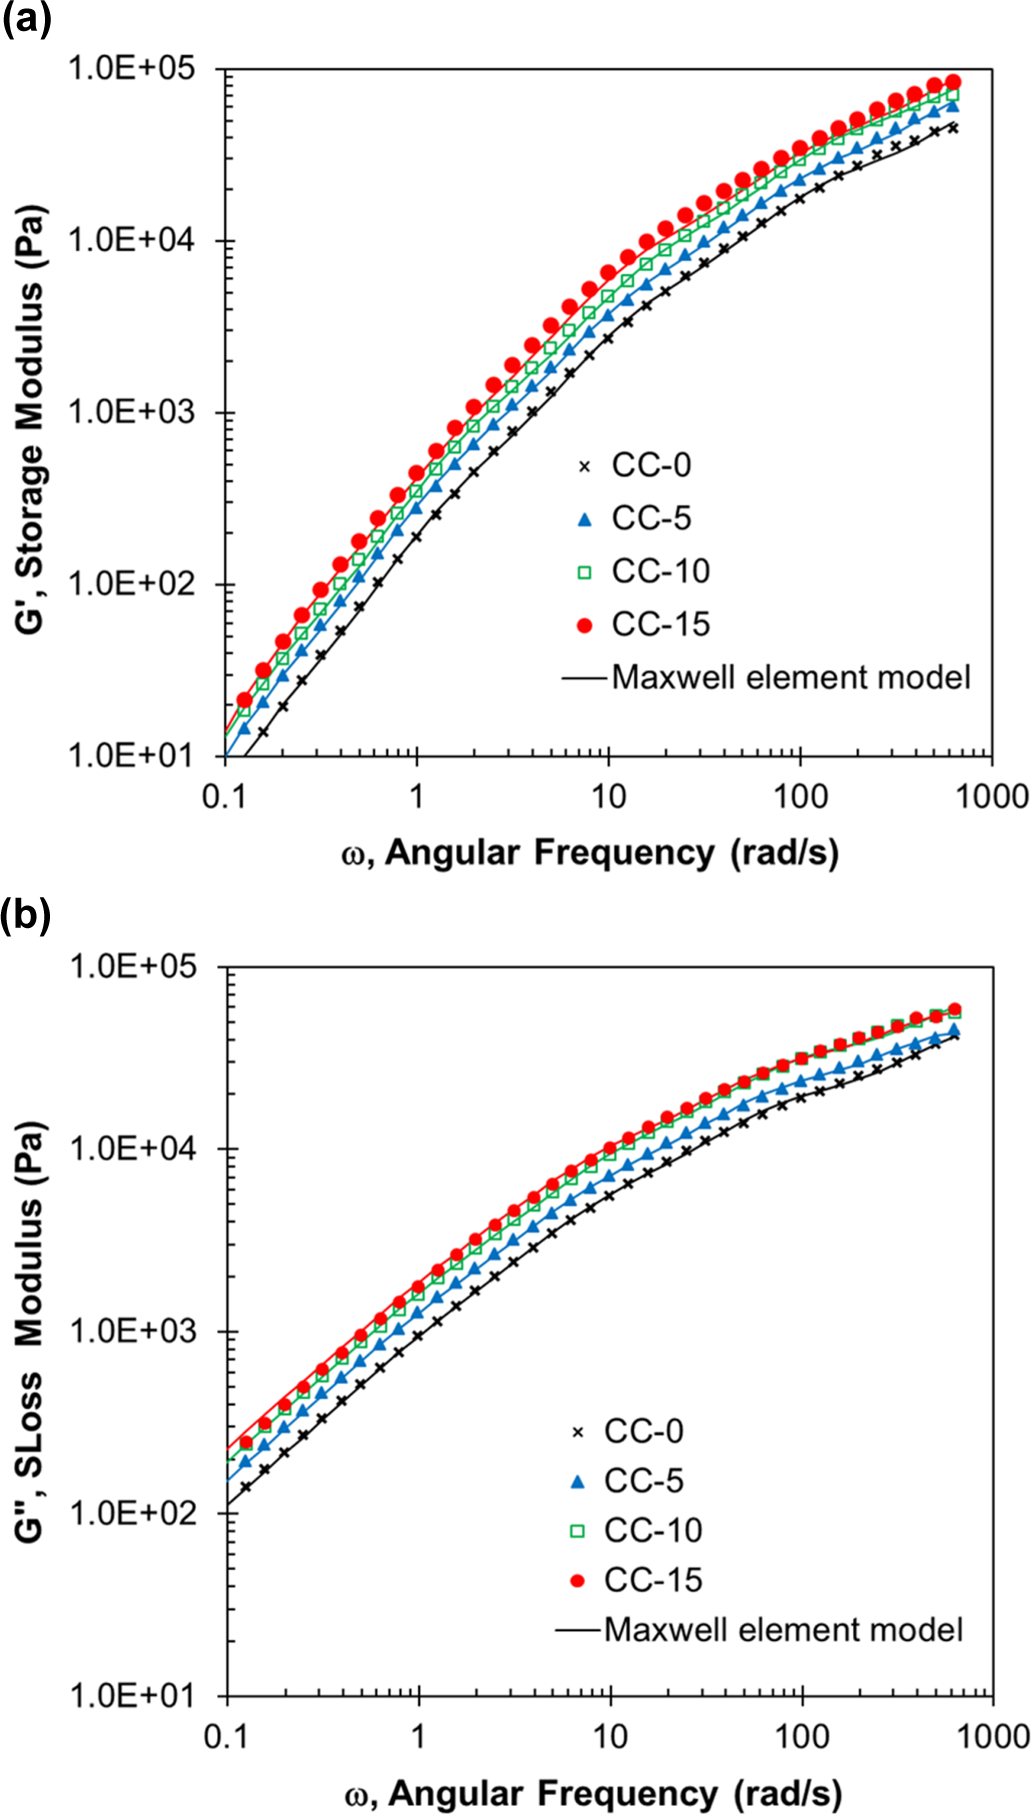
Dynamic modulus of (a) storage modulus and (b) loss modulus versus ω of the PP/CaCO3 nanocomposites. The solid line represents the fitting data obtained using a five-element Maxwell model. ω: angular frequency; CaCO3: calcium carbonate; PP: polypropylene.
In this work, the relaxation spectrum was treated as discrete. Using a generalized Maxwell model, we can write the dynamic modulus as a sum of the contributions of n individual Maxwell elements, which can be expressed by equations (2) and (3)
38
:

where N is the total number of discrete relaxation modes. Discrete relaxation is defined by the relaxation spectral strength g
n (in pascal) and the relaxation time λ
n (in seconds), a measure of the time required for stress relaxation. The number N itself also represents the total number of Maxwell elements. The choice of N is crucial for the success of the calculation. The values of g
n and λ
n were derived numerically by optimization or by using approximation methods with the experimental data. The numerical calculation was performed using the commercial software “MATLAB” (MathWorks, Natick, Massachusetts, USA). The standard procedure of minimizing the root mean square error was used. In this work, the average error was calculated using equation (4)
38
: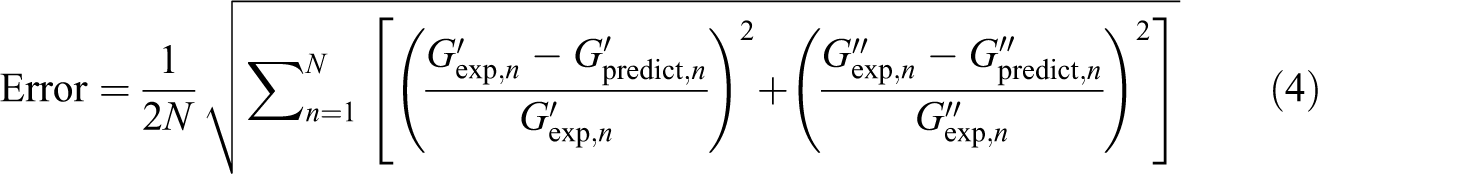
where 
The parameter values of the discrete relaxation spectra, g n and λ n, for the PP matrix and its nanocomposites are presented in Table 6 and plotted in Figure 6 together with the relaxation modulus, G(t). The addition of nanoparticles to polymeric materials usually leads to an increased elasticity of the material. 36 In the PP/CaCO3 nanocomposites, this effect was indicated by the delay of complete polymer stress relaxation.
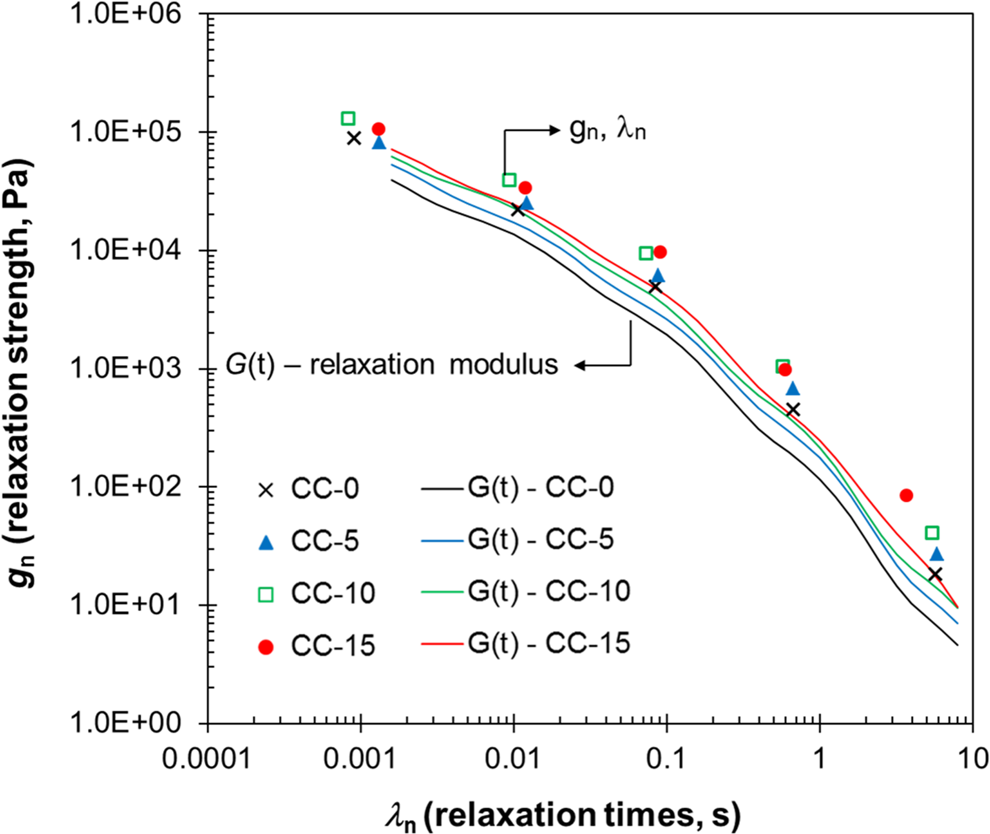
Discrete relaxation spectrum calculated numerically from the data in Figure 5. The corresponding relaxation modulus is calculated from the discrete spectrum.
Parameters of discrete relaxation spectrum for PP matrix and its nanocomposites
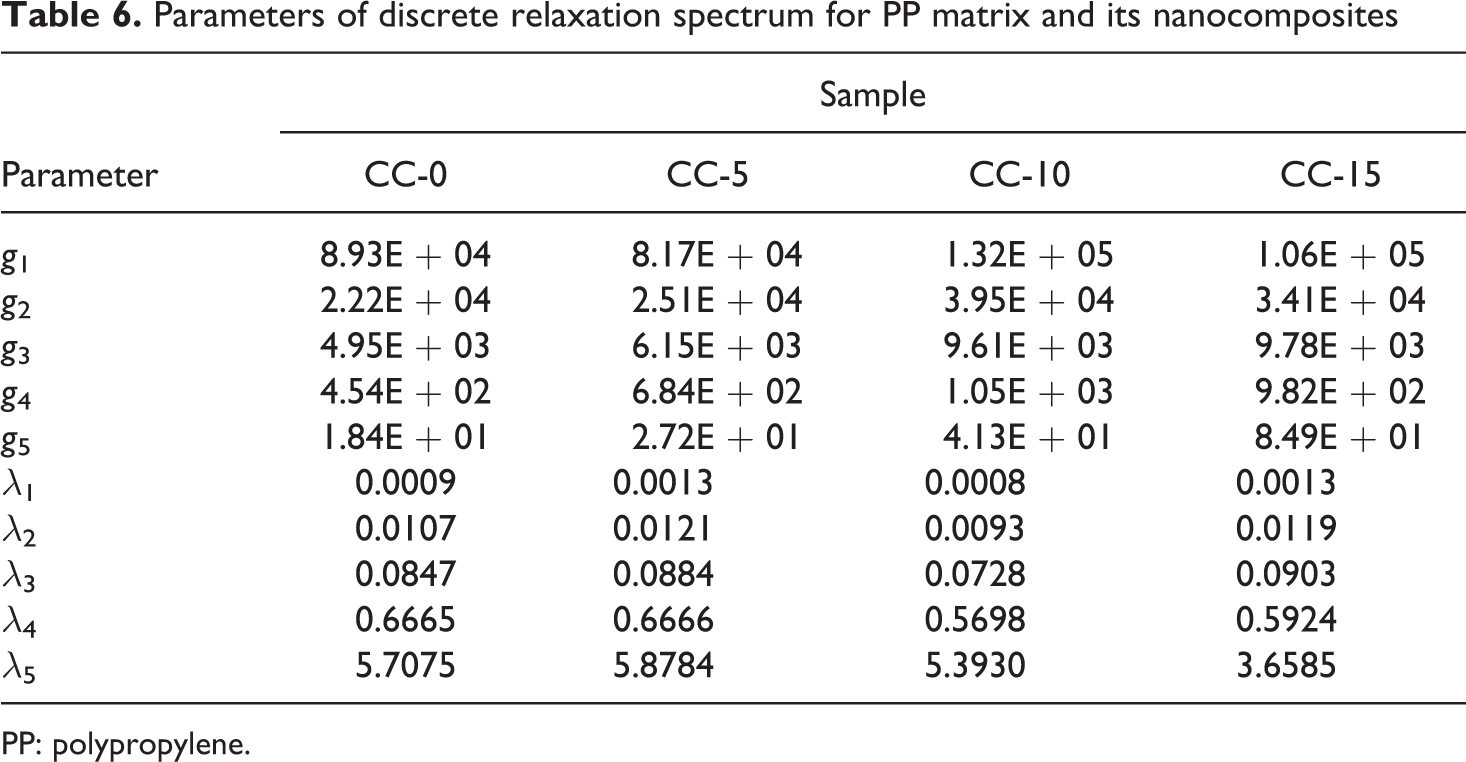
PP: polypropylene.
As shown in the figure, the relaxation time of the nanocomposites was higher than that of the PP matrix at the same relaxation strength point and increased with nano-CaCO3 loading (see solid lines in Figure 6). This result indicates that the relaxation time (which is the time required for stress relaxation) of the nanocomposites was longer than that of the neat PP, due to the restricted molecular mobility induced by the presence of CaCO3 nanoparticles in the PP matrix. This increase in the relaxation times is usually observed in nanocomposites in which the nanoparticles are well distributed in the polymer matrix. 16,18,28
Solid viscoelastic properties
Figure 7 shows the effect of temperature and nanofiller loading on the thermomechanical (viscoelastic) properties of the nanocomposites. The value of G′, which resembles the stiffness of the material, is plotted against temperature in the range of 40–160°C. As shown in the figure, G′ value increased as the nano-CaCO3 concentration increased, indicating a considerable improvement in the stiffness. To provide more insight into the enhancement effect of nano-CaCO3 on the stiffness of the PP matrix, some representative G′ values of PP/CaCO3 nanocomposites at temperatures of 30, 60, 100, and 130°C are listed in Table 7. For example, the G′ value of neat PP (CC-0) was approximately 151 MPa at 60°C and those of the PP/CaCO3 nanocomposites were approximately 175, 182, and 190 MPa at nano-CaCO3 loadings of 5, 10, and 15 wt%, respectively. The enhancement in the stiffness was approximately 15–25% compared with the neat PP. The improvement in G′ can be explained by the randomly distributed and dispersed CaCO3 nanoparticles, which can restrict the chain mobilization in the PP matrix as a result of the interaction between CaCO3 and the PP matrix. Thus, the overall stiffness of the nanocomposites is increased. 14,32,36,37
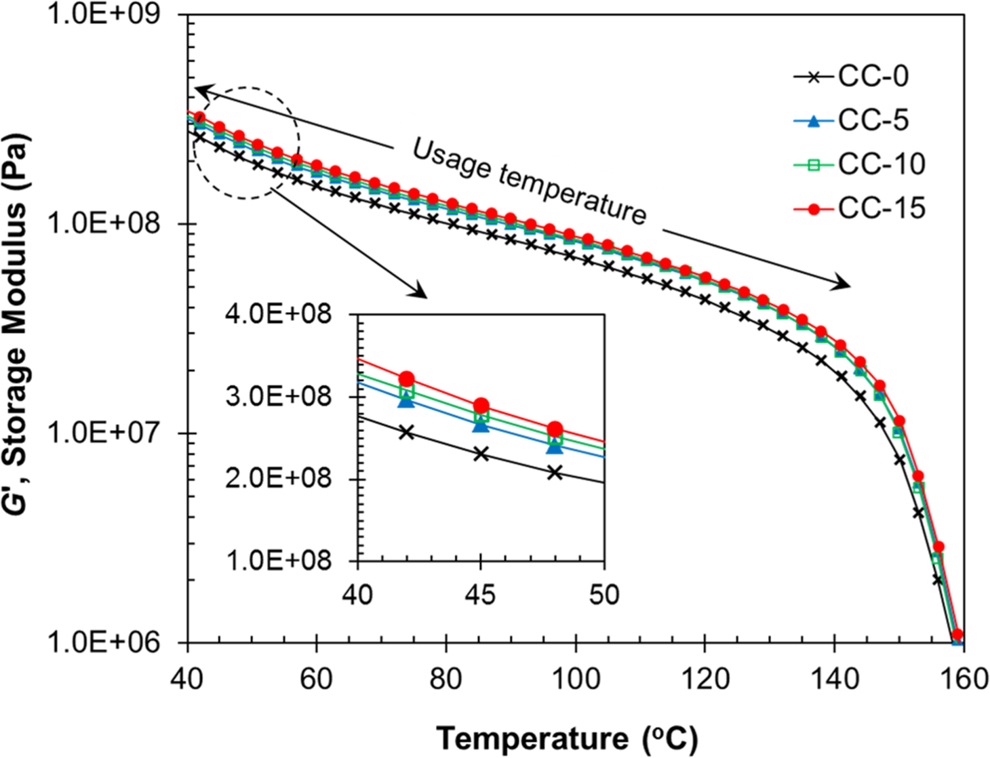
G′ versus temperature of PP/CaCO3 nanocomposites. G′: storage modulus; CaCO3: calcium carbonate; PP: polypropylene.
Representative G′, G′ of PP/CaCO3 nanocomposites at different temperatures.
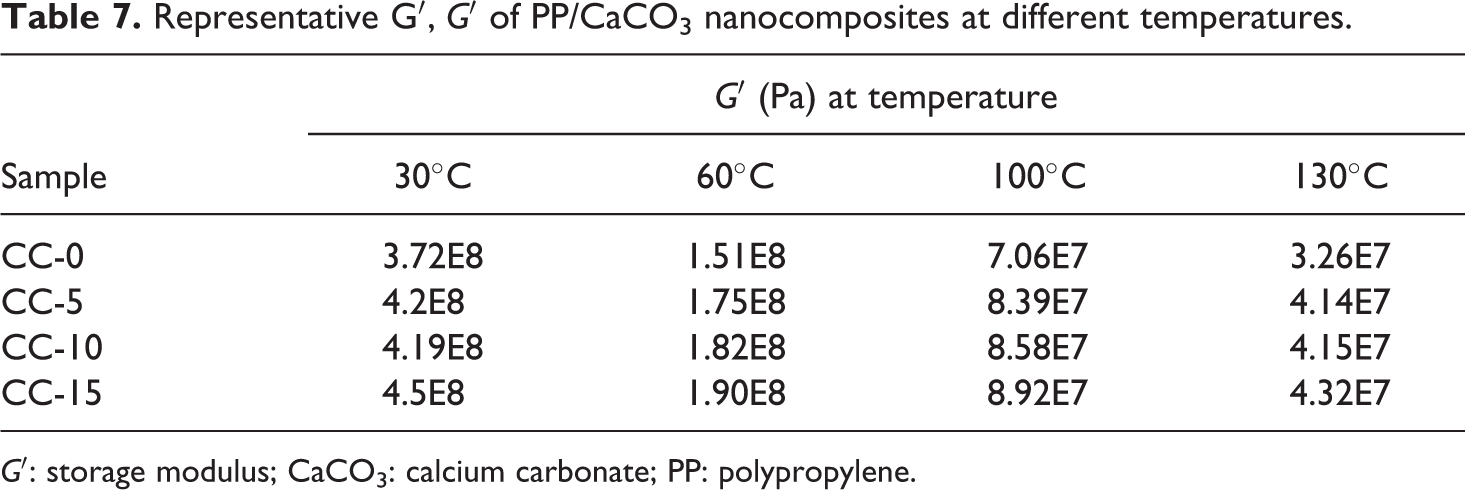
G′: storage modulus; CaCO3: calcium carbonate; PP: polypropylene.
The relationship between G′, the percentage of nano-CaCO3 concentration (%) and the temperature (T) can be expressed by equation (6) as follows:
where G′ is the storage modulus as a function of temperature and nano-CaCO3 loading in weight percentage. The constants X and Y are determined by fitting the experimental data that is presented in Table 7. Our fitting showed that the parameter X (in mega pascal) was a function of the nano-CaCO3 concentration, as described by equation (7):
Parameter Y (1/K) was found to be independent of the nano-CaCO3 concentration; it had a value of −0.02361 for the nanocomposites studied in this work.
Additionally, the PP/CaCO3 nanocomposites showed a slight improvement in the usage temperature of the material. The usage temperature of the material was determined by the flat region of the G′ curves (Figure 7). For example, if a modulus of 150 MPa is the design criterion of a certain application (e.g. auto parts), then PP/CaCO3 composites (CC-15) will achieve this modulus at a temperature of 72°C, which is 12°C higher than that for neat PP (60°C). In general, all the curves in Figure 7 exhibited similar behavior, in which the G′ rapidly decreased at higher temperatures (>140°C). This behavior could be attributed to the less restricted and higher molecular mobility of the polymer chains at high temperature.
14
To clarify the significantly enhanced thermomechanical properties of the PP/CaCO3 nanocomposites, the normalized G′ of the PP/CaCO3 nanocomposites relative to neat PP
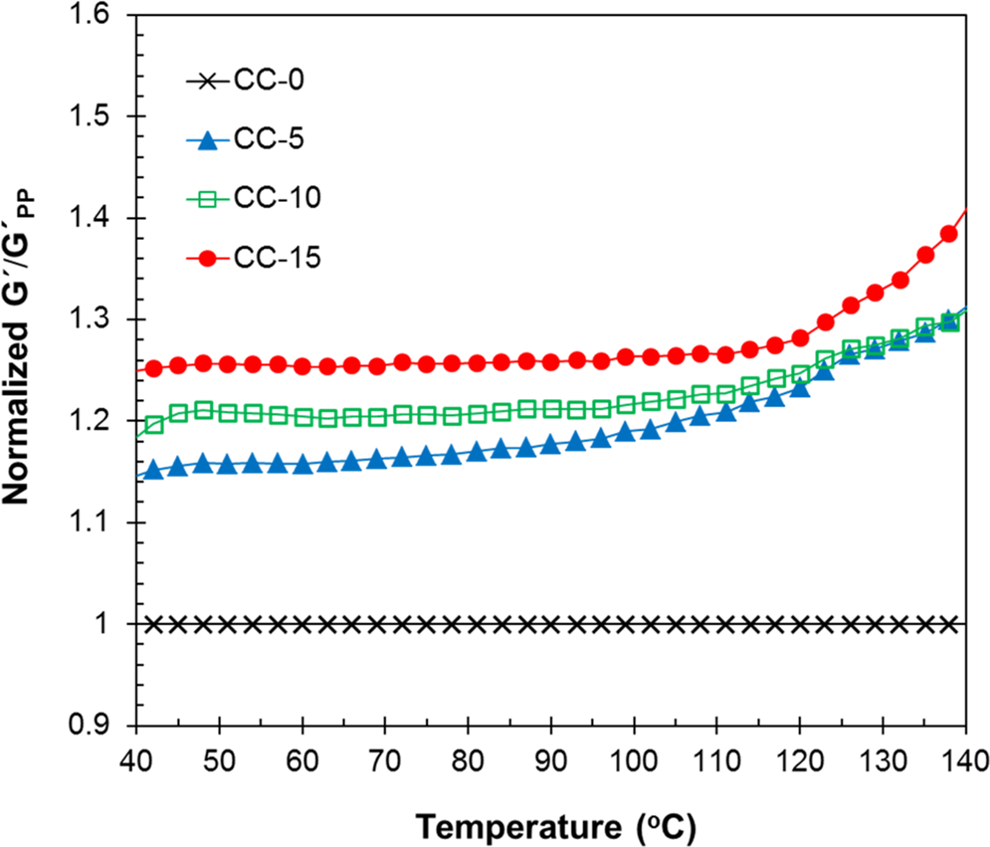
Normalized dynamic storage modulus,
Mechanical properties
Tensile test
The influence of the addition of nano-CaCO3 on the tensile properties of the PP/CaCO3 nanocomposites is discussed in this section. Figure 9 shows typical stress–strain curves resulting from the tensile test for neat PP and its nanocomposites. Table 8 shows some of the tensile properties (e.g. E value, tensile strength, toughness, and ultimate strain) that were generated from Figure 9. The data are the means of three runs. Among the properties, the E value (Young’s modulus) and the tensile strength have primary importance, which give information about the stiffness and the maximum allowable load. For polymer/CaCO3 nanocomposites, the higher the nano-CaCO3 concentration, the higher is the tensile modulus in general, while the tensile strength decreases or increases depending, to a great extent, on the level of dispersion and the interfacial adhesion between the matrix polymer and the nano-CaCO3 fillers. 9,32
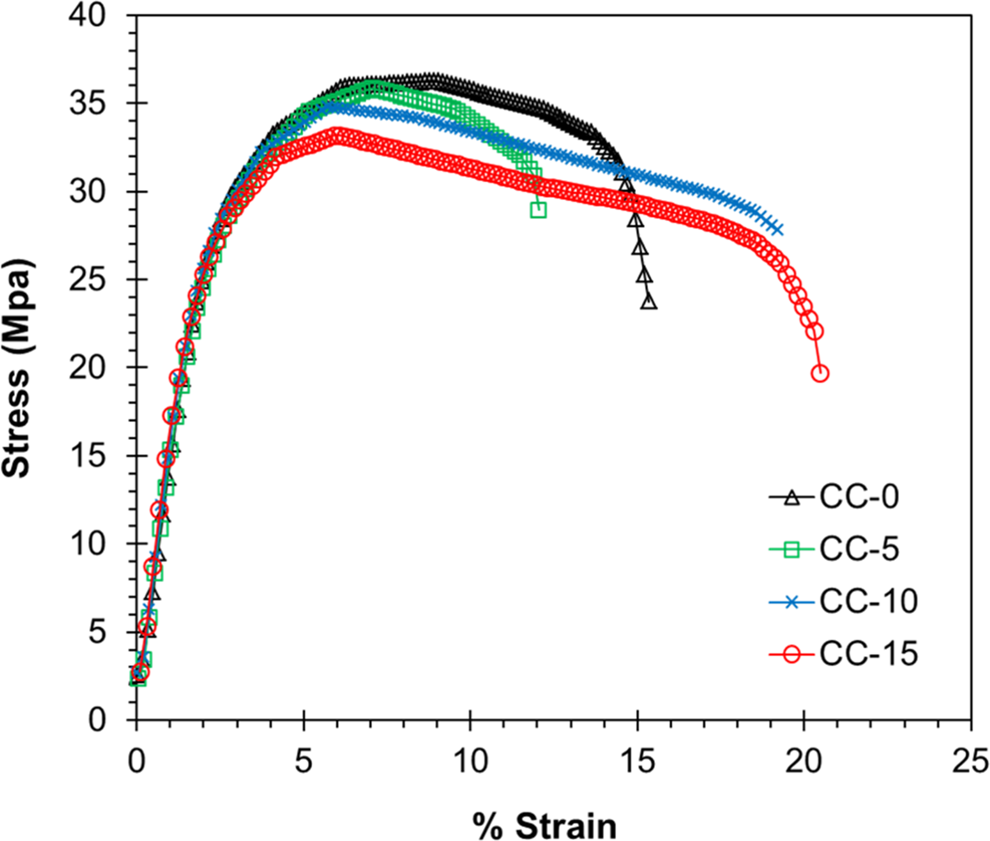
Typical stress–strain curve of PP/CaCO3 nanocomposites. CaCO3: calcium carbonate; PP: polypropylene.
Tensile properties of PP/CaCO3 nanocomposites.
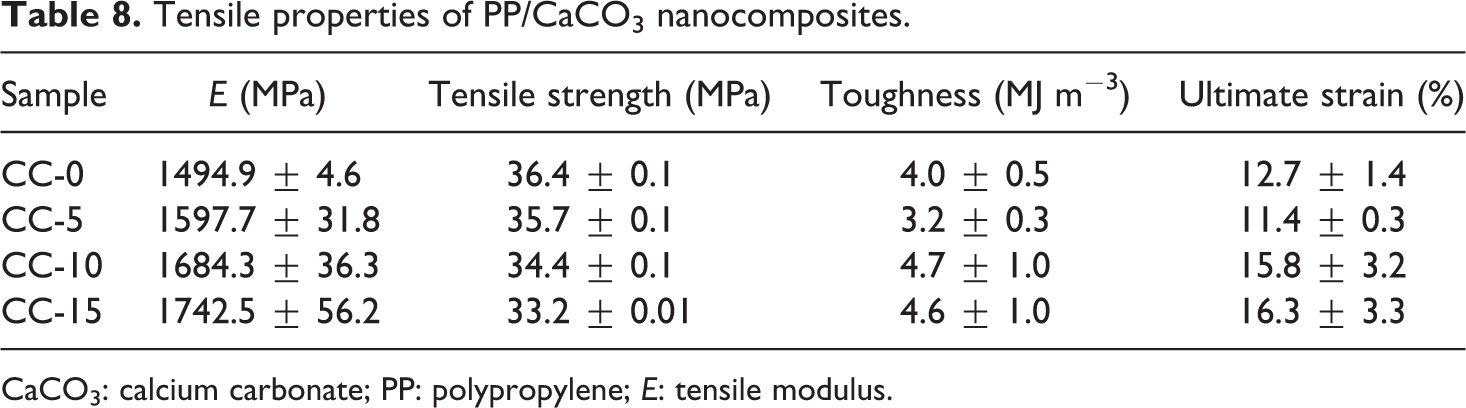
CaCO3: calcium carbonate; PP: polypropylene; E: tensile modulus.
As shown in the table, there was an improvement in the value of E, which could be attributed to the stiffness level of the material. The stiffness is an important property of nanocomposites and one of the major reasons for using a nanofiller. 21 The linear relationship between the tensile modulus and the CaCO3 weight percentage is shown in Figure 10(a). The tensile modulus of the PP/CaCO3 nanocomposites increased with the addition of nano-CaCO3. The improvement in E was approximately 6.9, 12.7, and 16.6% for CC-5, CC-10, and CC-15, respectively. Despite the presence of a few CaCO3 agglomerates, CC-15 still gave the highest improvement in the modulus/stiffness. It has been reported that the tensile modulus is not significantly affected by a few filler agglomerates. 15 Leong et al. 22 investigated the mechanical properties of talc-, kaolin- and CaCO3-filled PP composites and postulated that the value of E has a very weak dependence on the particle shape, the specific surface area of the fillers, and the interaction (adhesion) between the polymer matrix and the fillers because E is a low-strain property, that is, it is measured before any significant plastic deformation occurs (see Figure 11). In a low-strain zone, the adhesion between the polymer matrix and the filler remains intact. Thus, the improvement in the E value was most likely due to (1) the stiff nature of nano-CaCO3 filler and (2) the restricted molecular mobility and the deformability of the PP matrix caused by the interaction and good dispersion of nano-CaCO3 fillers in PP matrix. 15,21,22 Similar results have been reported in other studies. 5,9,15,21
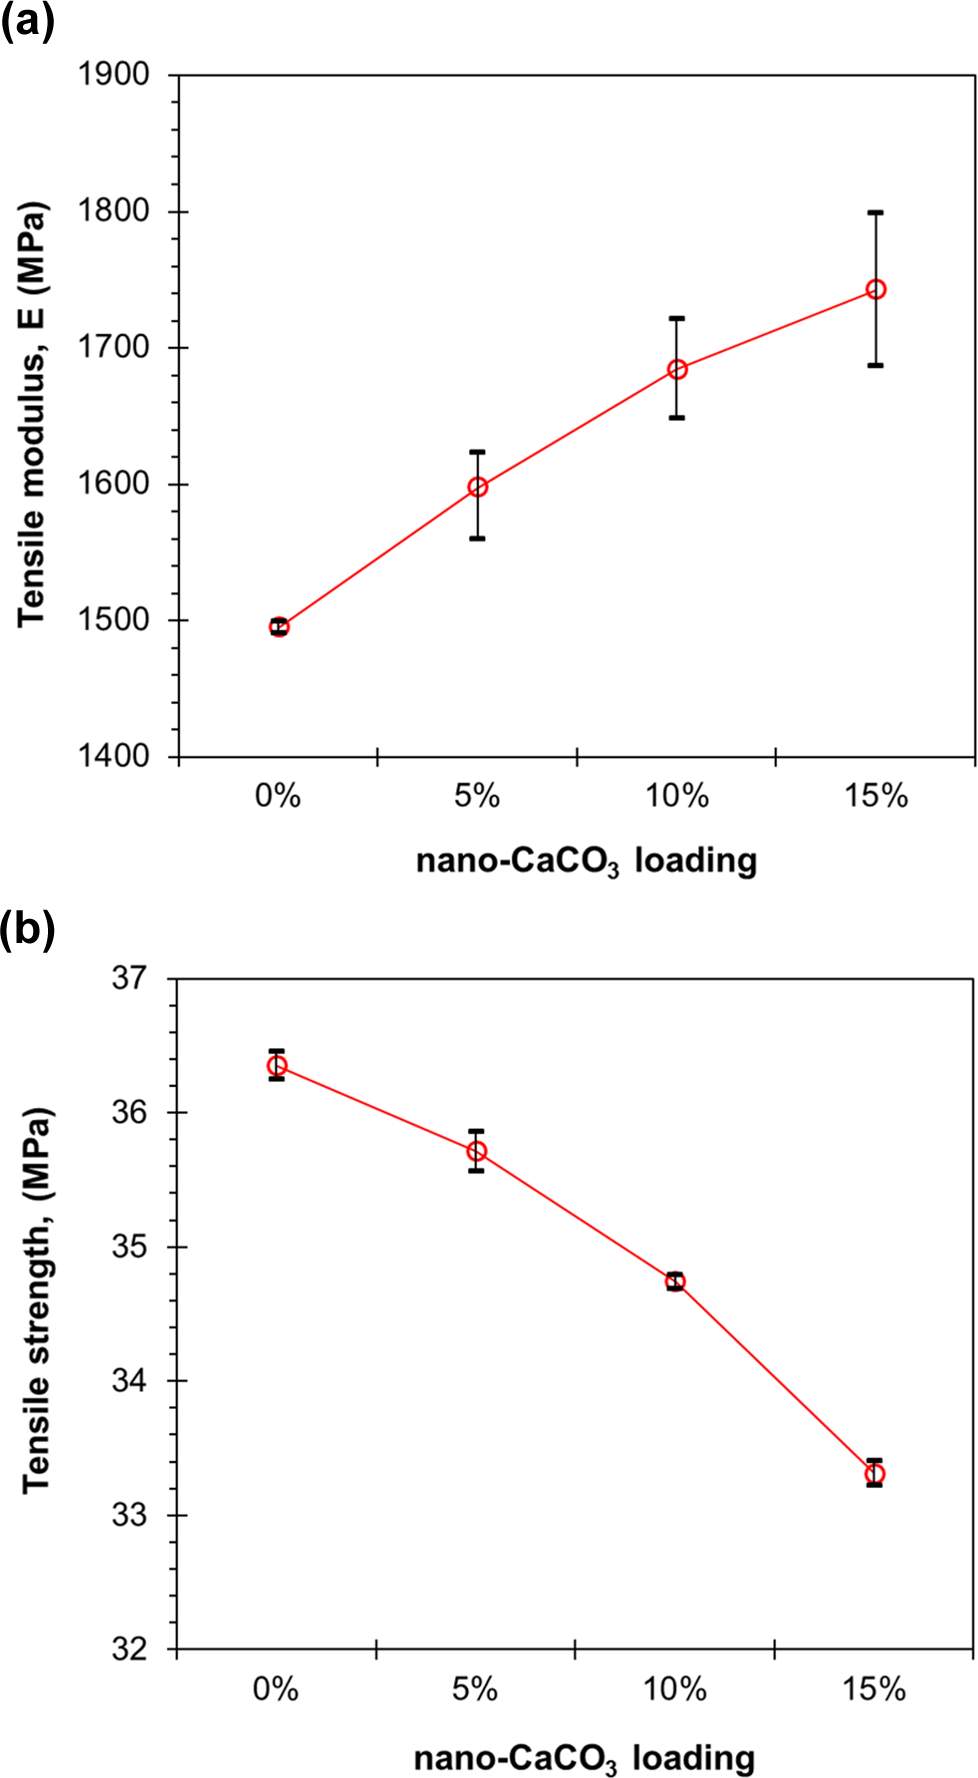
Tensile properties: (a) E and (b) tensile strength of PP/CaCO3 nanocomposites at different nano-CaCO3 loadings. E: tensile modulus; CaCO3: calcium carbonate; PP: polypropylene.
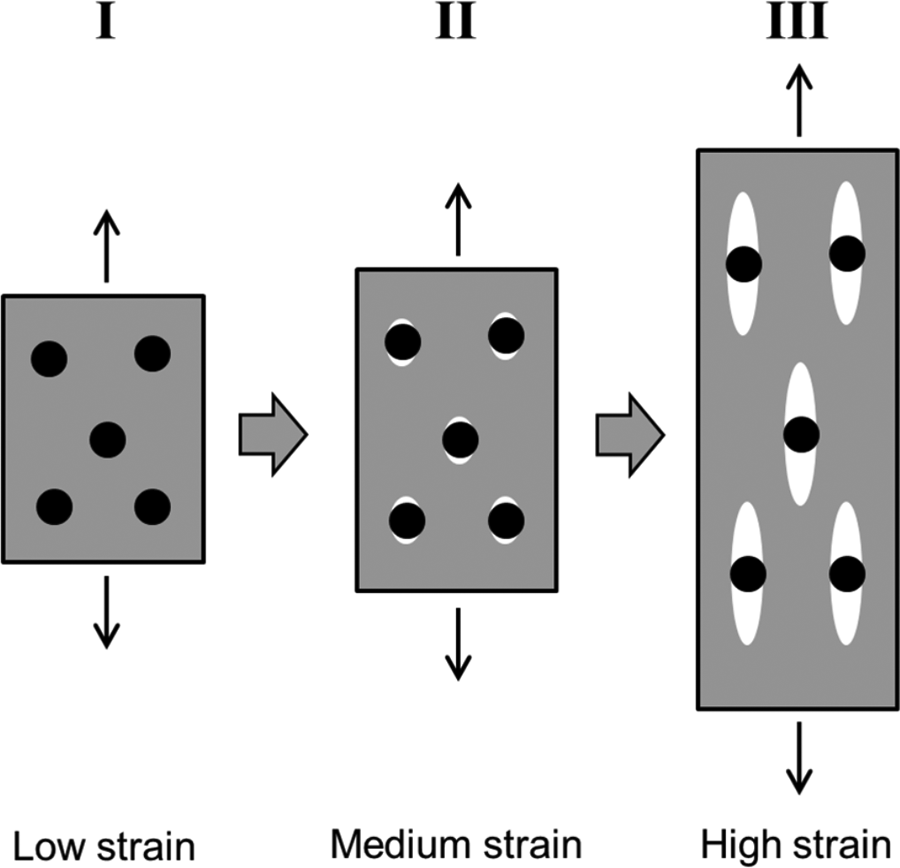
Micromechanism stages of toughening with rigid particles. Adopted from Zuiderduin et al. 21
Another tensile property, the tensile strength (here taken at the peak stress), is shown in Figure 10(b) as a function of CaCO3 loading. In contrast to E, the tensile strength was measured at a considerable strain, which gave a different dependency of the mechanical properties on the filler loading and the interfacial adhesion between the polymer and the filler. 21 The tensile strength (yield point) of the PP matrix was observed at approximately 36.4 MPa and 9% strain. According to the figure, the tensile strength decreased monotonically with increasing nano-CaCO3 loading.
The decrease in the tensile strength was most likely due to the debonding of CaCO3 nanofillers from the PP matrix. Debonded fillers do not contribute to the tensile strength. The rigid CaCO3 nanofiller may act as a stress concentrator due to its different elastic properties compared with the polymer matrix. Stress concentration will cause increased triaxial stress around the nanofiller and will result in debonding at the polymer–filler interface. From the morphological study, Figure 1(d) (sample CC-15) shows that there are still a few small aggregates present in the PP matrix. Additionally, tensile strength greatly depends on the interfacial adhesion between the matrix and the fillers because it is a medium–high-strain property (see Figure 11). The increase of CaCO3 loading may result in weak interfacial adhesion between the matrix and the polymer due to the high tendency of nanofiller to agglomerate. When the adhesion is low, the agglomerated filler will be easily debonded from the matrix and cannot bear the external stress, which results in a decreased tensile strength. 23 The tensile strength dropped to 33.2 MPa for CC-15, a decrease of 8.6% compared with neat PP. In the literature, Zuiderduin et al. 21 reported that the yield stress of composites dropped to 28.8 MPa with 30 wt% CaCO3 loading, a decrease of 18.6%. Similar findings have been reported by numerous researchers. 21,23 –25
Additionally, for a polymer reinforced by a rigid filler, debonding at the polymer–filler interface can induce multiple crazing, shear yielding, or crazing with shear yielding. 21,23 Although not clear, Figure 12 shows evidence indicating crazes in the nanocomposite samples, which were typified by a whitening of the crazed zone (cf. arrows as examples). The crazes propagate in the direction perpendicular to the tensile load and across the whole gauge length of the nanocomposite samples. All the samples were fractured without necking. The rigid CaCO3 nanofiller seems to be quite effective in initiating crazes. 26 When the CaCO3 loading increases, the craze density also increases. Crazing is a dilative process and represents a mode of localized plastic deformation rather than mechanical cracking of the matrix polymer. 40,41 Plastic deformation is the main energy-absorbing process. 40,42 Prior to cracking, a craze growth process can absorb the fracture energy and thus increases the toughness of the nanocomposites. Nevertheless, large aggregates are definitely a disadvantage for the toughening mechanism because they will create a large stress and can act as precursors for cracks. Figure 13 shows a schematic of the craze formation. Similar observations have been reported in other studies. 21,23
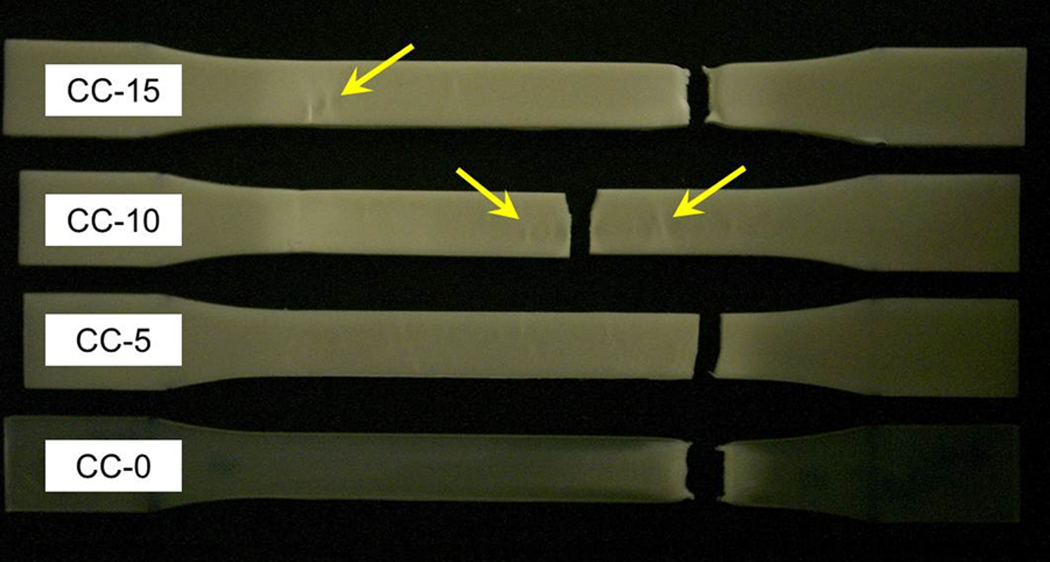
Photograph of nanocomposite samples, post tensile test.
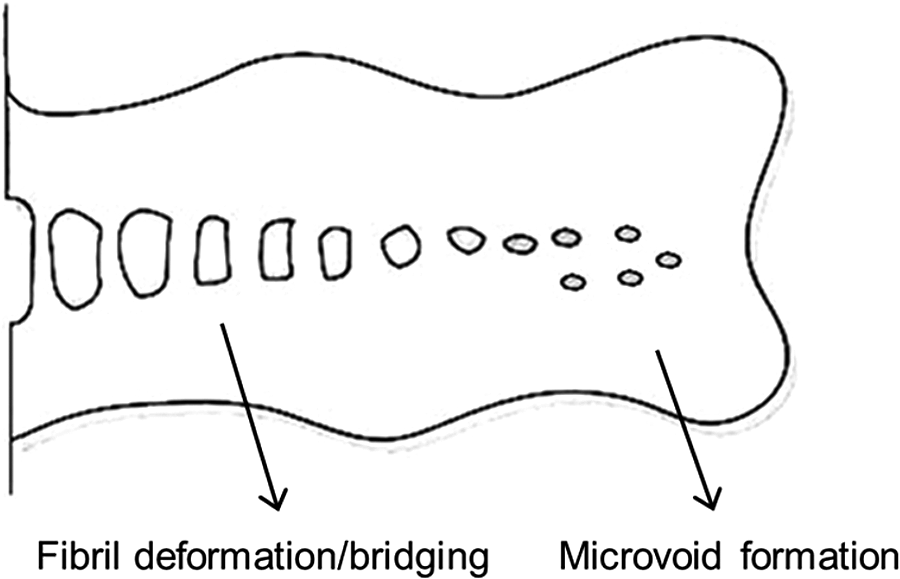
Schematic representation of craze formation.
The ultimate strain or elongation at break shows a maximum value at 15 wt% of nano-CaCO3 but the large deviation should be noted. As mentioned in the thermal analysis section, the presence of nano-CaCO3 fillers resulted in small and imperfect spherulites. The reduction of spherulites size and the disappearance of sharp interfaces among spherulites favored the increase of ultimate strain. Neat PP has a low ultimate strain and brittle behavior because of the sharp interfaces among spherulites, which acted as defects during the tensile test. Another literature reported that the elongation at break showed a maximum at 10 wt% of CaCO3. 32 Additionally, the craze growth process is also responsible for the increase of elongation at break.
In this article, the tensile test results (i.e. E and the tensile strength) were compared with several well-known equations and models. To use the models, we convert the weight percentages of CaCO3 into a volume fraction (V
F) using equation (8)
10
:
where V
F is the volume fraction of the CaCO3 filler, ρ
C is the density of the nanocomposites, ρ
F is the density of the CaCO3 filler, and W
F is the weight percentage of the CaCO3 filler. A simple model for predicting E of the nanocomposites system was proposed by Einstein as described in equation (9)
17,43
:
where E
C and E
M are the tensile modulus of the composite and the matrix, respectively, and V
f is the volume fraction of the nanoparticles. Another equation used to predict E of spherical filler-reinforced composites was proposed by Guth.
15,44
This equation is a further modification of the Einstein equation and is defined by equation (10) as follows:
The terms are the same as mentioned above. For rigid spheres, k
E has a value of 2.5. In our case, the CaCO3 nanoparticle was assumed to be a rigid spherical particle. It has been reported that equation (10) is only valid for composites with a certain loading of spherical fillers. If the filler loading is above 10 vol%, the modulus will be higher than that given by equation (10), which is attributed to the network formation caused by the spherical filler chains.
15,45
The modulus may also be estimated using the inverse of the “rule of mixtures,” which is defined by equation (11) as follows:
where E
F is the modulus of the filler, while the other terms are the same as mentioned above. This equation has been reported as acceptable for rigid spherical particles.
15
Another model, called the Kerner equation, can also be used to predict the modulus of the nanocomposites and is defined by equation (12) as follows:
where ν is the Poisson ratio of the matrix, which is assumed to be approximately 0.45 for PP.
46
Additionally, to predict the tensile strength of particle-filled composites, the well-known Nicolais–Narkis model (equation (13)) can be used.
37

where σ C and σ M are the tensile strengths of the composite and the matrix, respectively, and V f is the volume fraction of the nanoparticles. Figure 14 illustrates a comparison between the experimental data and the predicted values of E and the tensile strength based on the equations above. As shown in Figure 14(a), the experimental values of the tensile modulus agree quite well with all of the models except for the inverse rule of mixtures, which indicates that the inverse rule of mixtures is only applicable when there is a strong adhesion between the matrix and the filler. Additionally, the Guth model was found to be the most accurate in predicting the value of E of the nanocomposites. For the tensile strength, the Nicolais–Narkis model fit the experimental result very well (see Figure 14(b)).
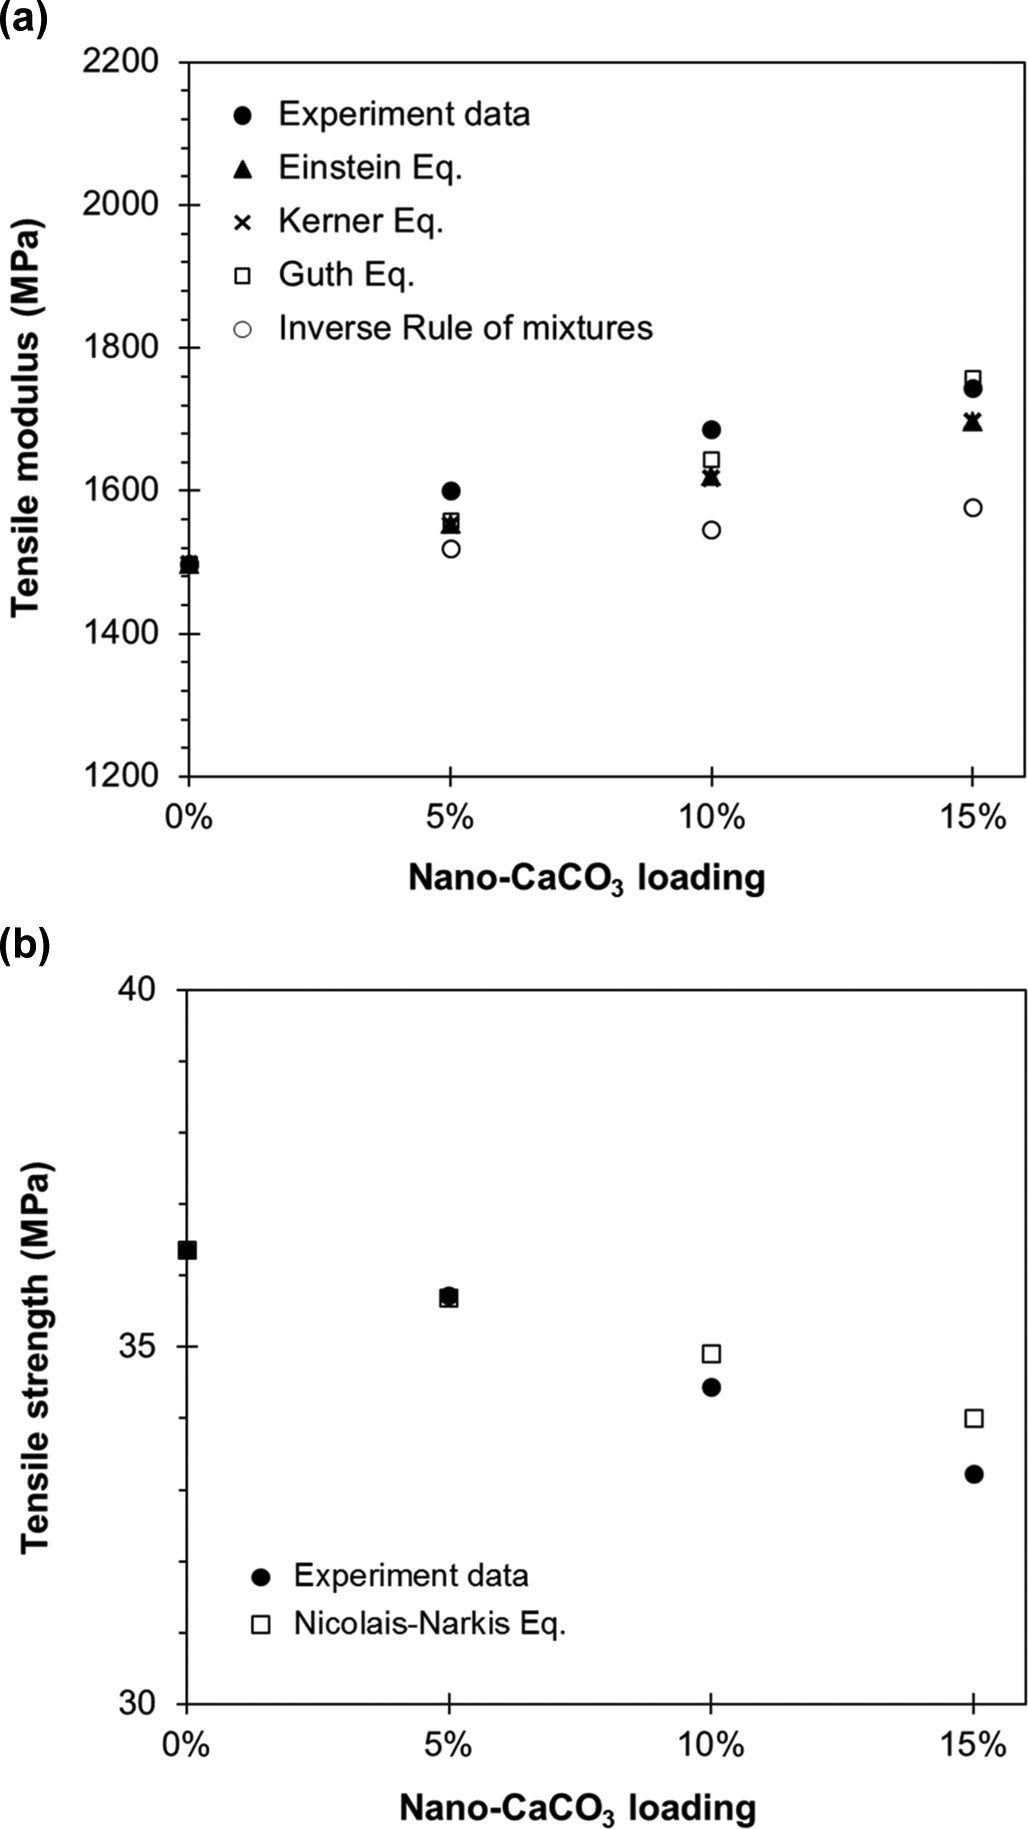
Comparison of the experimental and theoretical tensile properties of the PP/CaCO3 nanocomposites as a function of nano-CaCO3 loading: (a) tensile modulus and (b) tensile strength. CaCO3: calcium carbonate; PP: polypropylene.
Flexural test
The effect of nano-CaCO3 particles on the flexural modulus and flexural strength is shown in Figure 15(a). As expected, the flexural modulus or stiffness of the neat PP increased linearly with increasing nano-CaCO3 loading. The flexural modulus of neat PP was approximately 1051.6 MPa, whereas the improvement in flexural modulus was approximately 13.0, 19.9, and 29.6% for CC-5, CC-10, and CC-15, respectively. This result corresponds with the result of E from the tensile test. The explanation of this improvement is likely similar to E, which is due to the stiff nature of the filler, and the restricted molecular mobility of the PP matrix caused by the nanofillers.
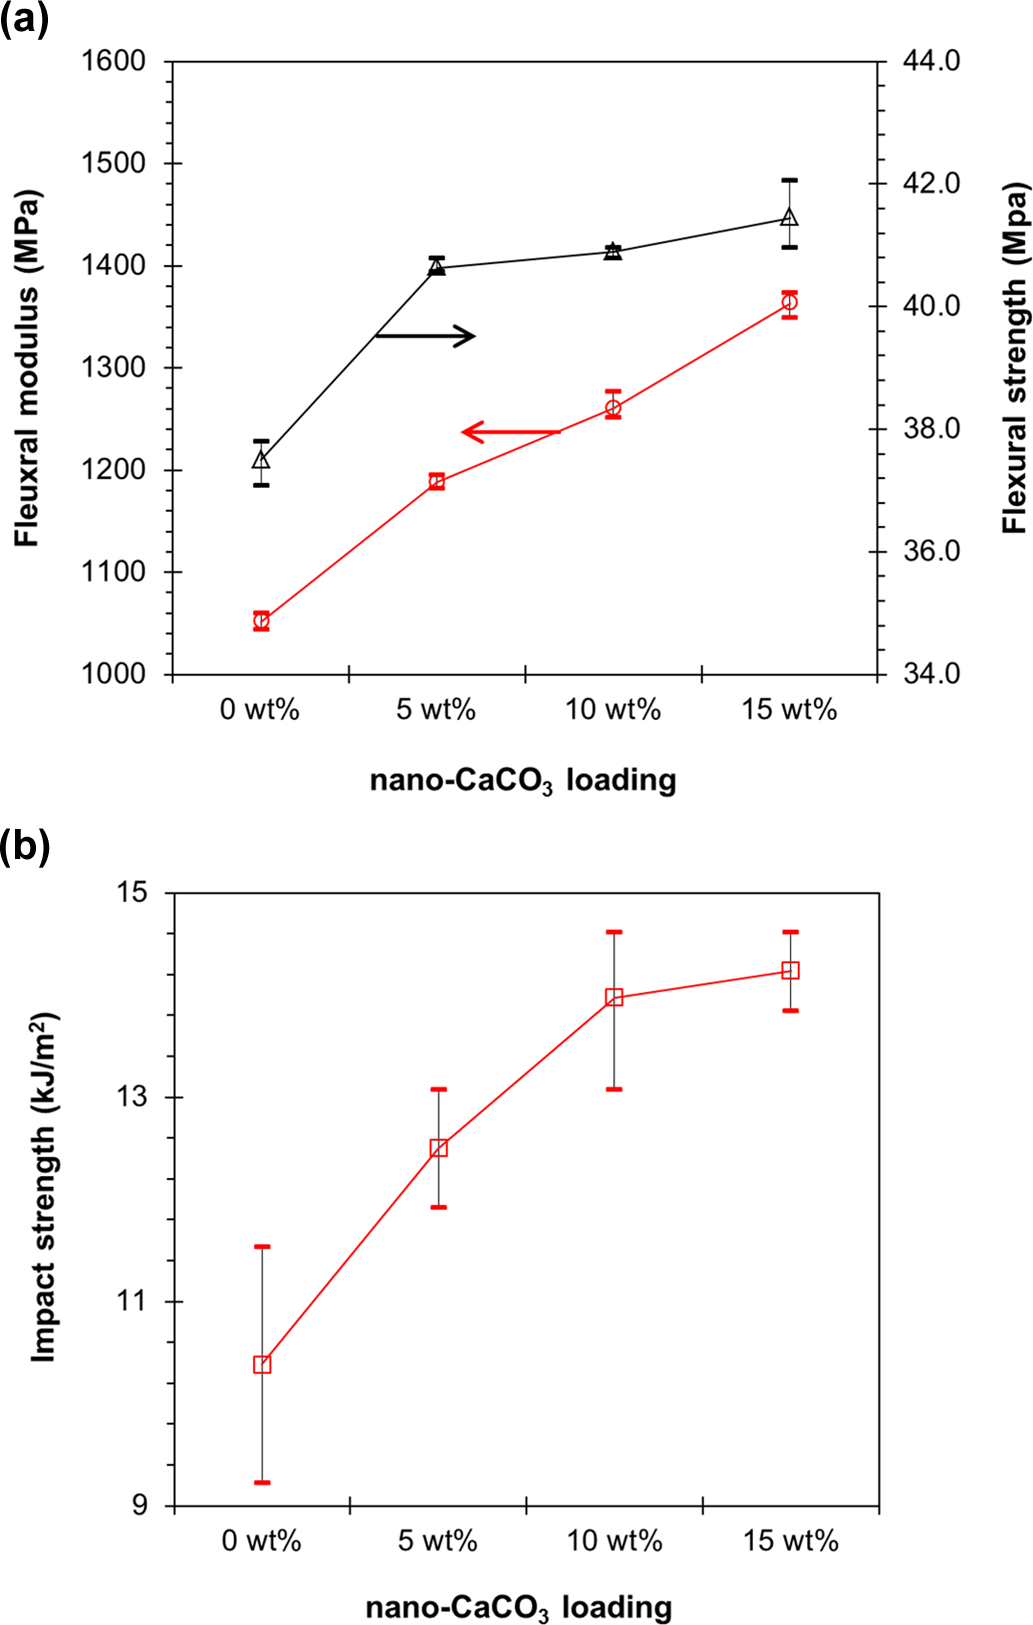
Flexural and Izod impact properties of PP/CaCO3 nanocomposites at different nano-CaCO3 loadings: (a) flexural modulus and strength and (b) impact strength. CaCO3: calcium carbonate; PP: polypropylene.
Additionally, another flexural property is flexural strength, which is also known as bend strength. The flexural strength of neat PP is approximately 37.5 MPa, while the nanocomposites are 40.6, 40.9, and 41.5 MPa for CC-5, CC-10, and CC-15, respectively. In contrast to the tensile strength, the flexural strength of the nanocomposites was higher than the neat PP, though the magnitudes are not much different between the nanocomposites samples. The similar result was also reported in other literatures. 15 It is because, the tensile strength was observed at a considerable strain (>9%), whereas the flexural strength was measured at low-strain zone (<5%), that is, measured before any significant deformation occurs. Thus, the improvement in flexural strength is similar to the flexural modulus.
Izod impact and fractography
Figure 15(b) shows the notched Izod impact strength of PP/CaCO3 nanocomposites. Impact strength here is defined as the energy required to fracture a specimen subjected to an impact. Other terms are impact energy, impact resistance, energy absorption, and so on. They represent the impact toughness of a material. In ASTM standard, the impact strength may be reported as energy lost per unit cross-sectional area at the notch (in joule per square meter or kilojoule per square meter). As shown in the figure, the impact strength of the neat PP was approximately 10.4 kJ/m2. Upon the incorporation of nano-CaCO3 particles into PP matrix, the impact strength of the nanocomposites increased significantly and reached maximum of 14.2 kJ m−2 at 15 wt% nano-CaCO3 loading. The enhancement of the impact strength of the nanocomposites was approximately 20.2, 33.7, and 36.5% for CC-5, CC-10, and CC-15, respectively. A high impact strength at high filler loadings (e.g. 10 and 15 wt%) could be obtained for low aspect ratio fillers and fine fractions (nano-CaCO3) and also good dispersion of the fillers. 15,47 Figure 16 shows the SEM micrographs of the impact-fractured surface of the nanocomposites (CC-10). As seen in Figure 16(b), distribution and dispersion of the nanofillers in the PP matrix is fairly homogeneous. The good dispersion of nano-CaCO3 fillers would result in less aggregation of the fillers and, thus, reducing the possibility of the propagating cracks to meet at a stress concentration point upon impact. 48 Nevertheless, future work is needed to further study the toughening mechanism due to this rigid nanoparticle.
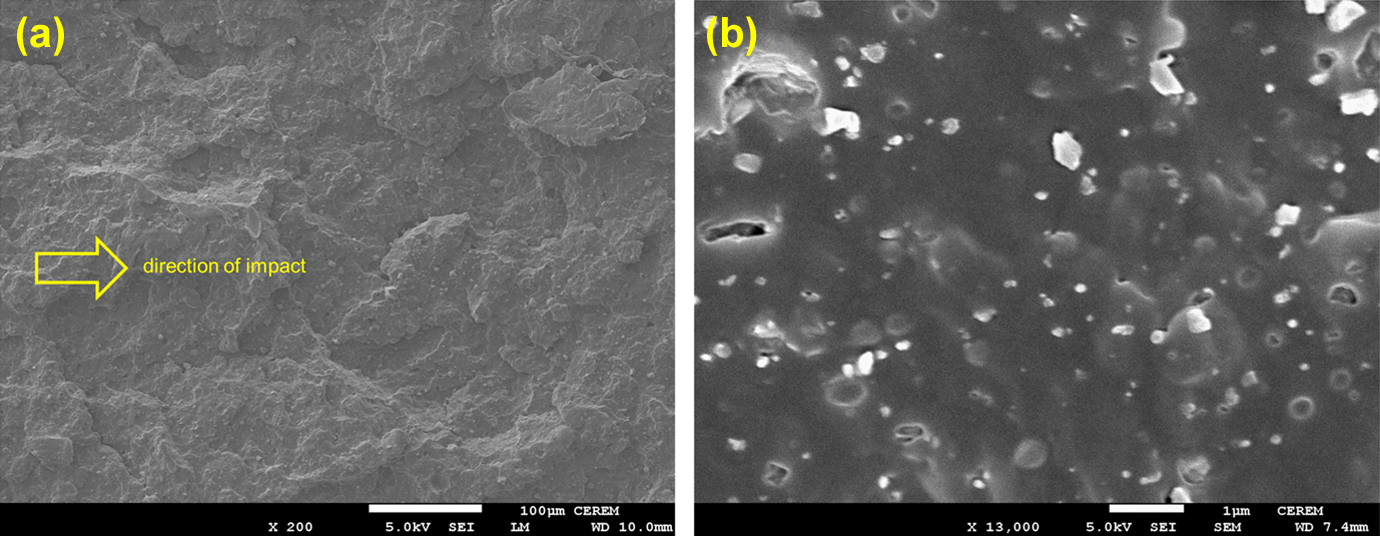
SEM micrographs of the impact-fractured surface of PP/CaCO3 nanocomposites (CC-10) viewed at (a) low and (b) high magnifications. The notched is at the left side of each image and the fracture direction is to the right. SEM: scanning electron microscopic; CaCO3: calcium carbonate; PP: polypropylene.
Conclusions
In summary, the melt rheology,
Footnotes
Acknowledgments
The authors thank Mr Babu and Mr Harry for providing technical support for the research.
Declaration of Conflicting Interests
The author(s) declared no potential conflicts of interest with respect to the research, authorship, and/or publication of this article.
Funding
The author(s) disclosed receipt of the following financial support for the research, authorship, and/or publication of this article: The authors would like to extend their sincere appreciation to the Deanship of Scientific Research at King Saud University for its funding of this research through the Research Group Project No. RGP-VPP-095.