
Abstract
In this work, a structural reactive injection moulding process using reactive anionic polyamide 6 (APA-6) is studied. Semi-empirical equations for the prediction of the APA-6 reaction kinetics and an advection equation for void transport are used in the numerical scheme. A complex numerical simulation of reactive injection of ε-caprolactam was developed for a three-dimensional industrial part. The validity of the approach is demonstrated for determining an effective injection strategy, including the position of vents and gates and the most effective parameter values for minimum mould filling time without the formation of voids.
Introduction
Liquid composite moulding (LCM) is the manufacturing of components from polymer matrix compounds by impregnating a fabric inside an enclosed mould with a low-viscosity resin (generally thermoset). The liquid is injected into the mould by a pressure gradient between the resin inlet and the air outlet, which can be positive or negative. Due to the increasing usage of composite materials, it is important to manufacture innovative materials that are environmentally friendly (during sintering and their life cycle) and recyclable.
The LCM process, which includes resin transfer moulding (RTM), vacuum-assisted RTM, reactive injection moulding (RIM), structural RIM (SRIM) and other subsets, is considered as one of the most viable and eco-friendly processes for manufacturing high-quality parts. All LCM applications involve resin flow into a fibrous network (i.e. the reinforcement), which can induce defects such as voids and dry spots. Resin flow-induced defects are known as the largest source of quality and reproducibility problems. These defects are often caused by unbalanced resin flows, which are directly related to the fibre permeability. Maximising the quality of LCM parts requires an optimisation of the impregnation velocity in order to reduce voids. Many computer simulation tools for predicting LCM process behaviour are available. The finite element method (FEM) will be used to calculate the strong dependency between impregnation flow rates and void content, which affects the final mechanical properties of the part. FEM simulation is suggested to optimise the filling process, as opposed to commonly used trial-and-error methods on the shop floor. Process engineers can use these optimised tools to replace traditional time-consuming procedures.
The polyamide 6 (PA-6) currently used in the industry is hydrolytically polymerised and delivered as pellets which are then thermoformed into parts. But the molten viscosity of thermoplastic (TPC) resins is very high, which makes it difficult to impregnate TPC resin into fibre bundles. To overcome this problem, anionic reactive processing is used as an alternative to obtain PA-6. Using this technique, initial low-viscosity raw reactants, monomer (ε-caprolactam) + activator + initiator, are injected through the reinforcement in a low-energy process (see Figure 1). A catalysed ring opening reaction then follows. This is a polyaddition reaction, that is, in ideal conditions (moisture-free environment), no by-products are produced. The process requires an activator and an initiator that will ensure both initiation and propagation of the reaction at temperatures between 130°C and 190°C. The process is completed within 2–50 min depending on the amount and the type of activator and initiator, which results in a linear polymer with high-molecular-weight (i.e. anionic PA-6 (APA-6)). 1 In this process, the void content, together with the fibre volume fraction and the microstructure of the preform, will affect the mechanical performance of LCM-obtained parts. The most important intermolecular force in APA-6 is hydrogen bonding. The nitrogen-bonded hydrogen of one chain will bond very strongly with the carbonyl oxygen of another chain, resulting in strong physical properties. 1
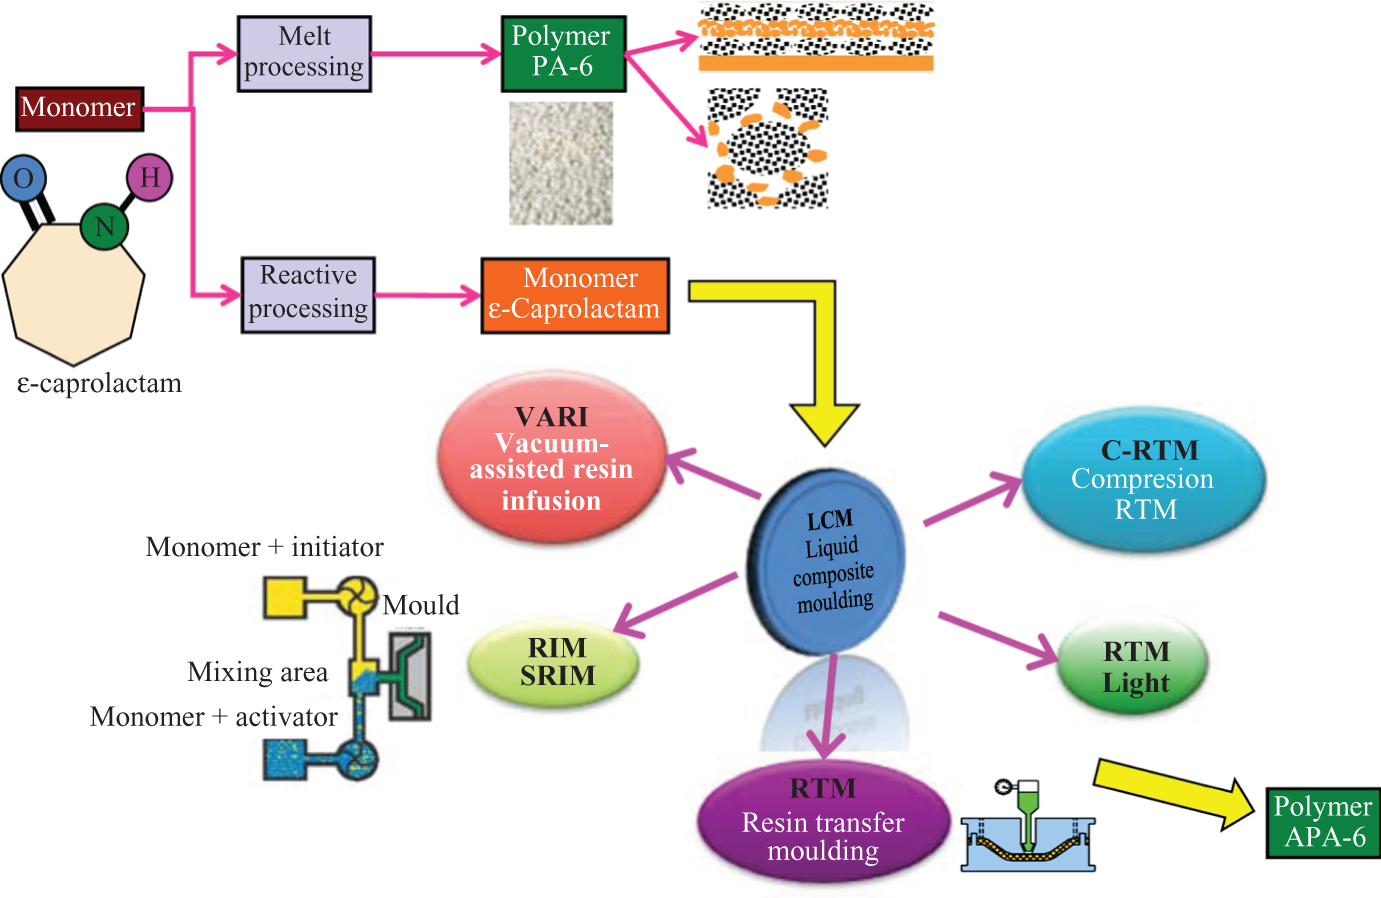
PA-6 transformation scheme in melt and reactive processing (APA-6). PA-6: polyamide 6; APA-6: anionic polyamide 6.
The initiator has to be a very strong base to break the N–H bond of the ε-caprolactam to form a reactive amide. Introducing an activator will cause very reactive imides that, after an induction time, enable a very fast chain growth polymerisation. This reaction time is due to the difference of reactivity between amides and imides. This difference simply relies on the number of reactive carbonyl carbons, two for the imides against one for the initial amide. The induction time can be modified from 2 min to 50 min using the different reactivities of the common activators and initiators (Figure 2). The reaction will end when any proton-donating species neutralises all the anionically charged polymeric chains. 2 –5
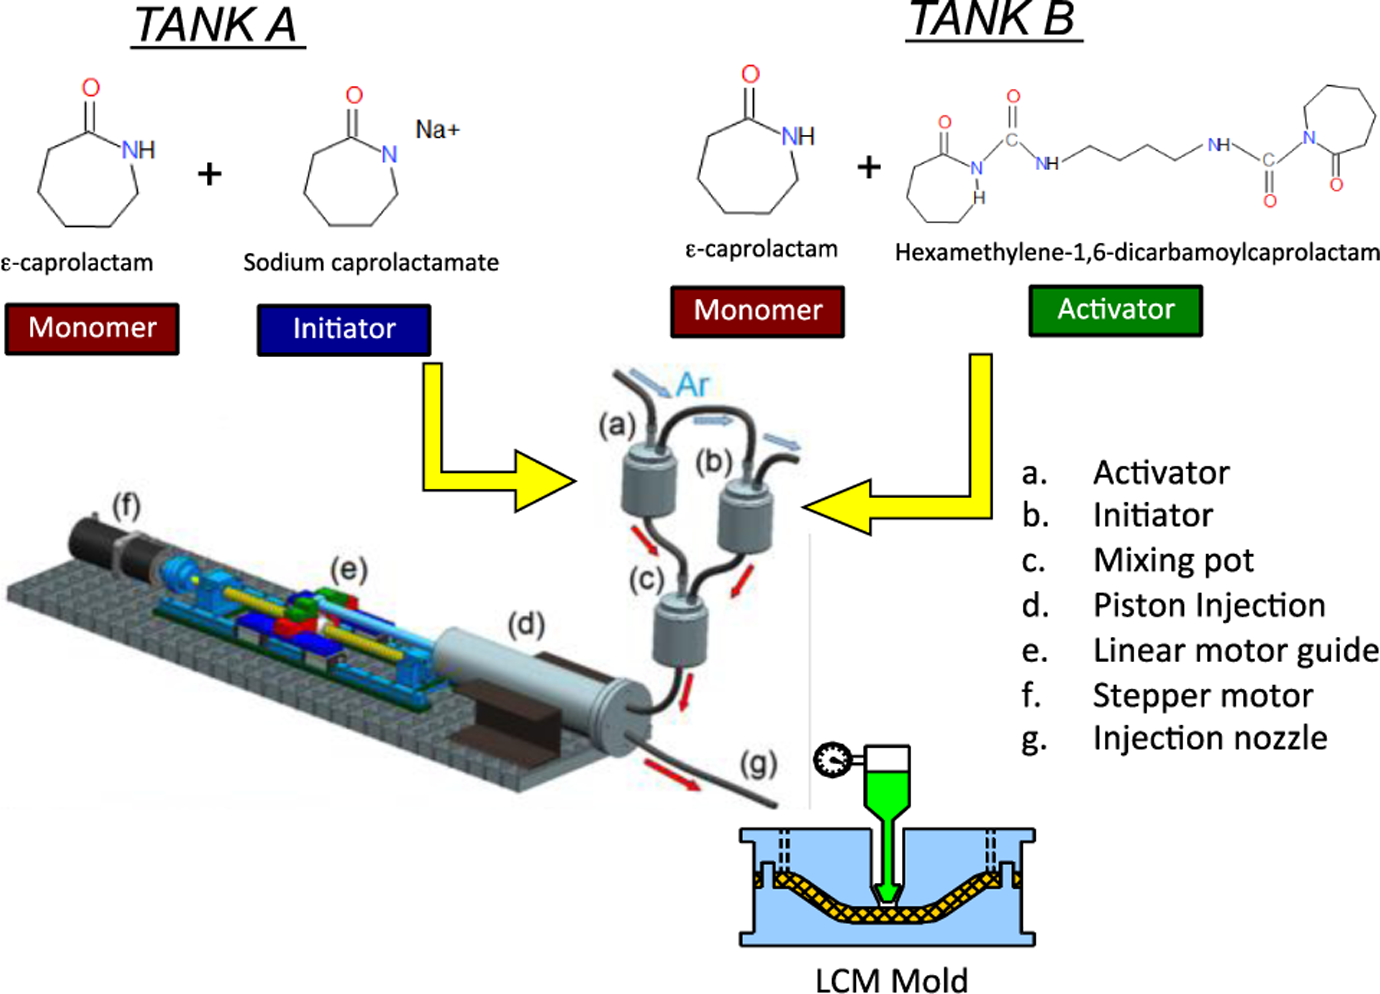
SRIM process. SRIM: structural reactive injection moulding.
Governing equations for SRIM process
RIM is a manufacturing process where reactive liquid components are injected and mixed inside a closed mould cavity under pressure. This article focuses on reinforced RIM (SRIM) that uses fibre fabrics, mats and preforms to make structurally strong composites. In SRIM process, a thermosetting resin is mixed at high pressure just prior to injection into a hot mould containing the fibre reinforcement as shown in Figure 2.
Flow through porous media is usually treated as a Newtonian flow governed by Darcy’s law and the continuity equation. The process is modelled either as flow through a fully saturated porous media or as flow through an unsaturated porous media. Modelling and measurements through saturated porous media are much easier since it practically involves only unidirectional Darcy flows and correspondingly simple theoretical models.
In its original form, Darcy’s law is not very useful because the permeability term K
h is dependent on the properties of both the fluid and porous medium, then Darcy’s law can be written as

where
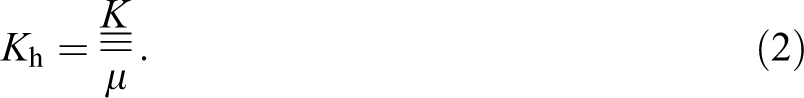
Note that Darcy’s velocity is related to the resin superficial velocity via the porosity
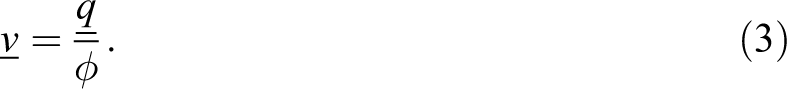
For non-isothermal mould filling, which has been considered in this work, the resin viscosity is a function of temperature T and the degree of cure β, μ = μ(T,β). Taking into account, the resin incompressibility combined with equation (1) gives the following equation:

The fluid flow problem is expressed in terms of volume Ω,

where the fluid at time t occupies the volume Ω
f(t) and Ω
e(t) is the empty part of the mould at that time. The variational formulation related to the Darcy flow gives the following equation:
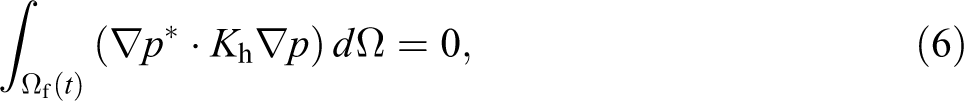
where p* is the usual weighting function.
The prescribed conditions to impose on the boundary of Ω f(t) are
the pressure gradient in the normal direction to the mould walls is zero,
the pressure or the flow rate is specified at the injection nozzle and
zero pressure is applied on the flow front.
An important concern in the mould filling simulation is the numerical treatment of the moving boundary defined by the flow front of the liquid resin. The domain occupied by the fluid where the governing equations have to be integrated changes continuously, so it has to be defined at each time step during the simulation. The fluid domain evolution is accomplished by the resolution of the hyperbolic transport equation that governs the fluid presence function I updating
6
:

However, in a wide range of applications of porous media such as those used in LCM processes, unsaturated permeability is more important for the analysis of initial fabric wet out, and this requires more sophisticated models. An in-depth analyses of two-dimensional and three-dimensional (3D) theoretical models will be discussed subsequently.
Cure and rheology modelling
The prediction of polymer viscosity as a function of temperature and time can help find the acceptable temperature and velocity range to successfully accomplish impregnation of the fabric without thermal degradation of the resin. For the non-isothermal filling analysis, a model relating the viscosity and the resin conversion is needed. Moreover, due to the low viscosity of the precursors, the most important parameter is the induction time prior to the in situ polymerisation.
The heat of reaction and the amount of heat released at time t were calculated by the following equation:

where t
f is the time required to complete the reaction. The degree and the rate of degree of cure can be written as described by Loos and colleagues.
7,8
The heat balance of a composite part can be expressed as described by Gupta et al. and Abisset-Chavanne.
9,10

where T, ρ, C p, k, ω and β are the temperature, density, specific heat capacity, thermal conductivity, resin volume fraction and degree of cure, respectively. The subscript r designates the resin.
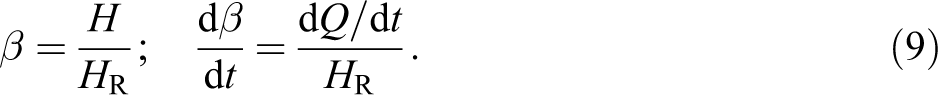
For numerical results in this article, we have considered the following values obtained experimentally 11 –13
H R is the PA-6 melting enthalpy with the value of 188,400 J/kg and
k is the thermal conductivity with the value of 0.25 W/mK.
The heat capacity of the resin is a function of the degree of conversion:

where (c p)CPL is the heat capacity of caprolactam (2590 J/(kg*K)) and (c p)APA is the heat capacity of the amorphous PA-6 (3010 J/(kg*K)). These values have been obtained experimentally by Kim et al. 14 .
During mould filling, the viscosity of the resin may vary due to the polymerisation reaction. The heat generation rate due to the resin cure is described by the resin density (ρ
r), the resin volume fraction (ω), the enthalpy of reaction (H
R) and the resin rate of reaction (dβ/dt). The polymerisation kinetics of APA-6 has been modelled with the schemes proposed in literatures
15,16
to the following equation (see Figure 3): Rate of degree of cure versus temperature and degree of cure.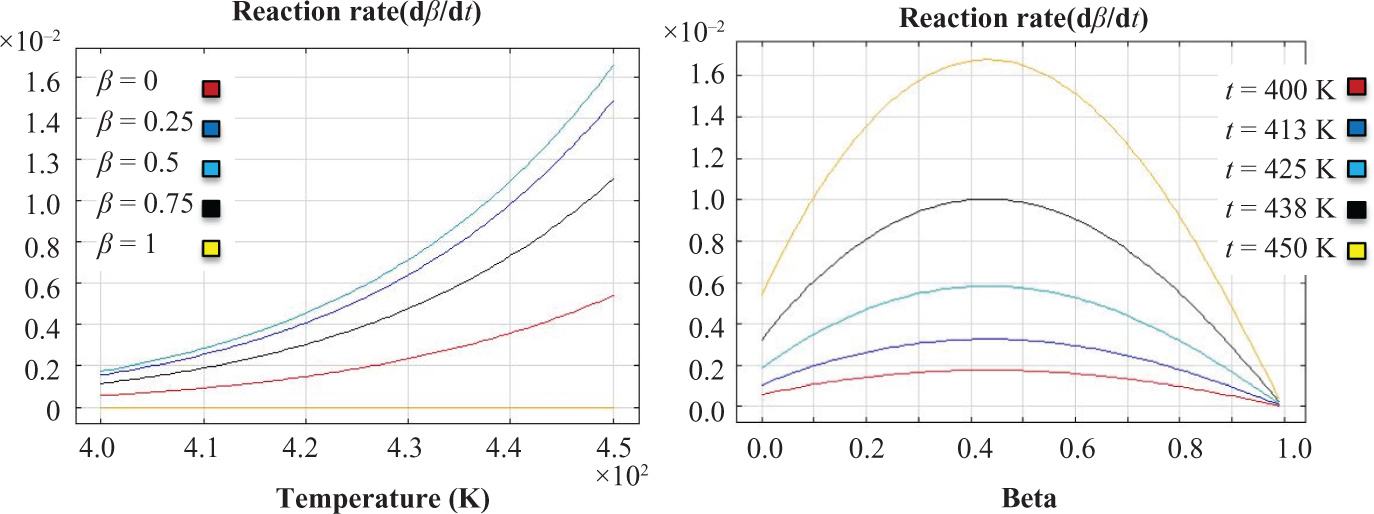

where A 0 is the front factor, E is the energy activation and B 0 is the autocatalytic term. The front factor enables a comparison to be made with the efficiency of various initiators, whilst the autocatalytic term describes the self-acceleration effect of chain growth. This autocatalytic function is used for thermoset reactions and is applied to describe the polymerisation behaviour of APA-6.
The kinetic parameters used in equation (12) and Figure 3 were calculated experimentally as in the work by Teuwen et al. and are presented in Table 1. 17
Kinetic parameters with autocatalytic APA-6 model.
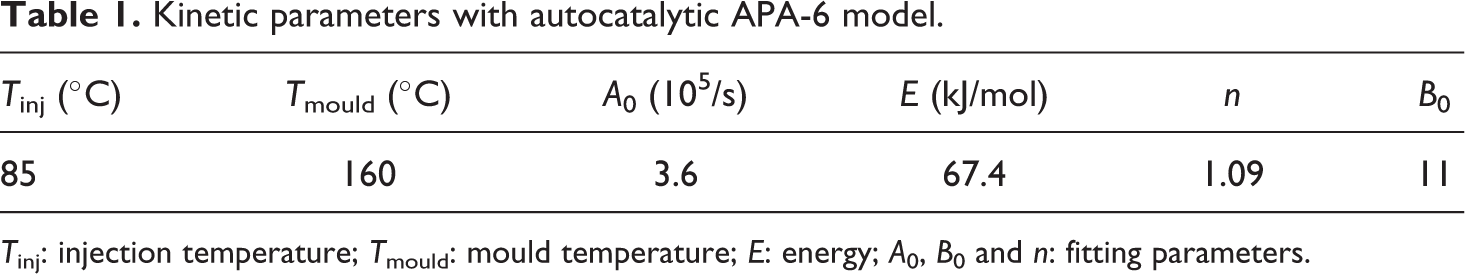
T inj: injection temperature; T mould: mould temperature; E: energy; A 0, B 0 and n: fitting parameters.
During anionic polymerization, there is an increase in the caprolactam viscosity , and a rheological test must be carried out to obtain the numerical model. The following relation was used for the calculations:
As can be seen in Figure 4 and equation (13), viscosity is a function of temperature and resin rate of conversion.
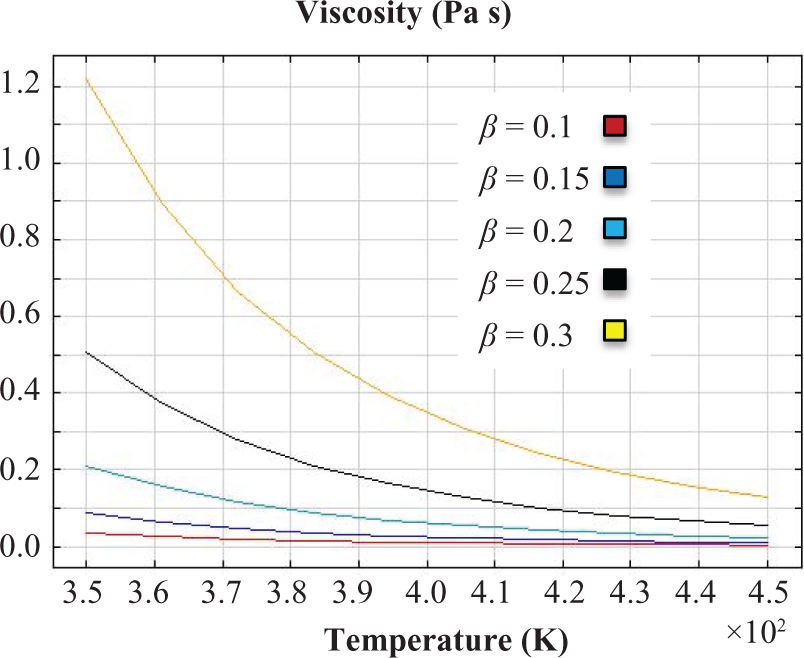
Viscosity as a function of the temperature, degree of cure and time.
Numerical optimisation of void content
Composite parts produced using LCM process voids must be avoided to enhance the mechanical properties. Researchers have published several investigations on micro- and macrovoid formation and have shown that macrovoids tend to form during injection at low flow rates, due to capillary dominant effects, whereas high injection rates lead to microvoid formation
18
. It has been shown that the formation of voids can be related to the modified capillary number: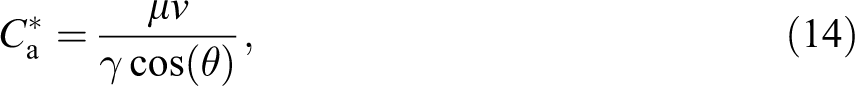
where μ is the viscosity of the fluid, γ is the surface tension at the interface air/resin, 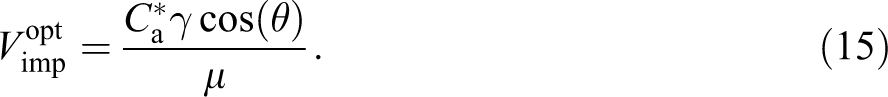
The mathematical formulation of the saturation in LCM takes into account the interaction between resin and air as it occurs in a two-phase flow. To analyse the formation of voids during the resin impregnation process, a one-dimensional solution based on two-phase flow through a porous medium was proposed in literaure.
19
This model leads to the introduction of relative permeability as a function of saturation and a modified equation for saturation as a non-linear advection–diffusion equation with viscous and capillary phenomena. Combining equations that describe mass conservation and Darcy’s laws for resin and air phases as described in literaures,
19,20
the resulting equation for the saturation in its most general form gives:
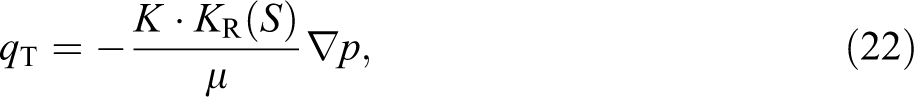
where S is the degree of saturation of the reinforcement by the liquid resin. The total velocity (q
T) can be defined as
where the subscripts r and a are the resin phase the air phase, respectively. D
cf(S) is the non-linear diffusivity coefficient due to capillary pressure and is given using the following equation:
f(S) is the fractional flow function of resin, which can be expressed as: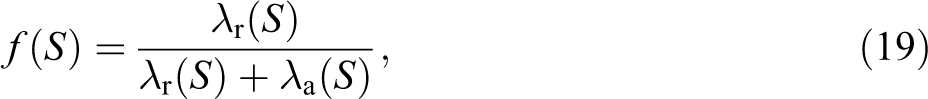
The phase mobilities can be expressed as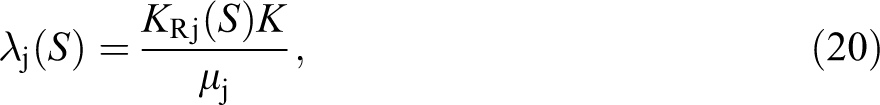
where K Rj(S) is the relative permeability of the phase j, μ j is the viscosity of phase j and K is the absolute preform permeability.
For this part of the work, isothermal conditions are assumed, and equation (16) has been coupled with the elliptic equations for the pressure and velocity of the resin phase where the relative permeability has been calculated considering resin and air as a mixture. Then, the total velocity q T in equation (16) is obtained using the two phase as a mixture. Details of this method can be found in the study by Gascón et al. 21 .
In the context of filling processes, a numerical simulation will involve the following operations at each time step:
Calculate the pressure distribution by applying a standard finite element discretisation to the equation obtained by a combination of Darcy’s law and conservation mass for the resin phase,
where the relative permeability and the term on the right side depend on the saturation degree. In this work, the relative permeability for the resin has been replaced by considering resin and air as a mixture. 21
Calculate the velocity field from Darcy’s law,
Update the saturation distribution by integrating equation (16) using a flux limiter technique described in literature. 19
The boundary conditions are given by: the pressure gradient in the normal direction to the mould walls vanishes, the pressure or the flow rate are specified on the inflow boundary and the pressure is zero in the empty part of mould.
In order to demonstrate the influence of impregnation velocity in the void content numerical results as shown in Figure 5 have been obtained, using the technique described previously, injecting at constant flow rate. Then, the following values of physical parameters have been considered for the mould-filling optimisation:
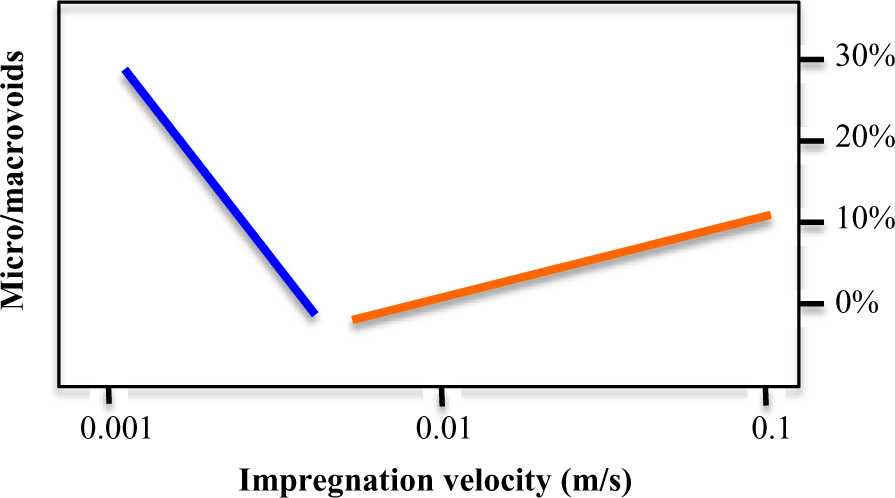
Macro/microvoid function.
macrovoid function: −1574v + 12.82,
microvoid function: 100.5v + 1.27,
resin capillary coefficient: 0.02 and
optimal capillary number: 0.0069.
Figure 5 shows a least squares quadratic-estimated relationship between macro/microvoid content and impregnation velocity. The curve with the negative slope represents the macrovoid function, whilst the other curve shows microvoid function.
Simulation of TPC-LCM
FEM simulation packages are very helpful work tools in the industrial field. They have gained importance over the last few years by enabling any process or product behaviour to be quantified and tested and are also used for comparing alternative designs and thus saving costs and lead times.
Commercially available packages such as ANSYSTM, NASTRANTM and ABAQUSTM cannot directly support LCM process simulation and can only support mould-filling simulations by homogenisation techniques with limitations on heat transfer and cure kinetic analyses. Some research groups have developed their own codes such as LIMS, LIMS3D and RTMSIM to achieve their requirements. 22,23 Moreover, in the last 5–10 years, there has been considerable interest in developing user-friendly commercial simulation software products such as PAM-RTMTM (Esi-groupTM), MoldflowTM (AutodeskTM) and RTM-WorkxTM (PolyworxTM). In addition, the major manufacturing-oriented simulators have introduced programming into their software in one or both of the following ways:
the facility to use ‘programming-like’ constructs (e.g. setting global variables, if-then-else logic, etc.) at certain points in the simulation-building process.
the facility to call external programmed routines at certain points in the simulation-building process.
In this work, a complex optimisation study has been carried out on a 3D geometry under PAM-RTM software. It consists of the filling of a sunroof for a small pedal-powered vehicle as shown in Figure 6. It involves the non-isothermal flow of resin (APA-6) through a basalt fibre preform. Thus, the routines solve the following 3D equations simultaneously:
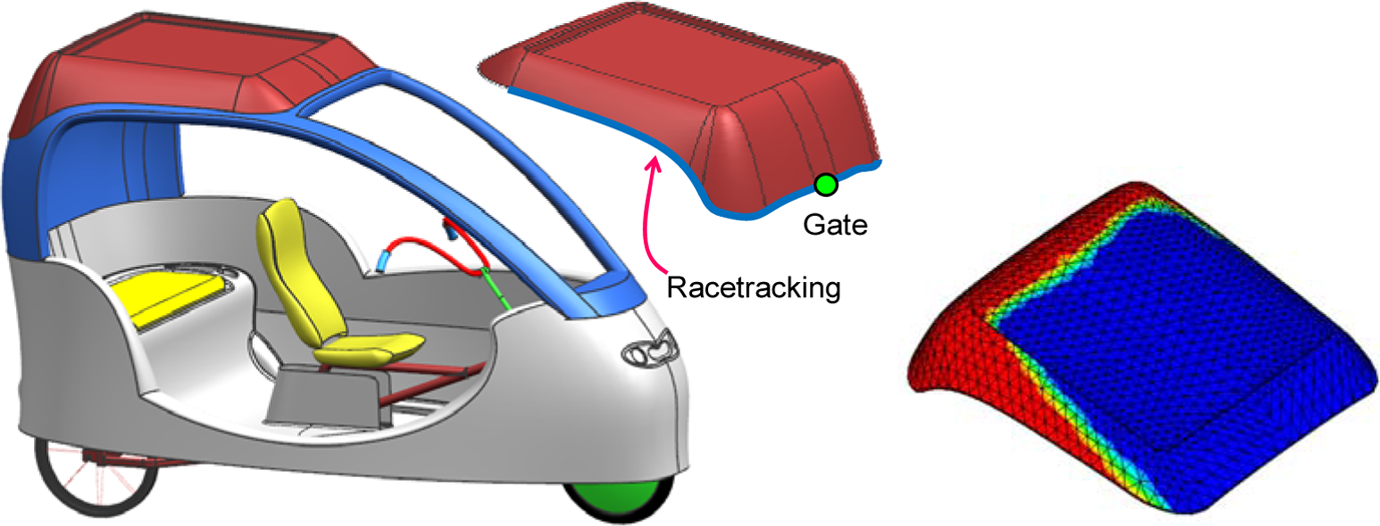
Part geometry (sunroof) and melt front advance.
Darcy + mass transfer,
heat transfer,
cure kinetics,
reactive injection of APA-6 and
void content and optimisation.
The inlet gate is located at the rear border in order to create a race-tracking effect along the border (see Figure 6). Figure 7 shows the results with three different parameters: constant pressure (a), constant flow rate (b) and optimised velocity (c) corresponding to the optimal capillary number of 0.0069 proposed in the above section. Due to the low viscosity of injected caprolactam, the pressure is very low compared with the traditional LCM manufacturing processes. The void content can be reduced significantly with a control velocity strategy as is shown in the results. The mould is warmed to 150°C and APA-6 is injected at 110°C. As observed in the comparison, the void content in the third simulation has been reduced to a minimum. The flow front through the thickness reproduces the 3D behaviour, and a different impregnation velocity also affects the macro- and microvoid content.
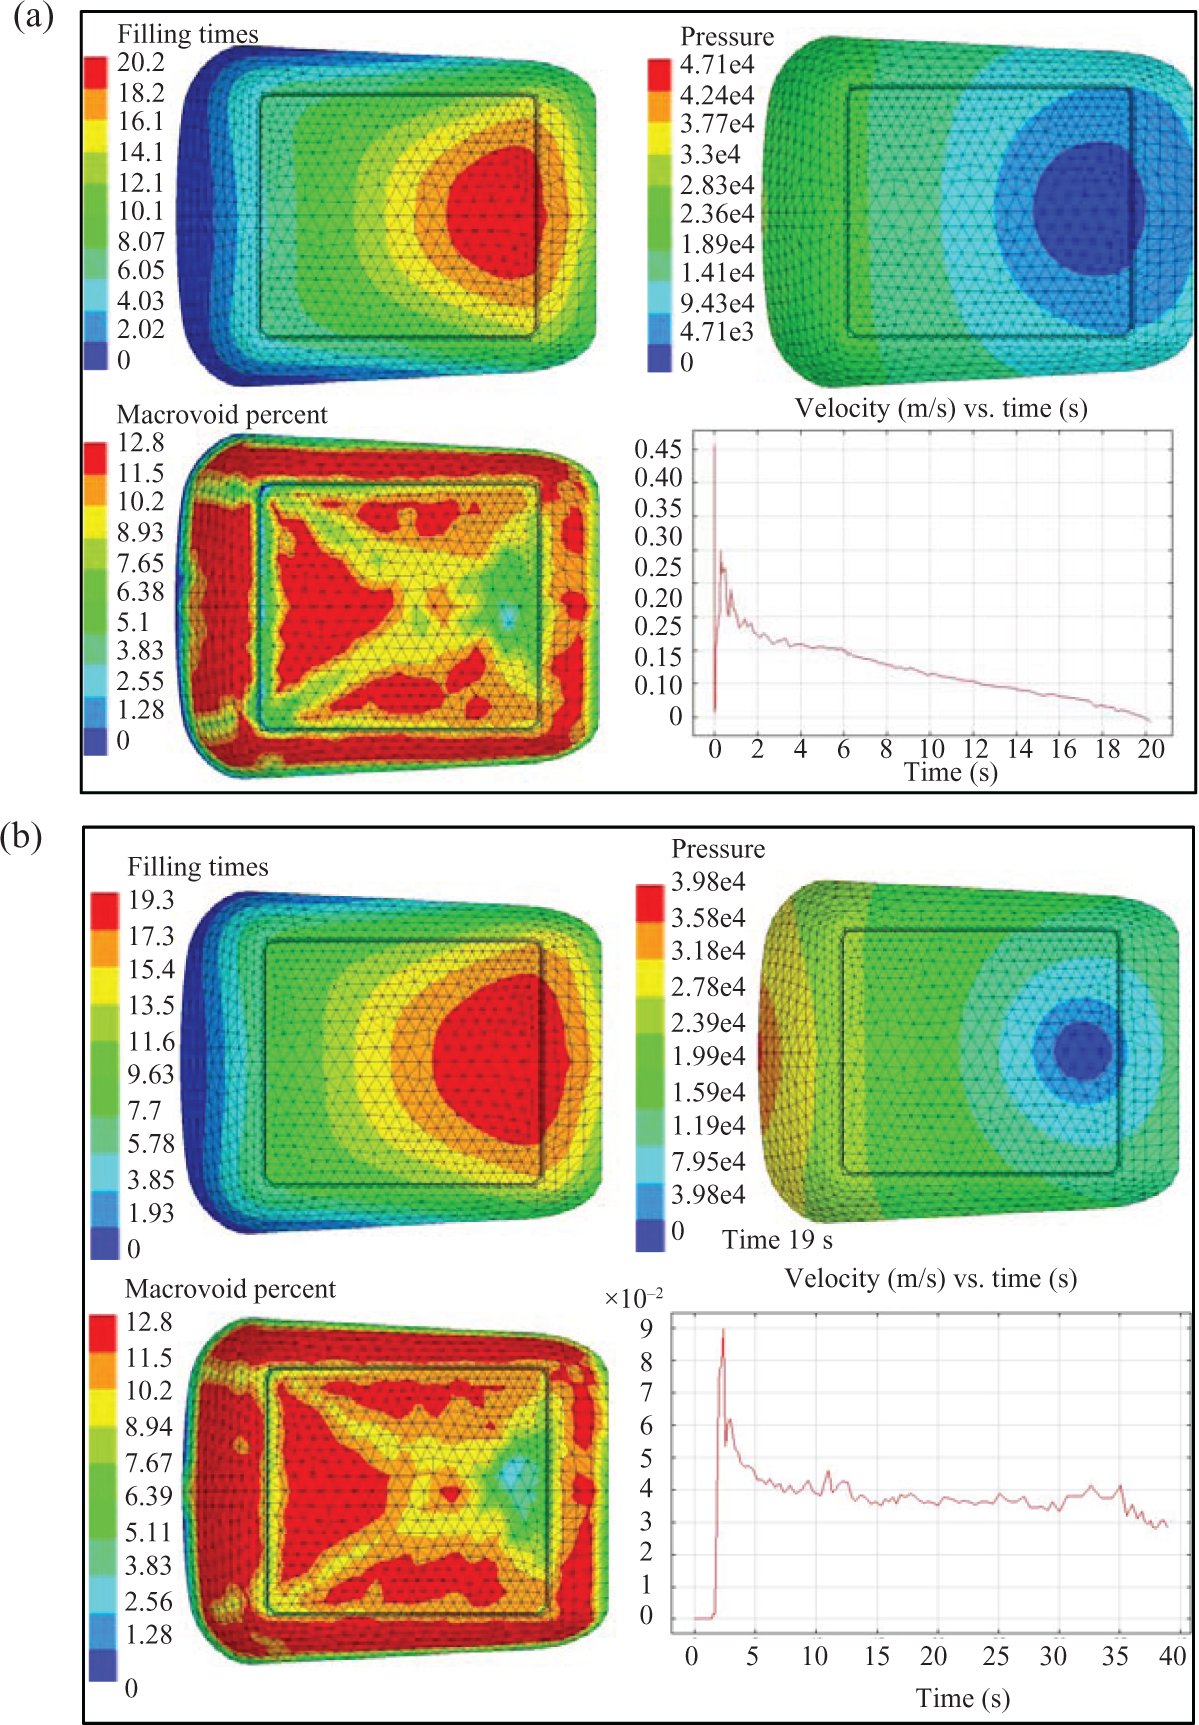
Filling times (top left), void contents (bottom left), pressure field at the end of the filling phase (top right) and velocity profile at the injection nozzle: (a) constant pressure of 3 × 10⁴ Pa, (b) constant flow rate of 2e−4 m/s and (c) optimised velocity.
Figure 7(c) shows the injection rate profile that must be programmed in the injection machine to obtain a minimum void content in the part. As can be seen, the average velocity increases during the injection phase in accordance with the part geometry and reduces at the end of the filling process.
The results of the simulation are in good agreement with the expected properties of the APA-6:
the flow front is accelerated at the top and bottom mould walls because of a lower resin viscosity.
the injection time is very short compared with traditional thermoset injection (LCM) and
the four layers of reinforced fibre were completely wetted by APA-6 precursors.
Conclusions
The injection of reactive fluids, such as APA-6, involves an anionic in situ polymerisation, and new considerations for the injection methods have been studied. With the low viscosity of the precursors, almost water-like, one of the main effects of varying the flow rate in LCM is that void occurrence is affected. A numerical approach to estimate the flow control and thereby reducing the void content has been shown. With a constant inlet pressure during the impregnation of the reinforcement, the flow rate will decrease as distance increases from the injection port. Nevertheless, with the approach described in this article, an optimal injection rate can be programmed in a numerically controlled injection machine.
Numerical approaches using FEM methods are also valid for determining the effective injection strategy, including the position of vents and gates and the most effective values of parameters for minimising mould filling time without voids forming.
Footnotes
Declaration of Conflicting Interests
The author(s) declared no potential conflicts of interest with respect to the research, authorship, and/or publication of this article.
Funding
The author(s) disclosed receipt of the following financial support for the research, authorship, and/or publication of this article: This research work is supported by the Spanish Ministry of Science and Innovation, project DPI2010-20333 and the Generalitat Valenciana through programme PROMETEO/2009/063.