
Abstract
Fiber-reinforced polymer composites are nowadays used in numerous applications due to their good tribological, mechanical, and thermal properties. In the present investigation, the tribological behavior of polyether ether ketone (PEEK) and PEEK reinforced with glass fiber (GF) has been investigated using the pin-on-disk wear tester under dry sliding condition at different applied loads, speeds, and sliding distance. Modeling and optimization of tribological parameters is carried out using response surface methodology (RSM)-based D-optimal design. Tribological parameters such as load, sliding speed, and sliding distance are chosen as numerical factor, and the weight percentage of GF content is considered as the categorical factor. An experimental plan of four-factor (three numerical + one categorical) D-optimal design based on the RSM is employed to carry out the experimental study. The wear performances of PEEK matrix composites are evaluated using the performance indicators such as specific wear rate and coefficient of friction. The morphologies of the worn surfaces are observed using scanning electron microscopy and atomic force microscopy.
Keywords
Introduction
Recently, the polymers and their composites are getting more popular in tribological applications under water-lubricated condition to replace metallic materials as rubbing materials due to the corrosion problems of the metals. With the outstanding performance such as high mechanical properties, high chemical resistance, and high wear resistance, polyether ether ketone (PEEK) becomes one of the most promising polymer materials for the tribological applications. 1 The high-performance PEEK polymer is first prepared by Bonner in 1962. 2 The wear and friction properties of the PEEK matrix materials strongly depended on some influencing factors including counterface roughness, counterface material, sliding velocity, and contact stress. In general, the transfer film on the counterface plays a key role in dry sliding condition. 3 The wear of composite material is a complicated surface damage process, affected by a number of factors, including formulation, microstructure, mechanical properties of the binder and the fillers, loading condition, and environmental influence. The role of each ingredient in the friction material has been intensively studied and new ingredients are still being developed to achieve better friction performance. 4 The tribological behavior of potassium titanate whiskers-reinforced PEEK composite has been investigated using the pin-on-disk configuration at different applied loads under water-lubricated condition. 5 Davim and Cardoso have used statistical techniques to study the effects of temperature and sliding distance on the dry sliding tribological behavior of 30 wt% carbon fiber (CF)-reinforced PEEK composite. 6 Friedrich et al. 7 have found that an increase in testing temperature resulted in higher specific wear rates and in lower friction coefficients for PEEK-CF30 (wt%). Hanchi and Eiss 8 have studied the friction and wear of PEEK-CF30 (wt%) at elevated temperatures. The reinforcement with CFs increased the mechanical resistance with the temperature. As temperatures increased from below to above the glass transition temperature (T g) of the polymer matrix, the wear performance of the composite is seen to deteriorate, and the friction is seen to decrease appreciably. The orientation of crystals is another important parameter in microstructure and plays important role in mechanical and tribological properties of PEEK and its composites. 9 When polymer composites serve in tribological environment a friction layer is formed on the surface of the pad as well as on the disk. The friction and wear performance of multiphase composites is related mostly to the rather thin layer on the interface. 10 Davim and Cardoso 11 studied PEEK and 30% CF-reinforced PEEK sliding against steel under water-lubricated conditions and concluded that the counterface roughness is the most important factor in the friction behavior of both materials. Bijwe and Nidhi 12 have presented work seeking to deal with the mechanism of adhesive wear of PEEK reinforced with glass fibers (GFs), CFs, and solid lubricants (PTFE and graphite). They concluded that the inclusion of 30 wt% CF benefited the strength properties but not the tribological performance. On the contrary, the solid lubricants influenced the friction and wear performance of PEEK composites. Liujie et al. 13 have used artificial neural networks to predict the tribological behavior of PEEK-CF30 (wt%) according to contact temperature. The obtained results showed that the weight loss is influenced by the contact temperature. A hydrodynamic lubricating film could be formed at high speed. In fact, at very low speed, the lubricated sliding wear rates of some polymers are approaching the values characteristic of unlubricated sliding and the lubrication is thus becoming almost ineffective. 14 The contact stress is also particularly important to the sliding wear. For sliding wear of polymers against metallic counterparts, the friction component resulting from adhesion equals the product of the real contact area and the shear stress of the softer material. The normal load always affects the tribological properties of the polymer materials by the contact temperature in dry sliding condition due to frictional heating. It could result in two contrary effects on the friction coefficient. 15 Li and Yang have examined the tribological performance of poly (vinylidene fluoride) (PVDF) and CF-reinforced PVDF (CF/PVDF) under dry sliding condition. They found that the optimum wear reduction is obtained when the content of CF is 20 vol %. 16
Zheng-zhi Wang et al. 17 have studied the effects of wear load, pass (a pattern of scan cycles), and nanoparticle content on the wear behavior of silica nanoparticle-reinforced composites. The tribological behavior of carbon–zinc oxide composite coatings using an atmospheric pressure plasma jet method is evaluated by Penkov et al. 18 The effects of matrix content on the strength and wear of woven roving glass/polyester and glass/phenolic composites have been examined by Vishwanath et al. 19 Srinath and Gnanamoorthy 20 have studied the sliding wear performance of polyamide 6 clay nanocomposites in water. They concluded that addition of clay affects the crystallinity of the nanocomposites, which in turn affects the plasticization.
Atomic force microscopy (AFM) technique is increasingly used for tribological studies to evaluate micro wear properties of solid surfaces at scales ranging from the atomic and molecular to the microscopic. This technique has been used to study the surface roughness, adhesion, friction, scratching/wear, indentation, material transfer, and boundary lubrication for nanoscale surfaces. 21 Hua Fu et al. 22 have used AFM to study the tribological behaviors of stainless steel fiber- and CF-reinforced PEEK composite materials. Response surface methodology (RSM) design is a helpful tool for the quantification of the relationship between one or more measured responses and the vital input factors. An optimal experimental plan can be computed using the methodology of optimal experimental design for parameter estimation. 23 D-optimal criterion, one of the several “alphabetic” optimalities, 24 is developed to select design points in a way that minimizes the variance associated with the estimates of specified model coefficients. 25 Rajmohan and Palanikumar 26 have used RSM-based D-optimal design for modeling and analysis of machining responses in drilling of hybrid metal matrix composites.
The review of the above literature revealed that the studies on wear properties of PEEK and PEEK-reinforced GF composites are very limited and it left the scope to the authors to study the wear performance of PEEK composites. Also, the literature indicated that there is no systematic study deals with the tribological performance of PEEK and its composites. In the present investigation, the tribological performance of PEEK and its composites is studied using RSM-based D-optimal design. A four-factor (three numerical + one categorical) D-optimal design is employed to determine the experimental runs for the operating conditions of the process. In this article, a mathematical model based on the RSM is developed for modeling and analyzing the performance in the sliding wear of PEEK composites. The morphologies of the worn surfaces are studied using scanning electron microscopy (SEM) and AFM.
Experimental
Materials and methods
PEEK and PEEK/GF30 work materials supplied by M/s GHER Plastics (Germany) were used throughout the investigation. Table 1 summarizes the mechanical properties of work materials tested. Figure 1 shows the SEM image of PEEK and PEEK/GF 30 composites.
Properties of PEEK and PEEK/GF 30 composites.
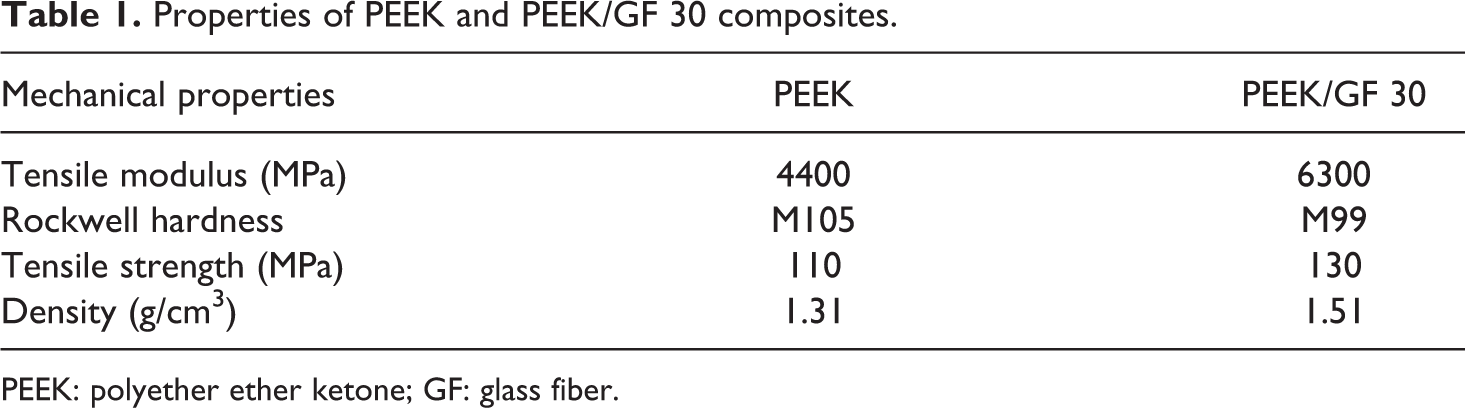
PEEK: polyether ether ketone; GF: glass fiber.
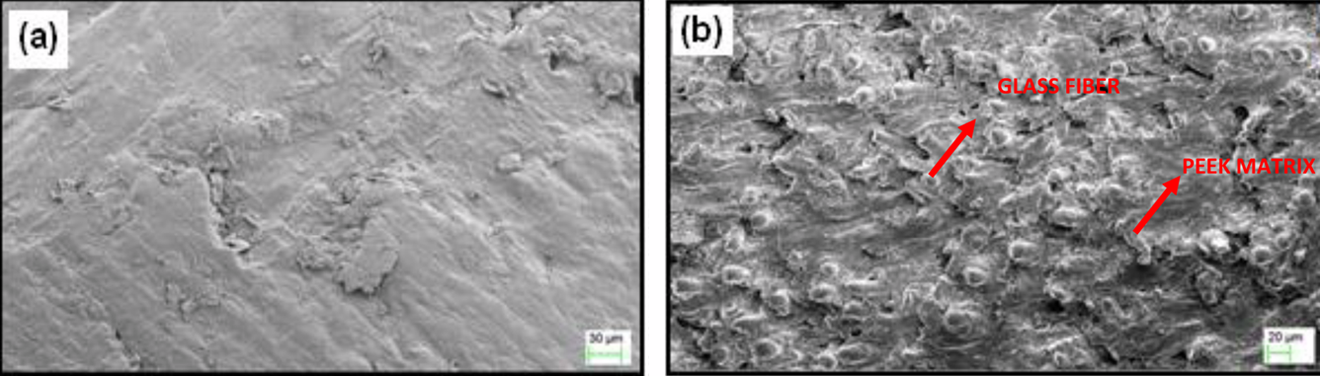
SEM micrographs of (a) PEEK (b) PEEK GF 30 composites. SEM: scanning electron microscopy; PEEK: polyether ether ketone; GF; glass fiber.
Experimental design
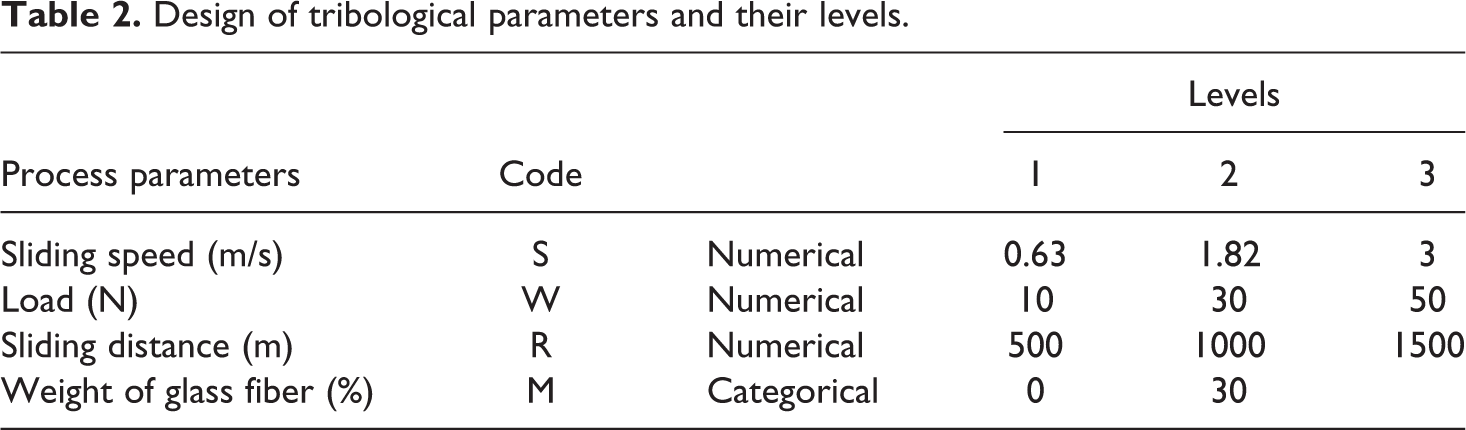
The experiments for this work are planned using D-optimal design to model and to analyze the responses such as the specific wear rate and coefficient of friction in dry sliding wear of PEEK matrix composites. When an experiment also includes qualitative factors, the effects between the quantitative and qualitative factors should be taken into consideration. In the present investigation, D-optimal designs are used for models where the qualitative factors interact with quadratic effects of the quantitative factors. Table 2 shows the design scheme in which three numerical factors are varied over three levels, while one categorical factor is varied at two levels.
Design of tribological parameters and their levels.
Experimental procedure
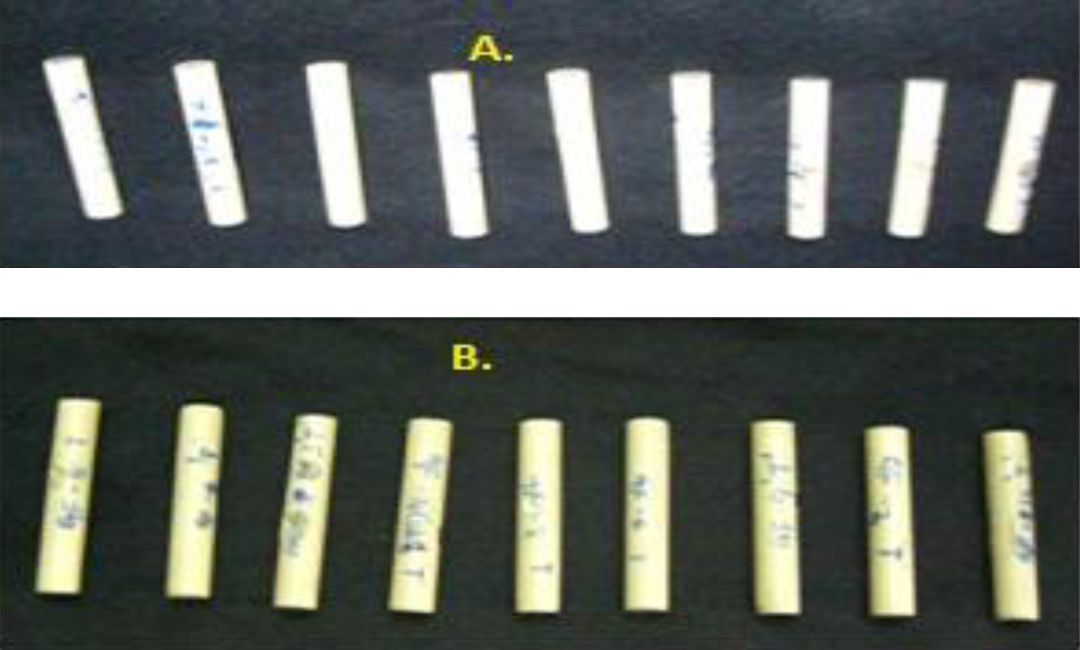
Dry sliding wear tests for the PEEK composites have been conducted using pin-on-disk machine model, supplied by M/s Wear cote Technologies (Tiruvallur, Tamil Nadu, India). The wear specimen (pin) size of diameter 6 mm and height 8 mm is prepared by machining and then polished. The schematic arrangement of the pin-on-disk wear testing machine and wear specimens are presented in Figures 2 and 3, respectively. The pin is held stationary against the counter face of 100 mm diameter rotating disc made of stainless steel 304 L having hardness 65 HRC (Rockwell hardness in C scale). After running through a fixed sliding distance, the specimen are removed and cleaned with acetone. The weight loss has been measured by digital balance having least count of 1 mg. The specific wear rate is computed from the following relation:
Experimental setup. Photographs (a) PEEK composites and (b) PEEK reinforced with 30% GF. PEEK: polyether ether ketone; GF; glass fiber.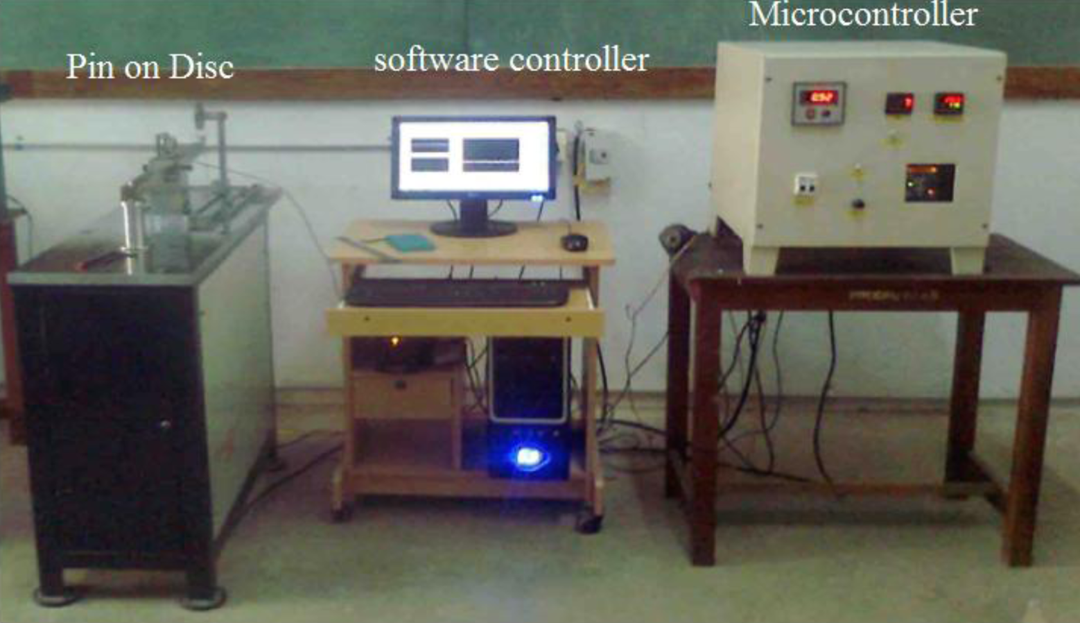

The coefficient of friction is directly measured using software supplied with the machine. Based on the D-optimal design, 24 experiments were conducted, and the results are presented in Table 3.
Experimental design and results using D-optimal design.
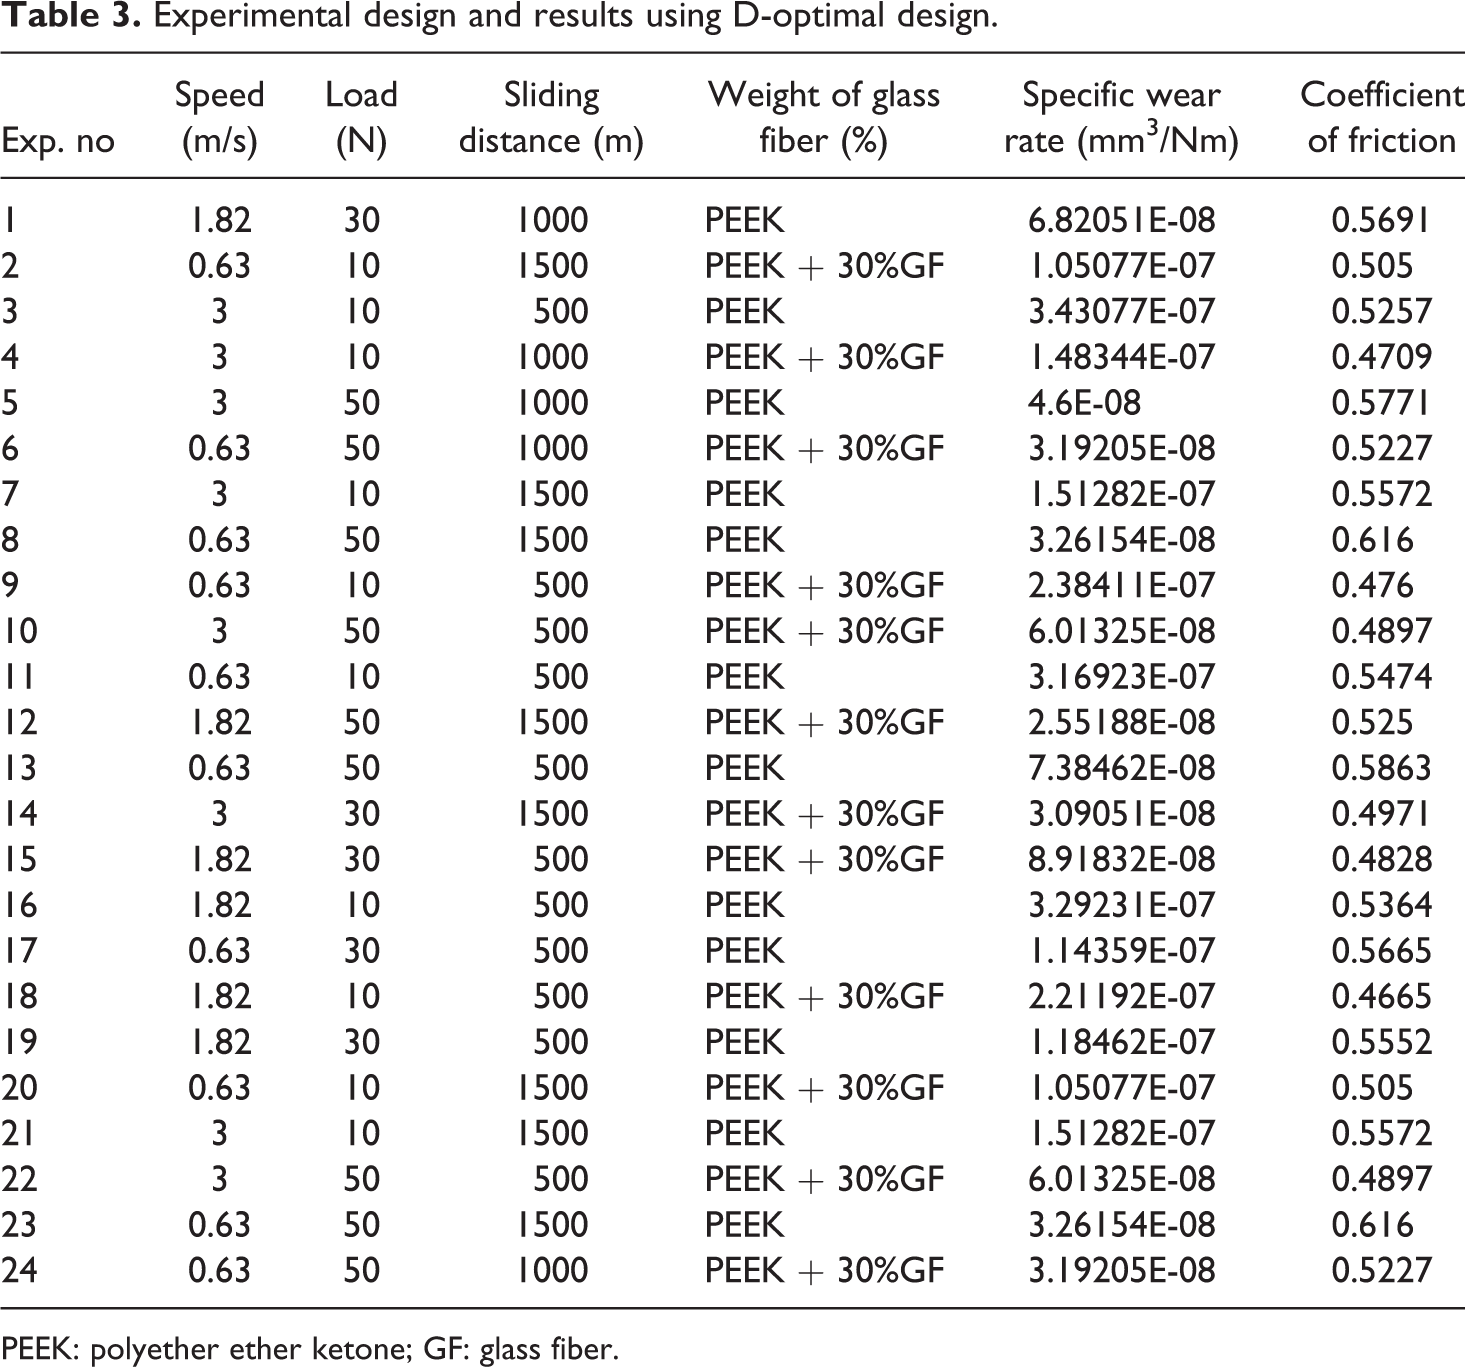
PEEK: polyether ether ketone; GF: glass fiber.
Results and discussion
Development of D-optimal design-based RSM models
RSM is an important branch of experimental design. It is a critical technology in developing new processes and optimizing their performance. It is often an important concurrent engineering tool in the process development because the objectives of process performance improvement can often be accomplished directly using RSM. RSM design is a helpful tool for quantification of the relationship between one or more measured responses and the vital input factors. An optimal experimental plan can be computed by the methodology of optimal experimental design for parameter estimation. D-optimal criterion, one of the several “alphabetic” optimalities, 24 is developed to select the design points in a way that minimizes the variance associated with the estimates of specified model coefficient. 23 D-optimal design assumes a wide choice of “candidate” points and an adequate coverage of design space.
RSM is a statistical modeling approach to determine the relationship between various process parameters and responses with the various desired criteria and further to search the significance of these process parameters. The D-optimal design is designed to use with categorical factors as an alternative to the general optimal design option. The general optimal design builder may produce designs with more runs. The procedures of D-optimal design consist of the defining level, selection of the fitting model, and the chosen design points. The design points chosen from the set of candidate points depend on the selected model.
24
In engineering fields, there is a relationship between the output response of interest “y” and a set of independent input variables {x
1, x
2,………x
n}. If the nature of the relationship between y and x values is known, then, a model can be formulated in the following form:
where “ε” represents the noise or error observed in the response y. If the expected response be 
In most RSM problems, the form of relationship between the response and the independent variable is unknown. Thus, the first step in RSM is to find a suitable approximation for the true functional relationship between y and the set of independent variables. Usually a second order model is utilized in RSM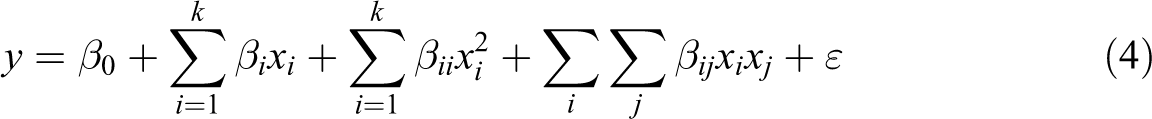
The β coefficients, which should be determined in the second order model, are obtained by the least square method. The unbiased estimator € which represents the error signal of the regression coefficient vector “a” is estimated by using the least square error method as follows
23

where X T is the transpose of the matrix X. In D-optimal design, the design points are selected by the selected quadratic model, which result in 14 minimum model points, where 5 points of them are used to estimate the lack of fit and replicates as well. The quadratic mathematical models for different responses are developed using Design Expert® software (Stat-Ease, Inc., USA). The final quadratic models developed in actual terms regarding responses like specific wear rate (in cubic millimeter per newton-meter) and coefficient of friction for PEEK and PEEK + 30%GF composites are presented in Tables 4 and 5, respectively.
Model equations of each response for PEEK composites.
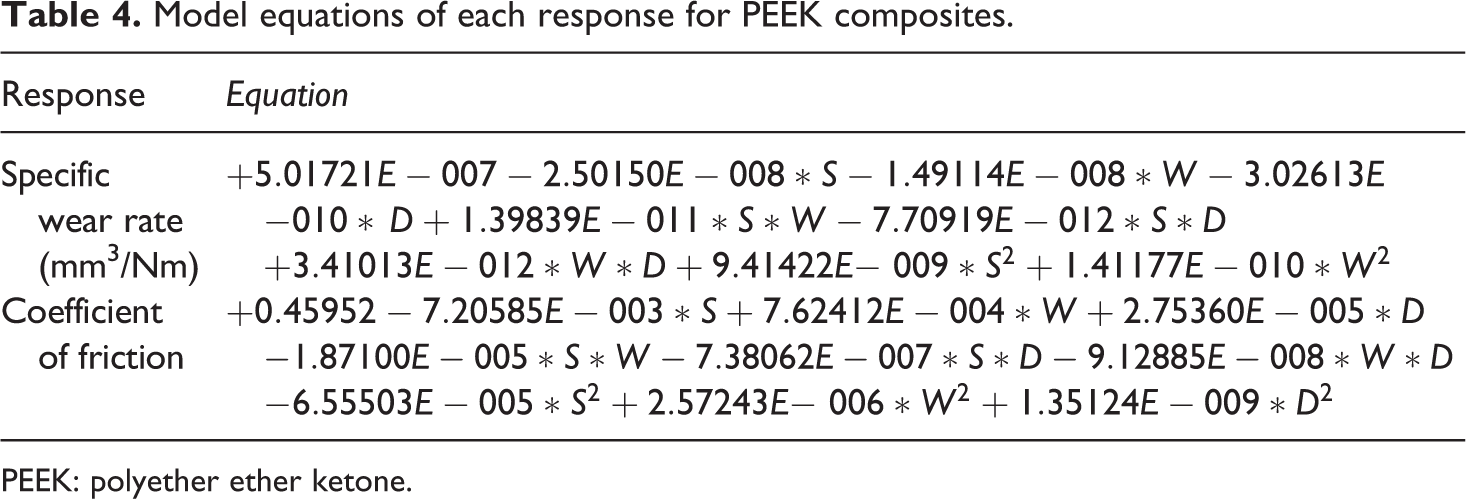
PEEK: polyether ether ketone.
Model equations of each response for PEEK/30 GF composites.
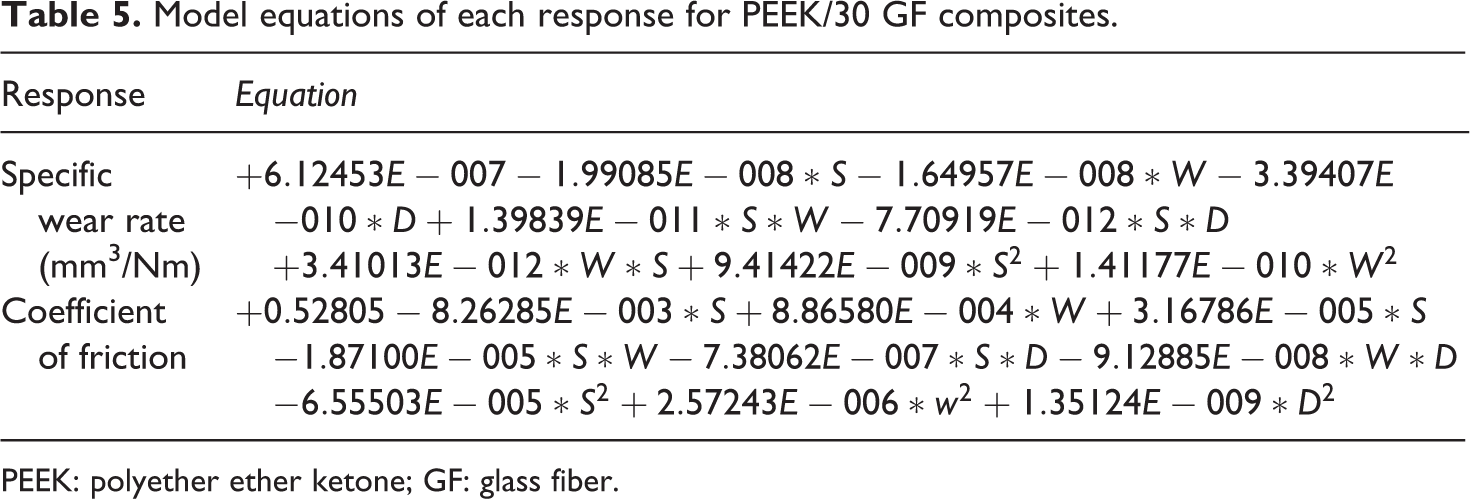
PEEK: polyether ether ketone; GF: glass fiber.
Analysis of the quadratic mathematical model
The developed models for specific wear rate (in cubic millimeter per newton-meter), coefficient of friction, and the experimental data are analyzed statistically using analysis of variance (ANOVA). ANOVA is used for identifying the factors that affects the performance measures of quadratic models. The ANOVA is partitioning of total variability in an experiment into its component parts ascribable to the controlled factors and error. In modeling, the objectives are used to estimate the variability of the parameters and variability among the error effects. The sum of square (SS) is the square of the deviation from the grand mean of the response, and mean square (MS) is the ratio of SSs to the number of degrees of freedom. F value is an index used to check the adequacy of the model, which is the ratio of MSs of the regression to the error terms.
The test for significance and the test for lack of fit are performed to analyze the adequacy of the developed model as shown in Tables 6 and 7. The values of “F value” and the “p > F” imply a statistical significance on the regression model and the particular linear, quadratic, or interaction terms. 26 R 2 and adjusted R 2 are measures of how well the model fits the data. These values can help to select the model with the best fit. The value of adequate precision (AP) in this model, which compares the range of the predicted value at the design point to the average prediction error is well above 10. The value of the ratio is greater than 10, which presents the adequate model discrimination. 27 Further the analysis of model validation is carried out using normal probability plot. The normal plots for responses presented in Figure 4 are normally distributed, and they resemble a straight line, which indicate that the developed models are significant. Furthermore, residuals versus predicted plots are normally distributed, and the equality of variance does not seem to be violated, as presented in Figure 5.
ANOVA—model validation—specific wear rate.
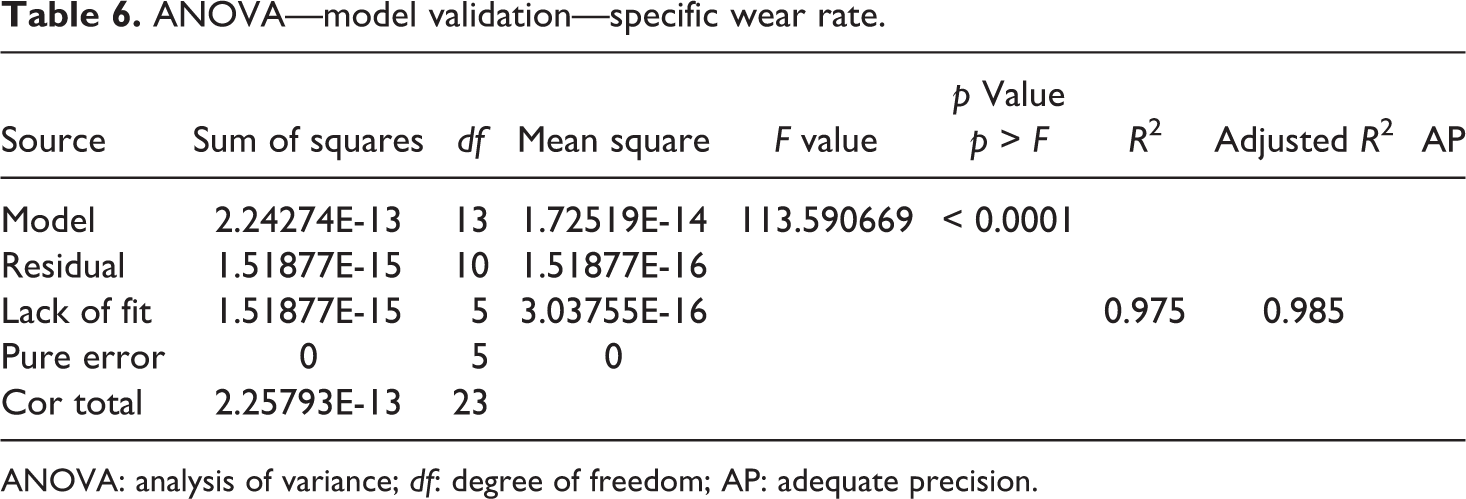
ANOVA: analysis of variance; df: degree of freedom; AP: adequate precision.
ANOVA—model validation—coefficient of friction.
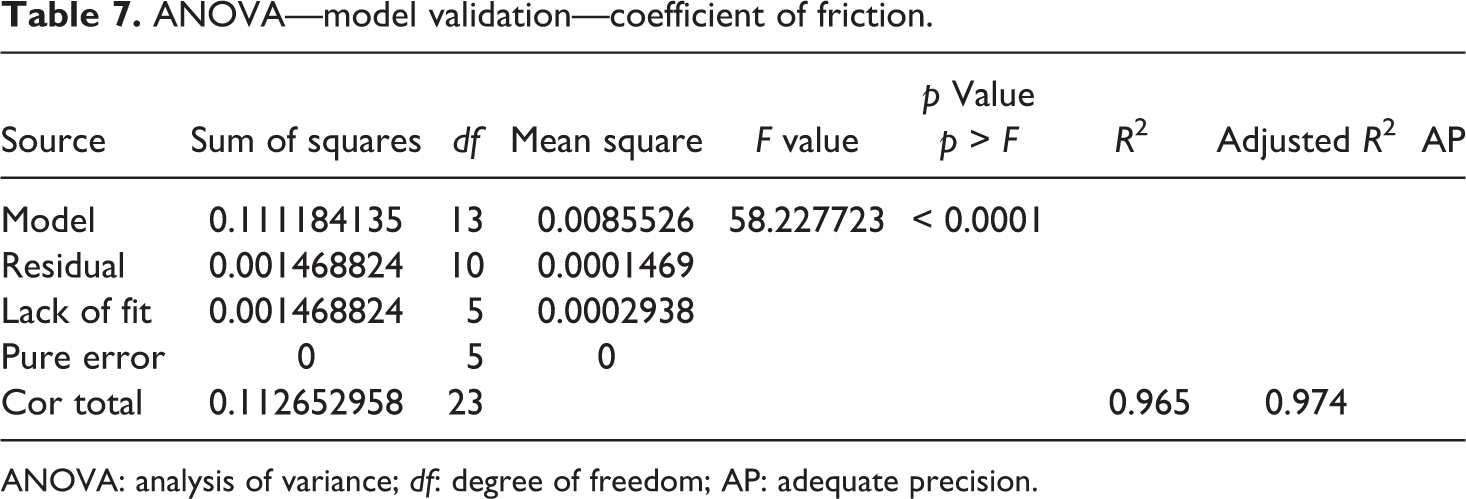
ANOVA: analysis of variance; df: degree of freedom; AP: adequate precision.
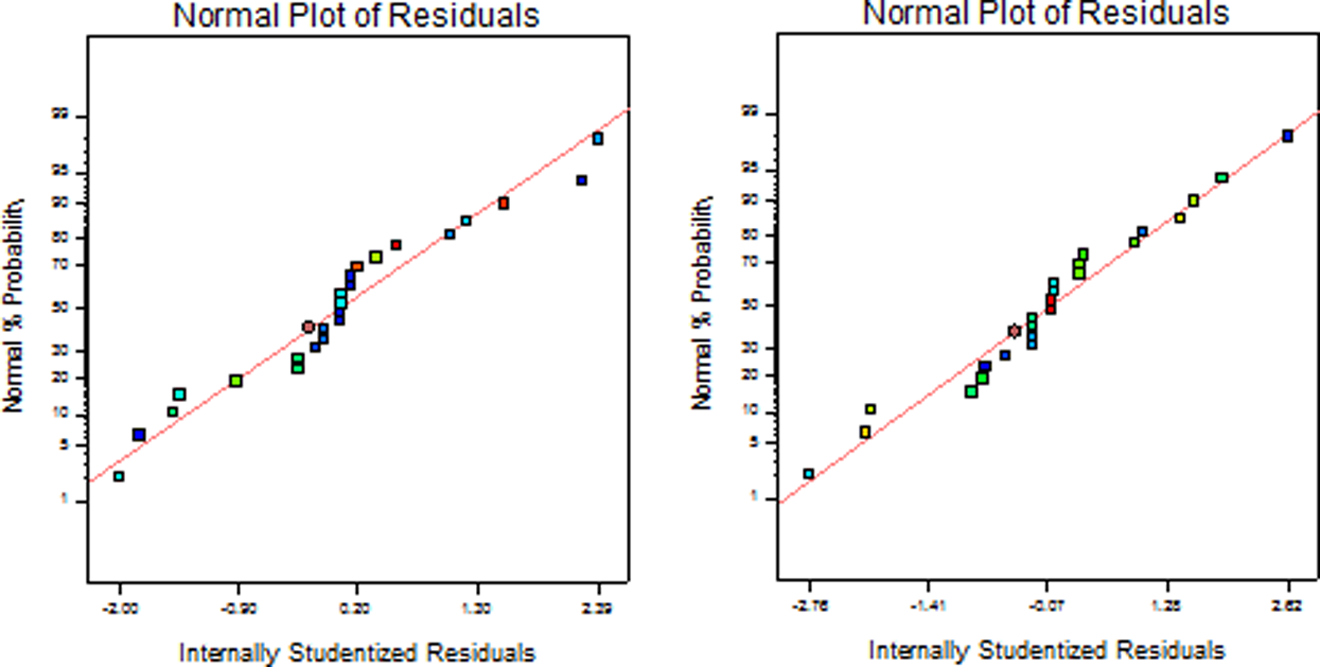
Normal probability plot of residuals for each response: specific wear rate (a) and coefficient of friction (b).
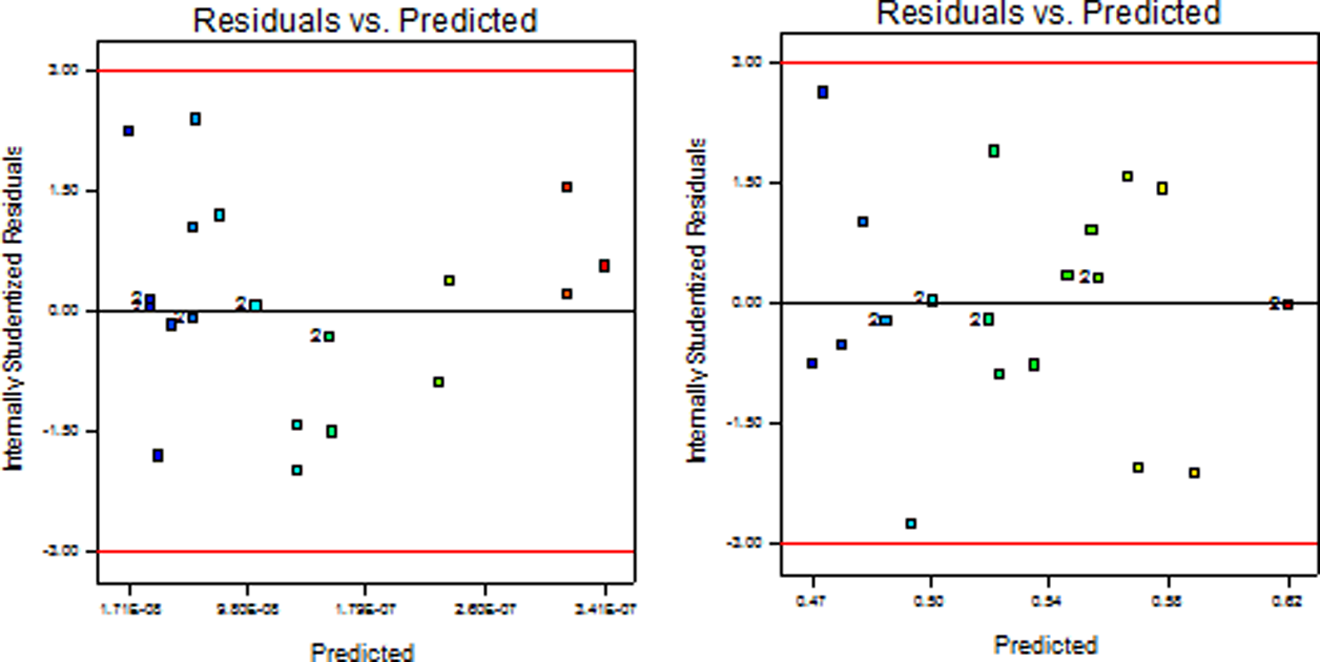
Residuals versus the predicted plot for each response: specific wear rate (a) and coefficient of friction (b).
The specific wear rate and coefficient of friction of the PEEK matrix composite can be calculated from equations presented in Tables 4 and 5. The values of β 0 for PEEK and PEEK/30 GF composites are 6.12453E-007, 0.52805 and 5.01721E-007, 0.45952, respectively. The value of β 0 is the intercept of the plane and is a mean response value for all the experiments conducted. 27 The value of β 0 depends not only on the major parameters sliding speed, load, and sliding distance, which are considered in this study, but also with experimental irregularities like machine vibrations, environmental conditions, and the surface finish of both the pin and the disk. It is very clear from the experimental results and the coefficient β 0 of the equations that the wear resistance of PEEK/30 GF is more than that of PEEK composite. The positive values of the coefficient suggest that the specific wear rate and coefficient of friction of the composites increases with the increase in the associated variables, whereas the negative values of the coefficients indicates an opposite effect. The magnitude of the variables indicates the relative weight of each of these factors. It is observed from equations presented in Tables 4 and 5 that sliding speed has a greater effect on responses of the composite, followed by load and sliding distance. 27
Optimization of tribological parameters using desirability function analysis
In this work, the multiple performance optimization of tribological parameters is carried out using RSM-based desirability function approach. One useful approach to the optimization of multiple responses is to use the simultaneous optimization technique popularized by Derringer and Suich.
28
Their procedure introduces the concept of desirability functions. The method makes use of an objective function D(X), called the desirability function and transforms an estimated response into a scale free value (d
i) called desirability. The desirable ranges are from 0 to 1 (least to most desirable, respectively). The factor settings with maximum total desirability are considered to be the optimal parameter conditions. The simultaneous objective function is a geometric mean of all transformed responses: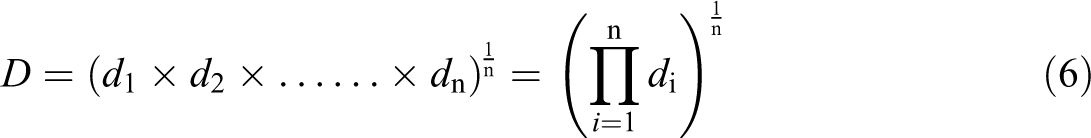
where n is the number of responses in the measure. If any of the responses or factors fall outside their desirability range, the overall function becomes zero.
The optimization analysis is carried out using Design Expert software package. The goal set, lower limits used, upper limits used, weights used, and importance of the factors given are presented in Table 8. In desirability-based approach, different best solutions are obtained. The solution with high desirability is preferred. The best solution obtained for the optimization is presented in Table 9. The optimum solution is presented as contour plots in Figure 6. The optimization results indicated that sliding speed at 2.92 m/s, load at 33 N, sliding distance at 1053 m, and PEEK/30 GF are preferred to minimize the specific wear rate and coefficient of friction in dry sliding condition.
Goals set and limits used for optimization.
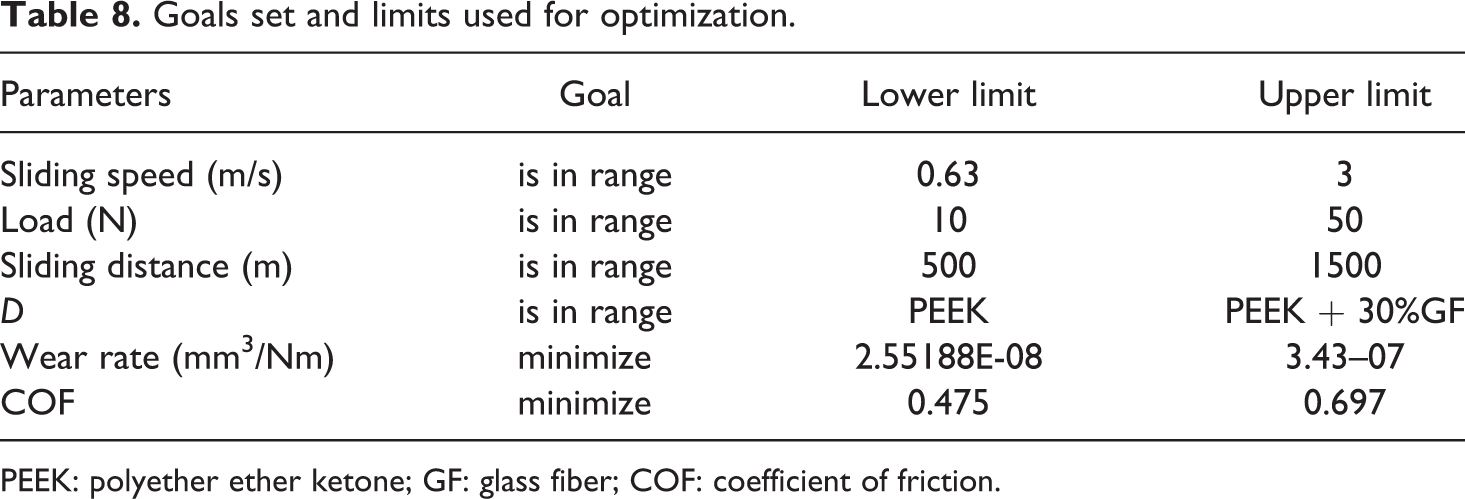
PEEK: polyether ether ketone; GF: glass fiber; COF: coefficient of friction.
Best global solution.
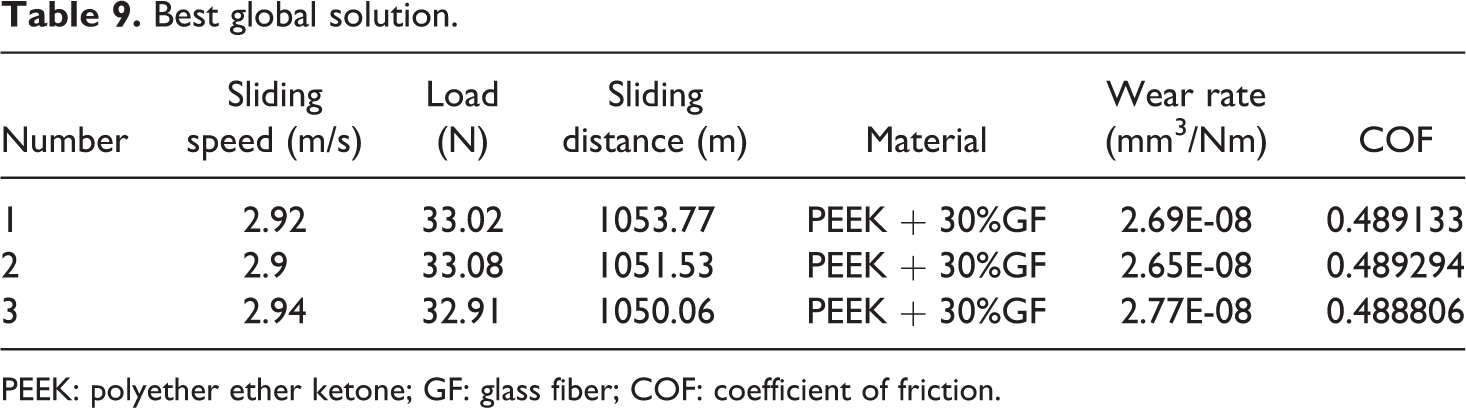
PEEK: polyether ether ketone; GF: glass fiber; COF: coefficient of friction.
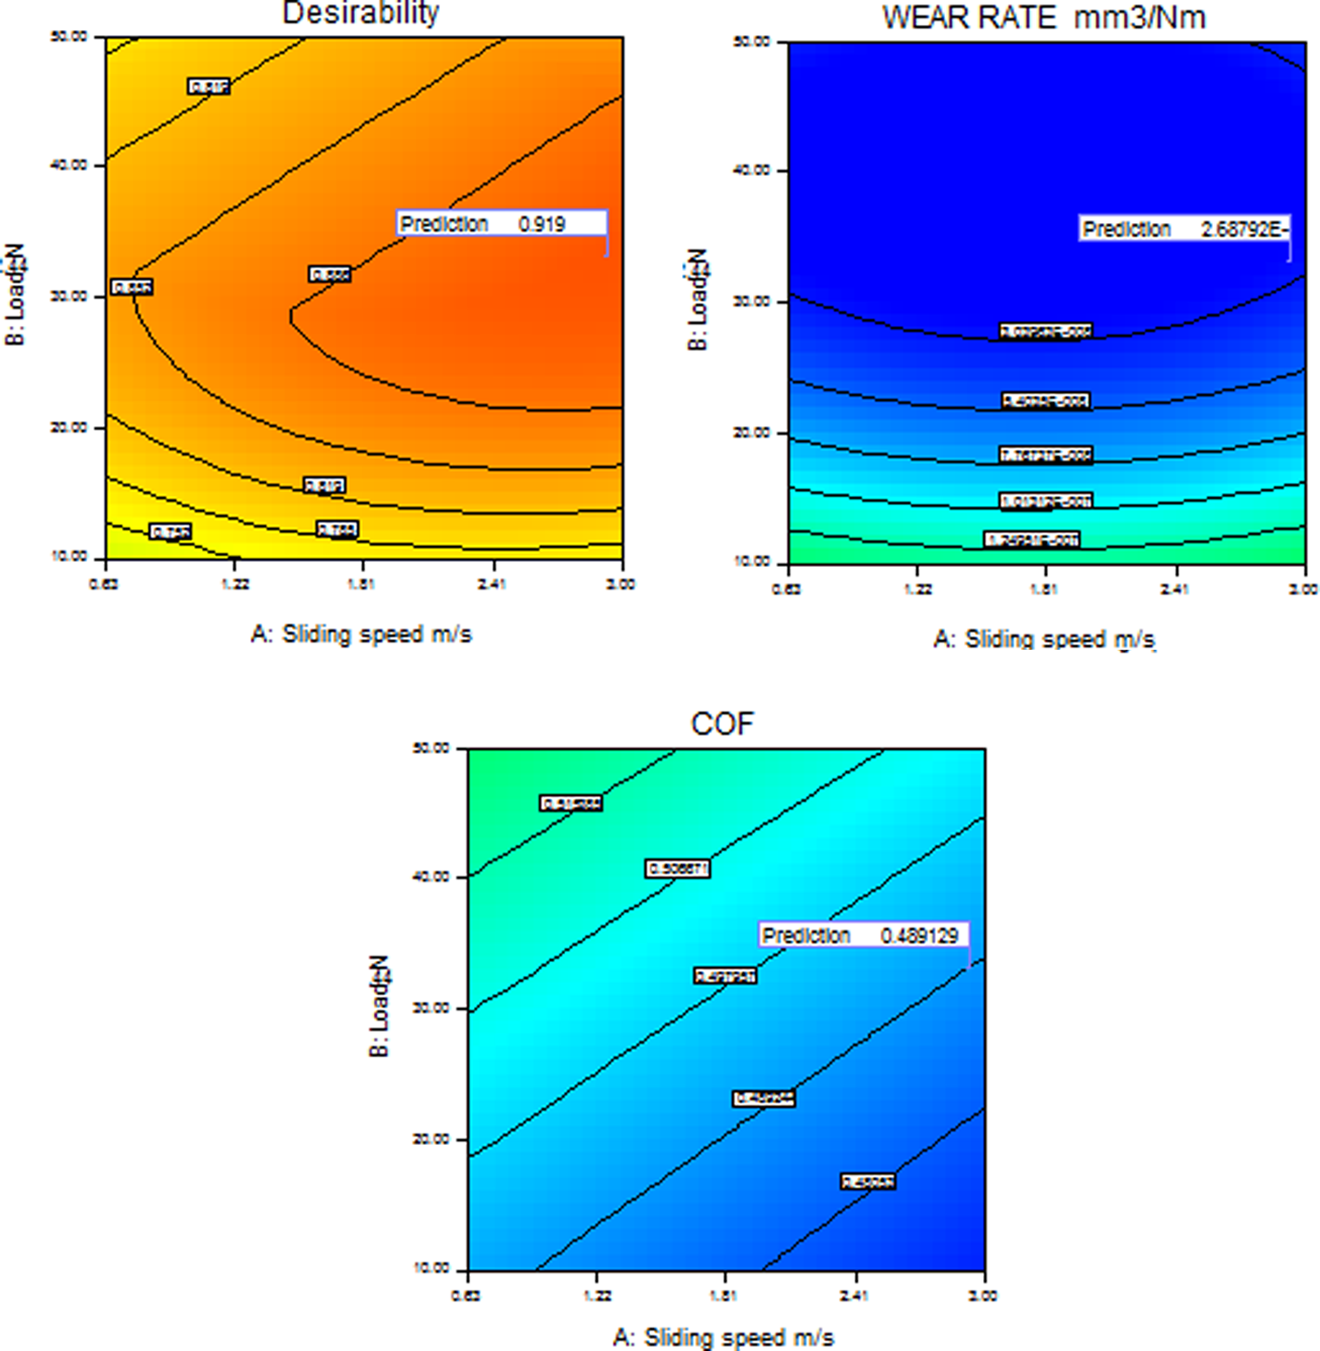
Optimized contour plots for performances on sliding speed versus load planes when wt% of GF = 30% and sliding distance = 1000 m. GF: glass fiber.
The ramp function graph (Figure 7) drawn using DesignExpert solver shows the desirability of each responses. The dot on each ramp reflects the factor setting or response prediction for those response characteristics. The height of the dot shows how much desirable it is. A linear ramp function is created between the low value and the goal or the high value and the goal as the weight for each parameter is set equal to one. Bar graph (Figure 8) shows the overall desirability function of the responses. Desirability varies from 0 to 1 depending upon the closeness of the response toward target. The bar graph shows how well each variable satisfies the criterion: a value near to 1 is considered to be good.
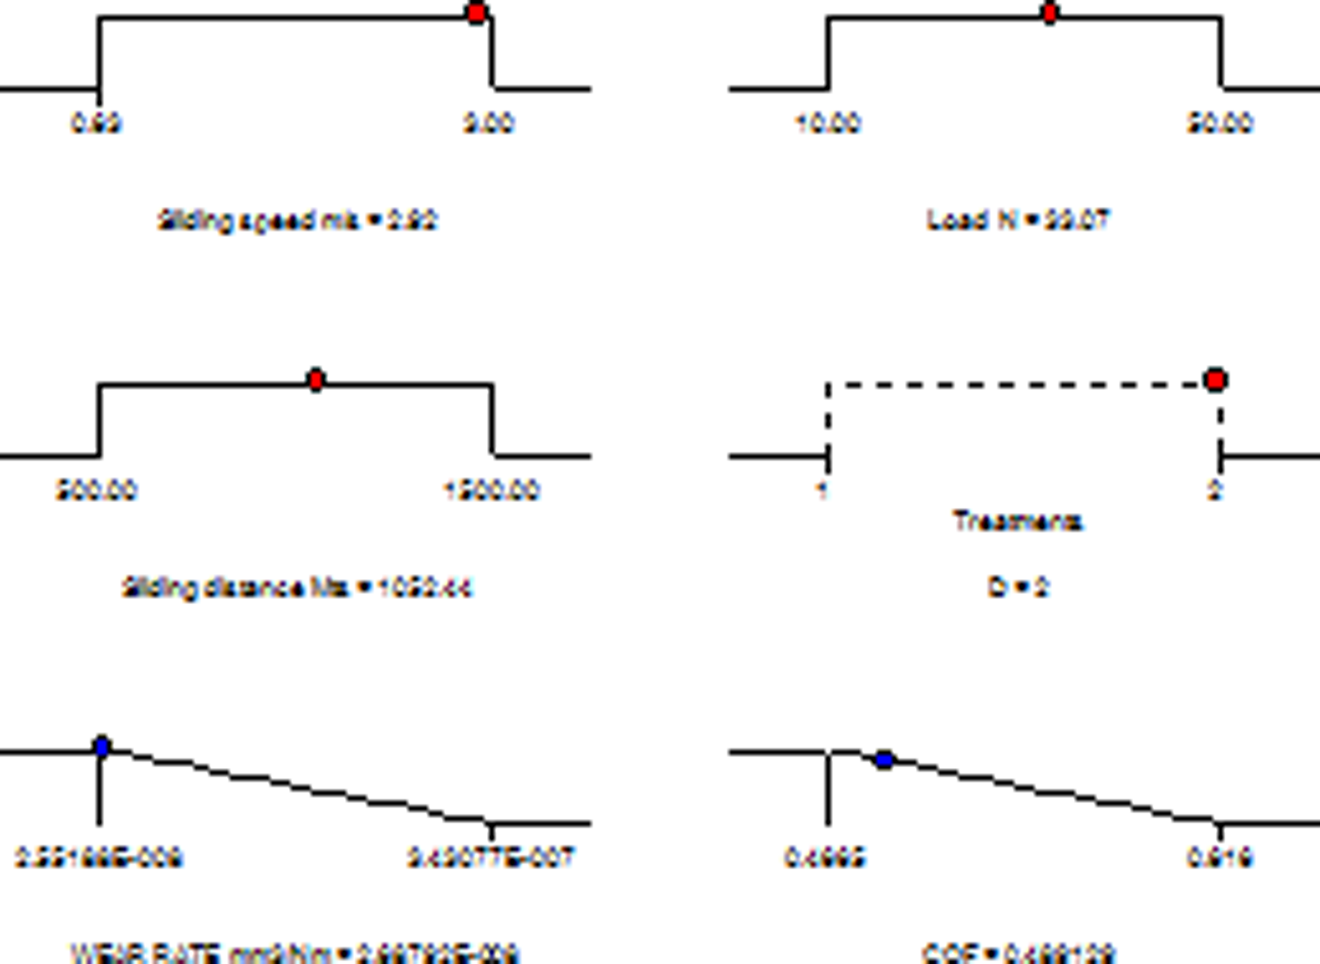
Ramp function graph of desirability for responses.
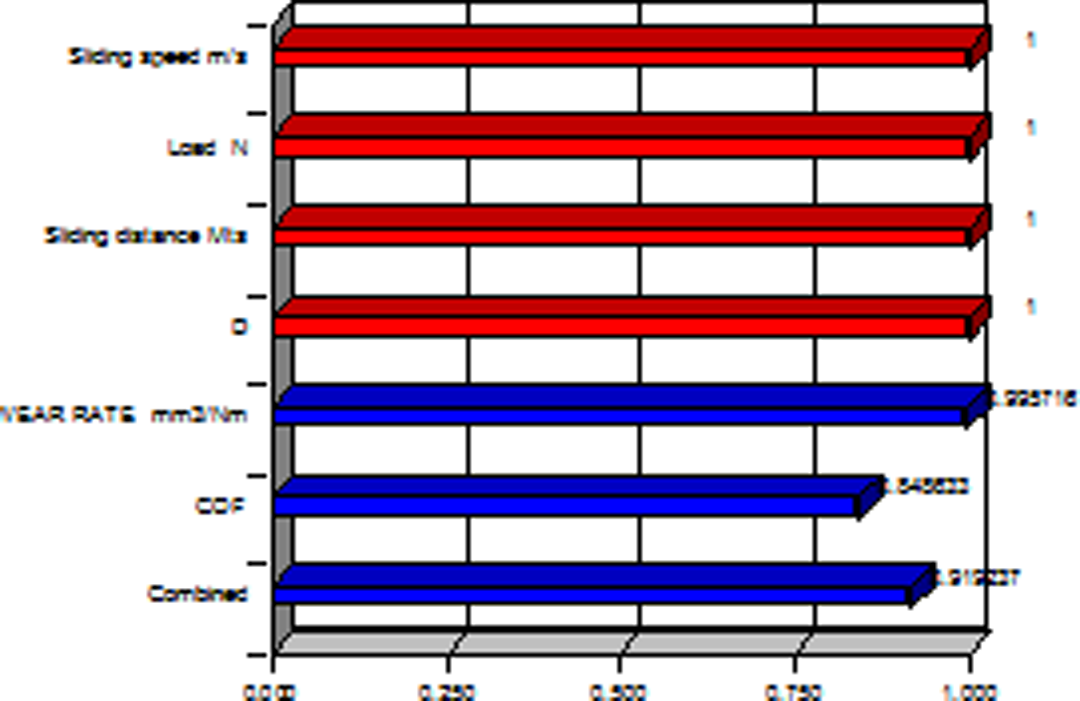
Bar graph of desirability for responses.
Confirmation experiments
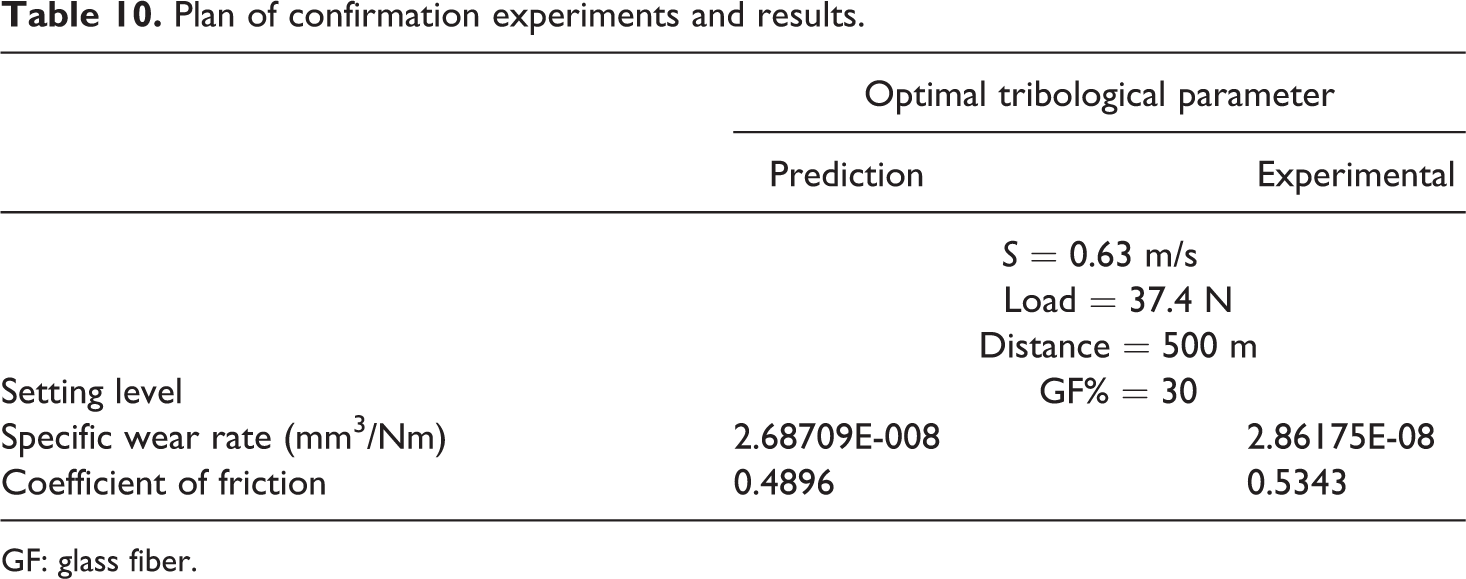
In addition to statistical validation, the developed models have also been validated by conducting confirmation experiments. The details of confirmation experiments are given in the Table 10. The confirmation experiments are repeated two times, and the average values have been used. The predicted values are very close to the experimental results, and hence, the developed model is suitable for predicting the responses in dry sliding wear of PEEK matrix composites.
Plan of confirmation experiments and results.
GF: glass fiber.
Effect of tribological parameters on performances
Specific wear rate
The effect of sliding speed, load, and sliding distance on specific wear rate is presented as a three-dimensional (3D) response surface plot in Figure 9. The specific wear rate decreased with load, sliding speed, and sliding distance, indicating improved wear resistance at the higher loads. 29 This is because of transfer film formed on the steel disk. This formation of transfer film provides soft polymeric material from the hard metallic material. Also, contact between polymer surface and transfer film further reduces wear rate, 30 which is schematically presented in Figure 10. The higher the load applied, the stronger the abrasive effect on the counter face. The produced high frictional force at the running time could cause a high thermal effect to soften the composite surface. According to Xie et al., 5 the higher the load applied, the easier the counter face could be modified, and the quicker the transfer film formed. The transfer film would provide shielding for the soft polymer surface from the hard metal surface. So, the lower wear rate could be achieved at the higher load.
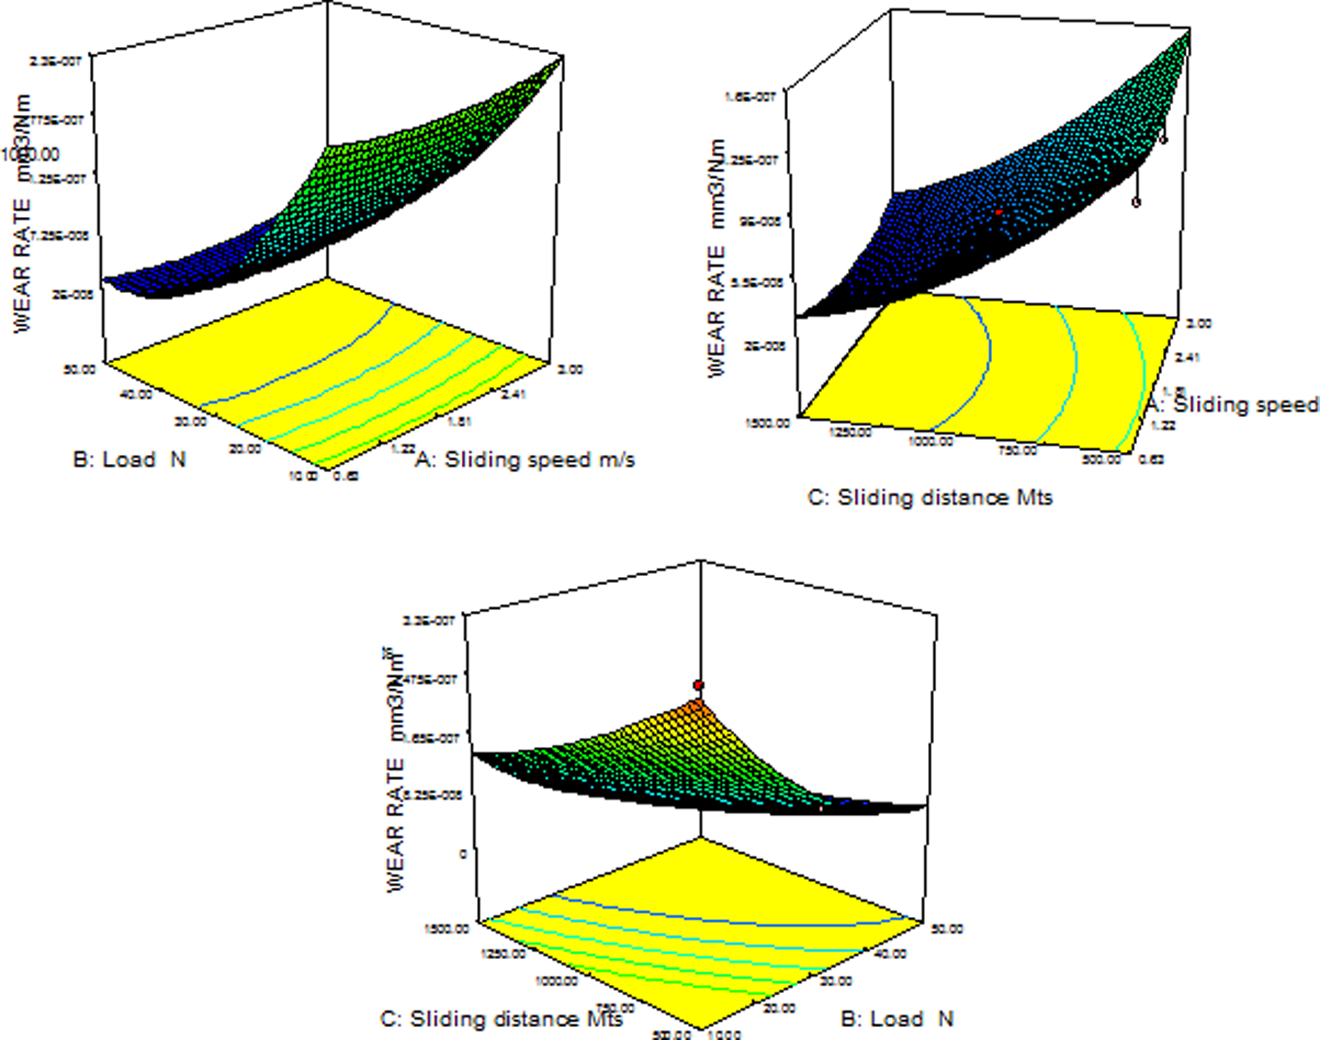
Estimated three-dimensional response surface plot for specific wear rate function of tribological parameter.
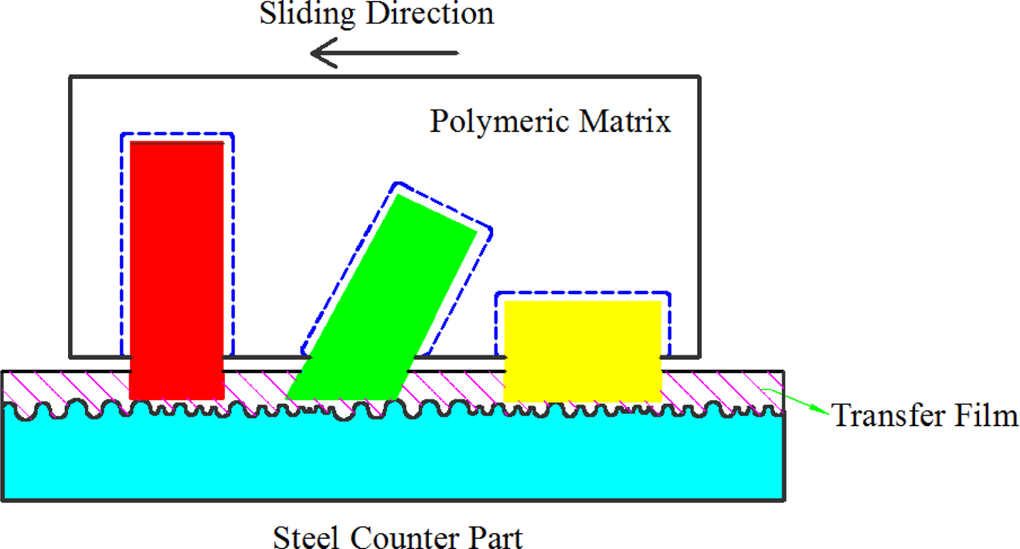
Schematic representation of wear mechanism of PEEK matrix composites. PEEK: polyether ether ketone.
The effect of percentage of GF leads to a reasonable decrease of the wear rate as shown in Figure 11. An improved hardness of composites results in incorporation of GF, which is a hard phase, into the matrix. Increase in hardness results in improvement of wear and seizure resistance of materials. When the GFs are strongly bonded with PEEK matrix, they protect the surface against severe destructive action of the counter face. This is because the strong interface bond, which plays a critical role in transferring loads from the matrix to hard particles, results is less wear of the material. 31
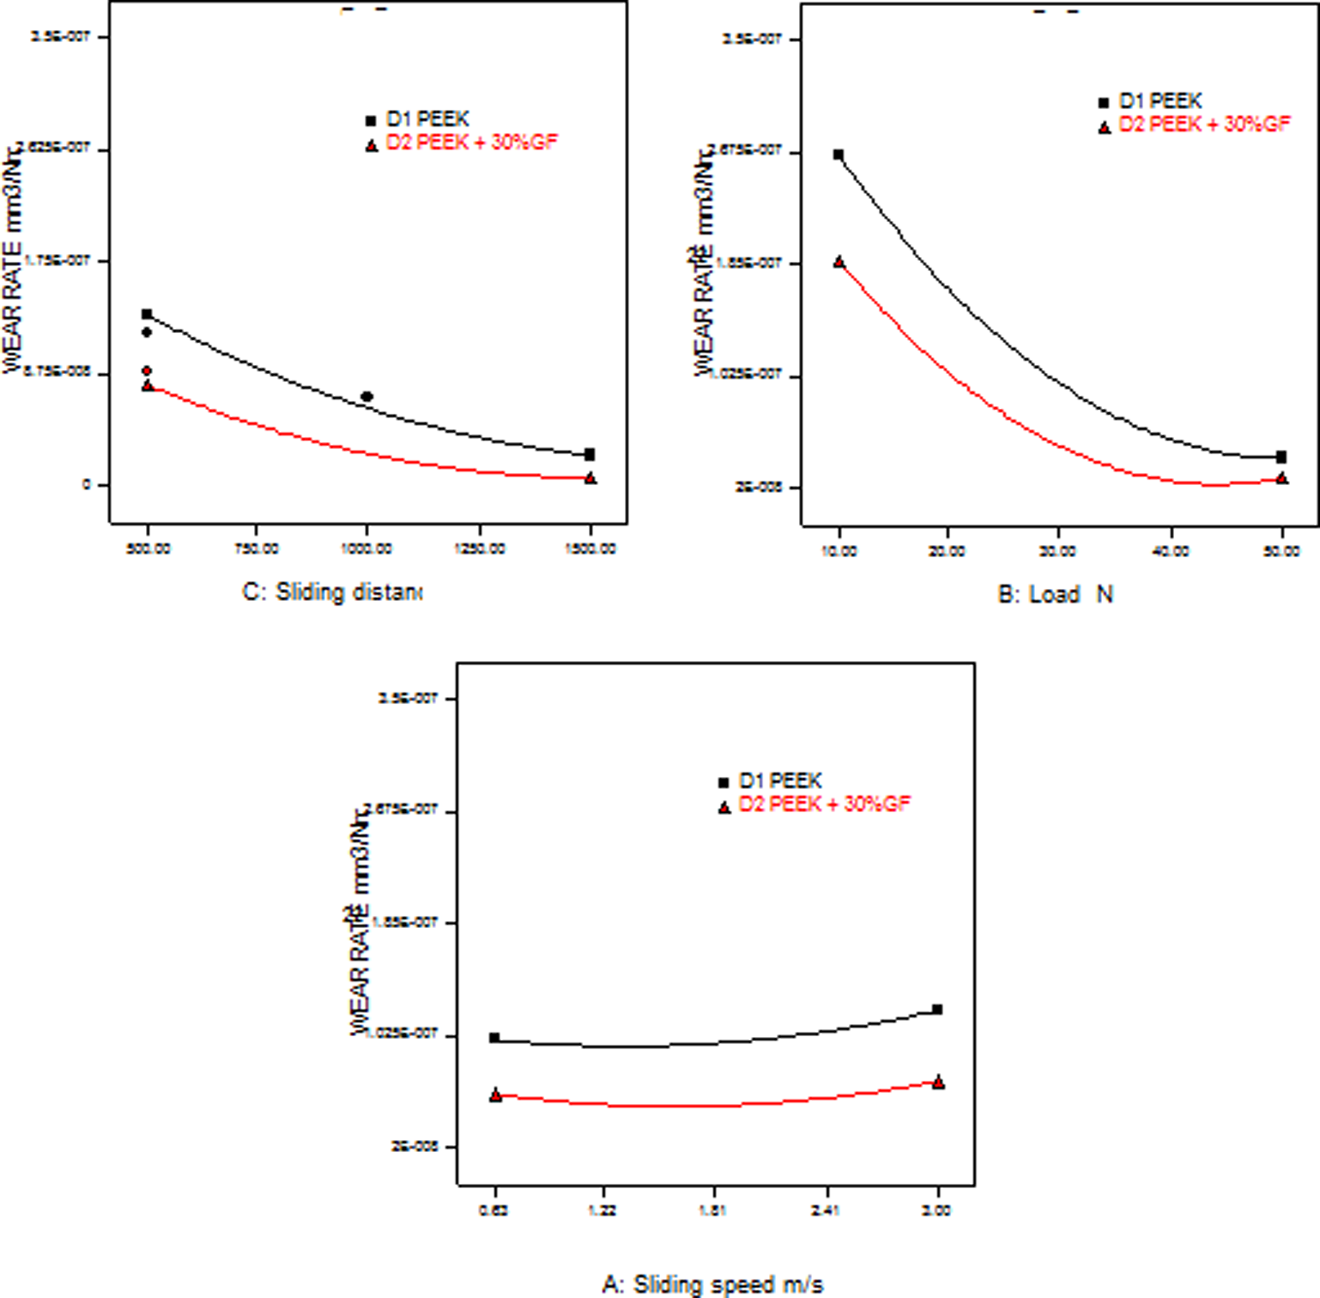
Effect of wt% of glass fiber on specific wear rate.
Coefficient of friction
The estimated 3D response surface for coefficient of friction in dry sliding wear of PEEK matrix composites is presented in Figure 12. From the analysis of graphs, it can be concluded that the increase of the load leads to a significant increase of the friction coefficient. According to Dharmalingam et al., 29 the normal load determined the real area of contact, and to shear over this area, tangential force was needed. If the normal load is increased, then the area of contact will increase along with tangential force. Hence, instantaneous value of coefficient of friction will also increase. The effect of the increase in sliding speed leads to a significant decrease of the friction coefficient for fixed load and sliding distance. During the initial stages, the surfaces of both the composite specimens and the steel counterpart were rough and thus strong “interlocking” took place, resulting in a high friction coefficient. As the wear process continued, the rough profiles of the steel counterparts and the PEEK composite specimens are smoothened as a result of abrasion and a transfer film formed on the surface of the counter face. Consequently, lower coefficients of friction were achieved when a steady wear stage was reached.
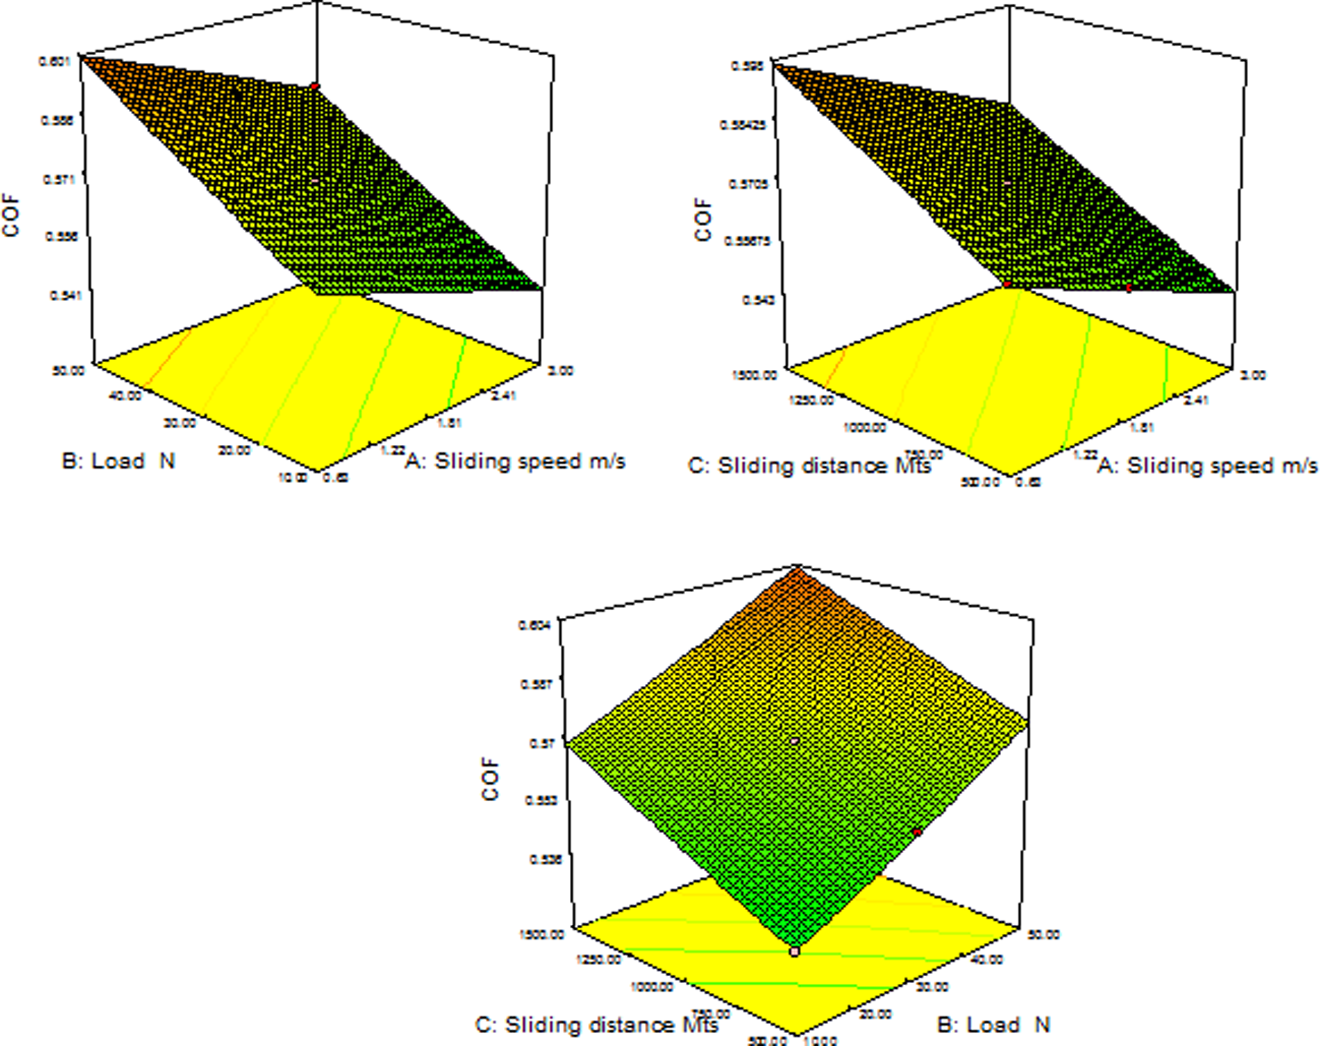
Estimated three-dimensional response surface plot for coefficient of friction function of tribological parameter.
Figure 13 shows that the effect of the increase in percentage of GF also leads to a significant decrease of the friction coefficient. Rabinowicz 32 found that friction force required to start sliding is usually greater than force required maintaining sliding, and, hence, kinetic friction coefficient generally has a positive slope at slow sliding speeds and a negative slope at high sliding speeds. With very smooth surfaces, the friction tends to be high because the real area tends to be very high as the real area of contact grows excessively, whereas with very rough surfaces, the friction is high because of the need to lift one surface over the asperities on the other.
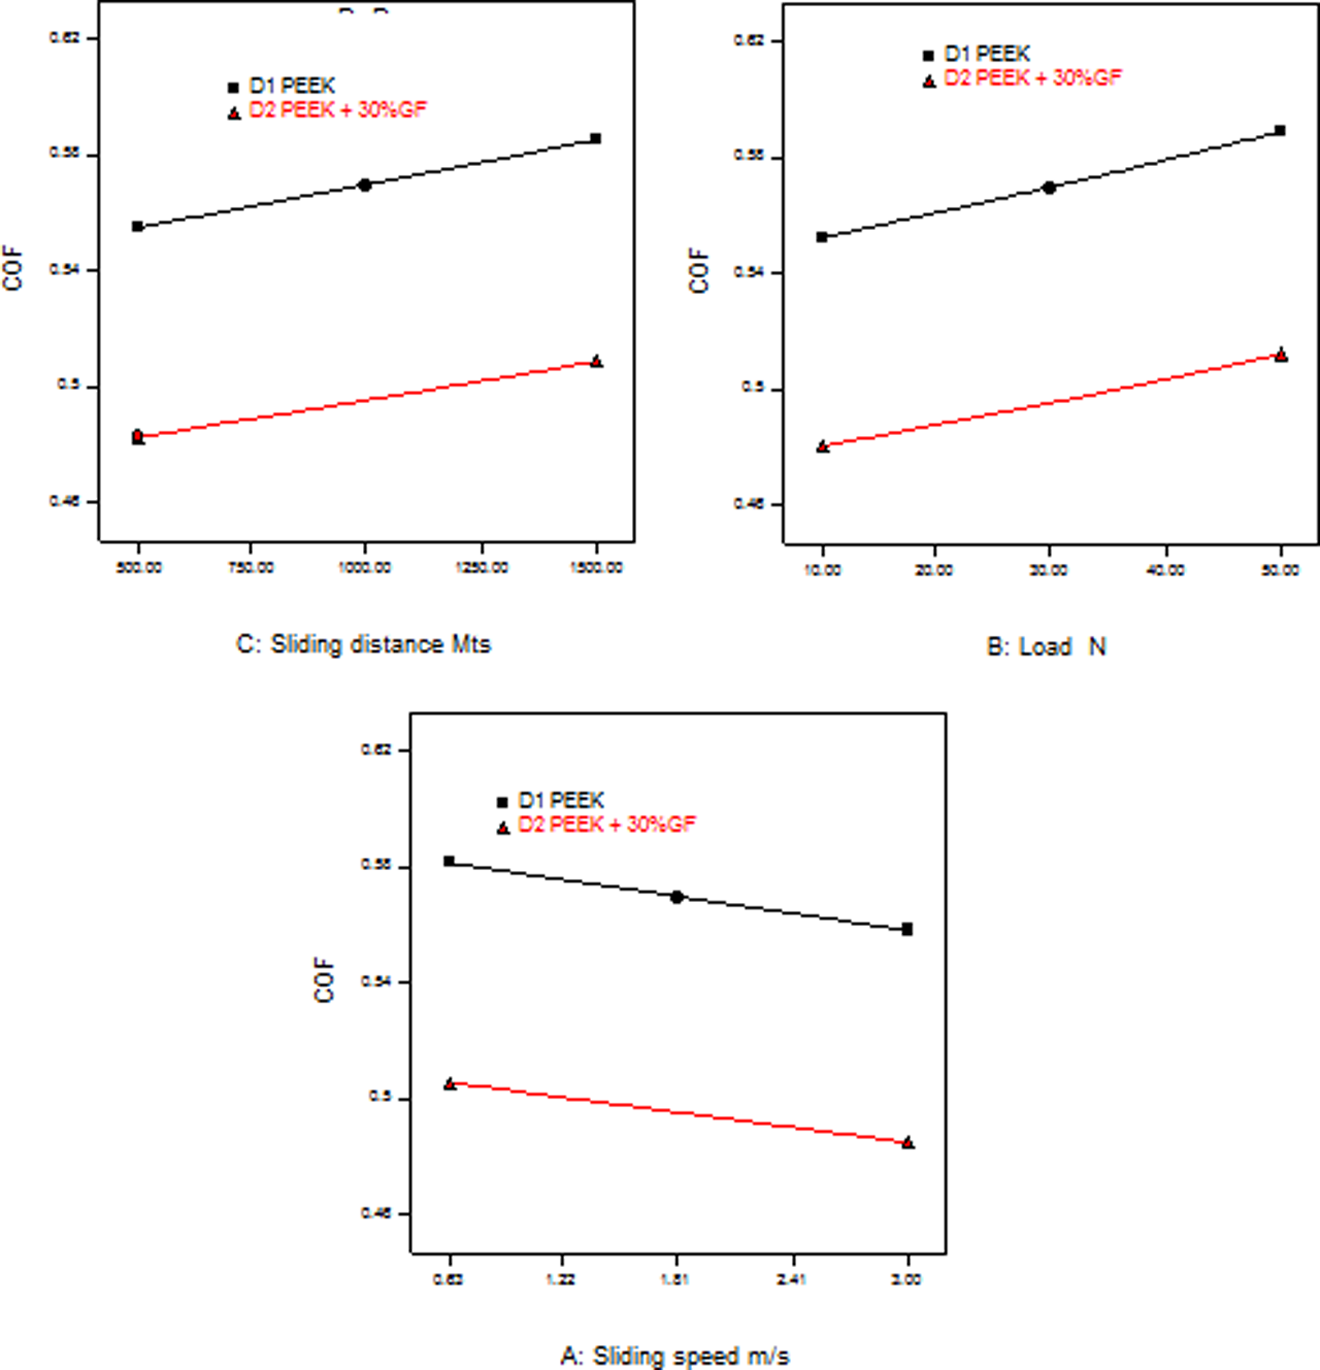
Effect of wt% of glass fiber on coefficient of friction.
SEM analysis
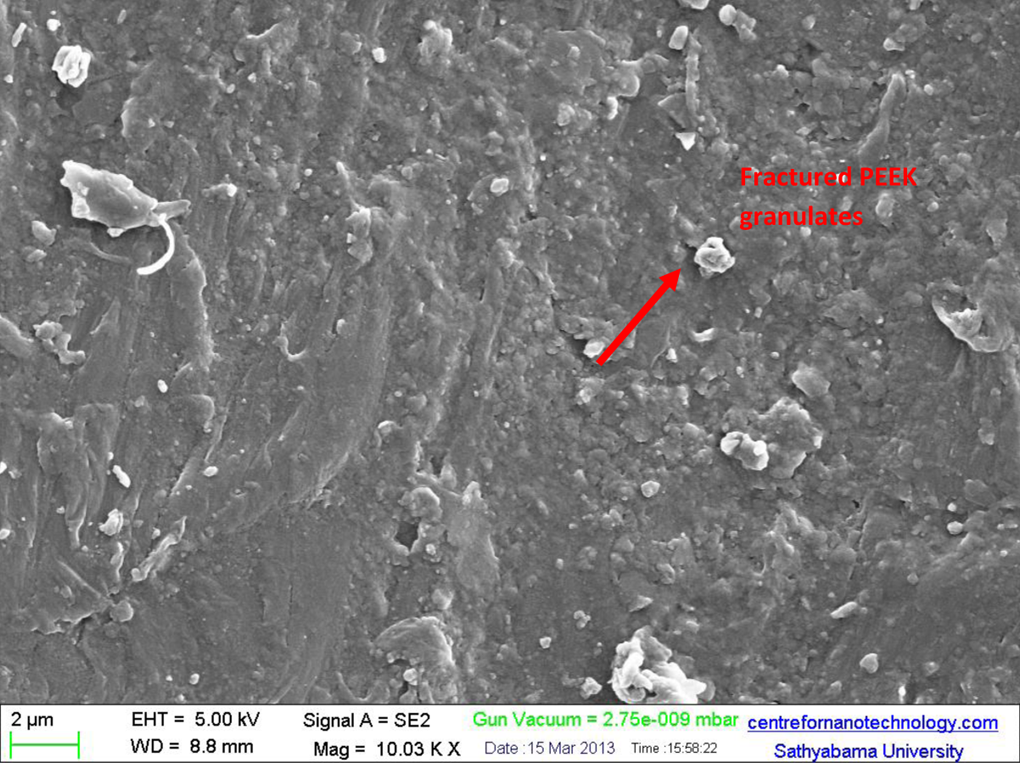
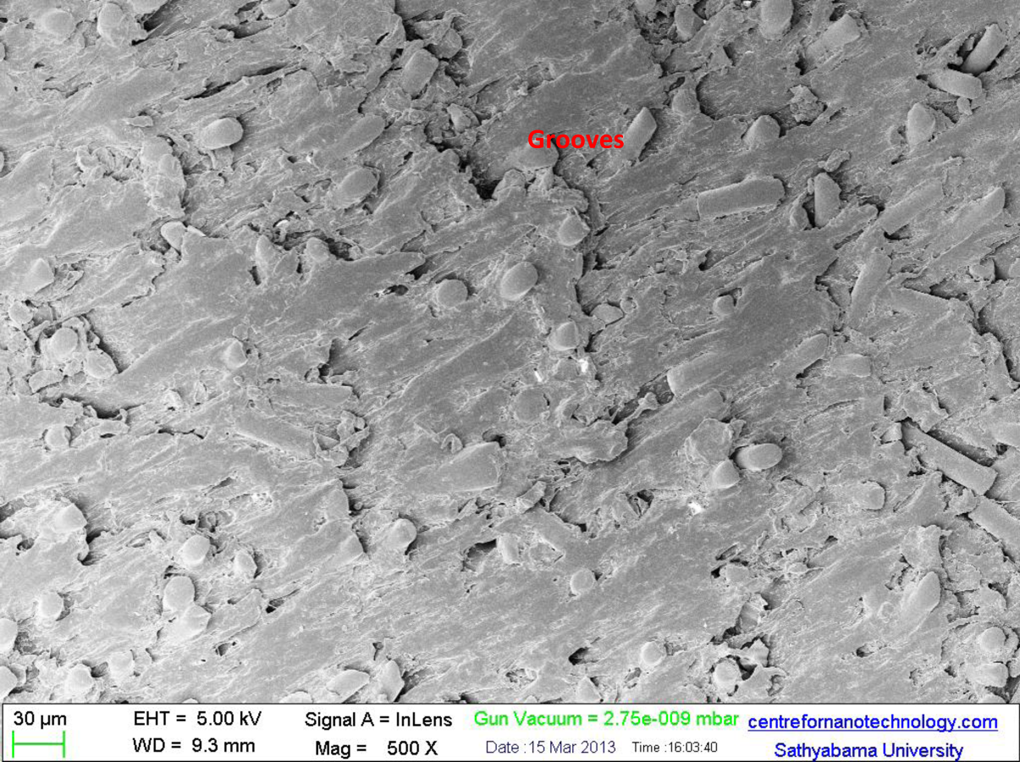
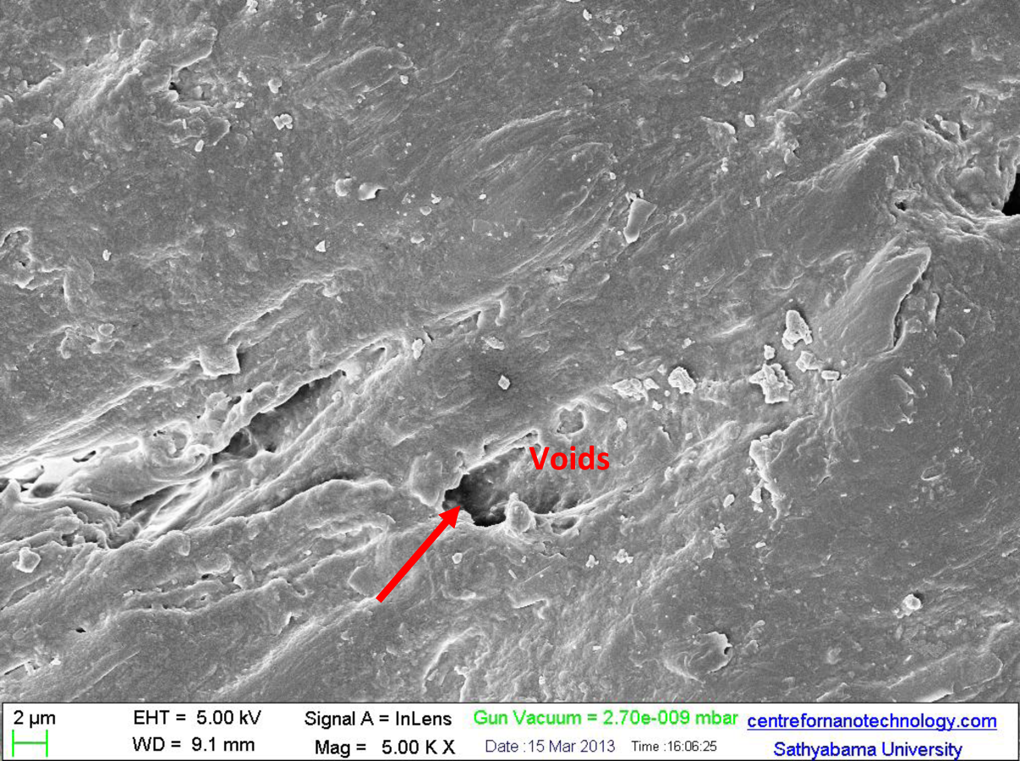
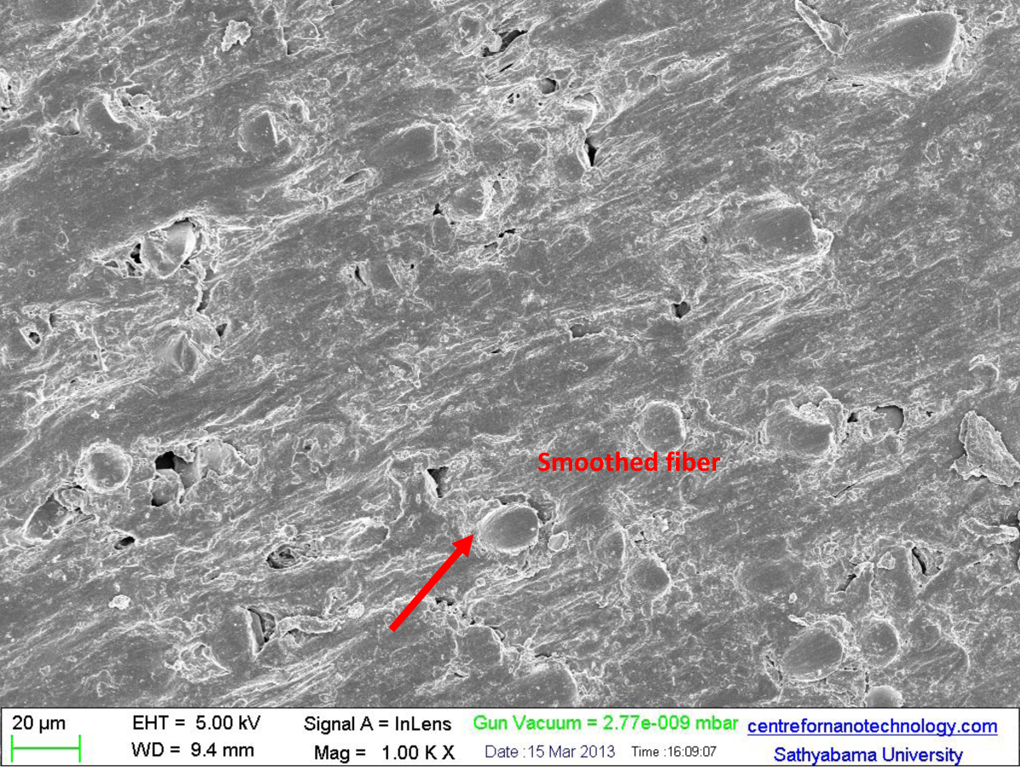
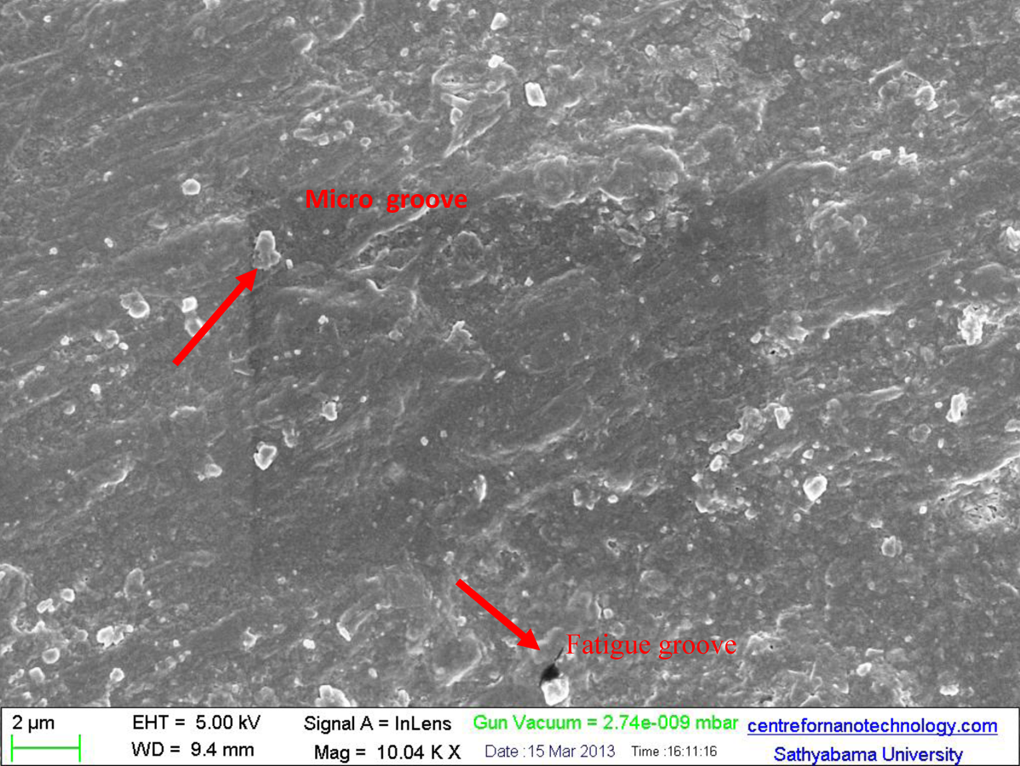
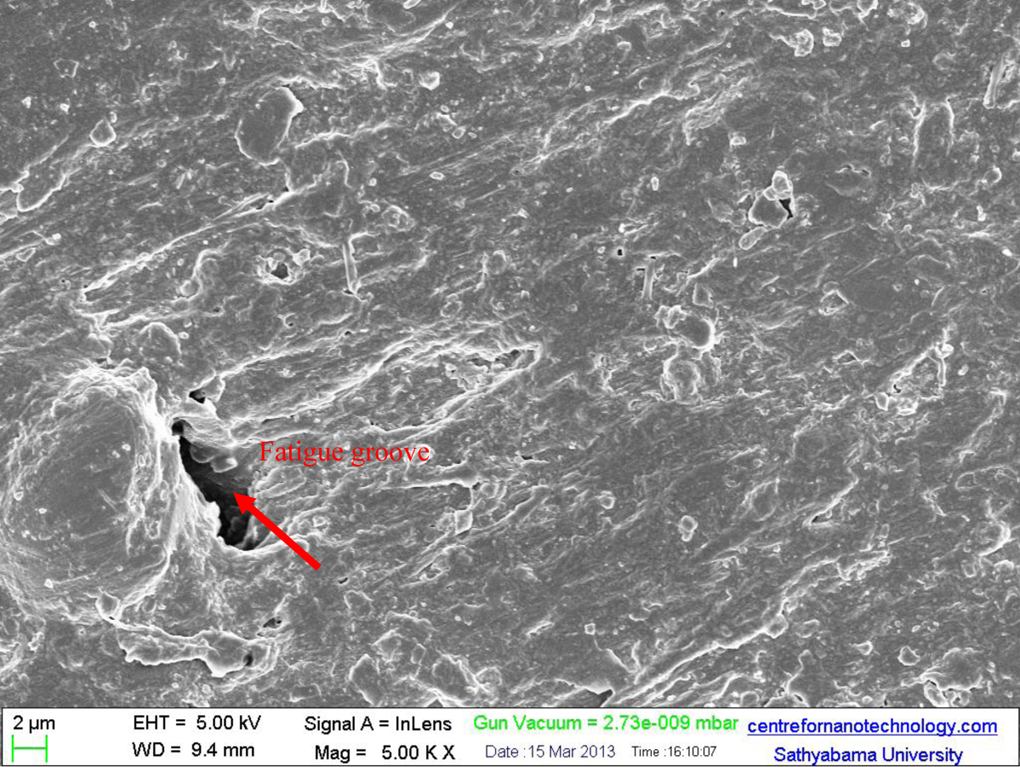
The counter faces were examined by SEM, as shown in Figures 14 and 15. It can be seen that the transfer film on the counterpart of the PEEK is extensive and lumpy (Figure 14). By contrast, the transfer film on the counter faces against the PEEK/30 GF is thin, uniform, and intractable (Figure 15). The high quality transfer film could effectively prevent the direct contact of the composites with the counter faces so that the wear was greatly inhibited. This might be the main contribution to the enhancement of the wear resistance of the PEEK/30 GF. 5 To understand more about the GF effect on the wear behavior, the worn surfaces of PEEK and the composite reinforced with 30 wt% glass were observed by the SEM and are presented in Figures 16 to 23. From SEM micrograph it is asserted that the worn surface of the PEEK composite reinforced with 30 wt% GF is smooth. Only few plow up tracks and microcracks can be found. In addition, many fibers on the pin surface are also found. As the load increases to higher values, the morphology of the worn surfaces gradually changes from fine scratches to distinct grooves. 33 The worn surface of the PEEK composite without GF is full of microgrooves and fatigue microcracks marks.
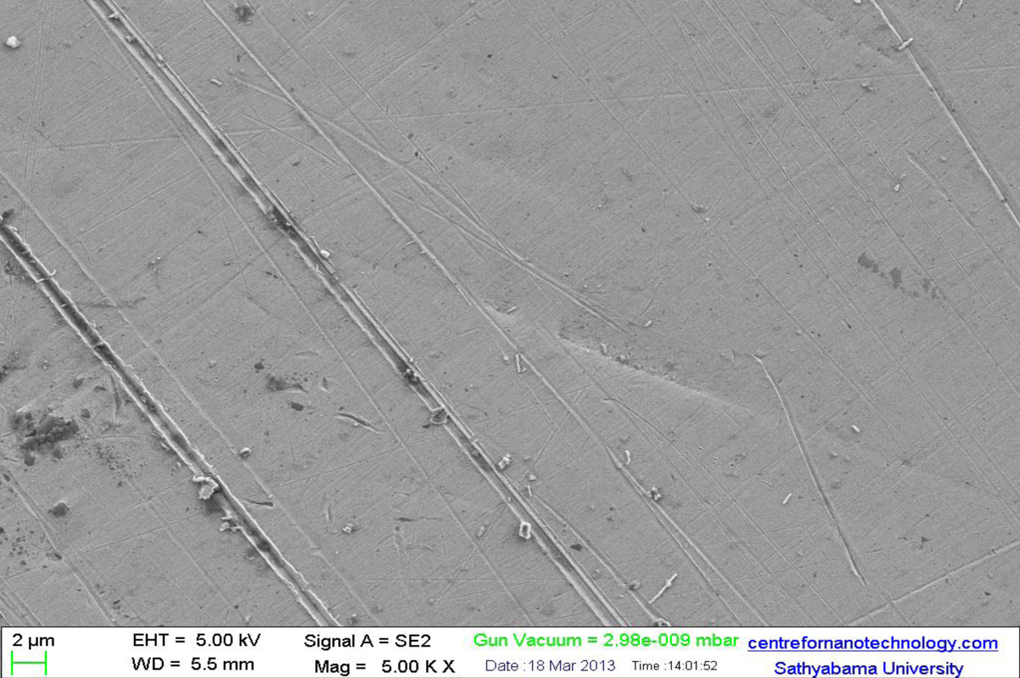
The typical morphologies of the counterpart surfaces of PEEK composite. PEEK: polyether ether ketone.
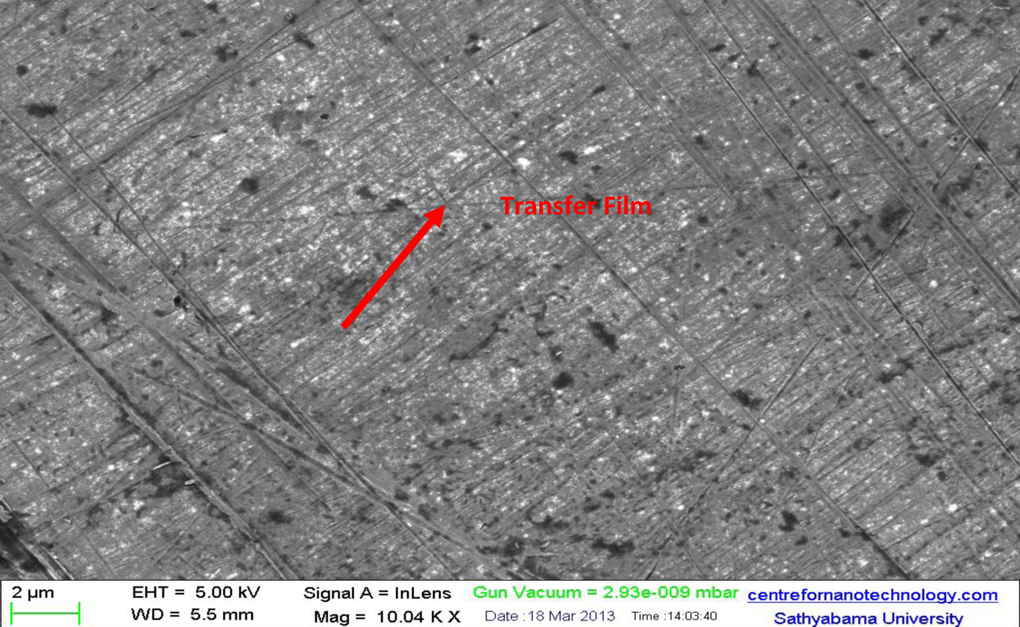
The typical morphologies of the counterpart surfaces of PEEK/30 GF composite. PEEK: polyether ether ketone; GF: glass fiber.
SEM micrographs of unreinforced PEEK when sliding speed = 1.82 m/s; load = 10 N; and sliding distance = 500 m. SEM: scanning electron microscopy; PEEK: polyether ether ketone.
SEM micrograph of PEEK/30 GF when sliding speed = 3 m/s; load = 30 N; and sliding distance = 1500 m. SEM: scanning electron microscopy; PEEK: polyether ether ketone; GF: glass fiber.
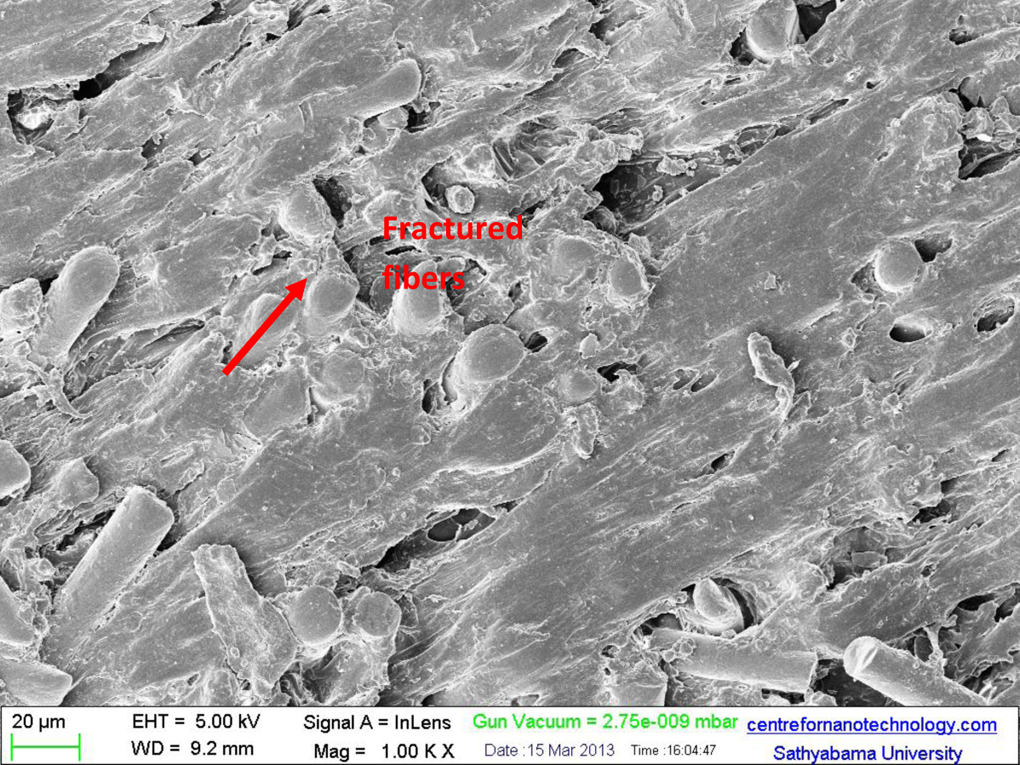
SEM micrograph of PEEK/30 GF when sliding speed = 3 m/s; load = 50 N; and sliding distance = 500 m. SEM: scanning electron microscopy; PEEK: polyether ether ketone; GF: glass fiber.
SEM micrograph of unreinforced PEEK when sliding speed = 1.82; load = 30 N; and sliding distance = 1000 m. SEM: scanning electron microscopy; PEEK: polyether ether ketone.
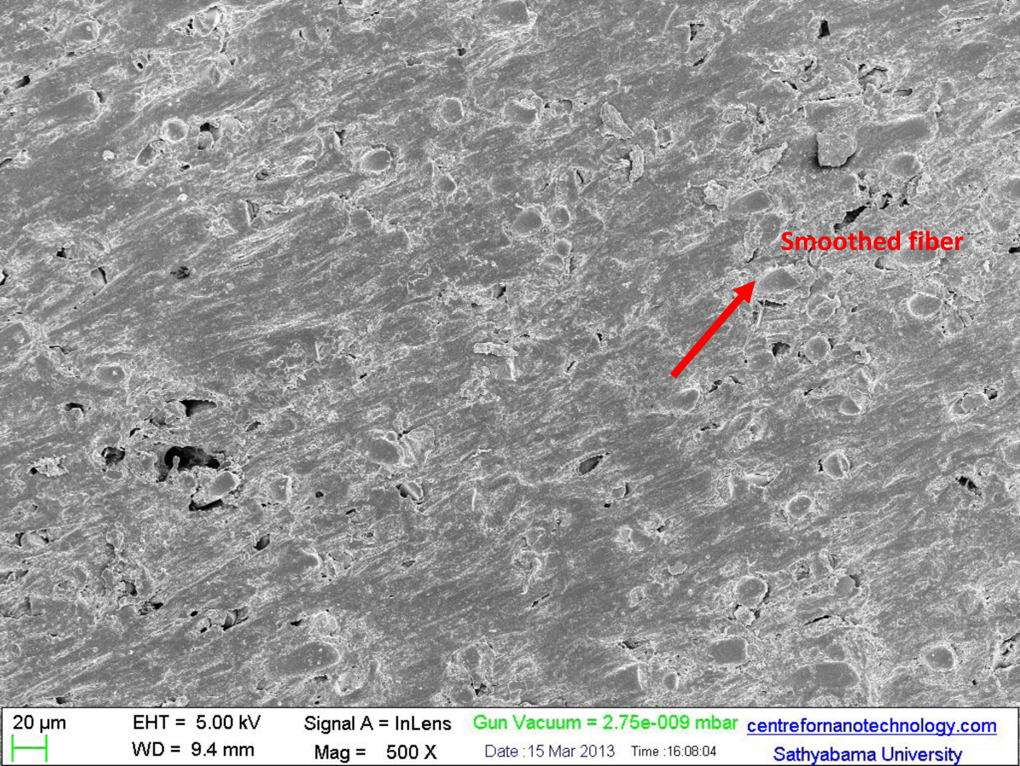
SEM micrograph of PEEK/30 GF when sliding speed = 1.82 m/s; load = 30 N; and sliding distance = 500. SEM: scanning electron microscopy; PEEK: polyether ether ketone; GF: glass fiber.
SEM micrograph of PEEK/30 GF when sliding speed = 0.63 m/s; load = 50 N; and sliding distance = 1000 m. SEM: scanning electron microscopy; PEEK: polyether ether ketone; GF: glass fiber.
SEM micrograph of unreinforced PEEK when sliding speed = 0.63 m/s; load = 10 N; and sliding distance = 500 m. SEM: scanning electron microscopy; PEEK: polyether ether ketone.
SEM micrograph of unreinforced PEEK when sliding speed = 0.63 m/s; load = 50 N; and sliding distance = 1500 m. SEM: scanning electron microscopy; PEEK: polyether ether ketone.
AFM analysis
AFM analysis is ideal for quantitatively measuring the nanometric dimensional surface roughness and for visualizing the surface nano texture of the nanocomposites. 22 Two-dimensional (2D) and 3D AFM images of 30 % GF-reinforced PEEK and unreinforced PEEK are shown in Figures 24 and 25, respectively. The surface roughness of composites decreased from 197 to 54 nm as the weight percentage of GF content is increased from 0 to 30%. The surface of GF-reinforced composites has the shape of the hills and valleys. 23 AFM topography showed that surface is having waviness surface texture. Figure 26 represents an analysis of the roughness of GF-reinforced composites in the program carried out by XEI (Park Systems, Santa Clara, California, USA). XEI program is used to convert acquired data into an image and to perform various analysis that meet the user’s requirement[x] represents the horizontal momentum position. Table 11 illustrates the variations of the average roughness values and ten-point mean height values (R z) for PEEK and PEEK + 30 GF composites. A significant difference occurs at 30% GF-reinforced PEEK composites where the surface exhibits minimum roughness and clear grains were observed. The surface roughness of composites decreased from 137 to 45 nm as the weight percentage of GF content is increased from 0 to 30%.
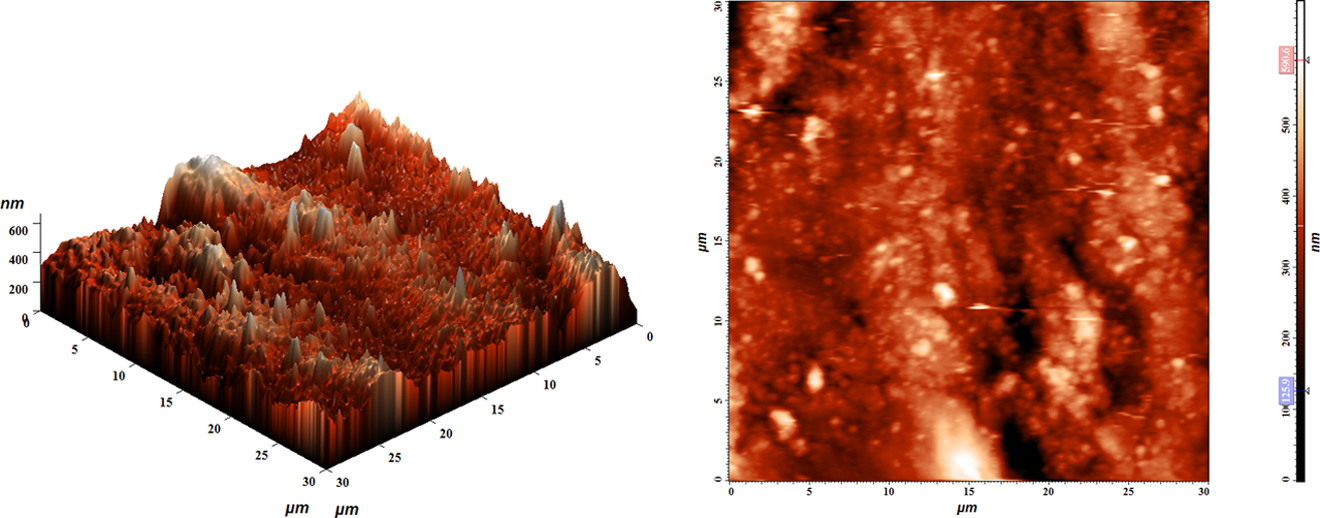
AFM (3D and 2D images) of PEEK matrix composites. AFM: atomic force microscopy; 3D: three dimensional; 2D: two dimensional; PEEK: polyether ether ketone.
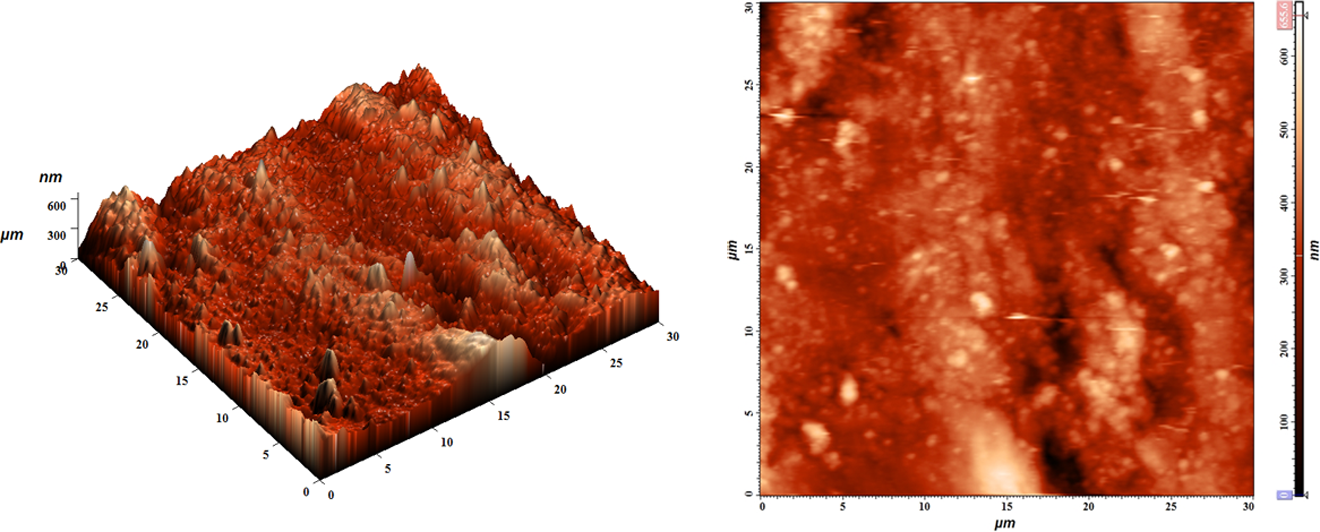
AFM (3D and 2D images) of PEEK/30 GF composites.
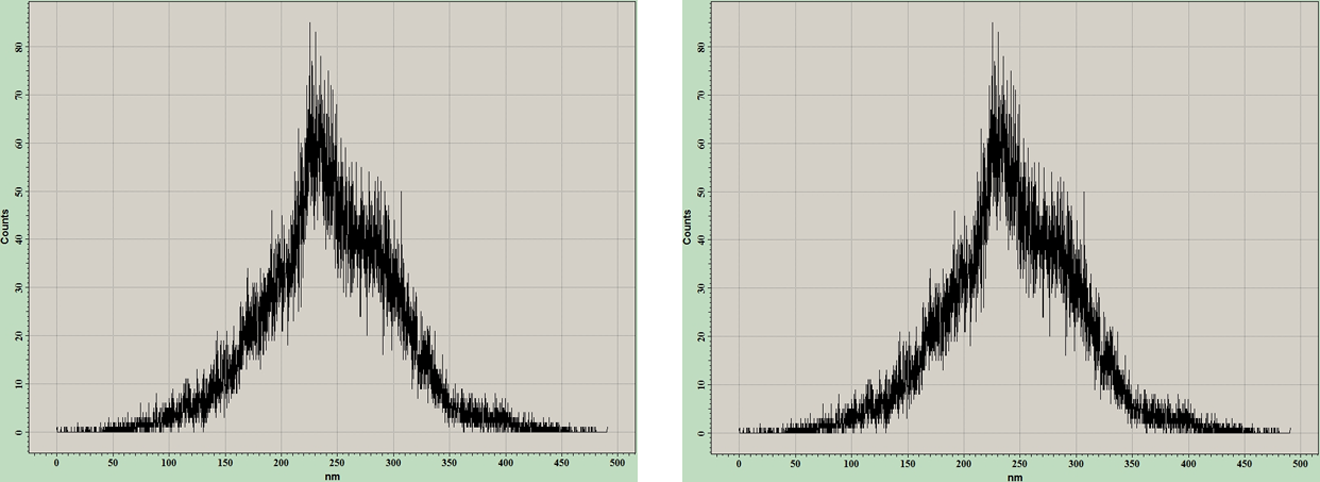
AFM surface profile analysis of PEEK matrix composites. AFM: atomic force microscopy; PEEK: polyether ether ketone.
Roughness parameters of PEEK matrix composites.
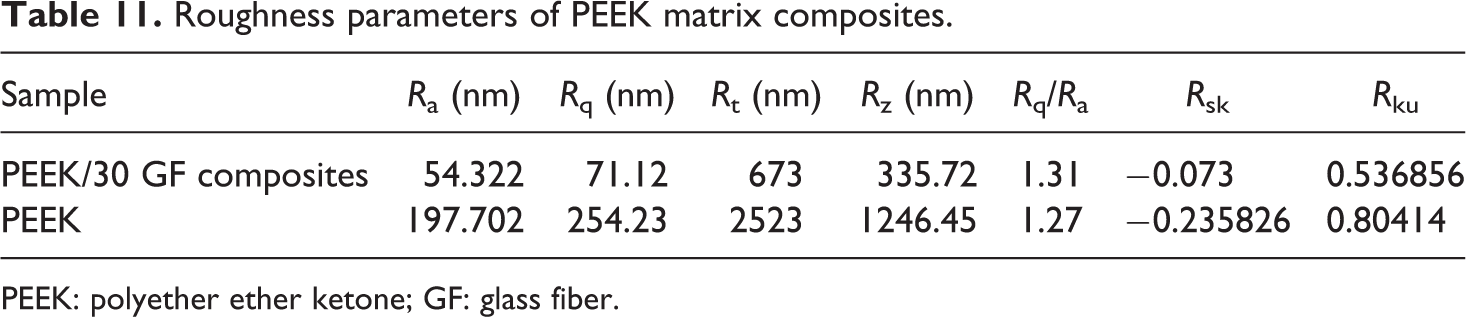
PEEK: polyether ether ketone; GF: glass fiber.
Conclusion
Experiments are conducted on pin-on-disk apparatus for evaluating the performance in the dry sliding wear of PEEK matrix composites. The primary wear characteristics such as specific wear rate and coefficient of friction are studied. The major conclusions drawn from the present investigation are: Mathematicsal model for modeling and analyzing the performances in the dry sliding wear of PEEK matrix composites are carried out using response surface analysis. The adequacy of the models is checked by ANOVA. The models developed are found to be adequate at 95% confidence level. RSM-based desirability approach is carried out to optimize numerical and categorical factor in the dry sliding wear of PEEK matrix composites. The optimization results indicated that sliding speed at 2.92 m/s, load at 33 N, sliding distance at 1053 m, and PEEK/30 GF composite are preferred to minimize the specific wear rate and coefficient of friction in dry sliding wear of PEEK matrix composites. PEEK and PEEK/30 GF shows improved wear resistance at the higher loads due to the formation of transfer film formed on the steel disk. The morphology of wear surface was examined using SEM. The worn surface of the PEEK composite reinforced with 30 wt% GF is smooth. The worn surface of the PEEK composite without glass fiber is full of microgrooves and fatigue microcracks marks. The nanometric dimensional surface roughness was measured and visualized by AFM. The surface of GF-reinforced composites has the shape of the hills and valleys. AFM topography showed that surface is having waviness surface texture. A significant difference occurs at 30% GF-reinforced PEEK composites where the surface exhibits minimum roughness and clear grains were observed.
Footnotes
Declaration of Conflicting Interests
The author(s) declared no potential conflicts of interest with respect to the research, authorship, and/or publication of this article.
Funding
The author(s) received no financial support for the research, authorship, and/or publication of this article.