
Abstract
Short-term creep behavior of wheat straw composites made with either polypropylene homopolymer or impact-modified copolymer was studied at elevated temperatures (50–90°C). Various mineral fillers were tried to enhance creep resistance in the composite materials among which wollastonite was found to be the most effective one. All formulations exhibited higher creep deformations at higher temperatures where the effect of temperature was more pronounced for composites containing the impact-modified copolymer as the matrix. Short-term creep was successfully modeled using a three-parameter power law and Burgers model, and the dependence of the power law model parameters on temperature was evaluated to quantify temperature dependence of creep behavior. Long-term creep at 50°C was predicted based on the short-term data using the time–temperature superposition (TTS) principle, the power law model, and the Burgers model, and the results were compared with actual long-term data. While TTS was found to be the best method to accurately extrapolate short-term data, the failure of the two other methods was found to be related to the time scale of the deformation in short-term creep tests. The results of this study will provide a basis for the design of natural fiber thermoplastic composites to be used in under the hood applications in auto industry.
Introduction
With increasingly stricter environmental and fuel economy regulations for the automotive industry such as the recent US Environmental Protection Agency and National Highway Traffic Safety Administration Standards to reduce greenhouse gases and improve fuel economy for 2017- to 2025-year model cars and light trucks, 1 the interest in the development of lightweight automobile parts has already increased beyond what once could be considered a nonpriority issue. Recent efforts to use natural fibers, especially wheat straw (WS), as the reinforcement for polypropylene (PP) aimed at automotive applications have been successful, 2,3 and the trend is expected to continue with the ultimate goal of reducing vehicle weight and improving fuel economy. Although present applications of natural fiber thermoplastic composites in auto industry are limited to automobile interiors, near-future applications as under the hood components such as battery trays and air cleaner housing are also expected to gain popularity in the coming years.
The choice of polymer matrix and natural fibers to be used for the manufacture of natural fiber thermoplastic composites largely depends on the intended final application of the composite material and regional natural fiber availability. 4,5 WS is a by-product of wheat grain production and is produced in large quantities in all wheat-producing countries including Canada where an average annual production of around 26 million tons has been reported. 6,7 WS can be potentially used for various applications such as energy production, feedstock consumption, and composite products manufacturing.
Similar to many other polymer matrix composite materials, WS-PP composites are viscoelastic materials whose mechanical performance is greatly influenced by temperature and time scale of deformation. A study of under the hood temperatures measured in overhanging position in several cars under different operating conditions has shown that temperatures as high as 90°C are possible. 8 Considering winter temperatures as low as −30°C, the car component made of natural fiber plastic composites may undergo temperature variations in the range of 120°C. These changes in temperature are associated with dimensional changes as well as changes in mechanical performance due to viscoelasticity.
Creep is one of the fundamental properties of materials limiting their long-term application by excessive deformation or reduced stiffness over time. 9 Temperature-dependent creep of natural fiber plastic composites has been studied, and it was found that creep in such materials is more or less a modulus-dependent phenomenon mainly controlled by the stiffness of the material at various temperatures. 10 On the other hand, thermal transitions in composites of natural fibers and PP have been extensively studied. 11
One relatively simple mathematical approach to evaluate creep behavior of materials is the use of the well-known power law model presented by Findley et al.
12
:

where ε
t is the total creep strain at time t, ε
0 is the instantaneous creep, and a and b are model parameters determined from experimental data. Rearranging equation (1) and taking logarithm of both sides results in the following equation (2) from which three parameters of the model can be determined.

The power law model (three-parameter or the simpler two-parameter variation) has been quite successfully used by various researchers to model creep behavior of different materials including natural fiber plastic composites. Rangaraj and Smith 13 used a three-parameter power law model to study creep/recovery behavior of a composite of high-density polyethylene (HDPE) and wood flour. Kazemi-Najafi et al. 14 studied the creep/recovery behavior of a wood flour/PP composite and compared it with solid wood and PP. Findley’s creep model predicted creep strain with a high accuracy for the studied materials. Najafi and Kazemi-Najafi 15 also successfully used Findley’s power law to study creep behavior in wood–plastic composites made from virgin and recycled PE.
Creep behavior of materials can also be modeled using structural models such as the Burgers model
12,16
:

where
Observation also suggests that the effects of time and temperature are equivalent; mechanical behaviors observed after a short time resemble those observed at cooler temperatures; those observed after a long time resemble those observed at warmer temperatures.
9,10
From these observations, numerous investigators have tried to develop equations of time and temperature using the procedure known as the time–temperature superposition (TTS) principle. Despite its wide application for different materials, the applicability of this principle is also under question.
10,17
For semi-crystalline polymers, it is generally believed that TTS shift factors conform to an Arrhenius equation:

where a T is the horizontal (or time) shift factor, R is the universal gas constant, T 0 is the reference temperature (in Kelvin), and T is the temperature at which a T is desired. 9
Tajvidi et al. 10 cross-validated the TTS principle for a kenaf-fiber/HDPE composite by applying shift factors obtained from dynamic frequency scans to creep curves obtained at the same temperatures. The resulting master curves were compared with an extrapolated creep model and a 24-h creep test. The authors concluded that the studied composite material was thermorheologically complex for which a single horizontal shift was not adequate to predict the long-term performance. They also used a two-parameter power law model to predict long-term creep behavior of the studied composite material. Jiang et al. 18 simulated creep strain in wood–PP composites surface coated with unidirectional glass/PP filaments using Findley’s model and time–temperature–stress superposition principle. The authors found the Prony series to be the analytical expression of the master curves with acceptable accuracy. Banik et al. 19 used different models including the four-element Burgers model, the Findley’s three-parameter power law model, and TTS to parameterize creep behavior of all-PP composites. A discrepancy between the Findley’s prediction based on the model parameters and TTS master curve was observed and was attributed to the crystallinity changes in the material while performing creep tests at higher temperatures.
Xu et al. 20 evaluated creep behaviors of bagasse/polyvinyl chloride (PVC) and bagasse/HDPE composites and a commercial wood/HDPE composite at various temperatures and found that temperature had a significant impact on creep behavior. Burgers model and the two-parameter power law model provided more consistent parameters between similar composites in 3-day creep tests. The TTS principle was also used and smooth master curves were obtained. The authors obtained better predictions of creep behavior using TTS for the PVC composites as compared to the HDPE composites. Finally, Pramanick and Sain 21 used the concept of rule of mixtures of materials to model creep behavior of rice hulls/HDPE composites. Their model used creep constants of the constituents to predict the creep of the composites and was found to work well for the long-term behavior of the composite.
This brief review of the literature reveals that little information is available on creep behavior of natural fiber PP composites at elevated temperatures. Knowing that under the hood temperatures coincide with thermal transitions in PP 11 and WS, 22 the present study was designed to evaluate the creep behavior of WS–PP composites at elevated temperatures. Efforts have also been made to enhance creep resistance of the studied composite materials by hybridizing with inorganic fillers and to predict long-term creep behavior of the materials using different predictive models.
Materials and methods
Materials
A total of 16 WS/mineral/hybrid PP composite formulations were evaluated in the present study whose compositions are tabulated in Table 1. An isotactic homopolymer PP (hereafter called PP1; D180M, Sunoco Chemicals Inc., Philadelphia, PA, USA) with a melt flow index of 18 g/10 min and a high impact copolymer PP (hereafter called PP2; TI6200N, Sunoco chemicals Inc.) with a melt flow index of 18 g/10 min were used as the polymer matrices. The polymers were received in the form of pellets and were ground to powder in a mill for better mixing with WS and the minerals.
Composition of the evaluated formulations (in weight percentage).
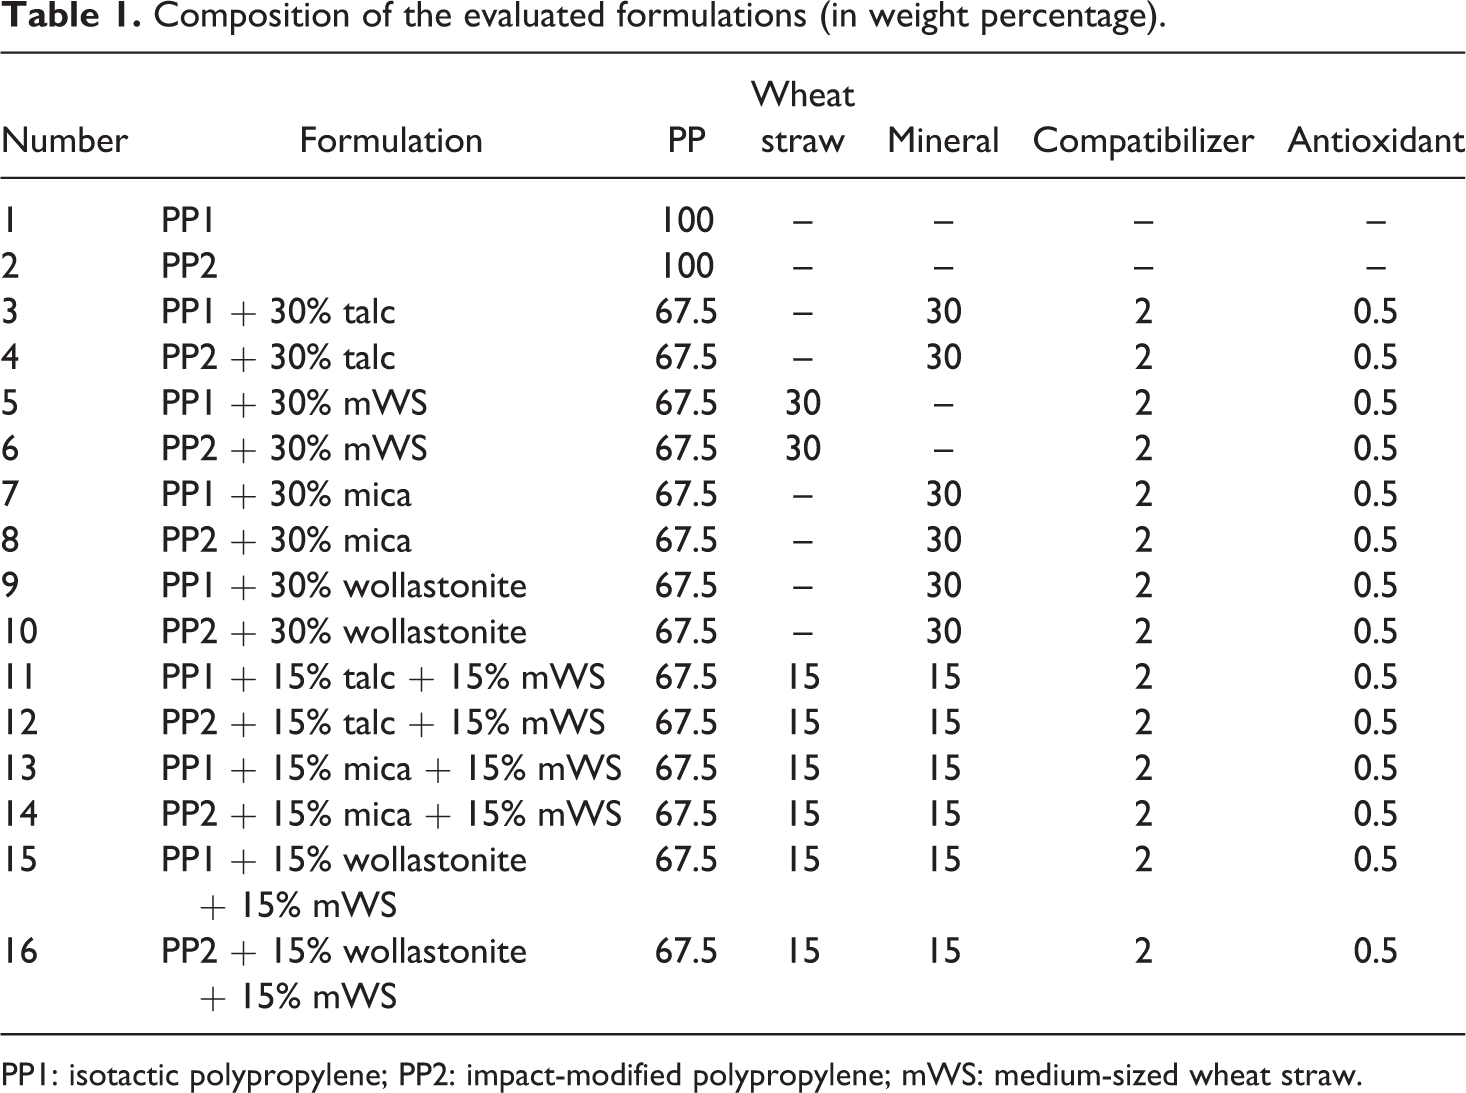
PP1: isotactic polypropylene; PP2: impact-modified polypropylene; mWS: medium-sized wheat straw.
WS was supplied by Omtec (Chatham, ON, Canada) in the form of ground fibers with a nominal fiber length of 520 μm and aspect ratio of 4. Talc used was BT 2207 and was supplied by Schulman Inc. (Akron, Ohio, USA) and had a nominal particle size of 7 μm. Mica was CD-2200 muscovite mica produced by Georgia Industrial Minerals Inc. (Sandersville, Georgia, USA). It had an average particle size of 18–22 μm and a specific gravity of 2.82. Wollastonite was Nyglos 8 produced by NYCO (Willsburo, New York, USA) with a specific gravity of 2.9. In all formulations, antioxidants Irganox 1010 and Irgafos 168, both from CIBA Inc. (Switzerland), each at 0.25 wt% and MD-353D maleic anhydride-grafted PP coupling agent from DuPont (Canada) at 2 wt% were used.
Methods
Preparation of the composites specimens
WS and minerals were added individually or together to the base resins as specified in Table 1. The preblended composite mixture (200 g) was fed into a Haake Minilab microcompounder consisting of a corotating twin-screw extruder (Thermo Scientific, Waltham, Massachusetts, USA). Mixing process was conducted at 190°C at 40 r/min. The extrudates that exited through the flush orifice were collected, cooled, and pelletized.
The pelletized composites were injection molded using a Ray Ran Laboratory Injection Molding machine (Ray Ran Test Equipment Ltd., UK) at 190°C and exposed under a pressure of 0.69 MPa to obtain rectangular bars according the dimensions set in the ASTM D-256 standard specification. 23
The bars were then cut in half and placed in a Hewlett Packard 5890A GC oven (Palo Alto, CA, USA) for annealing to remove any thermal history occurring during extrusion and injection molding. The temperature inside the oven increased from the initial temperature of 25°C at a rate of 10°C min−1 until the final temperature of 150°C was reached. The specimens were left at this temperature for 10 min and then were cooled to room temperature at the same rate.
Short-term creep tests
Creep tests for 20 min were performed using a rheometric scientific dynamic mechanical thermal analyzer V device (Rheometric Scientific, Piscataway, New Jersey, USA). A single cantilever mode was selected, and the samples were quickly loaded to 3 MPa. This loading level was selected to represent 10% of the average flexural strength of different formulations at room temperature. Creep tests were repeated at temperatures 50, 60, 70, 80, and 90°C covering the region of alpha transition in PP composites. 11 Temperature was maintained within ±0.5°C, and a 15-min soak time was allowed before tests started to ensure thermal equilibrium with the chamber. At least two specimens of each formulation at each temperature were tested and average results were reported.
Creep modeling and long-term creep
Short-term creep behavior was modeled using three different methods namely, Findley’s three-parameter power law, the Burgers four-element creep model, and the TTS principle. A built-in function within the Sigmaplot® software (Systat Software, Inc. Chicago, IL, USA) was modified and used to fit experimental data to the power law function (equation (1)). From the fits, power law parameters (ε
0, a, and b) were calculated by plotting
To validate long-term creep curves obtained through extrapolation models, two formulations, PP1 + 30% medium-sized wheat straw (mWS) and PP2 + 30% mWS were also tested for creep at 50°C for 20 h to resemble a longer term creep response. Extrapolated creep curves extended to 20 h were also generated using creep model parameters already obtained at the same temperature and were compared with the actual 20-h creep curves.
Results and discussion
Short-term behavior
Short-term creep behavior of composite formulations containing WS, talc, mica, and wollastonite combined with the two different PP matrices tested at 90°C is presented in Figure 1 and are compared with pure PP1 and PP2 polymers as well. Similar observations were also made at other temperatures. PP2 showed more creep at the same stress level than PP1 which is attributed to lower stiffness of the impact-modified PP. This also affected composite formulations made from the two types of polymer matrix where all PP2 composites exhibited higher creep values due to the creep contribution from the less stiff matrix. Significant reductions in creep values were observed when 30% of the polymer was replaced by either WS or other minerals. For both groups of formulations, wollastonite resulted in the highest creep resistance, whereas talc proved to be the least effective additive. Compared with minerals, WS resulted in acceptable creep resistance second only to wollastonite. Another interesting observation was that the difference among various fillers in terms of creep resistance was more notable when an impact-modified PP (PP2) was used.
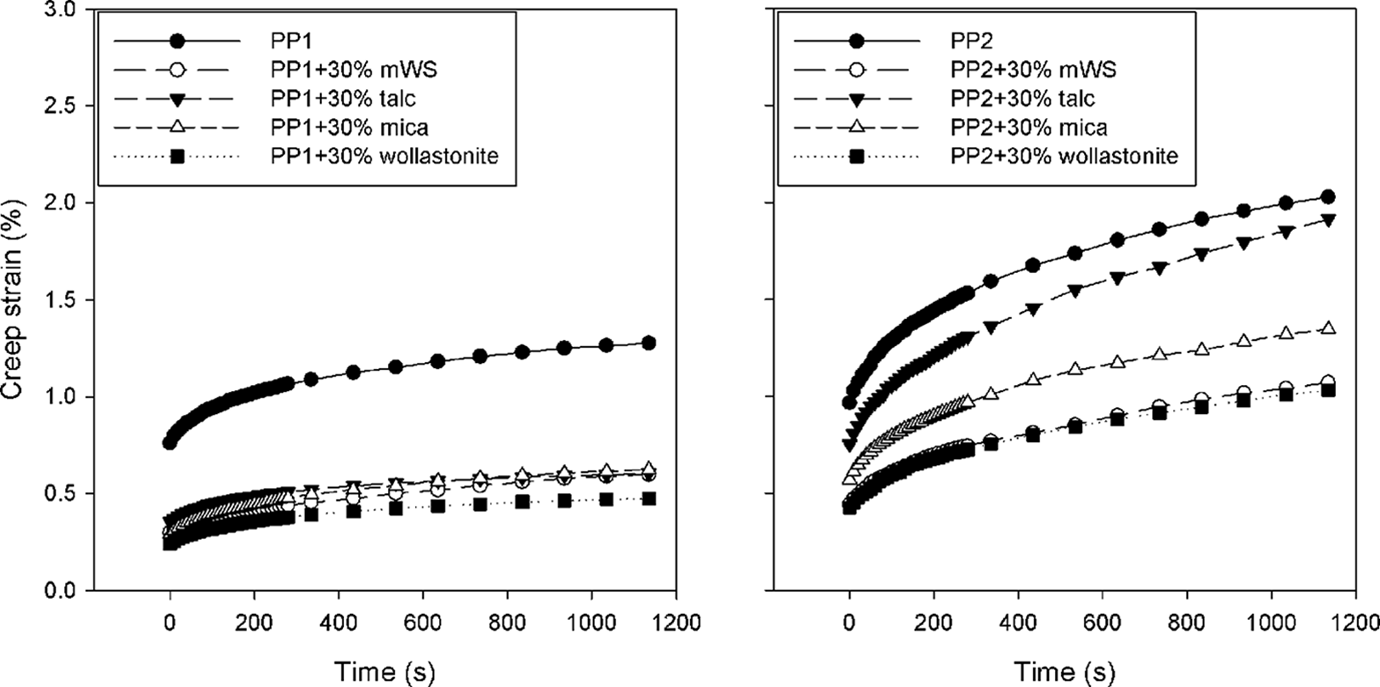
Short-term creep behavior at 90°C for PP1 (left) and PP2 (right) formulations. PP: polypropylene.
The effect of temperature on creep behaviors of WS PP composites is presented in Figure 2 where higher creep values are obtained at elevated temperatures. Curve fitting using the three-parameter power law model (equation (1)) resulted in statistically significant fits with close to unity coefficients of determination (R 2 ). Power law lines seen over experimental data in Figure 2 indicate very good fits and these results are in agreement with those reported by other researchers. 10,13,14
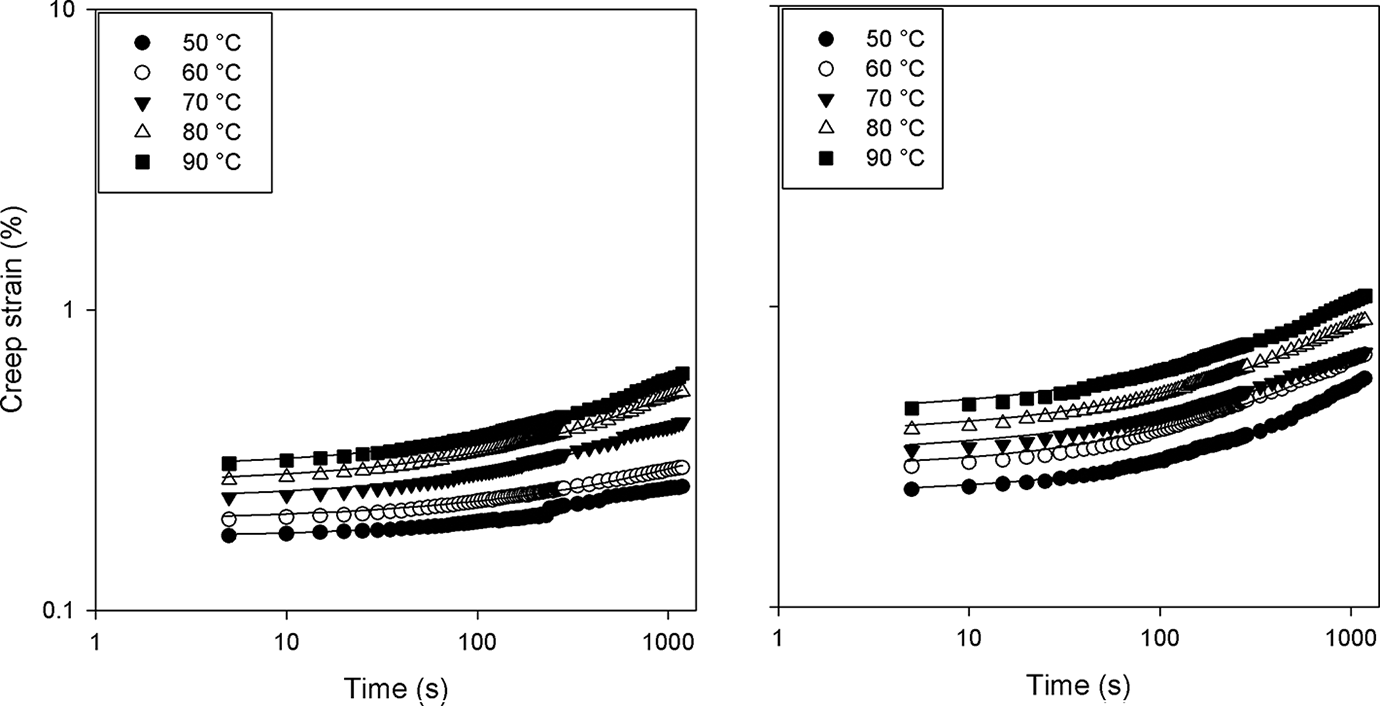
Short-term creep curves of PP1 + 30% mWS (left) and PP2 + 30%mWS (right) formulations at elevated temperatures. Lines on the curves are power law fits. PP: polypropylene; mWS: medium-sized wheat straw.
The good fits obtained by modeling short-term creep data using the three-parameter power law imply that it is possible to study short-term creep behavior of the evaluated formulations as affected by temperature by evaluating the temperature dependence of model parameters. To assess temperature dependence of power law model parameters, they were plotted against temperature in Figure 3. Instantaneous creep (ε 0) was increased nonlinearly as temperature was increased in both groups of formulations. Values of ε 0 were also smaller for PP1 composites as compared to PP2 composites indicating the lower stiffness of the latter group. A significant reduction in ε 0 values was observed for composite formulations as compared to pure polymers, which is due to the reinforcing effect of the fillers. Generally speaking, PP2 formulations exhibited both higher ε 0 values and higher temperature dependence as compared to PP1 composites. Among different fillers, wollastonite composites resulted in the lowest ε 0 values indicating their better creep resistance.
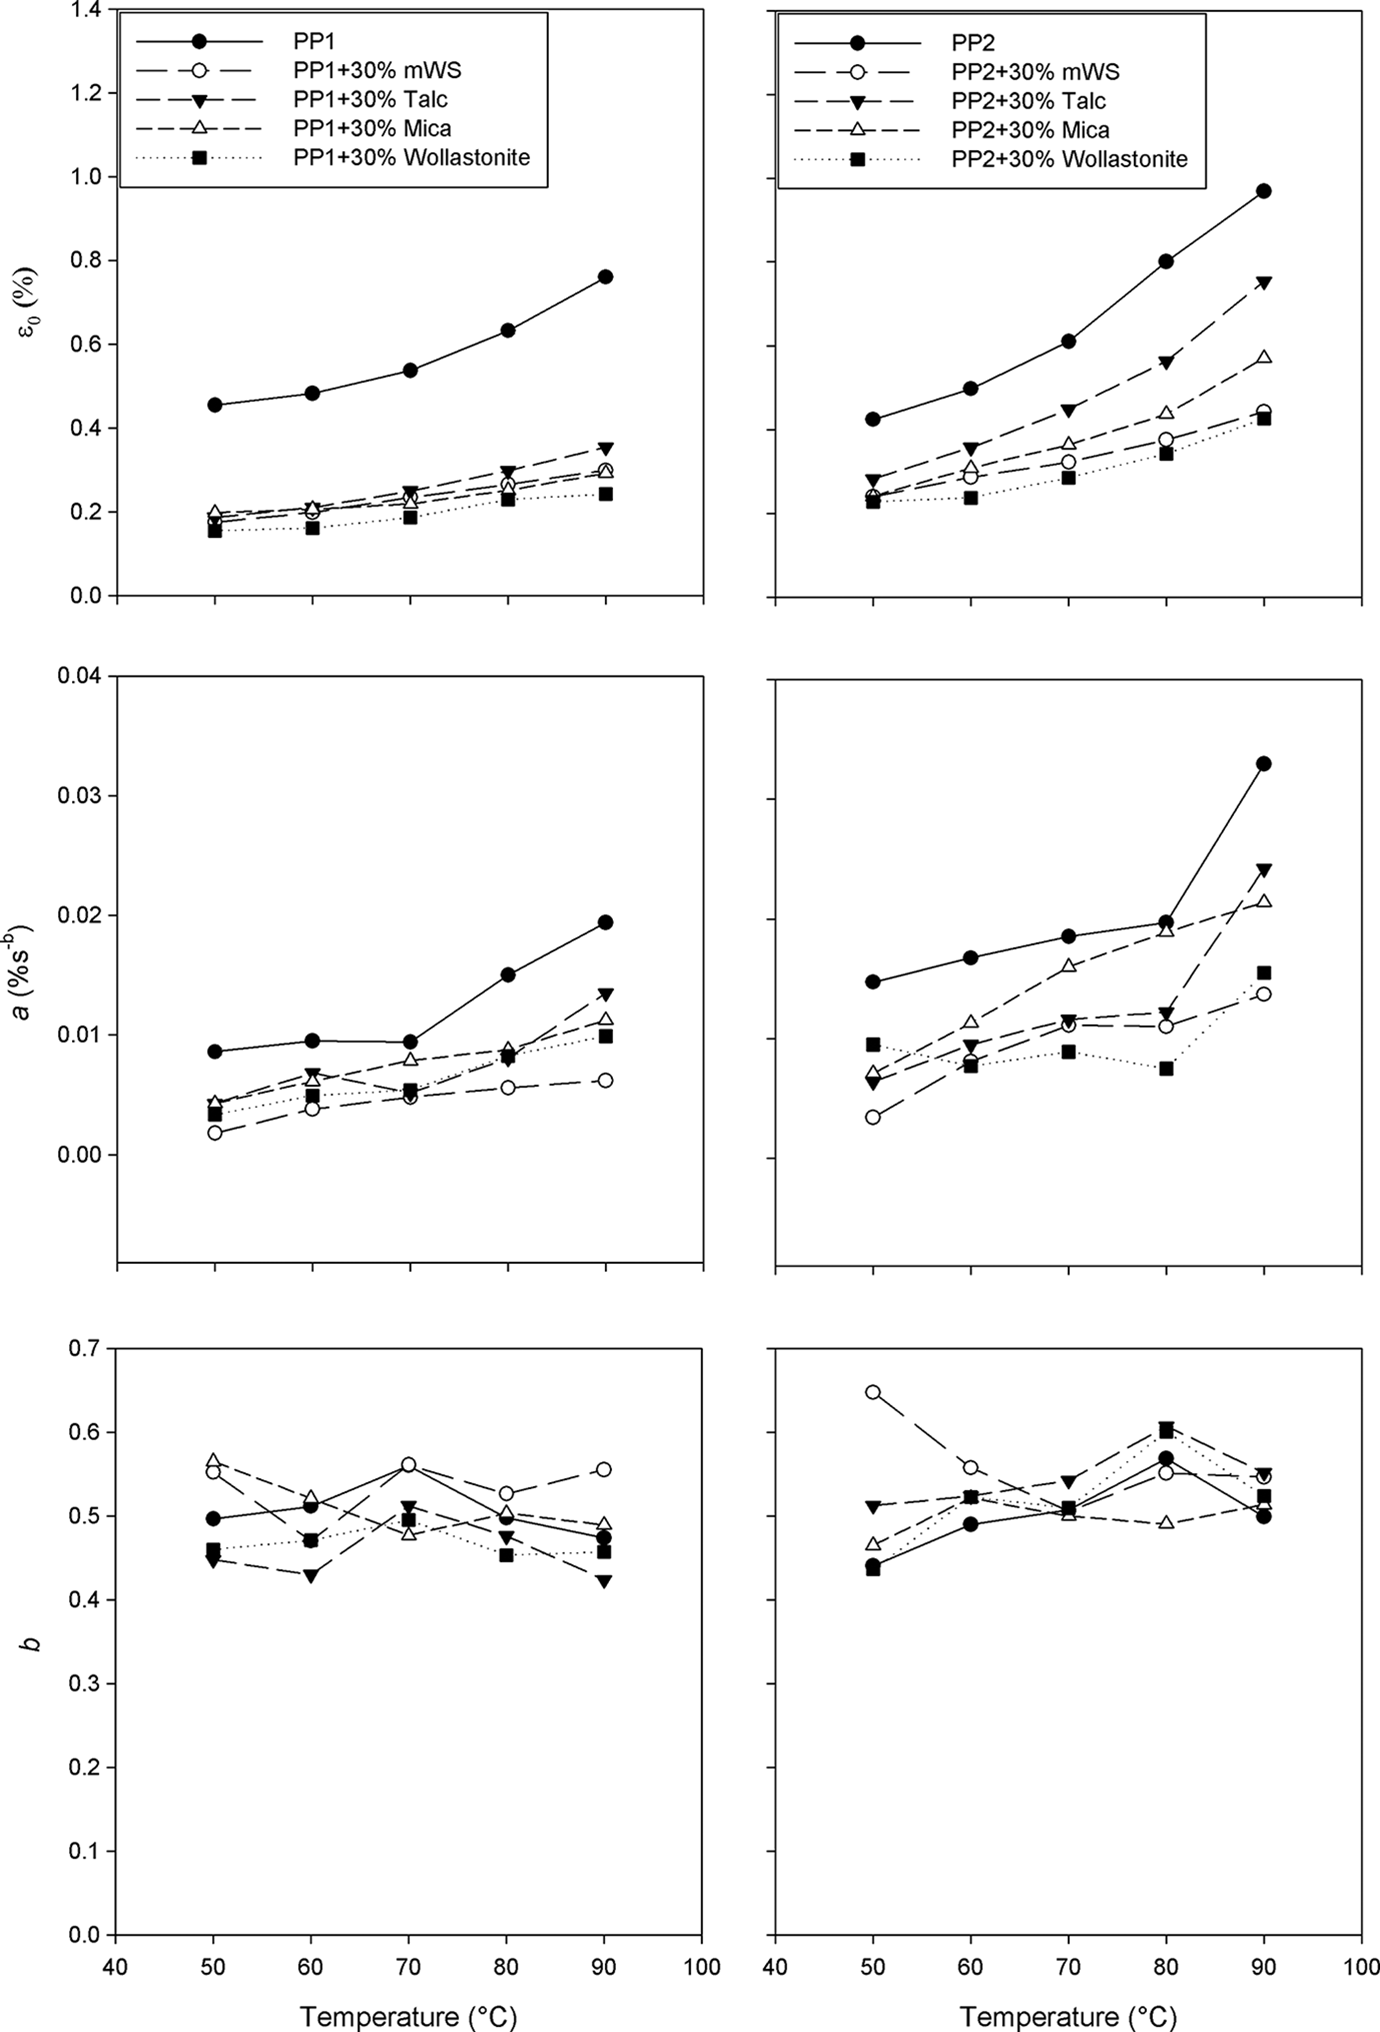
Temperature dependence of power law parameters for PP1 (left) and PP2 (right) formulations. PP: polypropylene.
As understood from equation (1), the time-dependent creep strain (at
b) at any time is a function of both a and b parameters. While parameter a is determined from the intercept of
Power law model parameters of hybrid composites containing 15% WS and 15% of other mineral fillers are presented in Figure 4 as a function of temperature for both PP1 and PP2 formulations. Wollastonite was able to significantly reduce instantaneous creep for both formulations, whereas talc and mica were unable to improve creep properties. As seen in Figure 4, wollastonite performed better in case of PP2 formulations where lower parameter a values are obtained at most temperatures. Parameter b values were also significantly but not very regularly reduced when 15% wollastonite was added to the systems.
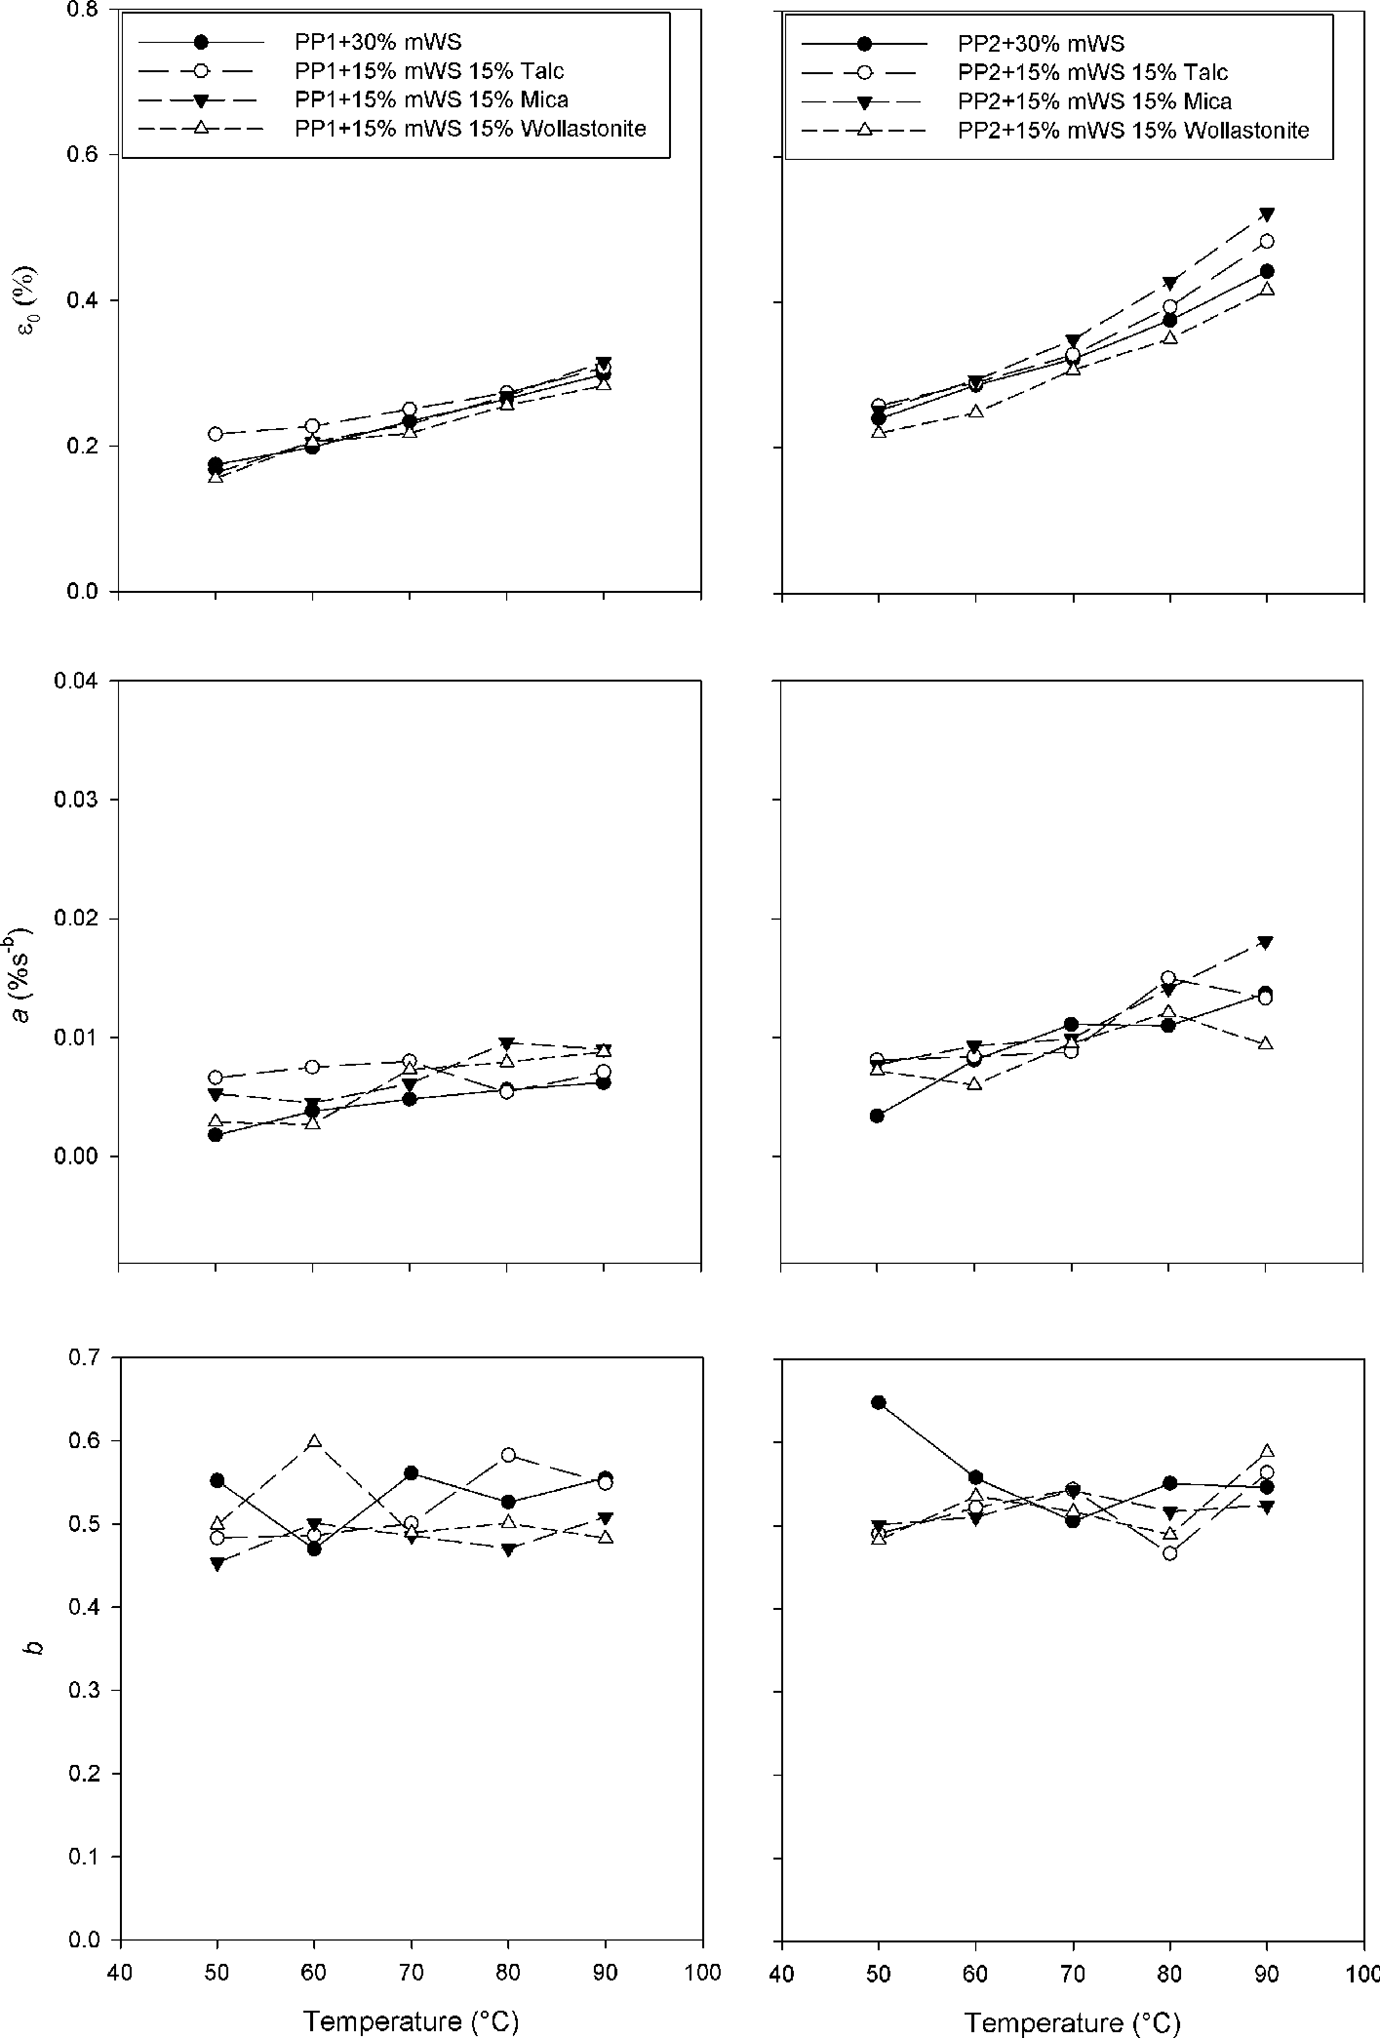
Temperature dependence of power law parameters for PP1 (left) and PP2 (right) hybrid formulations. PP: polypropylene.
Burgers model (equation (3)) was successfully fit (R 2 > 0.96) to the experimental data over the entire range of temperatures. Model parameters as depicted in equation (3) are presented in Table 2 where it is observed that C 1 values representing instantaneous creep are larger for the PP2 + 30% mWS composite when compared with the similar formulation made with PP1. This shows that Burgers model is also able to quantify instantaneous strain accurately. C 1 values increased at higher temperatures indicating that the composite material is less stiff at elevated temperatures. C 2 values corresponding to the viscoelastic deformation 20 are also increased at higher temperatures and significantly higher values are obtained for the PP2 formulation. Maximum creep strain is a function of C 4, which is reduced at higher temperatures indicating an increase in maximum creep at elevated temperatures. Smaller C 4 values for the PP2 formulation indicate higher creep strains for the copolymer composite. These findings are in agreement with observations made for bagasse fiber polymer composites. 20
Burgers model parameters.
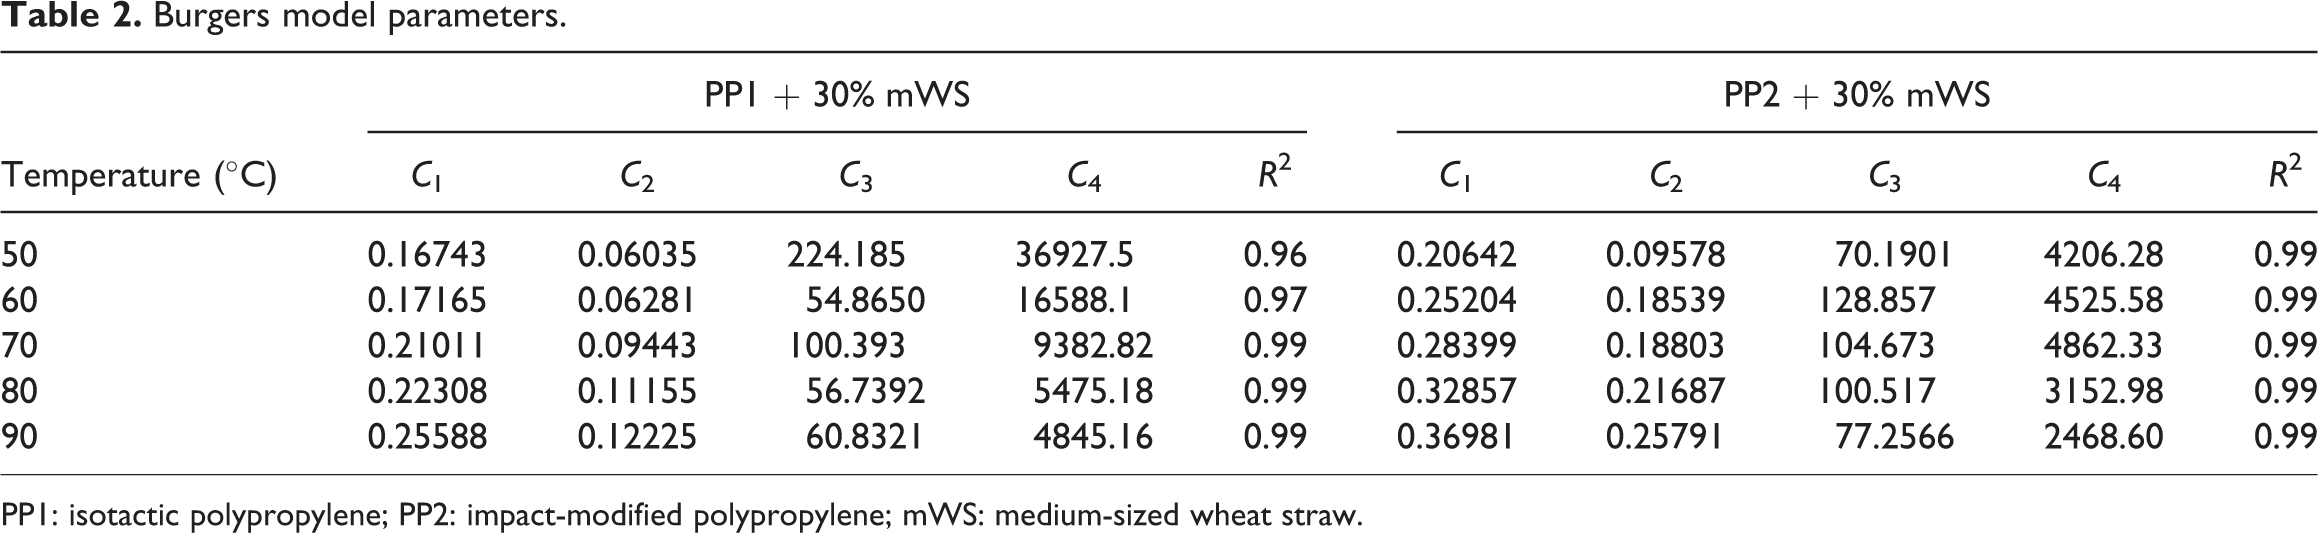
PP1: isotactic polypropylene; PP2: impact-modified polypropylene; mWS: medium-sized wheat straw.
Extrapolated creep and long-term behavior
The TTS principle was applied to two of the studied formulations containing WS and either polymer matrix. The results of such data analysis are presented in Table 3 where good fits with an Arrhenius type equation (equation (4)) were obtained indicating the linear dependence of horizontal shift factors on temperature. Activation energy was found to be lower for the PP2 composite indicating that less energy is required to bring about molecular motions. The linear relationship with high coefficients of determination established between shift factors and temperature indicate that no significant changes in molecular mechanisms of deformation are brought about by the alpha transition. A slight deviation at 70°C (peak alpha transition temperature) was however observed but more information is required to attribute this observation to this thermal transition.
TTS results.
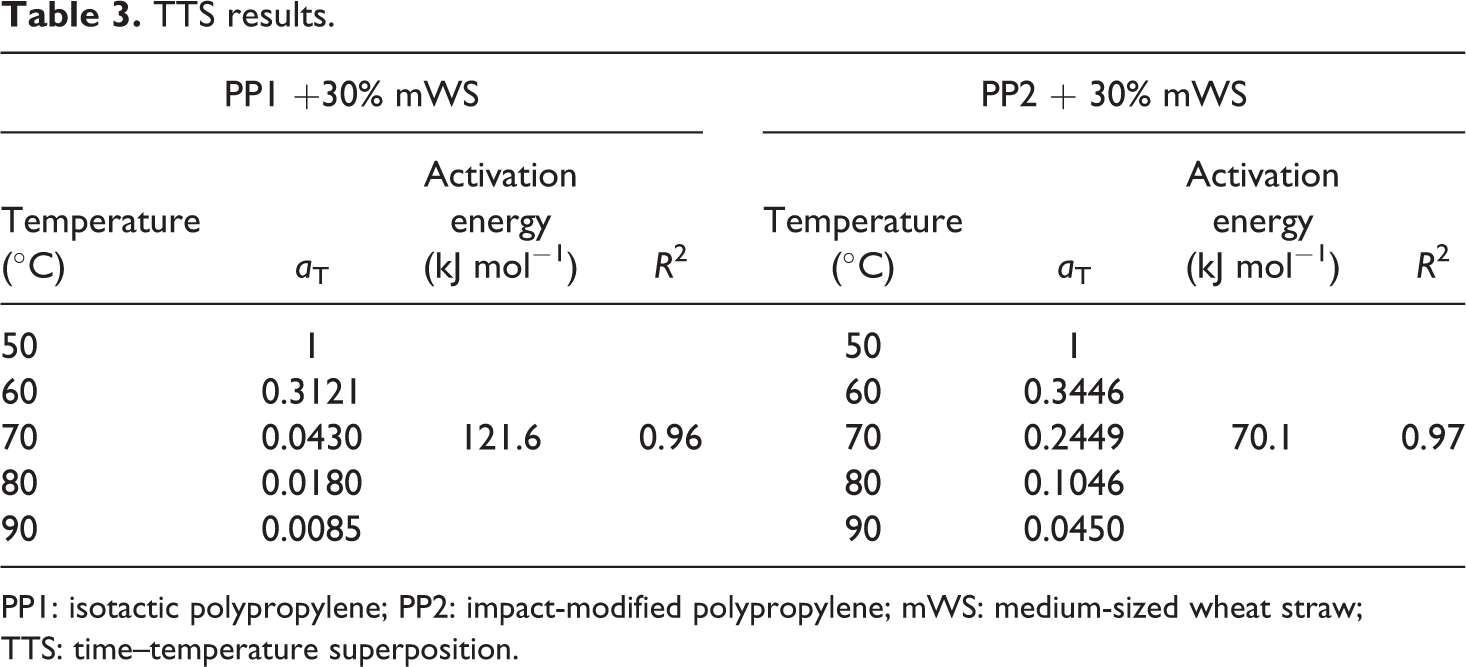
PP1: isotactic polypropylene; PP2: impact-modified polypropylene; mWS: medium-sized wheat straw; TTS: time–temperature superposition.
As reported previously, 10 more tests are required to conclude whether TTS holds for the composite formulations studied here. To evaluate the applicability of TTS and other creep prediction techniques, long-term creep at 50°C was extrapolated using the three extrapolation techniques studied, and the results were compared with an actual 20-h creep test at the same temperature. Results of these comparisons are presented in Figures 5 and 6 for PP1 + 30% mWS and PP2 + 30% mWS formulations, respectively. For both formulations, the TTS model resulted in the most realistic extrapolations, whereas those by the Burgers model were considerably overestimated. The power law model also overestimated creep behavior, but the results were better than those obtained by the Burgers model. One problem with Burgers model is that is assumes a linear increase in deformation after a certain time, which is quite unlikely in viscoelastic materials. 9 This clearly shows that under the conditions of this study only the TTS method was found to reliably predict creep strain at longer times. Having said that, it should also be emphasized that the TTS model failed to provide a long-term prediction of creep strain for the PP2 composite making it less favorable to be used to predict long-term behavior for this particular formulation (Figure 6), and in the case of the PP1 composite, the long-term prediction only covered 38 h which is still a short period of time in creep terms. Overestimation of creep behavior caused by temperature fluctuations has also been reported by Chang et al. 27
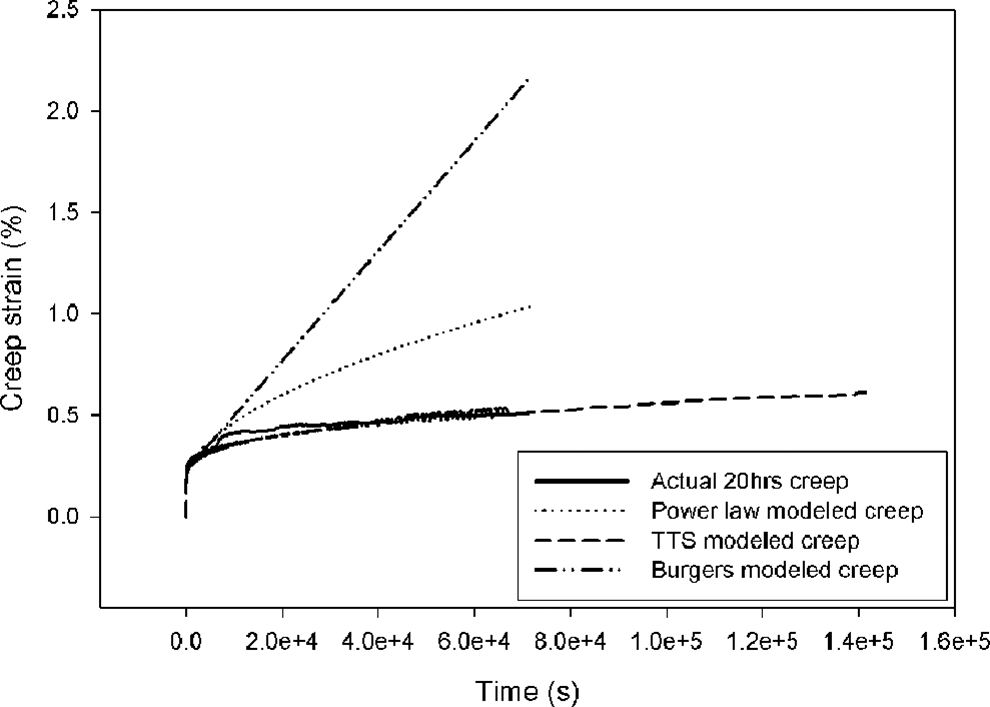
Predicted creep curves of PP1 + 30% mWS formulation using various methods compared with an actual 20 h creep test at 50°C. PP: polypropylene; mWS: medium-sized wheat straw.
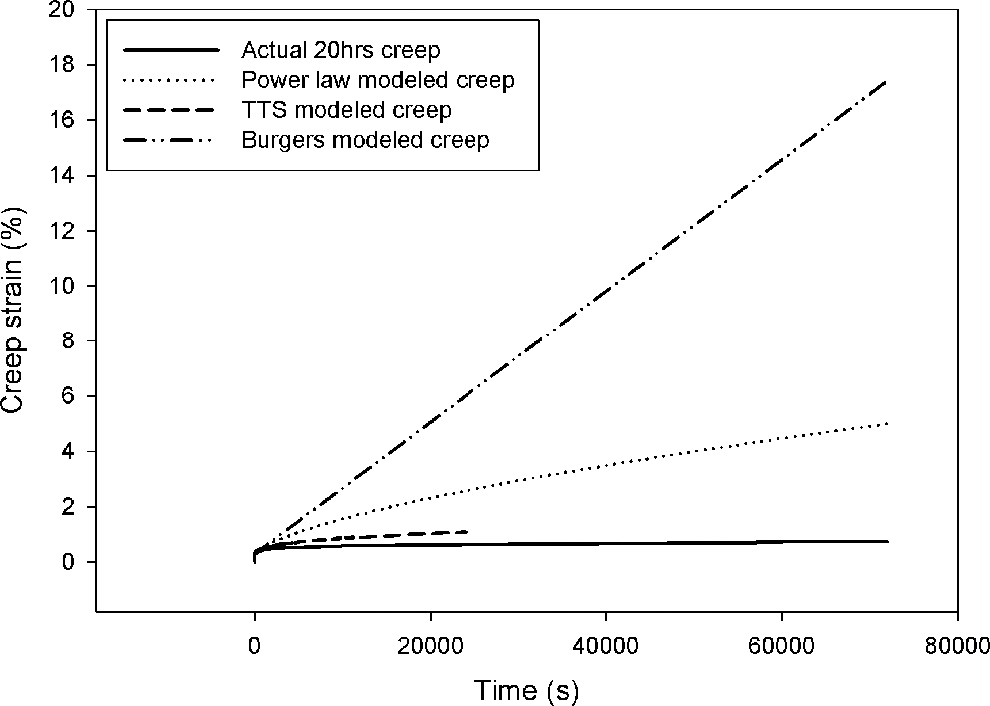
Predicted creep curves of PP2 + 30% mWS formulation using various methods compared with an actual 20 h creep test at 50°C. PP: polypropylene; mWS: medium-sized wheat straw.
Both the power law model and Burgers model successfully fitted the short-term creep data. However, they both failed to accurately predict long-term behavior. The power law model has been previously suggested as a good tool to predict long-term creep behavior of natural fiber thermoplastic composites. 11,13,14 The main reason for the model’s failure here is that the creep parameters obtained over the short time may not be representative of the values over the long-term especially when short-term creep tests are carried out at higher temperatures where creep rate may not level off as anticipated by the mathematical models. To find out how long short-term creep test will be adequate for creep modeling using the power law and Burgers model, different time scales of the longer term (20 h) creep tests were used for modeling. The results of such analysis are presented in Figure 7 for both models. It is clearly seen that when the short-term creep is modeled at longer times, predicted creep strain values approach those obtained in the actual long-term creep test. For example, for the PP1 + 30% mWS formulation presented in Figure 7, it was found necessary to continue short-term creep tests at 50°C at least for 11 h so that the results can be applicable to long-term predictions. Failure of the power law model to provide reliable creep data beyond the time span over which it was estimated has been previously reported, which could have been caused by a similar reason. 26
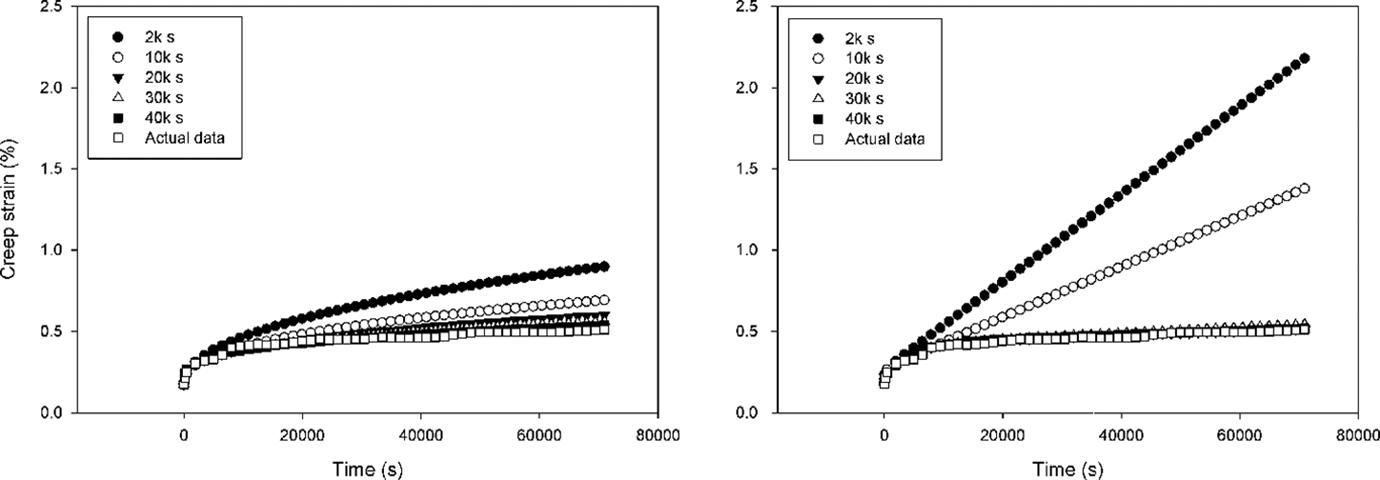
Examples of time-scale dependence of creep strain extrapolation models for PP1 + 30% mWS formulation using power law (left) and Burgers model (right) at 50°C. PP: polypropylene; mWS: medium-sized wheat straw.
Conclusions
Similar to many thermoplastic composites, WS-PP composites have low creep resistance. This problem is intensified at elevated temperatures and when the polymer matrix is impact modified to provide higher impact resistance. One approach to reducing creep in such composites is to incorporate mineral fillers that can enhance the stiffness of the composite and therefore reduce creep over time. Mica, talc, and wollastonite were evaluated in the present study, and it was found that only wollastonite was able to effectively do so for which the main reason can be its needle-like structure and therefore higher reinforcement efficiency. Short-term creep of WS-PP composites can be successfully modeled using a three-parameter power law model or Burgers model. However, for these models to be usable to predict long-term creep at various temperatures, it is mandatory that the initial length of short-term creep tests be selected long enough to cover both primary and secondary creep portions. The TTS principle can also be used to predict long-term creep behavior of such composites provided that the results are verified either by conducting relatively longer term creep tests or cross-validating by other viscoelastic parameters such as dynamic mechanical properties.
Footnotes
Acknowledgments
The authors would like to thank COMTECH Inc., Evanswille, Indiana, USA, Braskem America Inc., Philadelphia, USA, and Schulman Inc., Fairlawn, Ohio, USA, for the donation of chemicals used in this study.
Declaration of Conflicting Interests
The author(s) declared no potential conflicts of interest with respect to the research, authorship, and/or publication of this article.
Funding
The author(s) disclosed receipt of the following financial support for the research, authorship, and/or publication of this article: This study was financially supported in part by the Natural Sciences and Engineering Research Council of Canada Discovery Grant and Ontario Ministry of Agriculture and Food Bioproducts Grant awarded to LCS.