
Abstract
A self-made vibration-assisted injection molding machine (VAIM) was developed to generate oscillation injection pressure during filling and packing The cavity pressure changes sinusoidal with time during filling and packing in VAIM. The filling time can be shortened with the introduction of oscillation injection pressure. The melt peak of the parts become wider and the melt point move to high temperature with the increase in piston rod vibration amplitude/frequency.
Keywords
Introduction
Injection molding is one of the most widely used processing methods for polymeric products. High degree of automation, high productivity, and good dimensional stability of moldings characterize it. The broader application and high quality demand promoted the development of injection process and the injection equipment. In conventional injection molding (CIM) process, defects such as weld lines, sink marks, and warpage are caused by unbalanced flow, uneven cooling, nonuniform internal stress, and inhomogeneous nucleation and growth of crystals due to solidification of parts. 1 Varying processing parameters can result in the modification of the mechanical properties, surface quality, dimension, and density of molded parts. Among the processing parameters, injection pressure is one of the most important factors that influence the quality of the injection-molded parts. Considerable researches had been conducted on the influences of injection pressure on the quality of parts. The basic idea of these techniques is to use specific pressure profile prior to or during molding to control the flow pattern and the internal structure and morphology of the plastics being shaped. These techniques distinguished from CIM are that the cavity pressure oscillated with a nonzero means during molding. Oscillation forces induced during the molding process will affect the shear forces, hydrostatic pressure, melt viscosity, and molecular entanglement density, which in turn affected the quality of parts. Allan and coworkers 2 –4 at Brunel University in England invented the shear-controlled orientation in injection molding (SCORIM) method. This technique has been shown to improve welding line strength because the melt can flow back and forth across the weld line and the polymer chains are oriented in the weld direction. Rheomoding technique was originally developed by Ibar, 5 and its latest development was invented by Bubel et al. 6 and patented in the United States. There are also various forms of Rheomoding application methodologies for injection molding process. Rheomolding technology 7 was found to improve the strength of parts both with and without weld lines. Also it was found to reduce the internal stresses that improved the optical properties of polystyrene and polyethylene terephthalate. 8 Push–pull injection molding is another kind of dynamic injection molding technology. It is similar to SCORIM in many ways. Push–pull injection molding technology 9,10 was found to improve the tensile strength in both the flow and the perpendicular directions resulted from the increase in the degree of crystallinity and orientation. The moving boundary technique 11,12 causes a mixing action to produce better boding at the flow-fronts that significantly improved the strength of the streaming weld line of fiber-filled material. Coulter and Kikuchi 13 and Kikuchi et al. 14 introduced the concept of vibration-assisted injection molding by introducing a mechanical vibration that applied to the polymer melt during filling and/or packing stages. Angstadt 15 studied the mechanism of the vibration of polymer melt on polymer orientation and also how the orientation affects the final mechanical properties of injection-molded parts. Also some researches 16 –19 are focused on the improvement of weld line by ultrasonic oscillation injection system. According to these studies, the application of oscillation energy to the polymer melt during the injection and/or packing stages enables some control over cavity pressure and strain histories, which in turn result in altered rheological states. Then the morphology of the part was controlled, which improved the part quality. These studies illustrated the influence of vibration forces on the mechanical properties and microstructure of parts. However, little attention has been paid to the influence of oscillation injection pressure on cavity pressure. In this work, an oscillation pressure injection molding machine is introduced including the working principle, structure, and application. The influences of piston rod vibration parameters on the cavity pressure and properties of parts were studied. The experimental results were presented in detail as follows.
Experimental
Vibration-assisted injection molding machine
The schematic diagram of the vibration-assisted injection molding machine (VAIM) used in the experiment is shown in Figure 1. The machine is modified from a vertical injection machine that applies mechanical energy to the feedstock during filling and packing stage by vibrating the piston rod. As shown in Figure 1, the pillar moves downward by the force of hydraulic pressure. The pillar moving velocity is

where Schematic map of vibration-assisted injection machine: (1) piston rod, (2) vibration device, (3) pillar, (4) thermocouple, (5) mold, (6) housing, (7) melt, and (8) barrel.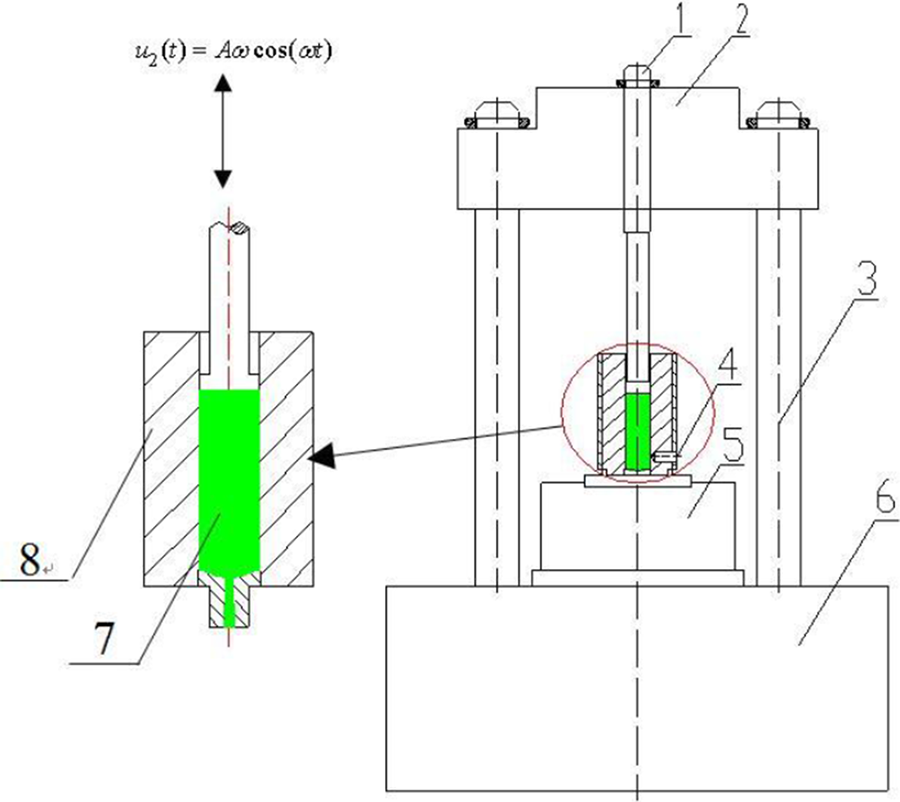

During packing, the piston rod keeps vibrating while the pillar is at rest. By this way, oscillatory pressure gradient is generated within the flow domains during filling and packing stage. The vibration amplitude and frequency can be adjusted expediently from the control panel.
Disk-shaped mold and cavity pressure monitoring system
Three plates mainly constitute the mold for disk-shaped parts, which are a simple superior plate, an inferior plate containing nozzle bushing, and an interchangeable plate containing cavity. The cavity plate can be changed according to the shape and the dimension of the parts. The total diameter of mold cavity is 120 mm and the thickness is 3 mm. The mold temperature could be controlled through the use of a thermolator that supply heated oil in a closed loop network of hoses. As shown in Figure 2, one pressure transducer is embedded in the barrel to monitor the entrance pressure , and three pressure transducers are embedded in the mold along the radial direction. The pressure at the cavity center is P 1. The distances from the transducer to the center of the cavity are 24 mm (P 2) and 56 mm (P 3), respectively. Similarly, cavity pressures at different places are monitored and recorded online in real-time scale.
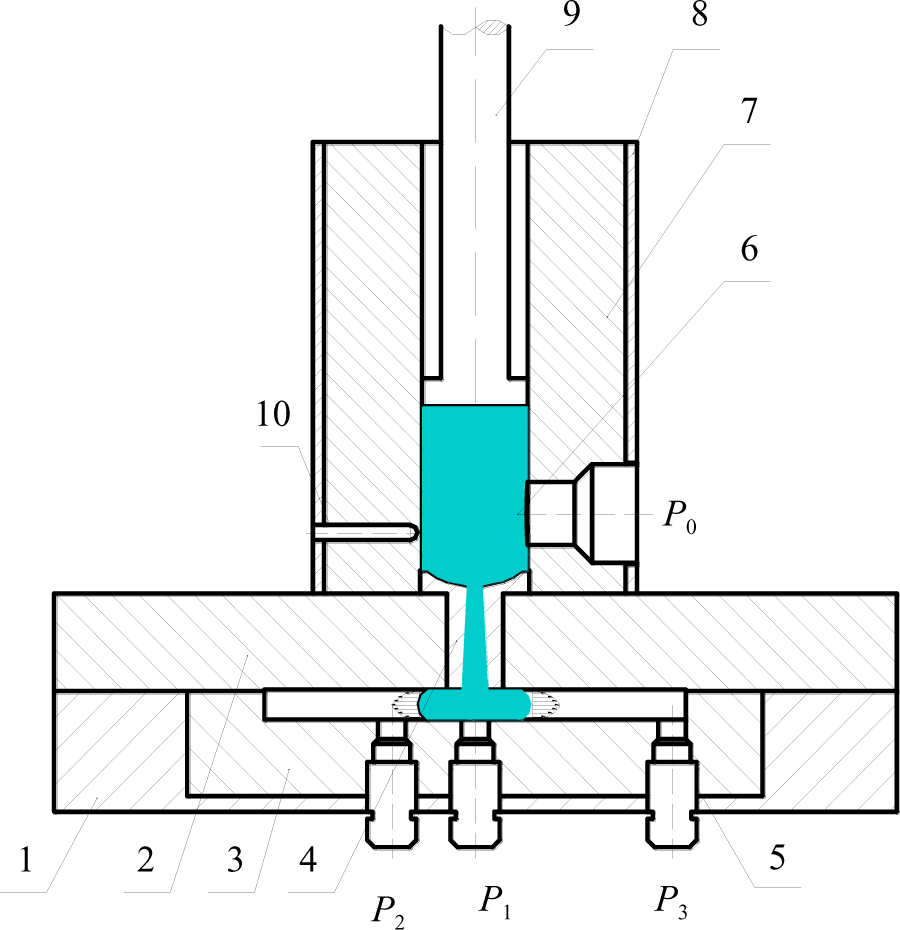
Sketch map of the mold and the layout of pressure transducers: (1) inferior plate, (2) superior plate, (3) cavity plate, (4) nozzle, (5) pressure transducer, (6) melt , (7) barrel, (8) heater, (9) piston rod, and (10) thermocouple.
Material
The material utilized in this study is low-density polyethylene (with a trademark 951-050) in the form of pellets (having melt flow index of 2.1 g/10 min, density of 0.915 g/cm3, and the melting point is about 111°C.) supplied by Maoming Petrochemical Corporation (Guangdong province, China).
Preparation of samples
In this work, the instantaneous entrance pressure fluctuates with time and the average entrance pressure P 0 is about 30 MPa as shown in Figure 3. The entrance pressure vibration amplitude changes with the change in piston rod vibration amplitude and vibration frequency. The entrance pressure vibration frequency is equal to the piston rod vibration frequency. The temperature of the barrel is kept at 190°C. The temperature of mold is kept at 45°C. The disk-shaped parts are made at different piston rod vibration amplitude and frequency. Also the cavity pressures are recorded at the same time.
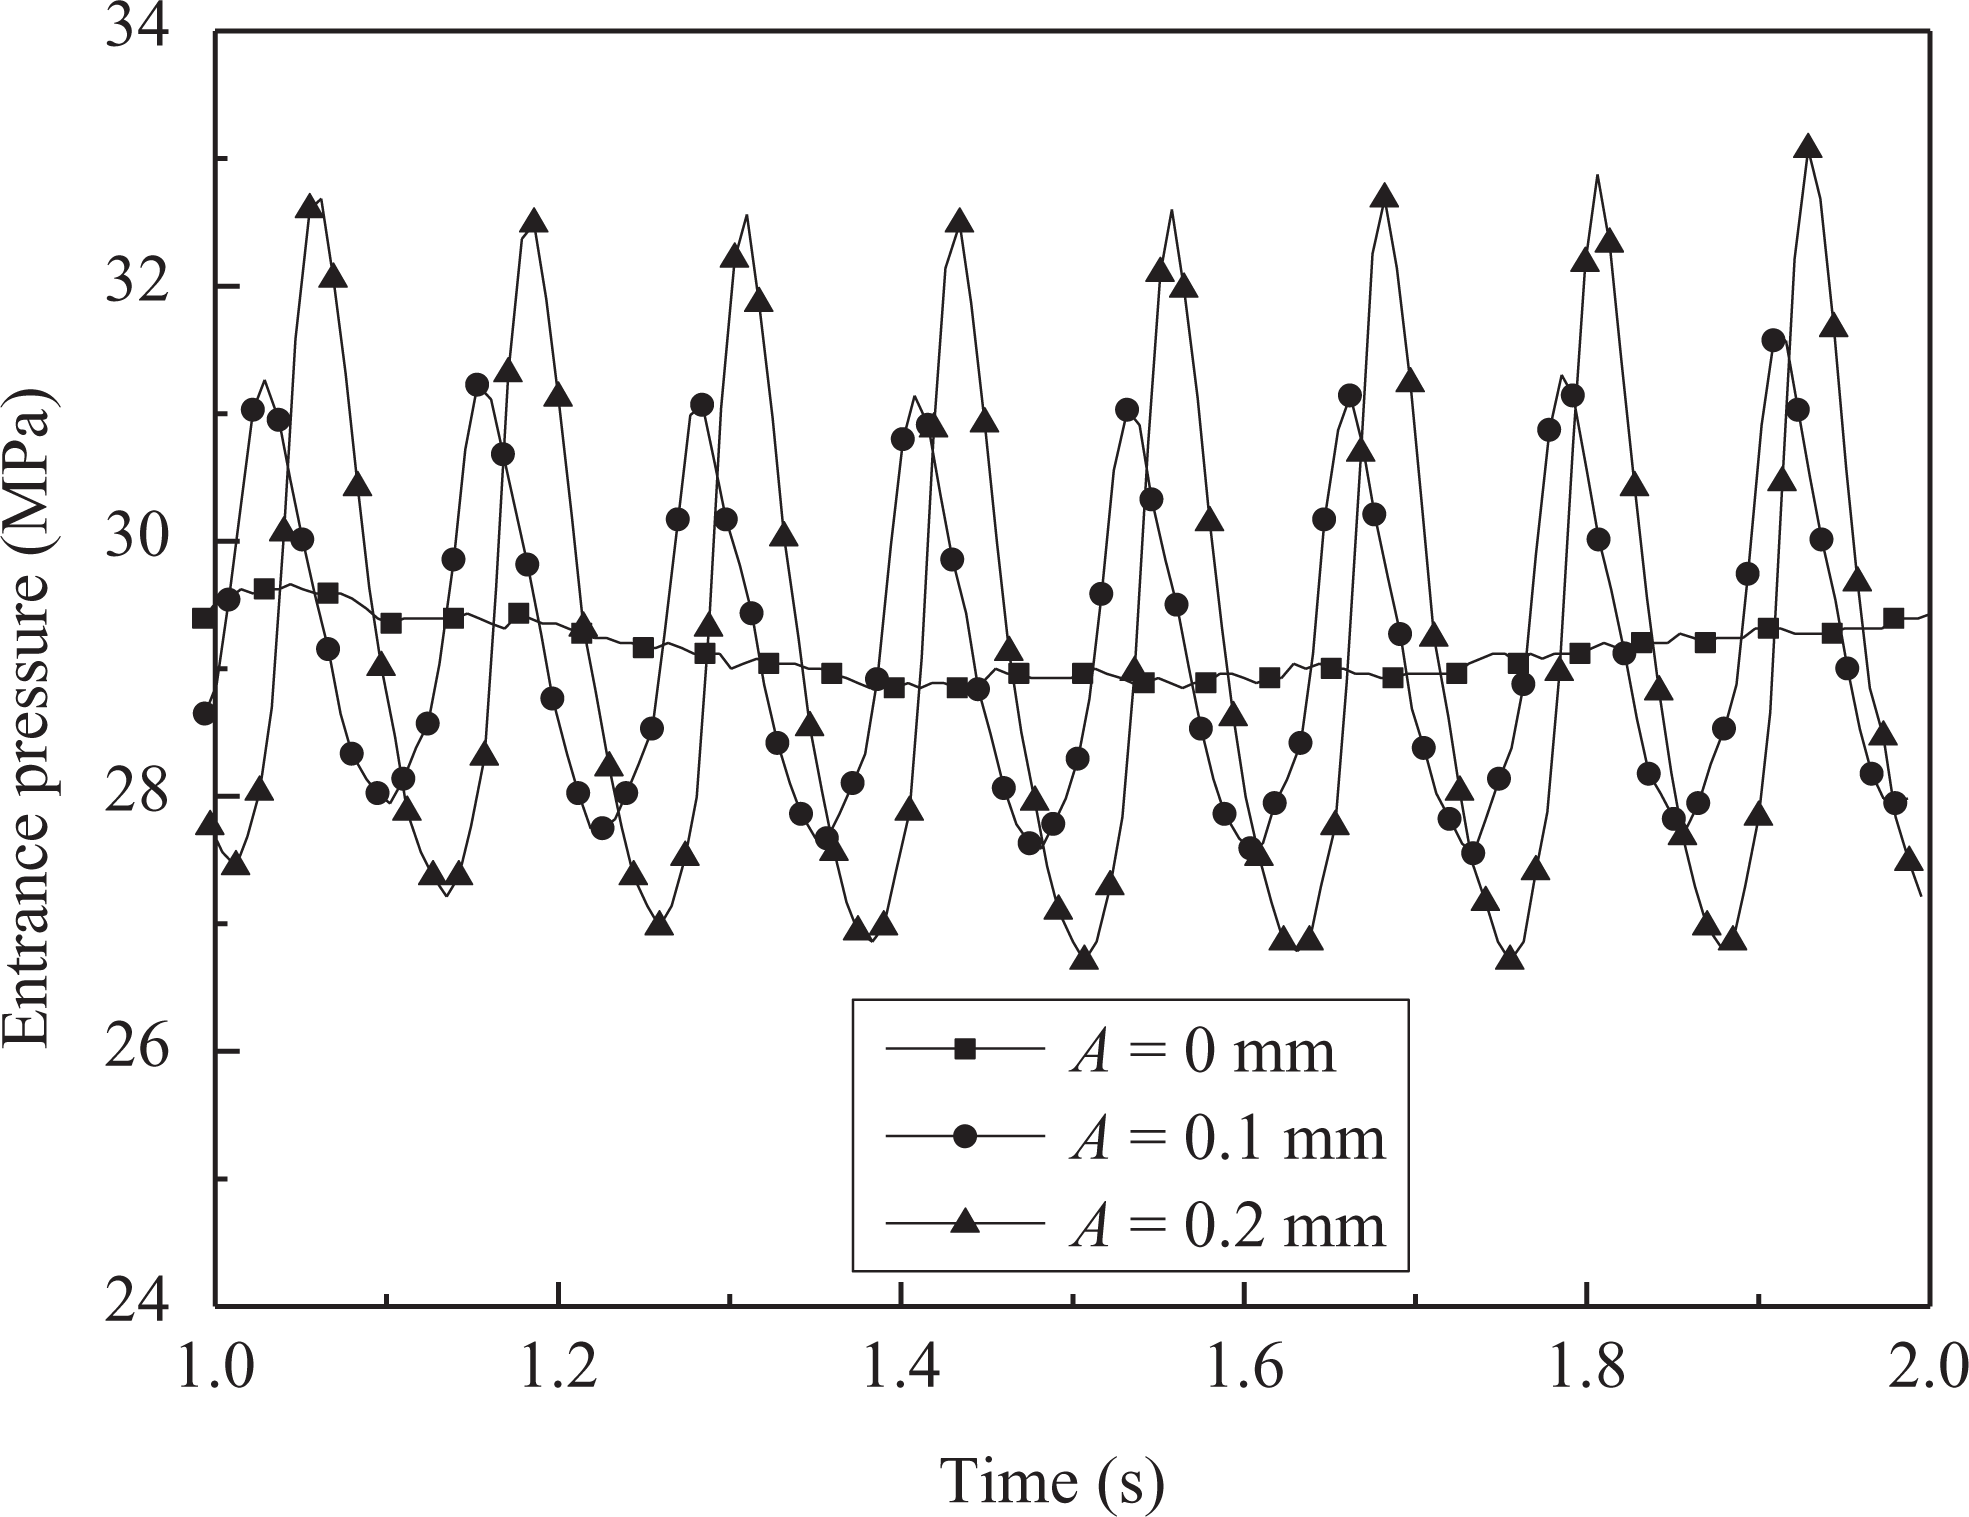
Chang of entrance pressure P 0 with time (f = 8 Hz).
Measurement of filling time
The filling time is estimated according to the change in the cavity pressure. Cavity pressure P 1 denotes the pressure at the cavity center; cavity pressure P 3 denotes the pressure at far end of the cavity. As shown in Figure 4, the moment t 1, at which the cavity pressure P 1 increased, indicate the beginning of the cavity filling, and the moment t 2, at which the cavity pressure P 3 increased, indicate the cavity is completely filled. The time interval between t 1 and t 2 is approximately estimated as filling time.
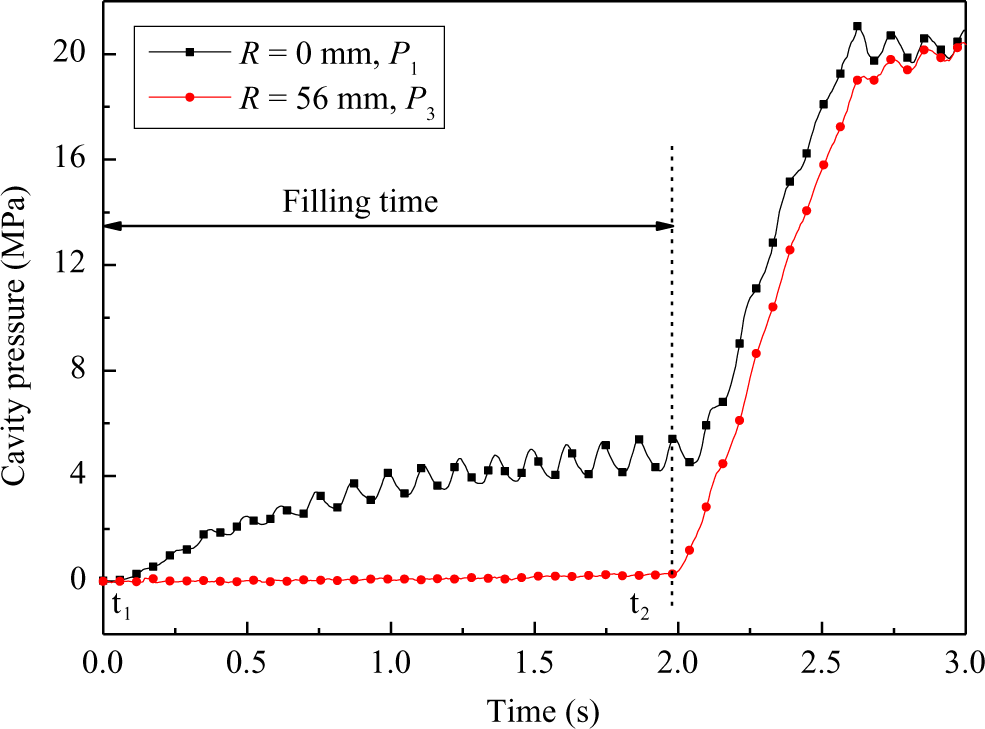
Sketch map of filling time calculation method.
Melting behavior and crystallinity
Samples used for thermal analysis were removed from different regions of VAIM processed moldings. The slices, about 0.3 mm in thickness, were cut from the planes at 1 mm below the surface along the thickness direction at r = 24 mm and weighed about 5 mg for each testing. The differential scanning calorimetry (DSC 204, Netzsch, Germany) was used to scan at 10°C/min at the atmosphere of nitrogen. The crystallinity was calculated from the measured heat of fusion, which was based on a perfect crystal heat of fusion of 293 J/g.
Results and discussion
Difference of cavity pressure between VAIM and CIM
The major difference between VAIM and CIM is the cavity pressure. As seen in Figure 5, the change in the trend of cavity pressures (P 1, P 2, and P 3) is similar in both VAIM and CIM. The cavity pressure changes sinusoidal with time during filling and packing in VAIM, which is completely different from CIM. The oscillated cavity pressure bring about great changes to the melts rheological properties, 20,21 which will in turn influence the filling time and the time needed to build the cavity pressure. Therefore, it naturally follows that final morphological states would also be modified. As seen in Figure 5, the pressure peak of P 1 curve in VAIM is higher than that of in CIM. This can be explained from two aspects: first, the introduction of vibration forces into the mold decreased the viscosity of the melt and improved the melt flowability. Then the melts flow faster and the pressure loss during melt flowing is reduced, thus the cavity pressure ascents quickly and can reach a larger peak value under a certain injection pressure. Second, the oscillation pressure gradients within the flow domain generated more heat locally by inner friction, which postponed the gate frozen time and more melts were packed into the mold during the packing stage.
Response of cavity pressure to injection pressure (a) VAIM and (b) CIM.
Effect of piston rod vibration parameters on cavity pressure peak
The influence of piston rod vibration parameters on cavity pressure peak is shown in Figure 6. As seen in Figure 6, the cavity pressure peaks of P 1, P 2, and P3 in VAIM are larger than those in CIM at certain injection pressure. The maximum cavity pressure peak difference between VAIM and CIM is about 2 MPa. As shown in Figure 6, first, the cavity pressure peak increases faster and then increases slowly with the increase in piston rod vibration frequency/amplitude. The increase in the cavity pressure owes to the reduction in the pressure loss during melt flowing at certain injection pressure.
Influence of piston rod vibration parameters on cavity pressure peak ((a) A = 0.3 mm; (b) f = 4 Hz).
Effect of piston rod vibration parameters on filling time
The response of cavity pressure P 1 to piston rod vibration amplitude and frequency is shown in Figure 7. As illustrated in Figure 7(a), the time needed to fill the cavity is shortened by the introduction of vibration force. This is mainly because the melt viscosity decreased with the introduction of vibration shear stress, and the melt can flow quickly at certain average entrance pressure P 0. Also the flow resistance decreased with the decrease in the melt viscosity.
Response of cavity pressure to piston rod vibration parameters ((a) A = 0.3 mm; (b) f = 8 Hz).
The filling time at different piston rod vibration amplitude/frequency are calculated according to the method introduced in Figure 4. The effect of piston rod vibration amplitude/frequency on filling time is show in Figure 8. As illustrated in Figure 8, first, the time needed to fill the cavity decreased faster and then decreased slowly with the increase in the piston rod vibration amplitude/frequency at given piston rod vibration frequency/amplitude. The filling time decreased from 2.15 s of CIM to 1.95 s of VAIM within our experimental range. This is mainly because the melt viscosity decreases with the introduction of vibration force and the melt can flow faster during filling. There is a fast decreasing sensitive region of vibration parameter for certain material. 22
Effect of piston rod vibration parameters on filling time.
Figures 9 shows the DSC curves of injection-molded samples prepared at different piston rod amplitude when the piston rod vibration frequency is fixed at 4 Hz. Figure 10 shows the DSC curves of injection-molded samples prepared at different piston rod frequency when the piston rod vibration amplitude is fixed at 0.3 mm. As shown in Figure 9, the melting peak shifts to high temperature with the increase in piston rod vibration amplitude when the piston rod vibration frequency is fixed. The crystallity increased from 28.5% (A = 0 mm) to 29.6% (A = 0.3 mm). As shown in Figure 10, the melting peak shifts to high temperature with the increase in piston rod vibration frequency when the piston rod vibration amplitude is fixed. The crystallity increased from 28.5% (f = 0 Hz) to 30.1% (f = 8 Hz).
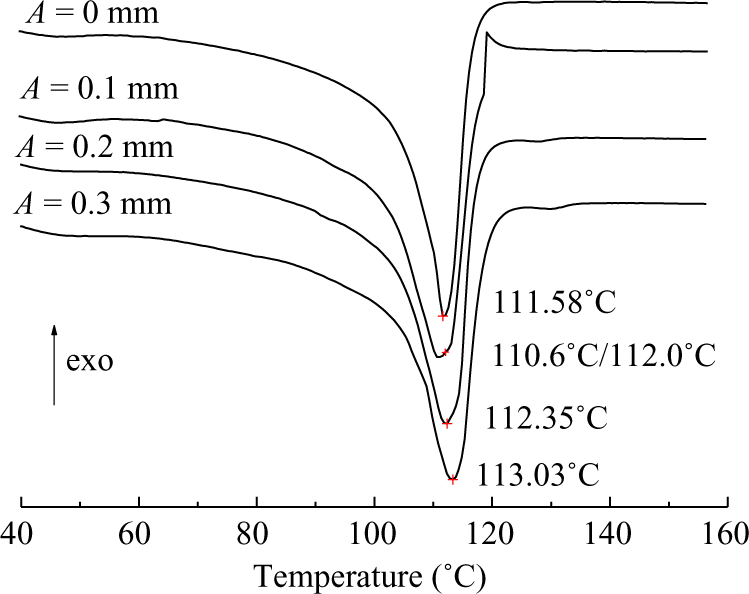
Differential scanning calorimetric curves of injection-molded samples under different vibration amplitude (f = 4 Hz).
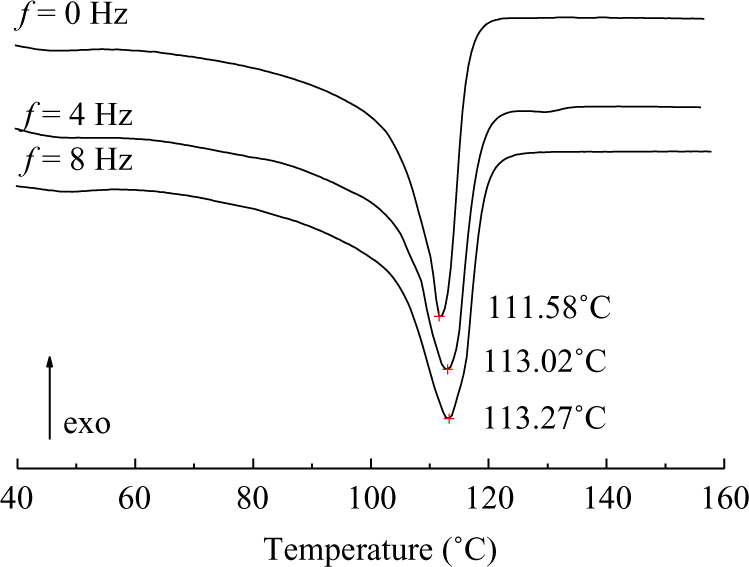
Differential scanning calorimetric curves of injection-molded samples under different vibration frequency while A = 0.3 mm.
Discussion and conclusion
According to the experimental results, the following conclusions are drawn:
The vibration energy of the piston rod can be transferred to the melts in the cavity. The cavity pressure oscillated during filling and packing stage. The cavity pressure vibration frequency is the same with the vibration frequency of piston rod.
The time needed to fill the mold can be shortened with the introduction of oscillation injection pressure. The filling time decreased from 2.15 to 1.95 s within our experimental range. There is a fast decreasing sensitive region of vibration for a certain material.
The melt peak became wider and the melt point moved to high temperature with the increase in piston rod vibration amplitude/frequency, which will improve the mechanical properties of the parts.
Footnotes
Funding
The authors acknowledge the financial support from the Fundamental Research Funds for The Central Universities of China (2012ZM0047). And also the financial support from the National Science and Technology Pillar Program during the twelve 5-year plan period (2011BAE15B01) is gratefully acknowledged.