
Abstract
A series of composite films consisting of bisphenol A polycarbonate (BAPC) and carbon black (CB) as nanofillers were prepared by solution mixing followed by film casting. The influence of both CB content and temperature on thermal and dielectric properties of BAPC was investigated. X-Ray diffraction patterns show semicrystalline nature of the prepared films. The thermal and dielectric properties were carried out as a function of frequency in the range from 20 Hz to 3 MHz, temperature in the range from 20 to 80°C for concentrations 0, 1, 3, 5, 7, 10, and 15 wt% CB. Differential scanning calorimetric results show a decrease in the glass transition temperature and apparent activation energy at decomposition temperature when the CB content increases. The dielectric measurements show that the dielectric constant (ε′) and alternating current conductivity increase with CB content and also with the temperature. However, the ε′ and dissipation factor decrease with frequency. The increase in ε′ with temperature is due to the formation of new dipoles or accumulation of charge carriers in a nanoparticle–polymer interface. Parameters relating to thermal and dielectric properties of these composites can be controlled by adjusting the CB nanoparticles content in the BAPC matrix and temperature. It could be concluded that the obtained composites should be desirable candidates for high ε′ materials in embedded capacitor applications.
Introduction
Polycarbonate (PC) resins can be divided into two structural classes: aliphatics, which are not extensively used as thermoplastics, and aromatics, which have notable applications in engineering thermoplastics. Bisphenol A polycarbonate (BAPC) is the most widely used aromatic PC. It is a condensation polymer in which benzene rings plus quaternary carbon atoms form bulky chains that crystallize with great difficulty, enabling the polymer to have excellent characteristics such as transparency, toughness, thermal stability, and dimensional stability. Due to these properties, BAPC is used in various applications such as compact disks, riot shields, vandal proof glazing, baby feeding bottles, electrical components, safety helmets, and headlamp lenses. 1 BAPC was used successfully in capacitors for many years. 2 Also, BAPC has been widely used in many technical applications where properties like dielectric constant (ε′), alternating current (AC) conductivity, rigidity or thermal stability are required. The applications of wide range of BAPC films should be further extended as filling components with conductive nanofillers. 3 Active fillers play an important role in improving optical, mechanical, thermal, and dielectric properties of polymer composites. New opportunities arise using nanoscaled fillers, especially carbon nanofillers, which exhibit excellent thermal and electrical properties. 4 Carbon black (CB) nanoparticles were selected as the nanofiller due to its large surface area and wide range of thermal and electrical properties based on its surface chemistry, particle size, and aggregate structure. Carbon nanoparticles-filled polymers have been used in aerospace industries, for flooring materials to dissipate static electricity charges, electromagnetic shielding materials, and in modern electrical components and devices. 5
Many reports appeared in the literature dealing with the effects of nanofillers on physical properties of PCs, 6–10 but to our knowledge, very few attempts have been made to investigate the effects of both filling with CB nanoparticles and temperature on glass transition temperature (T g), thermal activation energy, thermal stability, ε′, and AC conductivity (σ AC) of BAPC and correlating them with changes in the structure of the polymer. The present work is planned to investigate the temperature, filling level, and frequency dependence of thermal parameters, ε′, and σ AC of the composites in order to obtain certain composites with best thermal and dielectric properties to utilize them in different applications.
Experimental procedures
Film preparation
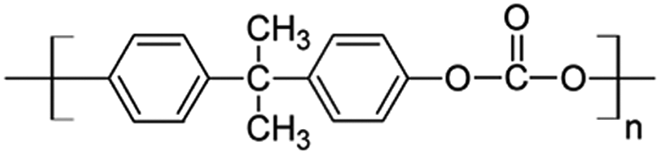
BAPC, obtained from Goodfellow Corporation (Cambridge, UK), exists in a semicrystalline form with a density of 1.2 g cm−3. The chemical structure of PC is given as follows.
The CB nanoparticles were acquired from Nanostructured and Amorphous Materials, Inc. (Houston, Texas, USA). According to the manufacturer, the carbon nanoparticles have an average size of 50 nm. The purity of the nanoparticles was more than 99.5%. The specific surface area of the carbon nanoparticles is 500 m2 g−1. Composite films of PC/carbon with different concentrations, 1, 3, 5, 7, 10, and 15 wt% were prepared by casting technique. Prior to that procedure, the prepolymer BAPC films were prepared by dissolving the BAPC pellets in chloroform (10% w/v) using a magnetic stirrer. CB as a nanofiller wasdispersed in the PC solution by ultrasonification (Bandelin Sonopuls manufactured by Fluko Equipment Shanghai Co. Ltd (Shanghai, China), HD 200/UW200 homogenizer with KE76 titanium-tapered tip, pulsed mode) for 5 min. The homogeneous liquid was poured into petri dishes. Subsequently, the films were dried at 70°C in a vacuum oven for 24 h resulting in samples of about 35–50 μm thickness.
X-Ray diffraction
X-Ray diffraction (XRD) experiments of the samples were carried out on a D500 diffractometer (Siemens, Germany) operated with copper (Cu) Kα radiation (λ = 1.54 Å) at 40 kV and 100 mA. The scans were recorded in the range of 2θ values from 4° to 50° at room temperature.
Differential scanning calorimetry
Differential scanning calorimetry (DSC) analysis was performed using a DSC-50 calorimeter (Shimadzu, Japan). The T g and melting temperature (T m) values of unfilled BAPC and the nanocomposites were determined from the heating scans. The T g was taken as the midpoint of the specific heat increment. The T m was taken as the peak value of the respective endothermic value in DSC scan. Heating scans were performed at a heating rate 10°C min−1 under nitrogen atmosphere from 25 to 600°C.
Thermogravimetric analysis
Thermogravimetric analysis (TGA) and differential TGA were conducted on a TGA-50H analyzer (Shimadzu, Japan) to investigate the thermal stability and thermal activation energy of the prepared samples. The samples were heated under flowing nitrogen atmosphere from 25 to 600°C at a heating rate of 10°C min−1 and the weight loss was also recorded.
Dielectric measurements
The dielectric parameters such as ε′, AC conductivity (σ
AC), impedance (Z), and loss tangent were carried out at temperatures 20, 40, 60, and 80°C using an AC impedance bridge (precision component analyzer, model 6440B, WAYNE KERR Electronics (Cavendish square, London, UK)) in the frequency ranging from 20 Hz to 3 MHz. The samples under test were inserted between two Cu sheets with a small pressure using weak spring. The two leads from both sheets were connected to the lock-in amplifier. The measured value of capacitance and dissipation factor has been converted into the ε′. The ε′ was calculated using the following relations

and

where C p is the capacitance of the polymeric film measured using lock-in amplifier, A is the area of the electrode measured in squared meter, d is the thickness of the polymeric film, and ε 0 is the permittivity of free space (i.e. 8.859 × 10⁻¹² F m−1).
Dielectric loss was calculated using the following equation

The σ
AC value was also determined for all composites using the equation

where f is the frequency measured in hertz.
Results and discussion
Structural characterization
Figure 1 shows the XRD scans of semicrystalline nature of BAPC, CB, and BAPC filled with different concentrations of CB nanoparticles. The XRD scans show the presence of a high-angle symmetric diffraction peak from 2θ = 15–20°. The pure BAPC scan shows three peaks: one strong and sharper peak at 2θ = 17.4° with d spacing of 5.159 Å and the other two small peaks at 2θ = 25.8° with d spacing of 3.449 Å and 2θ = 35° with d spacing of 3.0411 Å, which confirmed the crystallization of BAPC. The (020) and (201) reflections are located at 2θ = 17.4° corresponding to the monoclinic unit cell. Rathore et al. 1 and Kim and colleagues 11 reported similar results in BAPC. Also, from the XRD pattern of CB, it can be found that the CB has characteristic diffraction peaks at 2θ = 21.8° and 2θ = 26.4°. 12 These peaks correspond to (002) reflection of the carbon. Moreover, the XRD patterns of BAPC/CB composites show the prominent diffraction peak at 2θ = 17.4° became boarder and less intense with rising the carbon content, while the diffraction peak at 2θ = 24.4°, which is assigned to CB, had disappeared. The disappearance of this peak is due to good dispersion of CB nanoparticles in the BAPC matrix, indicating a delaminated and disordered structure of the composites. These results clearly indicated that the extent of intercalation/exfoliation gradually increased when increasing the CB content. 11
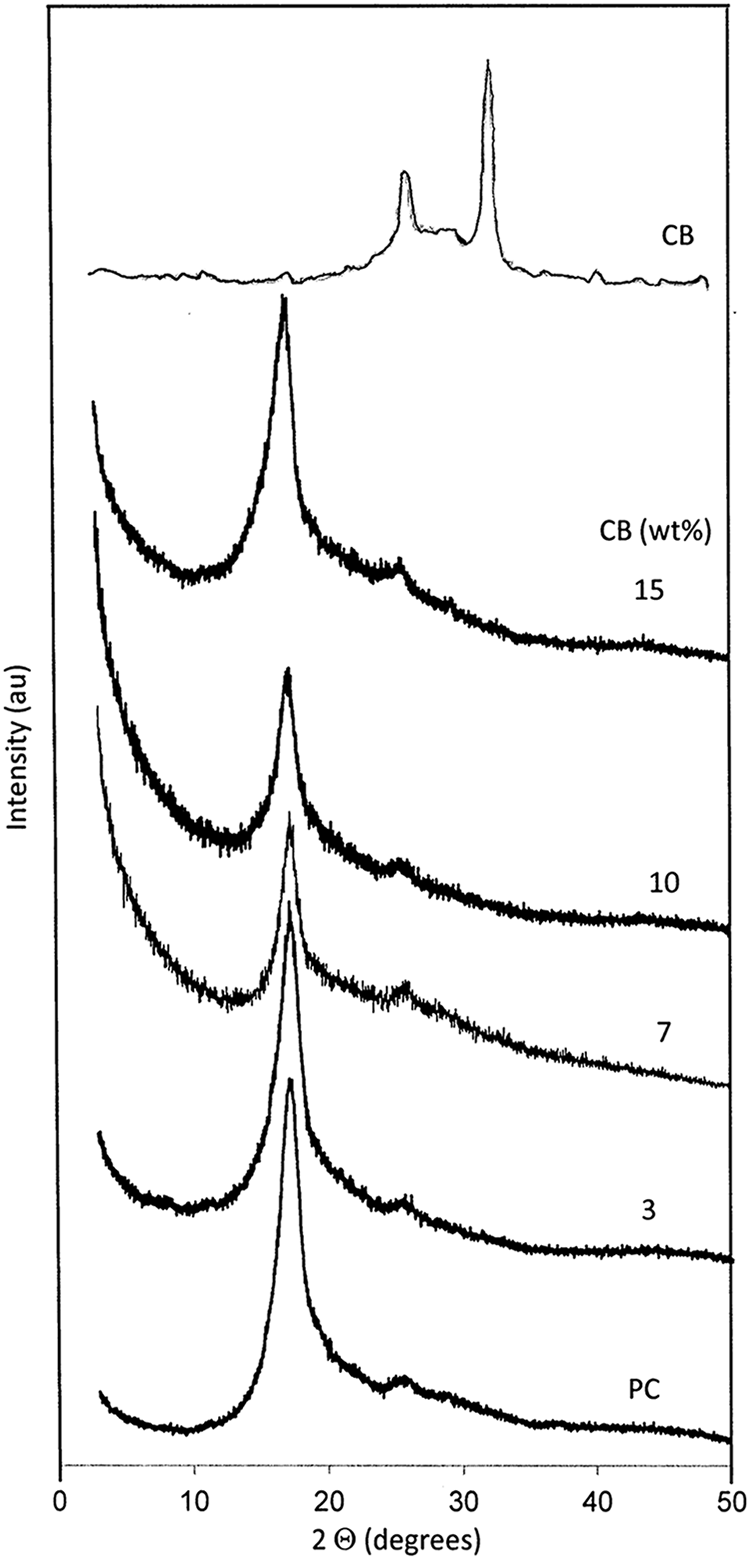
XRD pattern of neat BAPC, nanocomposites, and CB nanoparticles. XRD: x-ray diffraction; BAPC: bisphenol A polycarbonate; CB: carbon black.
The areas under the diffraction peak at 2θ = 17.4°can be taken as a measure for crystallinity (A). A
P and A
f denote the area, under this diffraction peak, for the unfilled and filled films, respectively. The crystallinity of the composites due to the filling is given by the following equation
13
:

Table 1 shows the filling level dependence of the crystallinity. It is clear that the crystallinity decreases by increasing the content of CB nanoparticles. The decrease in crystallinity is due to the main chain scission and cross-linking of BAPC with increasing CB nanoparticles content.
The filling level dependence of A, n, and L with T m.
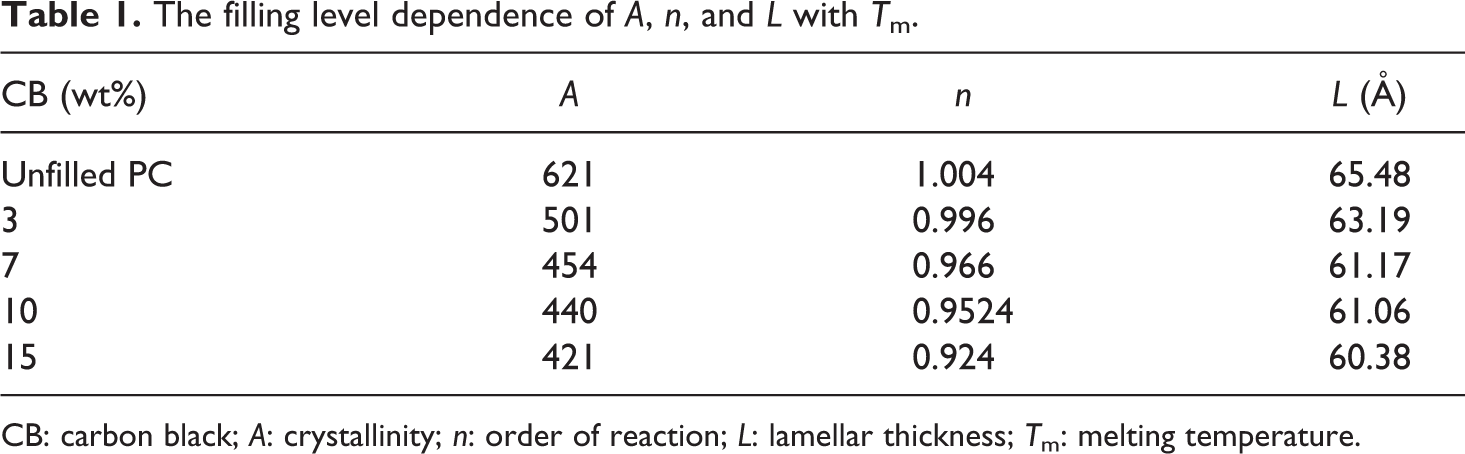
CB: carbon black; A: crystallinity; n: order of reaction; L: lamellar thickness; T m: melting temperature.
Thermal properties
Differential scanning calorimetry
T g is an important physical parameter to characterize the structural property of the polymer in terms of chain rigidity and intermolecular forces. Figure 2 shows DSC thermograms of BAPC and BAPC filled with 3, 7, 10, and 15 wt% of CB nanoparticles. All the composite films exhibit T g, and the endothermic peak refer to T m. T g and T m values of the BAPC and its composites are shown in Figure 3, indicating a monotonic decrease dependence on CB content. The unfilled BAPC shows T g at about 140°C, which is in agreement with the value reported in the literature. 14 The high T g value of BAPC arose from the existence of the stiffening aromatic groups, which restricted the movement of polymer segments and thus increase the T g. A gradual decrease in the T g values of composites from about 140 to 70°C was observed with an increase in the CB content. The decrease in the T g value is generally due to the decrease in molecular mobility as a result of the scissoring of the polymer chains. In other words, the decrease in T g reveals a faster relaxation dynamics possibly caused by constrained chain segments in small interparticle spacing or the plasticizing effect of the nanofiller. 15 Moreover, three small exothermic peaks at about 95, 89, and 82°C were observed, which corresponds to pure BAPC and composites at 3 and 7 wt% CB, respectively. These exothermic peaks could be supported by the presence of crystalline domains in the prepared films. 16 This result is consistent with that obtained from XRD analysis.
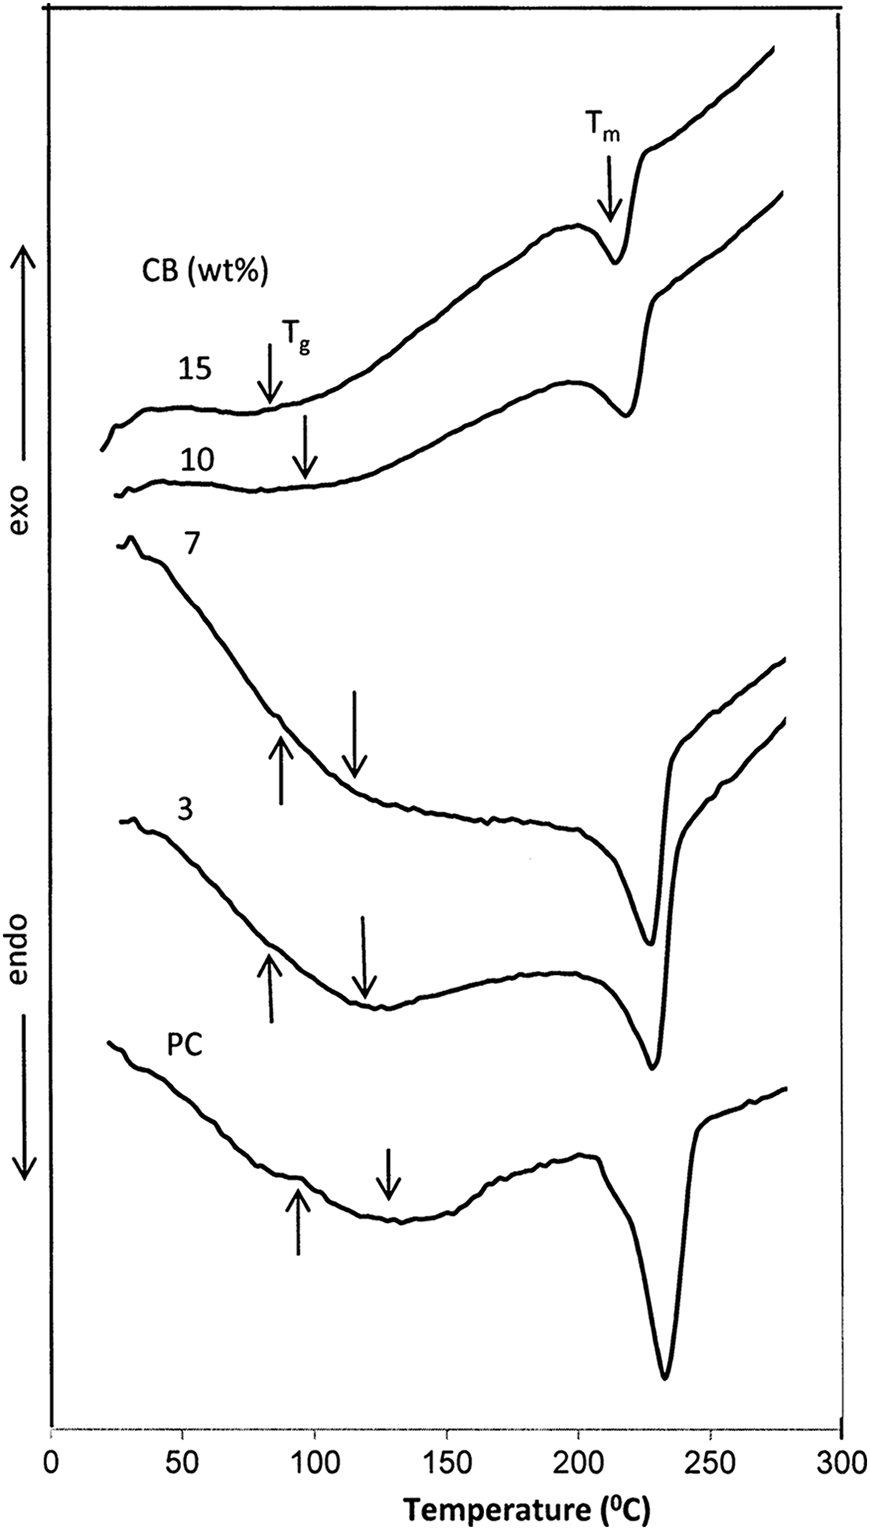
DSC curves of composites with different filling levels of CB nanoparticles. DSC: differential scanning calorimetry; CB: carbon black.
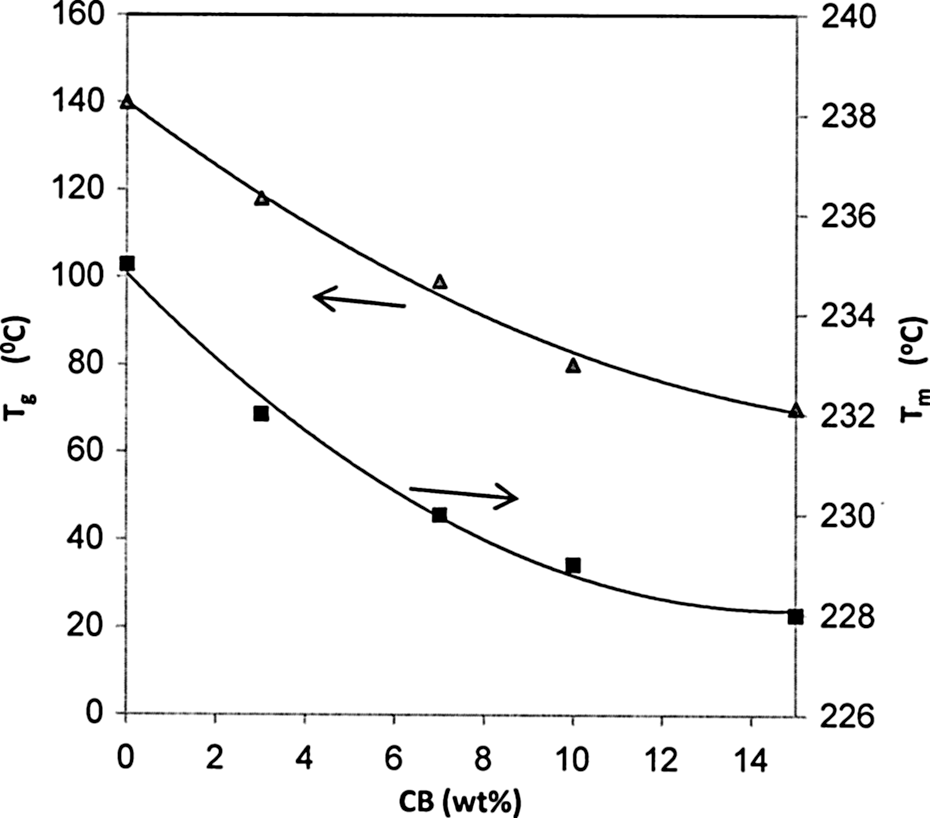
The filling level dependence of both T g and T m. T g: glass transition temperature; T m: melting temperature.
Also, the thermograms are characterized by an endothermic peak referring to BAPC (T
m) at about 235°C.
17
The dependence of T
ms on filling levels is shown in Figure 3. It is observed that value of T
m decreases, when the content of CB nanoparticles increase. Generally, when the nanofillers are incorporated into the polymeric matrix, the crystallinity of the polymer can be either increased or decreased. On one hand, the carbon nanofillers could act as a nucleating agent resulting in an increased crystallinity. On the other hand, the nanofillers could also confine the stricted to a microenvironment surrounded by the nanofiller, which would lead to decrease crystallinity. Hence, the decrease in crystallinity of BAPC in the presence of CB might be due to the fact that the carbon nanofillers create a large interface between the BAPC molecules surrounding the nanofillers. The interface region forms an amorphous phase, interferes with crystal growth, and eventually limiting the overall degree of crystallinity.
18
These results were further confirmed by XRD analysis. The values of the order of reaction (n) at T
m were calculated using the Kissinger method
19
and are listed in Table 1. It is clear that the value of the order of reaction (n) decreases from 1.004 to 0.925 with increasing CB content. This result indicated that all reactants of pure BAPC are melted, but not all reactants are melted at high CB content. Moreover, the equilibrium melting temperature 
where the fold surface free energy (σ
e) is 94 erg cm−2, the heat of fusion per unit volume (▵H
f) is 1.1 × 10⁹ erg cm−3, and
Thermogravimetry analysis
TGA is widely used to determine the kinetic parameters as thermal stability and apparent activation energy (E a) at decomposition temperature (T d). Also, the TGA provides quantitative information about the weight change process. The TGA scans of BAPC and its composites are shown in Figure 4. The TGA thermogram of BAPC shows no weight loss up to 445°C and decomposition occurs in a single stage with maximum rate of degradation around 510°C. It is well known that the main degradation pathways of BAPC can be classified into two categories: chain scission of isopropylidene bonds and hydrolysis/alcoholysis of carbonate bonds, including rearrangements of some carbonate bonds like decarboxylation or cross-linking upon heating, ultimately resulting in carbon dioxide, water, and carbon monoxide. 22 Also, the TGA curves for all composites show one step of decomposition with an onset temperature (T onset). The dependence of T onset values on filling level is presented in Table 2. It is clear that the values of T onset decrease with increasing CB content. Moreover, the residual weight loss (m%) was determined and tabulated in Table 2. It is observed that the residual weight loss increases as nanofiller increases. The decrease in the weight loss is due to the emission of volatile gases. The T d for the pure sample and the filled samples are tabulated in Table 2. It is clear that the T d decreases when CB content increases. This result indicates that the polymeric system becomes disordered upon filling with CB nanoparticles. A series of complicated chemical reactions occur during the decomposition of BAPC, which include the chain scission of carbonate linkages, rearrangement of carbonate linkages to form ether linkages and cross-linking reaction. 23
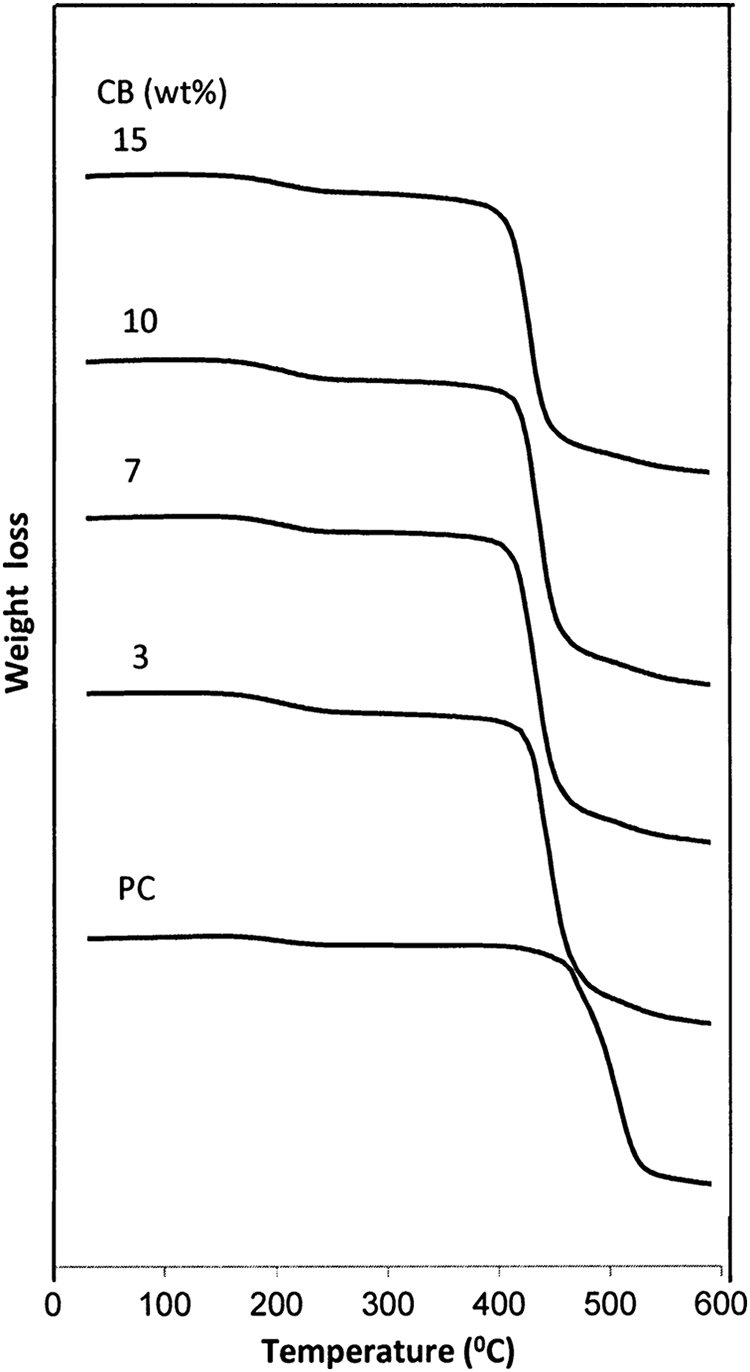
Thermogravimetric curves of pure BAPC and composites. BAPC: bisphenol A polycarbonate.
The filling level dependence of T onset, m%, T d, and E a at T d.
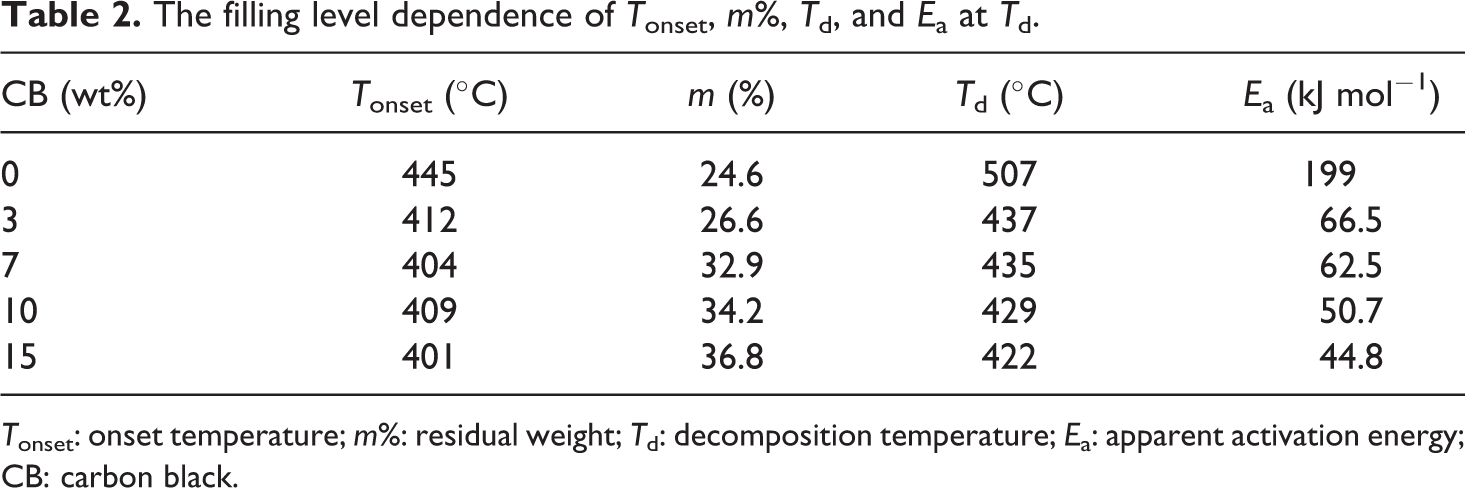
T onset: onset temperature; m%: residual weight; T d: decomposition temperature; E a: apparent activation energy; CB: carbon black.
For further investigation of the thermal properties, one can determine the thermal activation energy at T
d, which is useful for investigating the thermal properties of materials. Various TGA methods based on either the rate of conversion or the heating rate have been reported for determining the thermal activation energy. Horowitz–Metzger method was used in this study to measure the thermal activation energies. The rate of degradation 
where α represents the extent of reaction (α = 0→1), the value of α is experimentally determined from TGA as a relative weight mass loss, t is the time, and k is the rate constant given by the expression
where A is the Arrhenius frequency factor. So in dynamic mode, the rate expression can be written as
Different kinetics expressions could be obtained by integrating the above equation with different approximation treatments. To evaluate the activation energy for decomposition of studied films from TGA curves, we used an integrated method of Horowitz and Metzger, which is given by the following equation
24

whereT max is the temperature at maximum rate of weight loss, θ = T−T max, and R is the universal gas constant. Figure 5 illustrates the plots of ln[ln(1/(1−α))] versus θ.E a at the T d was calculated from the slope of the straight line according to equation (10). The calculated E a as a function of CB nanoparticles loading is summarized in Table 2. Comparing the values of the E as for the BAPC and composites, it can be found that the E a values decrease as the filling level increases. The decrease in E a values with adding CB content is due to the perturbation, particle agglomeration, and particle–matrix interaction. In other words, the decrease in the thermal stability of the composites may be attributed to the decrease in the E aat degradation process. These observations are in good agreement with the results derived from other studies. 25
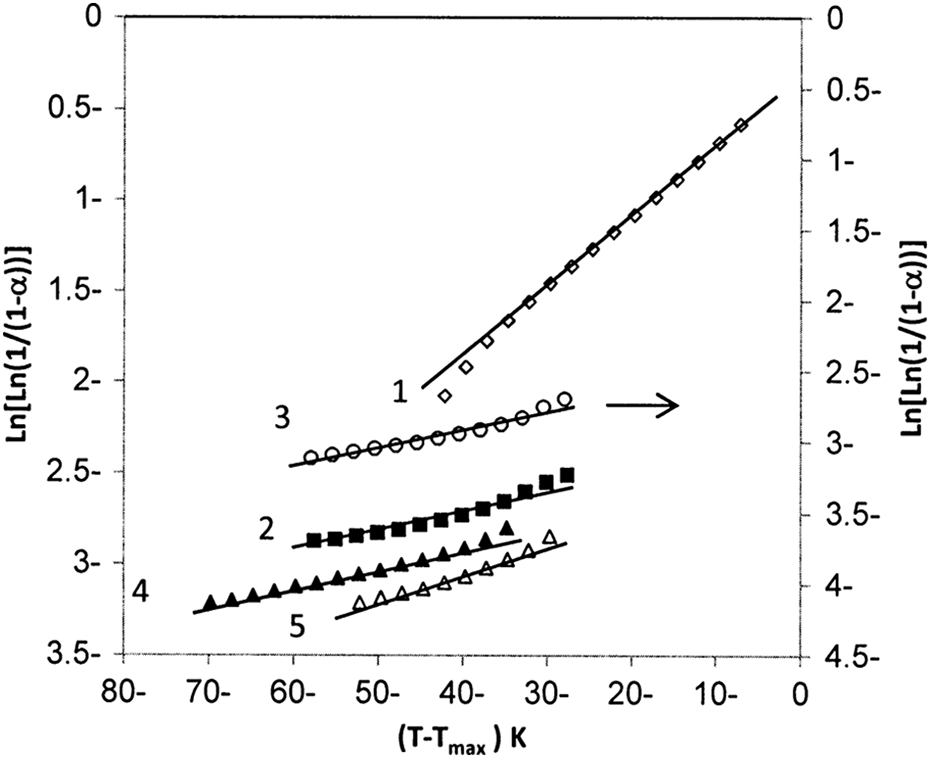
Kinetics of thermal decomposition for (1) PC, (2) 3 wt%, (3) 7 wt%, (4) 10 wt%, and (5) 15 wt% of CB using Horowitz–Metzger method. PC: poly carbonate; CB: carbon black.
Dielectric studies
Frequency and temperature dependence of ε′
The dependence of the ε′ on frequency, at series of temperatures 20, 40, 60, and 80°C for 0, 1, 3, 5, 7, 10, and 15 wt% of CB nanoparticles, is investigated. For simplicity, Figure 6 shows the frequency dependence of the ε′ for different CB concentration at certain temperature 80°C. For all samples, strong frequency dispersion is observed in the low frequency region up to 600 Hz followed by a frequency independent behavior. The decrease in ε′ when increase in frequency may be associated to Maxwell–Wagner mechanism, interfacial space charge, and the electrode polarization effect. The polarization of the polar function groups in polymer chains is increased by decreasing the frequency. The polarity of BAPC molecules is also responsible for the enhancement in ε′ by improving the dipole movement, which leads to an increase in orientation and interfacial polarizations. Moreover, the composites consist of distinct interphases and interfacial polarizations significantly contribute to the ε′ by the accumulation of charges at the interface between the BAPC and CB nanoparticles. This process increases the polarization that led to increase in ε′. As frequency increase, the ε′ decreases very slowly to attain a constant value of the ε′, the observed behavior of the ε′, verifying the fact for polar materials, BAPC, initial value of the ε′ is high. 26
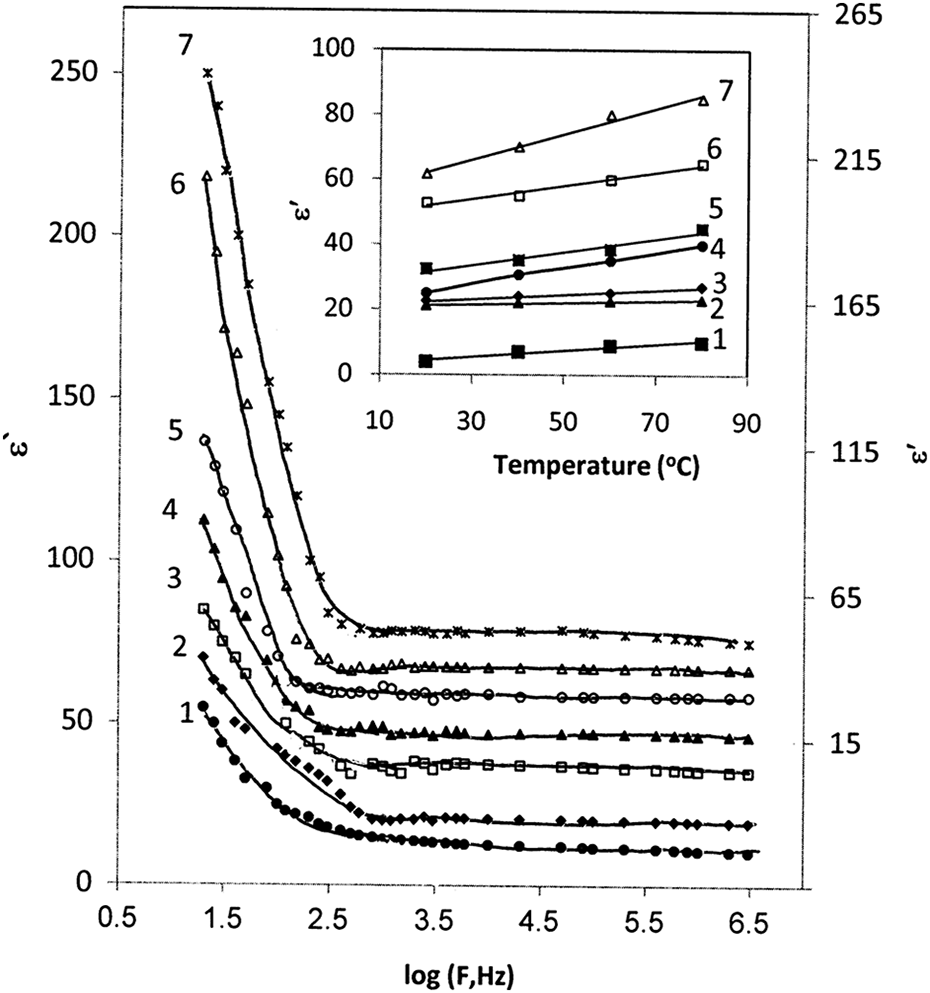
Variation in the dielectric constant with frequency for (1) PC, (2) 1 wt%, (3) 3 wt%, (4) 5 wt%, (5) 7 wt%, (6) 10 wt%, and (7) 15 wt% of CB, curve numbers: 4, 5, and 6 correspond to RH axis; inset figure shows the temperature dependence of dielectric constant at frequency 10 kHz. PC: poly carbonate; CB: carbon black’ RH: right hemisphere.
The temperature dependence of ε′ of unfilled BAPC as well as BAPC filled with different concentrations of CB at a frequency of 10 kHz is shown in the inset of Figure 6. It is observed that the ε′ is monotonically increased as a function of temperature. The increase in temperature tends to transfer of the glassy state of the polymer chain to rubbery state. The glassy to rubbery transition improves the segmental mobility of the polymer and facilitates the polarization and consequently increases the ε′. 27 In other words, the increase in ε′ with temperature is explainable by considering the added thermal energy within the system. As the thermal energy rises, there is an increase in the free volume of the composites allowing for the greater reorientation of dipoles in the composites in response to the applied electric field. 28
Figure 7 illustrates the ε′ of composites on the CB nanoparticles concentration at frequency of 10 kHz. It was found that the ε′ increases gradually with increase in CB content. Comparing the value of ε′ for pure BAPC with that of the composites, the ε′ of the composites was improved 20 times. The enhancement in ε′ is attributed to the interfacial polarization of heterogeneous system consisting of phases, CB phase, and BAPC matrix, with different ε′s and conductivities. In other words, at low-filling level, carbon nanoparticles are isolated and there is no interaction between them. Furthermore, as the CB concentration increases, the CB particles are very close to each other. The average polarization associated is larger than the individual particles. Therefore, the ε′ of the composites will be higher than that of the pure BAPC. Similar results were observed by Singh et al. 29
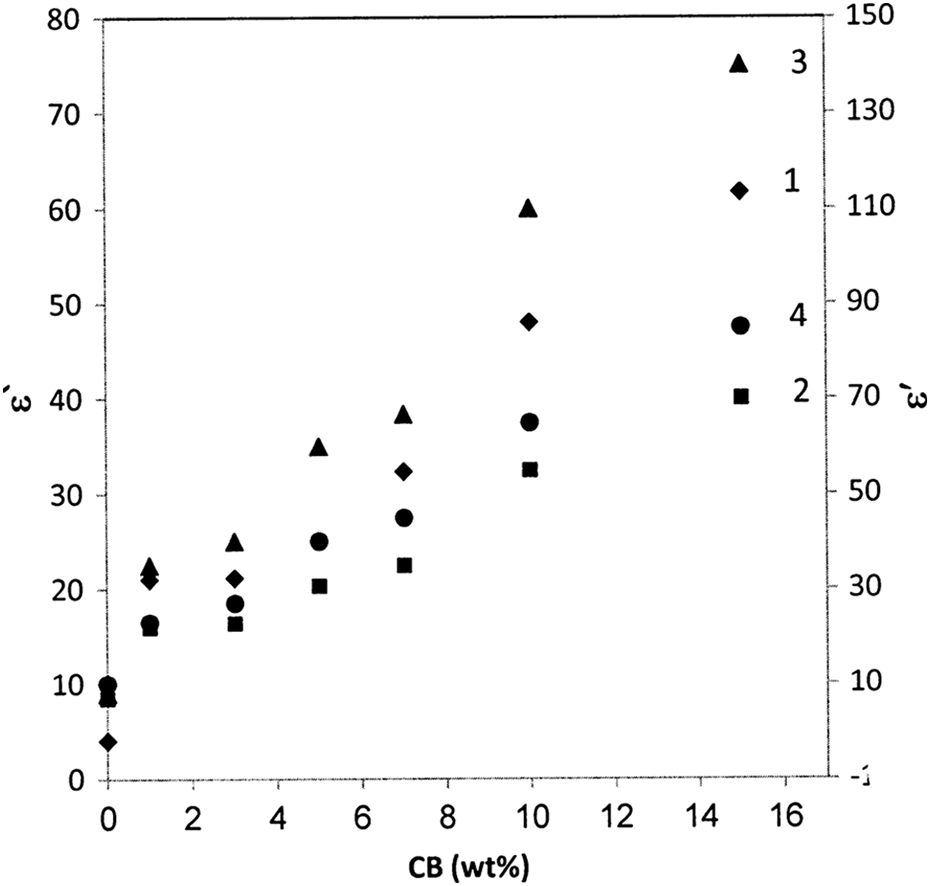
The dependence of the dielectric constant on the filling levels at frequency 10 kHz for (1) 20°C, (2) 40°C, (3) 60°C, and (4) 80°C.
Frequency and temperature dependence of σ AC
The dependence of σ AC on frequency at certain temperature of 80°C, for simplicity, is shown in Figure 8. It was observed that there are two trends. The first trend, from 20 Hz to 100 kHz, is the frequency independent conductivity and the second trend, from 100 kHz to 3 MHz, is the frequency dependent conductivity for all composites. The first trend is contributed by small free charges available in the composites, whereas the second trend is due to trapped charges, which are only active at higher frequencies.
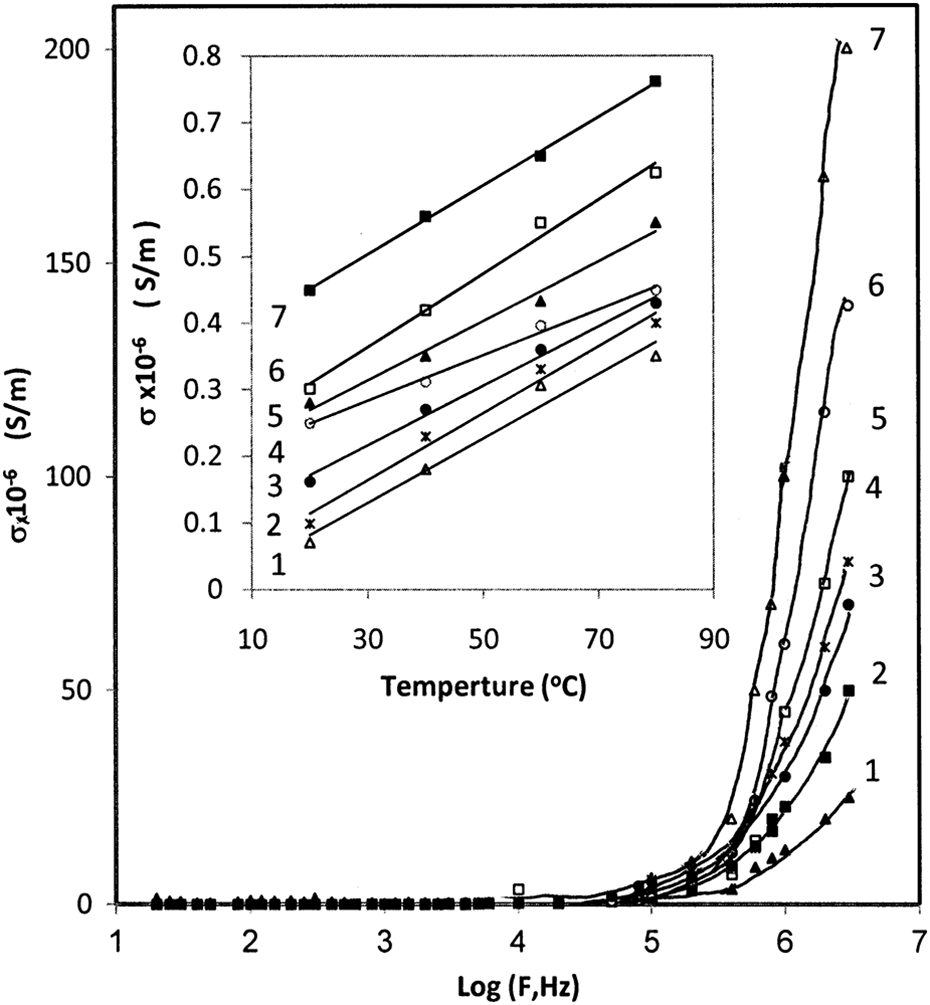
Variation in AC conductivity with frequency for (1) PC, (2) 1 wt%, (3) 3 wt%, (4) 5 wt%, (5) 7 wt%, (6) 10 wt%, and (7) 15 wt% of CB; inset figure shows the temperature dependence of AC conductivity at frequency 10 kHz. AC: alternating current; CB: carbon black.
The variations in the σ AC of BAPC/CB composites with temperature at a frequency of 10 kHz are shown in Figure 8. It is observed that the σ AC increases as the temperature rises. This can be explained according to the fact that σ AC arises from the rapid transitions between localized states of charged species such as electrons or dipoles. The increase in temperature would improve the segmental mobility of polymer and consequently increase in σ AC.
The variations in σ AC with filling levels are found in Figure 9. The inset figure shows that the σ AC increases with increasing CB content. At no filler loading, the pure BAPC had an σ AC of approximately 7 × 10⁻⁸ S m−1. This result was confirmed by Ayesh and Abdel-Rahem. 30 But at high-filling level, 15 wt%, the CB produced a composite conductivity of approximately 4.5 × 10⁻⁸ S m−1. The enhancement in σ AC by increasing the CB content is attributed to the electronic interaction processes taking place in the composites; therefore, the BAPC/CB composites become more conductive with the increase in nanofiller conductive content. At low nanofiller content, the conduction particles are separated and the electronic charge may flow only by means of hopping or tunneling through a nonconducting medium between the neighboring particles. The transport of charge carriers is inefficient and the overall conductivity is low. When the CB nanoparticles concentration increases, the gaps between the CB particles diminish and therefore the conductivity increases because the charge transport gets easier. Many authors reported the same behavior on different composite systems. 31
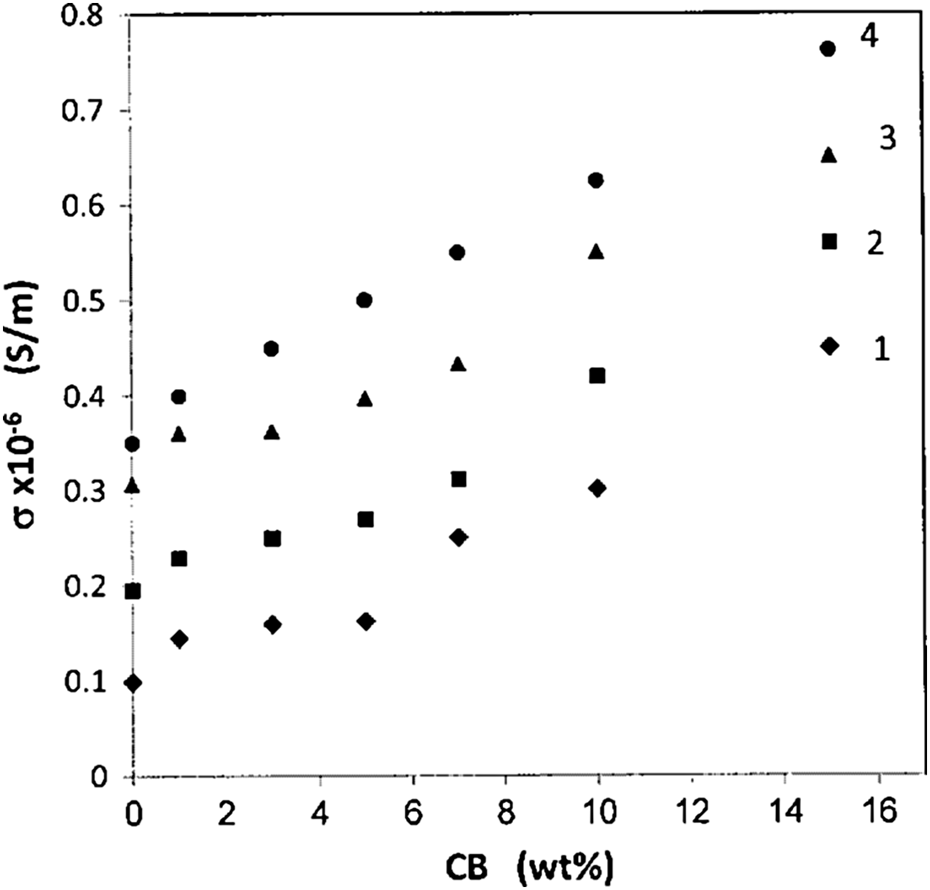
Variation in AC conductivity with filling levels at frequency of 10 kHz for (1) 20°C, (2) 40°C, (3) 60°C, and (4) 80°C.
According to the Arrhenius law, the dependence of σ
AC on the temperature is given by the following well-known equation
32
;
where σ AC is the preexponential factor, E is the activation energy for conduction. E value is calculated from the slope of lines in the graph [ln (σ AC) vs. 1000/T] for different weight fraction of CB nanoparticles as shown in Figure 10. The calculated values of E are illustrated in Figure 11. It is seen that the the value of E decreases with increase in the CB content, which is corresponding to the following relation
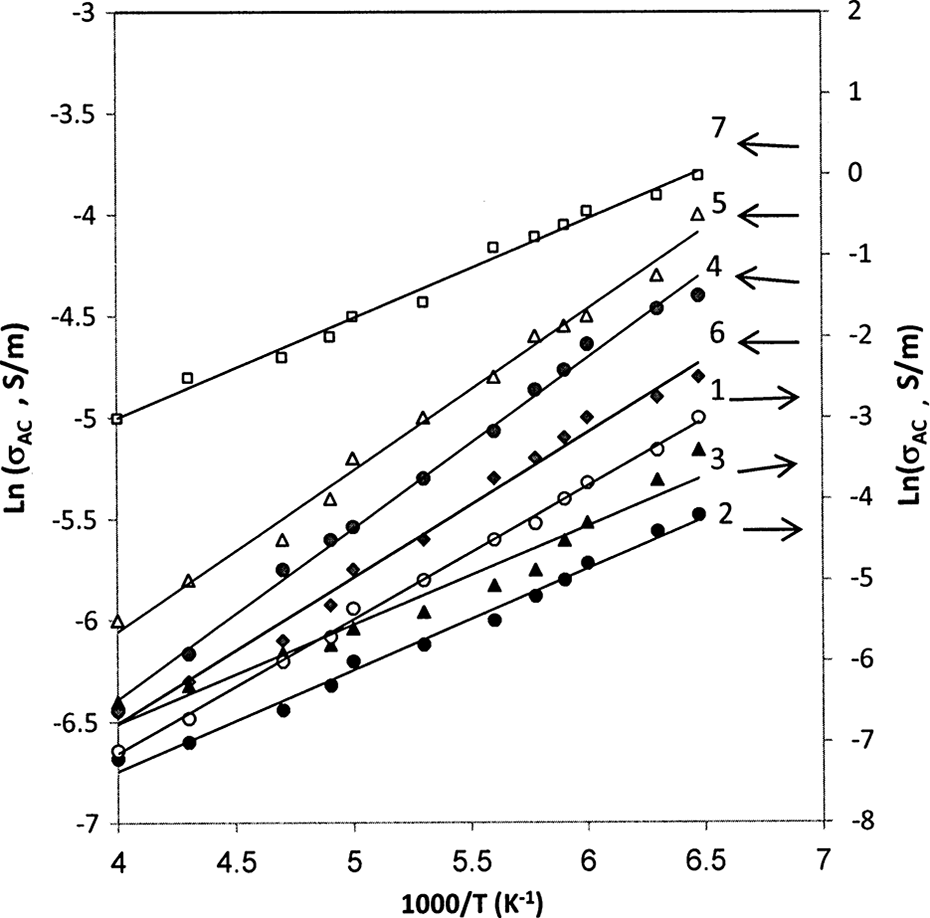
The natural logarithm of AC conductivity versus inverse temperature plots for (1) PC, (2) 1 wt%, (3) 3 wt%, (4) 5 wt%, (5) 7 wt%, (6) 10 wt%, and (7) 15 wt% of CB. AC: alternating current; CB: carbon black; PC: poly carbonate.
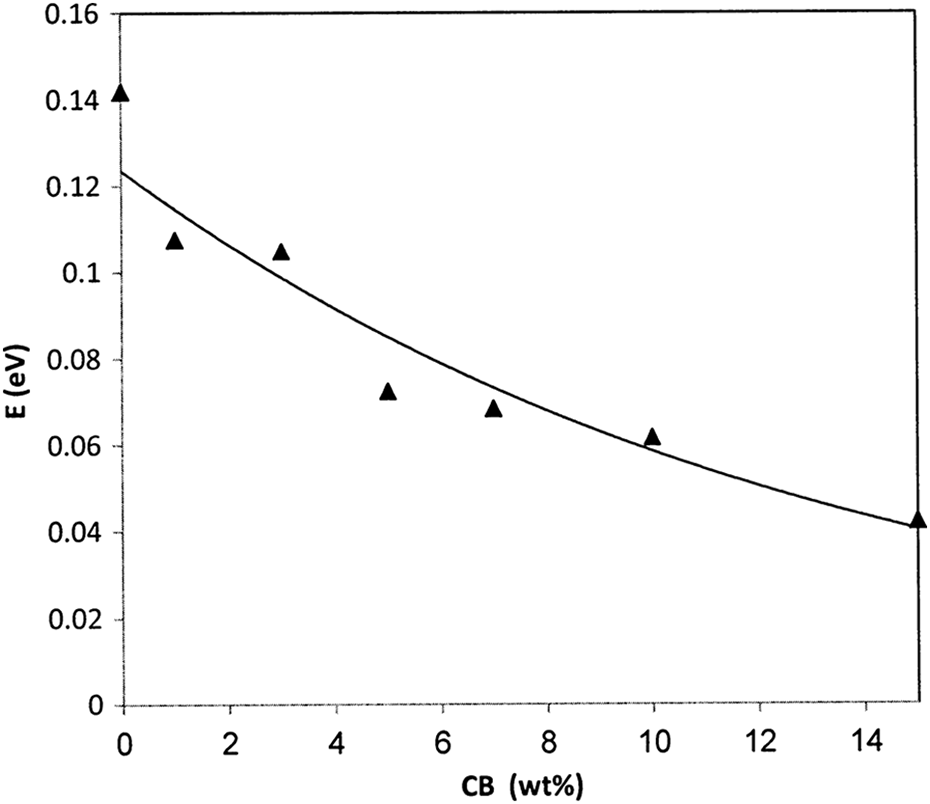
The dependence of activation energy on filling levels.

where W is the filling level. The increment in the CB nanoparticles enhances the localized states and hence E decreases with increasing filling levels.
Frequency and temperature dependence of Z
The variations in the impedance (Z) on the frequency for BAPC/CB composites are shown in Figure 12. It can be seen that Z value decreases as the frequency increases. At low frequency, the high relaxation transition is increased. As the frequency increases, the dipole relaxation will tend to decrease.
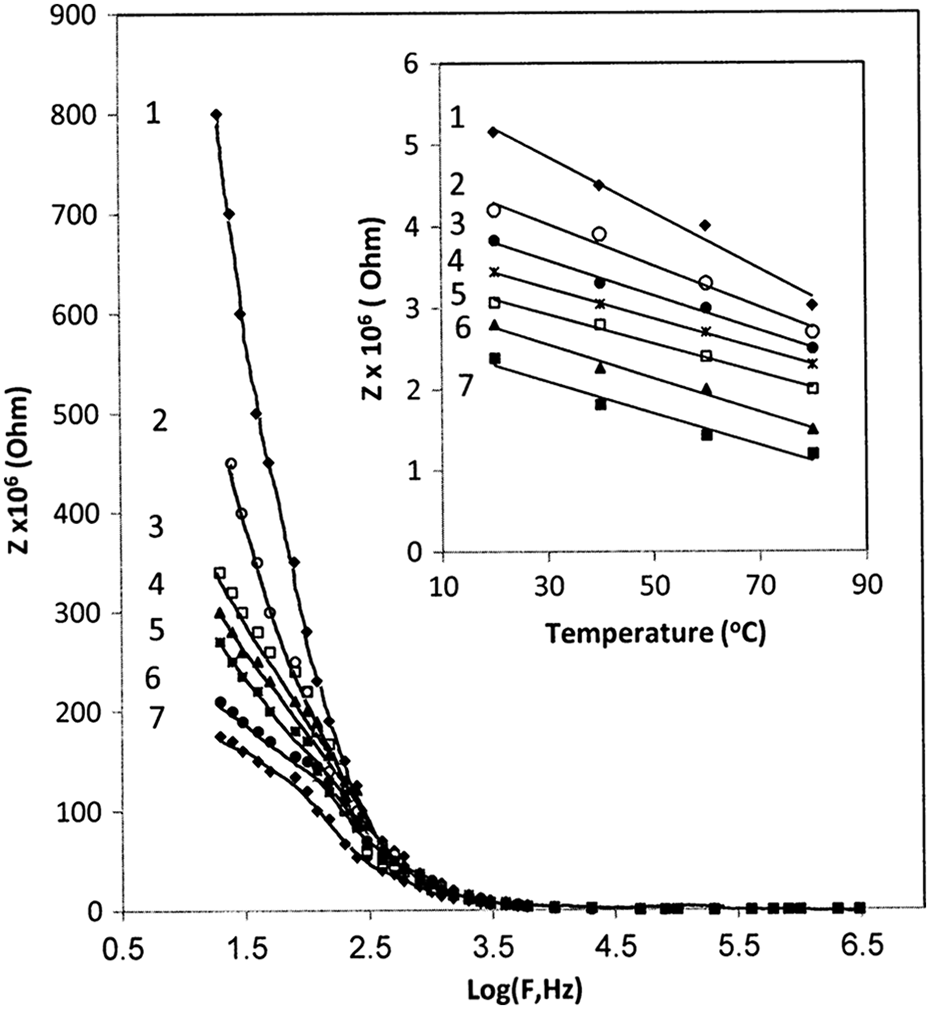
Variation in impedance versus frequency for (1) PC, (2) 1 wt%, (3) 3 wt%, (4) 5 wt%, (5) 7 wt%, (6) 10 wt%, and (7) 15 wt% of CB, inset figure shows the temperature dependence of impedance at frequency 10 kHz. PC: poly carbonate; CB: carbon black.
The dependence of Z on temperature for the BAPC/CB composites is shown in Figure 10. It can be seen that the Z decreases with increasing temperature. The decrease in Z of the composite proves that temperature enhances the electrical conduction process, which indicates that the material becomes more conductive. This behavior may be attributed to an increase in the contacts of carbon paths of the BAPC matrix. 33
Figure 13 shows the variation in Z with filling levels of CB in composites at different temperatures. It can be seen that the Z value decreases with increasing CB content. This may be related to possible increase in the number of conduction paths created between the CB particle aggregates in the composites in addition to decrease in the width of the potential barriers within the regions of high conductivity. Therefore, more charge carriers may be able to hop or tunnel resulting in the decrease in Z value.
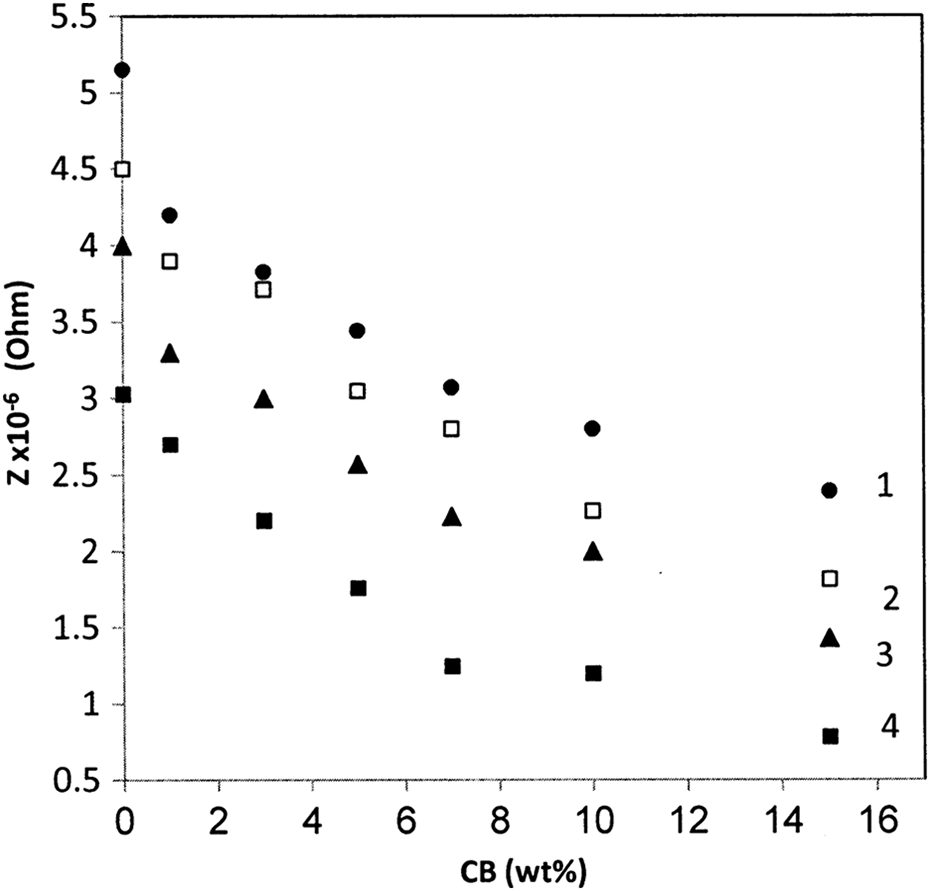
The filling level dependence of impedance at frequency 10 kHz for (1) 20°C, (2) 40°C, (3) 60°C, and (4) 80°C.
Frequency and temperature dependence of tangent loss
Figure 14 represents the dissipation factor (tan δ) of BAPC and composites on the frequency for different concentrations of CB nanoparticles. No significant peak can be observed in the measured frequency range. The value of tan δ of the prepared samples decreases with the increase in frequency, reaching a near constant at higher frequency, which may be ascribed to the restriction imposed on the dipole orientation in the BAPC system as the CB nanoparticles are introduced. 34 The tangent loss of composites is higher than in comparison with pure BAPC. This may be attributed to the interfacial charge polarization, dipole polarization, and conductivity of the composites. The higher tangent loss of CB composites is mainly due to the conductivity due to the high-loading level that the conductive nanofiller particles, which form a continuous network.
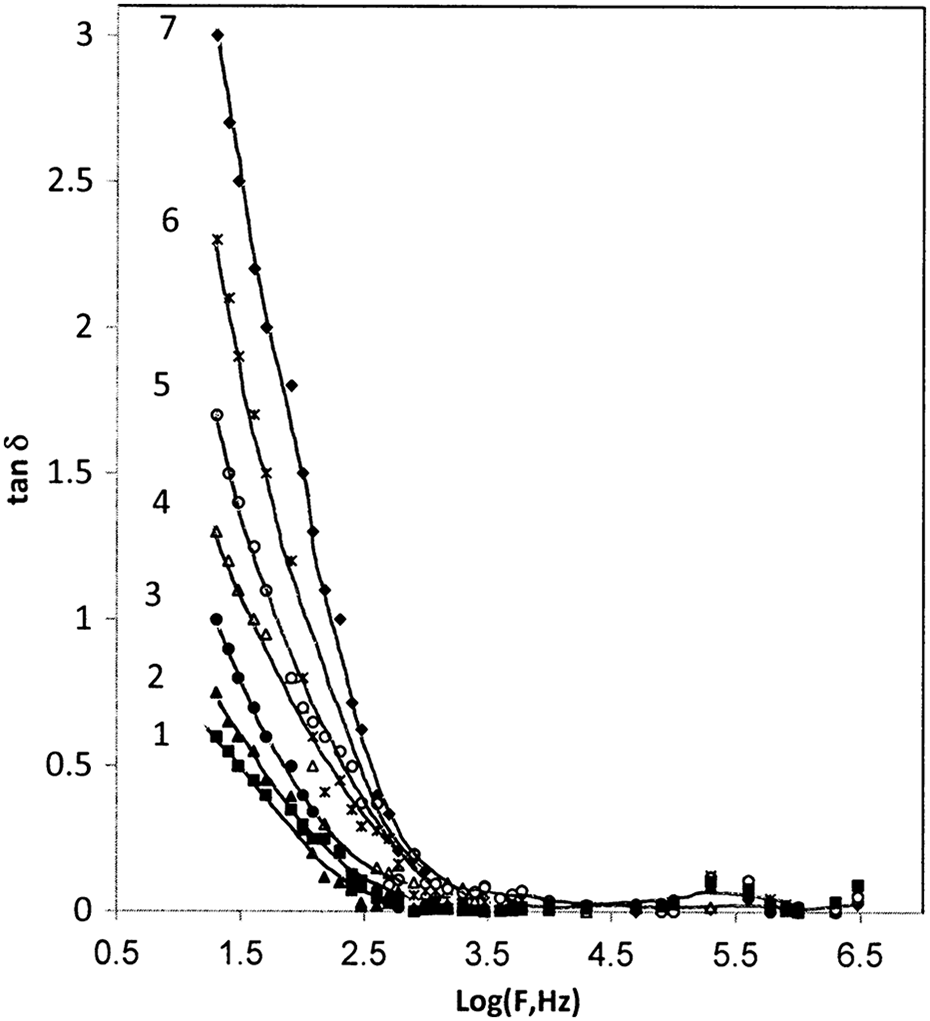
Frequency dependence of tan δ for (1) PC, (2) 1 wt%, (3) 3 wt%, (4) 5 wt%, (5) 7 wt%, (6) 10 wt%, and (7) 15 wt% of CB. tan δ: tangent loss; PC: poly carbonate; CB: carbon black.
Conclusion
A series of composite films from different concentrations of CB nano-particles-filled BAPC were prepared by casting methods. The composite films were characterized by XRD, DSC, TGA, and dielectric measurements to study the structure, thermal, and dielectric properties of the prepared films. The XRD pattern of BAPC shows semicrystalline nature of the prepared sample. The DSC measurements show a continuous decrease in the T g of BAPC as the amount of nanoparticles increases implying that CB is acting like a plasticizer for BAPC. Although the CB nanoparticles decrease the thermal stability of BAPC, the nanocomposites will have relatively high thermal stability with the T d above 400°C for weight loss <5%. These performances are still in need in many applications of high ε′ materials. The dielectric measurements show that the ε′ and σ AC increase with CB content and also with temperature. However, the ε′ and tan δ decrease with frequency. The increase in ε′ with temperature is due to the formation of new dipoles or accumulation of charge carriers in a nanoparticles–polymer interface.
Footnotes
Funding
This research received no specific grant from any funding agency in the public, commercial, or not-for-profit sectors.