
Abstract
The present work is to predict the fracture behaviour of biocomposites from the tensile properties of its components. In this work, a direct numerical simulation was realized for fracture behaviour of random short spruce fibre-reinforced composites. For calculations, wood fibres were considered as linear elastic bodies and polypropylene matrix as an elastic–plastic material. Then, the numerical results were compared with the experimental results obtained by digital image correlation (DIC). This comparison indicates that random fibre finite element (FE) model can be able to fairly reflect the influence of random fibre microstructure on the fracture behaviour of the composites. The calculation and comparison show that in a region in the front of the crack tip, the average values of J-integral of both random fibre and homogeneous FE model are in good agreement with that of DIC experiment under the same extension load.
Keywords
Introduction
The random spruce short fibre-reinforced polypropylene (PP) composite is a kind of biocomposites with the advantage of lightweight and high fracture toughness. This biocomposite is gradually used as the preferred material in the design of inner components or trim panels in vehicles such as automobile and bullet train, which have high updated rate of the components. Furthermore, this biocomposite is fully recyclable and environmentally friendly. With people’s increased awareness of environment protection and the reusing of natural resources, the research of the biocomposite materials are attracting more and more attention. 1
PP is used for a large number of applications because it is cheap, lightweight, easily recyclable and modifiable to achieve specific requirements. 1,2 In order to be able to meet the high demands on stiffness and strength, PP often must be reinforced. A variety of natural fibres are available for reinforcement in PP, for example, flax, hemp, sisal and bamboo. 3 In an earlier study, spruce fibres (sawdust) have been incorporated successfully into PP with different fibre weight fractions in order to produce the spruce fibre/PP composite. 4
However, in spite of the superior properties, the use of composite materials is still limited. One of the main reasons is the difficulty in reliable prediction of the mechanical behaviour of composite materials. Numerous studies about the measurement of the mechanical behaviours of the composites have been published. 5,6 However, in contrast to the fracture behaviour of metallic components as represented by plasticity phenomena, the understanding of the corresponding behaviour in short spruce fibre/PP composites is virtually nonexistent. The failure and fracture mechanism of these polymeric structures are correspondingly poorly understood.
The fracture mechanism of PP under static loading condition has been studied by 3- and 4-point bending tests, 7 and the complexity of the crack tip damage zone is shown by means of scanning electron microscope and optical microscope analysis. The non-local characteristics of short glass fibre-reinforced PP are studied by a mixed numerical–experimental approach of the gradient-enhanced damage model and the digital image correlation (DIC) experiments. 8 The fracture behaviour of a short fibre composite biomaterial is predicted from its tensile properties using nonlinear finite element (FE) method and fracture test. 9
The traditional optical measurements, 10 such as photoelasticity, moire, holography, speckle interferometry, shearography and so on, which need to pretreat the surface of object with spraying paint, coating and reproducing grid, and even more to make model test, may give full-field information of object deformation from the interferometric fringe. However, such techniques suffer from characteristic limitations and are commonly performed in the laboratory. The DIC method (DICM) is based on the correlation of grey values of successive digital images of the undeformed and the deformed specimen. 11,12 It can directly measure the deformations by tracking the grey value pattern in small local neighbourhoods commonly referred to as subsets.
A technique of measuring the whole-field of strain components on the object surface is established in Laboratoire de Mécanique et de Physique des Matériaux (LMPM) by means of combining DICM with the ABAQUS FE code. 13 DICM was realized using an in-house developed program software GRANU.EXE to directly measure the displacements on the object surface. Then, the strain field is obtained using FE software to calculate the spatial derivative of the displacement field. Each measurement point becomes a node of the FE mesh, and the measured displacement vectors are imposed as boundary conditions.
Using DICM, Lam 14 and Touchard and colleagues 15 have studied the fracture and tensile behaviours of short spruce fibre/PP composite. For compact tension (CT) specimen of the composite, the value of J-integral and the stress field are obtained using their DICM with a suitable material law. The experimental results of the composite show the influence of the microstructure of fibres in the material on its fracture behaviour. The detailed experimental process can be referred to the research in the references 4,14,15
For the design and application of this natural spruce fibre-reinforced PP polymer composite, it is still a new and important subject to study the influence of the natural fibre microstructure on fracture and tensile behaviours of this material.
In this work, a direct numerical simulation is used to study the influence of the random spruce fibre microstructure on fracture behaviour and parameters of the spruce fibre/PP biocomposite. The numerical results will be compared with the DIC experimental results. These comparisons between experimental and numerical results for the biocomposite will help to understand the results and phenomenon of DIC experiments in detail; to improve the numerical models in order to be closer to the experimental phenomenon and to increase the knowledge about the fracture behaviour of this biocomposite.
Used materials and specimen
The studied materials are PP and spruce fibres coming from wood industrial wastes, with length and diameter about 800 μm and 350 μm, respectively, provided by the manufacturers. The used PP is the APPRYL 3400 MA1 supplied by ATOFINA in France. The proportion of fibre weight is 30%. The tensile properties of pure PP and spruce fibre are given in Table 1. 15 Tensile specimens were cut out from 4-mm-thick panels. CT specimens for fracture tests were cut out from 8-mm-thick panels. The initial length of the pre-crack was about 400 μm depending on the specimen as shown in Figure 1. The detailed fracture experiment method and process of the short spruce fibre-reinforced PP can be found in the research of the references. 4,14,15
Tensile properties of materials at 10 mm/min. 15
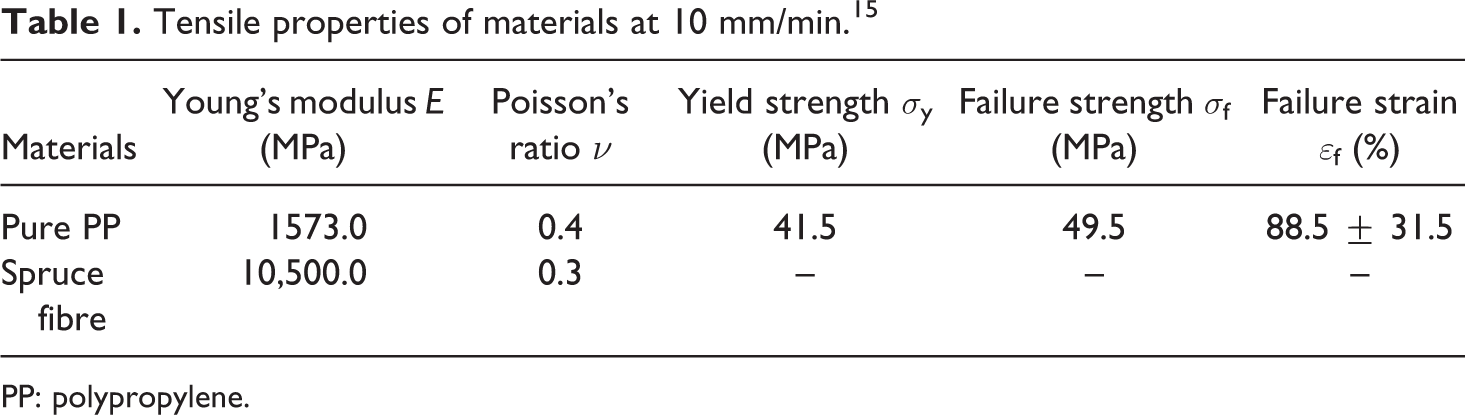
PP: polypropylene.
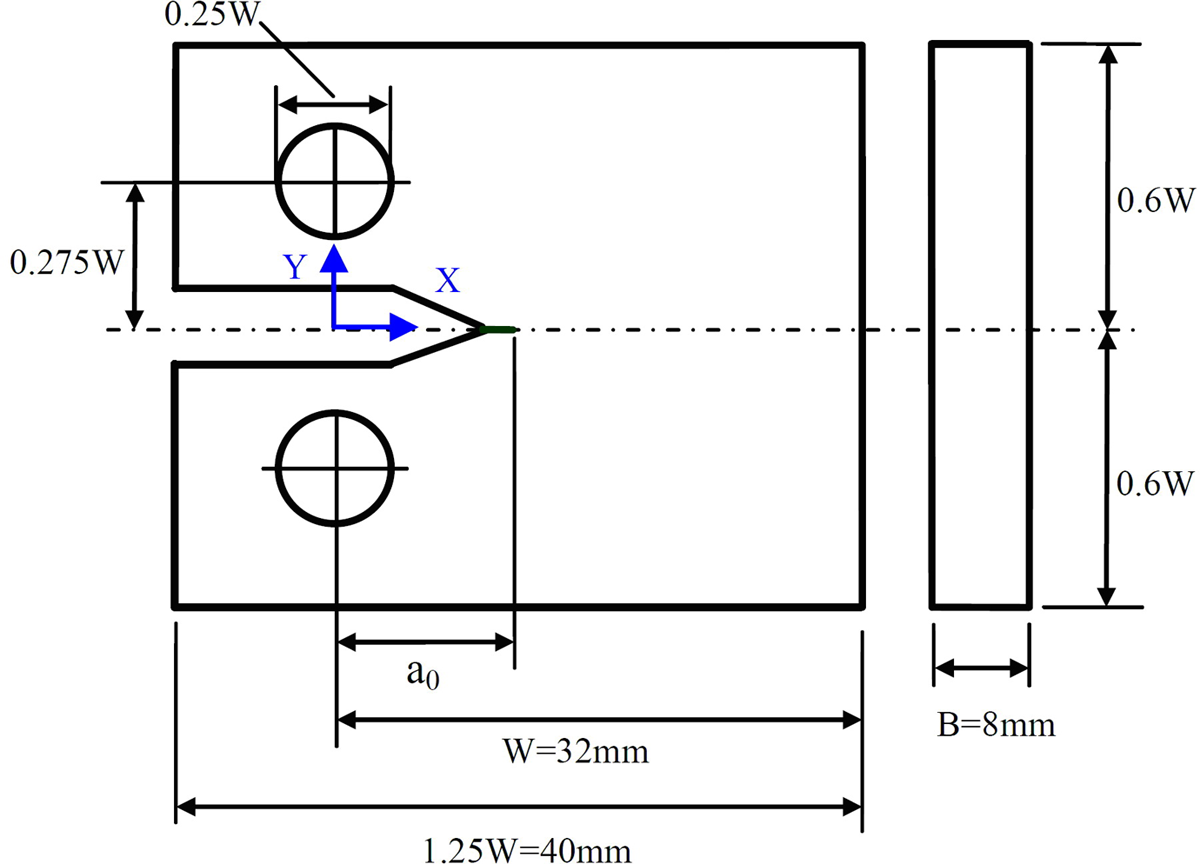
Compact tension specimen configurations (a 0 = 14.5 mm, as in the document E399). 5
Numerical simulation of fracture and tensile behaviour
Two methods of creating FE model with fibres
Assumptions adopted for numerical computations: (1) Spruce short fibre material is elastic and PP matrix is an elastic–plastic material. There is a perfect bond between them at the fibre extremities; (2) There is no stress (or strain) field interaction between spruce short fibres; (3) Each fibre segment is embedded in a homogeneous matrix PP medium. Tensile and compressive deformations of the fibres are considered.
There are two methods to define the content of fibre volume in FE model with fibre elements.
Method 1: The volume of calculation model is a real volume of the composite tensile specimen as shown in Figure 2(a). Two methods of creating finite element model with fibres: (a) Method 1; (b) Method 2.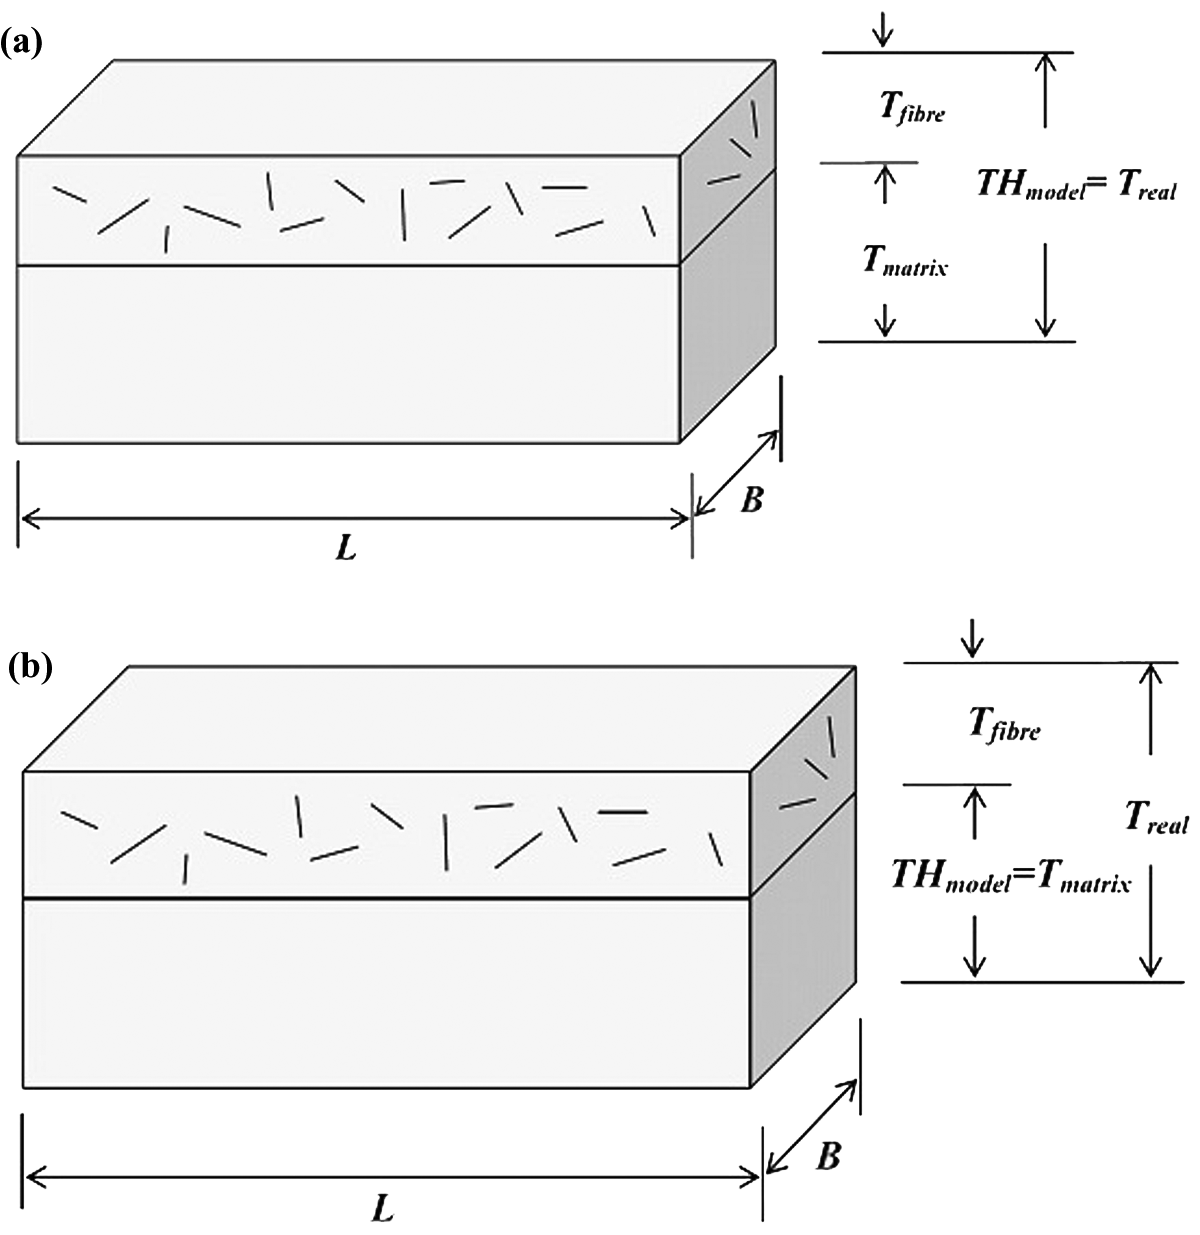

The content of fibres in the specimen will be calculated using the following equation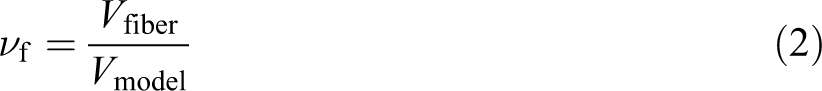
With the total reaction force, R, the normal stress is calculated using the following equation
Method 2: The volume of matrix in the model is the volume of calculation model as shown in Figure 2(b).
So, real volume of the composite tensile specimen is the sum of volume of matrix and fibres.
The content of fibres is defined by the following equation
The volume of fibres is calculated using the following equation
The thickness of real specimen model simulated is given by the following equation
Therefore, the normal stress equals
When the FE model has same total number of nodes, then method 1 can provide with a higher value of the fibre volume content than method 2. In the present work, method 1 is used for the simulation.
Random fibre elements generation program
The spruce fibre composite material contains a fairly large amount of spruce fibres, which have random positions and orientations in the plane of the material. The preprocessor code of ABAQUS cannot generate directly these random fibre elements (truss elements) and their nodes. The random fibre elements generation program (RFEGP), a special preprocessed program in FORTRAN code, is developed in our work in order to create random fibre elements, as shown in Appendix I. The code can generate fibre truss elements with different lengths, diameters and orientations in random positions according to the given fraction of fibres.
FE models with random fibre elements
The spruce fibre is simulated by the 2-D linear truss element with 2-node (designated as T2D2 in ABAQUS), and PP matrix is simulated by the plane stress element with 8-node biquadratic and reduced integration (CPS8R), respectively. The content of fibre in these FE models can be controlled by the number, length and diameter of fibre elements using the above RFEGP FORTRAN code to create tensile and CT models.
For tensile specimen, the size and geometry of FE model with random spruce fibres (49.0% in volume) are given in Figure 3(a) in the present analysis. The boundary conditions are as follows: The finite element models of the composite: (a) tensile specimen (thickness 2 mm); (b) compact tension specimen.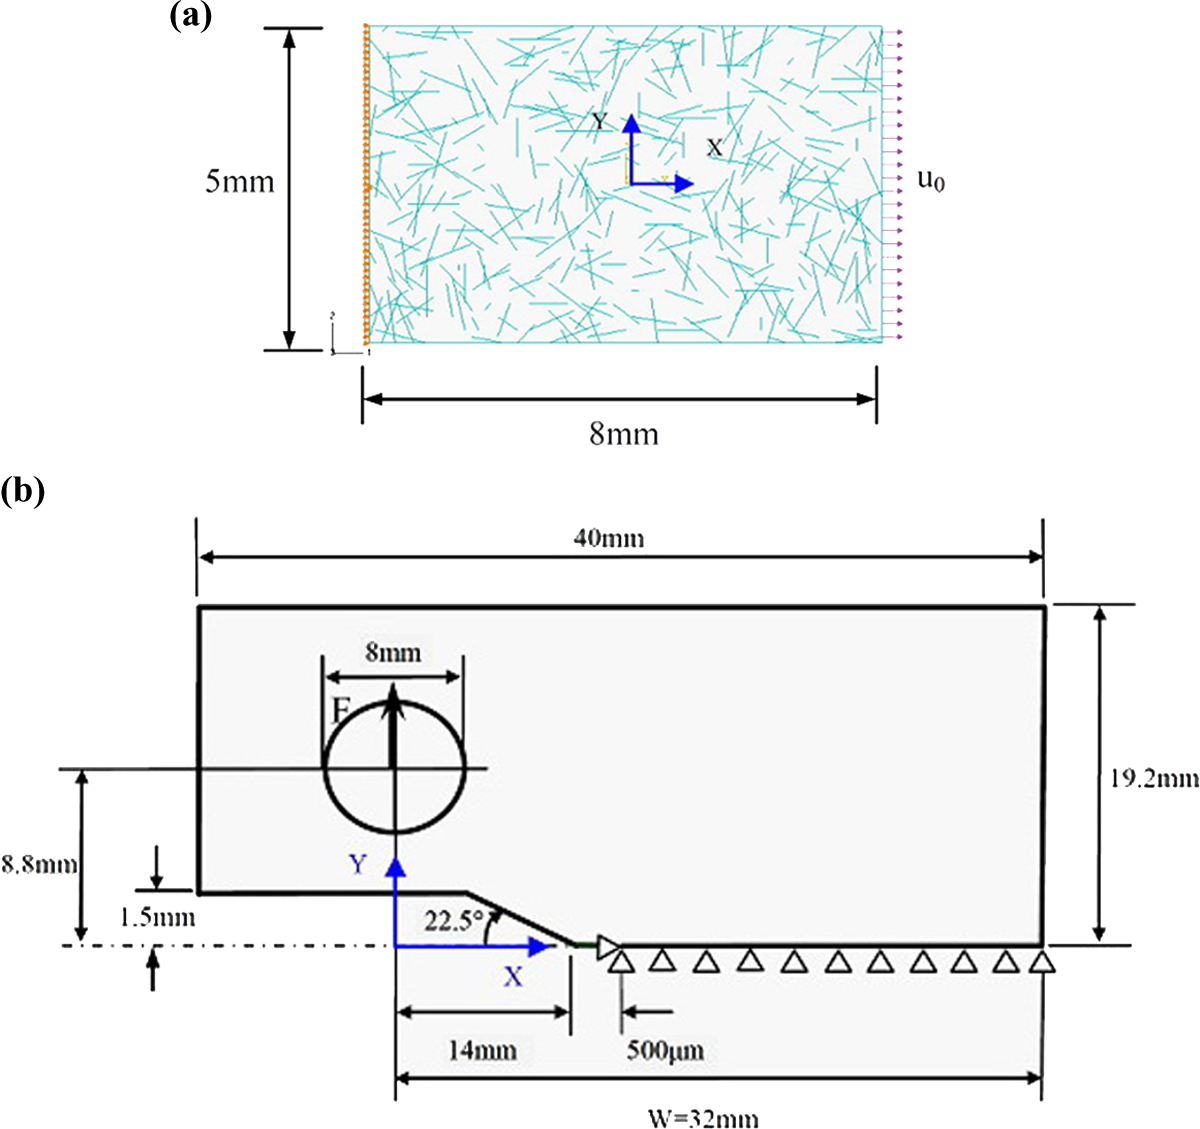
In fracture problem, crack tips cause stress concentrations. Stress and strain gradients are large as a crack tip is approached. The FE mesh must be refined in the vicinity of the crack tip to get accurate stresses and strains. For mesh convergence in a small strain analysis, the singularity at the crack tip must be considered.
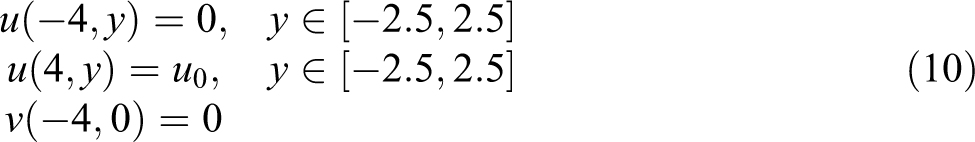
For CT specimen of the composite materials, the size and geometry of FE model are as shown in Figure 3(b). Their symmetry was considered and only half model was created. When it is loaded with a force F in the y-axis, the boundary conditions are as follows: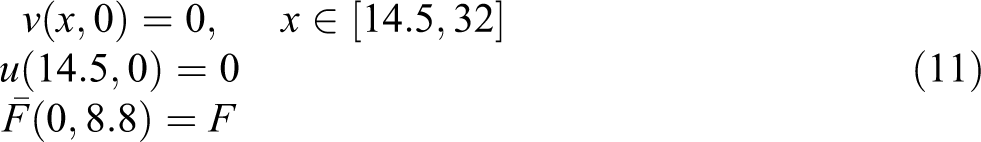
When modelling the crack-tip singularity in two dimensions, the collapsed method at the crack tip is used for 8-node biquadratic reduced integration continuum plane stress element, namely CPS8R, in order to consider the strain singularity at the crack tip of the plastic material.
The characterization of global elastic–plastic fracture behaviour
The crack opening displacement (COD) approach was introduced by Wells in 1962. 16 This approach focuses on the strains in the crack-tip region instead of the stresses. In the presence of plasticity, a crack tip will blunt when it is loaded in tension. Wells proposed to use the crack flank displacement at the tip of a blunting crack, that is, the so-called crack-tip opening displacement (CTOD) as a fracture parameter.
To characterize crack instability and crack growth in materials, which deform in an elastic–plastic manner, Rice 17 introduced the J-integral method. ABAQUS/Standard 18 provides a numerical procedure for the evaluation of J-integral, based on the virtual crack extension/domain integral methods. 19,20 The method is particularly attractive because it is simple to use, adds little to the cost of the analysis and provides excellent accuracy, even with rather coarse meshes.
This integral is theoretically path independent. To evaluate a series of J-contour integrals, ABAQUS defines the domain in terms of rings of elements surrounding the crack tip. Different ‘contours’ (domains) are created. The first contour consists of those elements directly connected to crack-tip nodes. The next A (15,0) contour consists of the ring of elements that share nodes with the elements in the first contour as well as the elements in the first contour as shown in Figure 4. Each subsequent contour is defined by adding the next ring of elements that share nodes with the elements in the previous contour. Therefore, provided that the user has defined the nodes of the crack front, the software automatically finds the contours in order to carry out the energetic analysis.
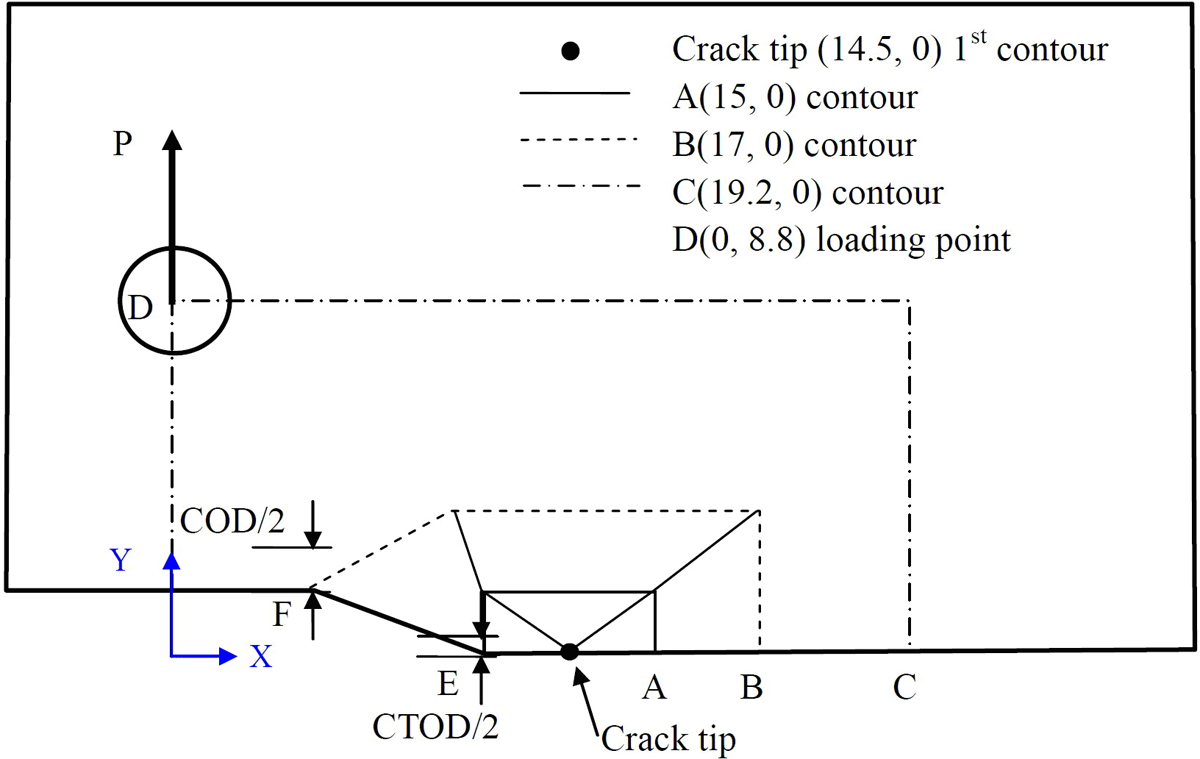
Various contours for the calculation of the J-integral and the points measured COD and CTOD for CT specimen. COD: crack opening displacement; COTD: crack-tip opening displacement; CT: compact tension.
For CT specimen of this simulation work, the values of J-integral of the calculation will be given in terms of the positions of their contours. The positions of several interesting contours are shown in Figure 4, the points used for measuring COD and CTOD are also given.
Wood fibre elements with random and uniform distribution in the FE model of CT specimen are created using our RFEGP code, as long as the FE model has enough nodes and its meshing is uniform with even homogeneity. The fibre volume content is important in this simulation, especially in the region near the crack tip. Therefore, we can check the minimum and maximum values of fibre volume content in both two contour regions A and B to encircle the crack tip (Figure 4) and whole model. The area of contour region A is 1.0 × 0.5 mm2 and of region B is 6.36 × 2.5 mm2. Because the most integration lines of J-integral are in the region A, the fibre volume content of region A is insured to be the real content (49%) of the composite material, which were tested in the present work.
The influence of the fibre content on the fracture behaviour of the composite
Direct numerical simulations of fracture behaviour for random short spruce fibre-reinforced composites are carried out. In Figure 5(a), the top line is J-integral of pure PP CT specimen at an applied load of 246 N. The middle curve is the J value of composite CT specimen, which has 0.5 mm of the fibre diameter, the fibre contents in volume 26.3% of whole model and 23% in region B. The bottom curve is the J of the specimen with 0.5 mm diameter, 40% content in volume for whole model and 49% in region B. The results of the calculation show that the value of J-integral decreases with increasing fibre content. The contour of strain ∊ yy near the crack tip for these three models with 96 meshes are given at 246 N loading in Figure 5(b). It shows the influence of the microstructure with different contents of fibres on strain distribution near the crack tip.
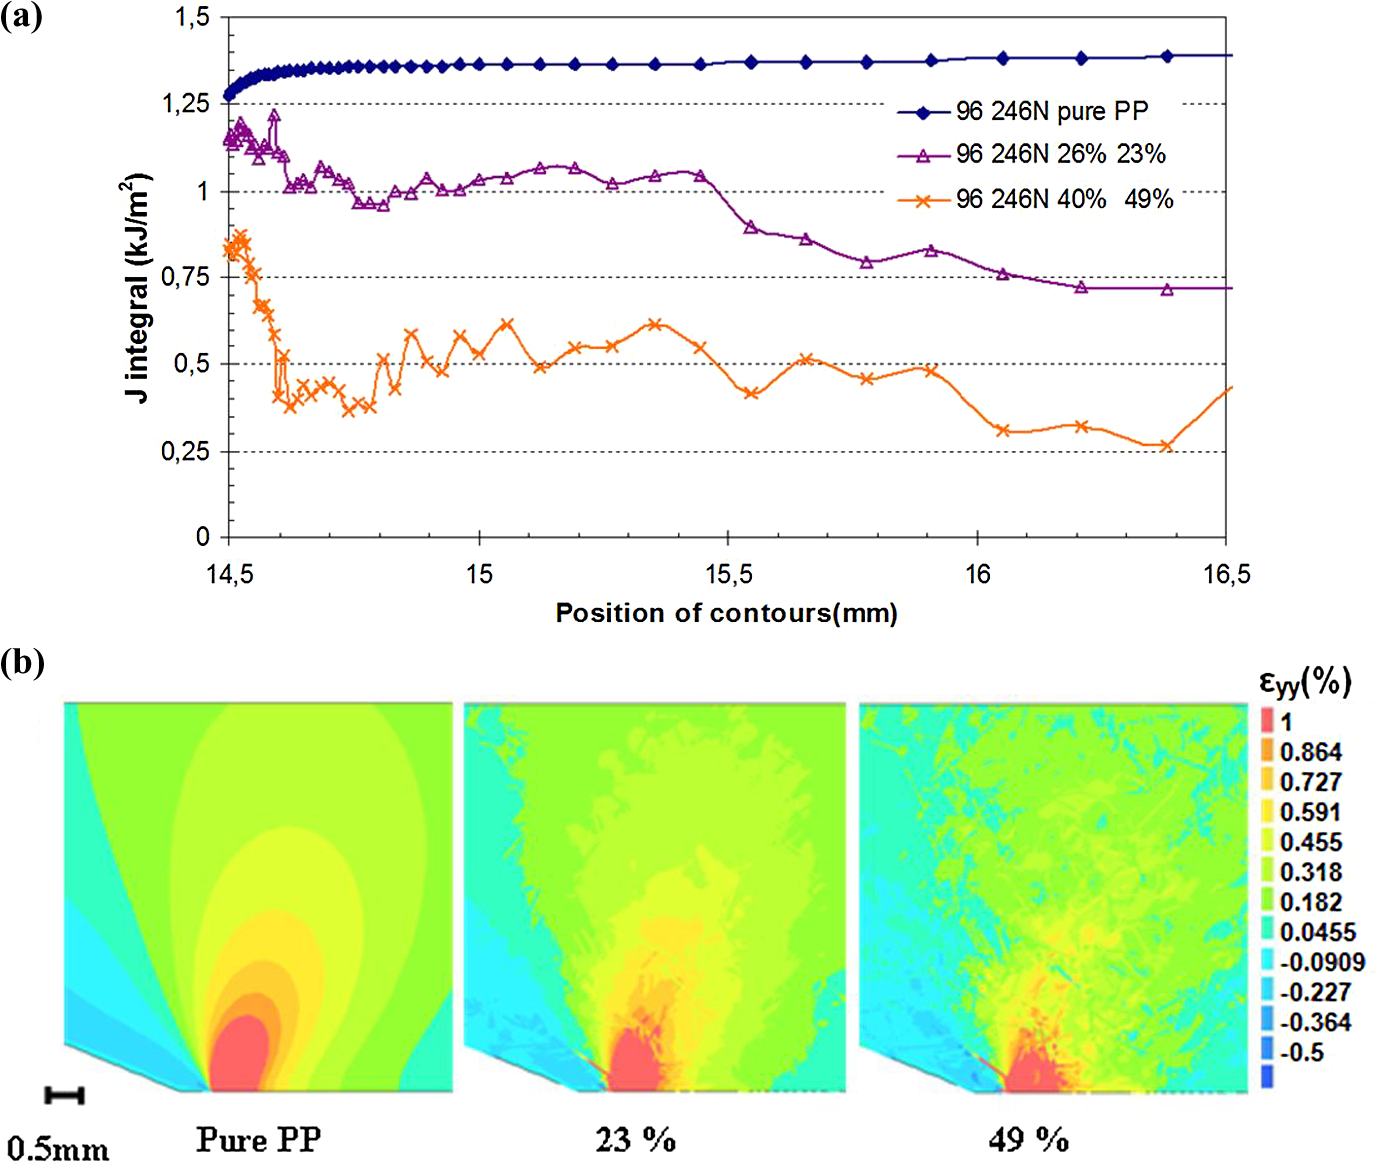
The influence of the fibre content on the fracture behaviour of the composite at applied load 246 N for different fibre contents 0.0, 23 and 49% in volume. (a) The value of J-integral; (b) the distribution of strain ∊ yy near the crack tip.
Comparisons with DICM experiments
Tension behaviour of spruce fibre/PP composites
The influence of the fibre content on the tensile behaviour is considered using the FE model with random fibre elements. In Figure 6(a), the solid lines are experimental stress–strain curves for spruce fibre-reinforced PP materials at a constant cross head displacement rate of 20 mm/min at room temperature; the fine dotted lines are numerical prediction of the composite FE model when the fibre diameter is 0.6 mm. For each fibre volume contents, the comparison of numerical and experimental tensile curves is given in Figure 6(a). These comparisons show that the numerical tensile curve with lower fibre volume content, that is, 2%, 10% and 20%, is closer to experimental one than that with higher fibre volume content, such as 49% and 60%.
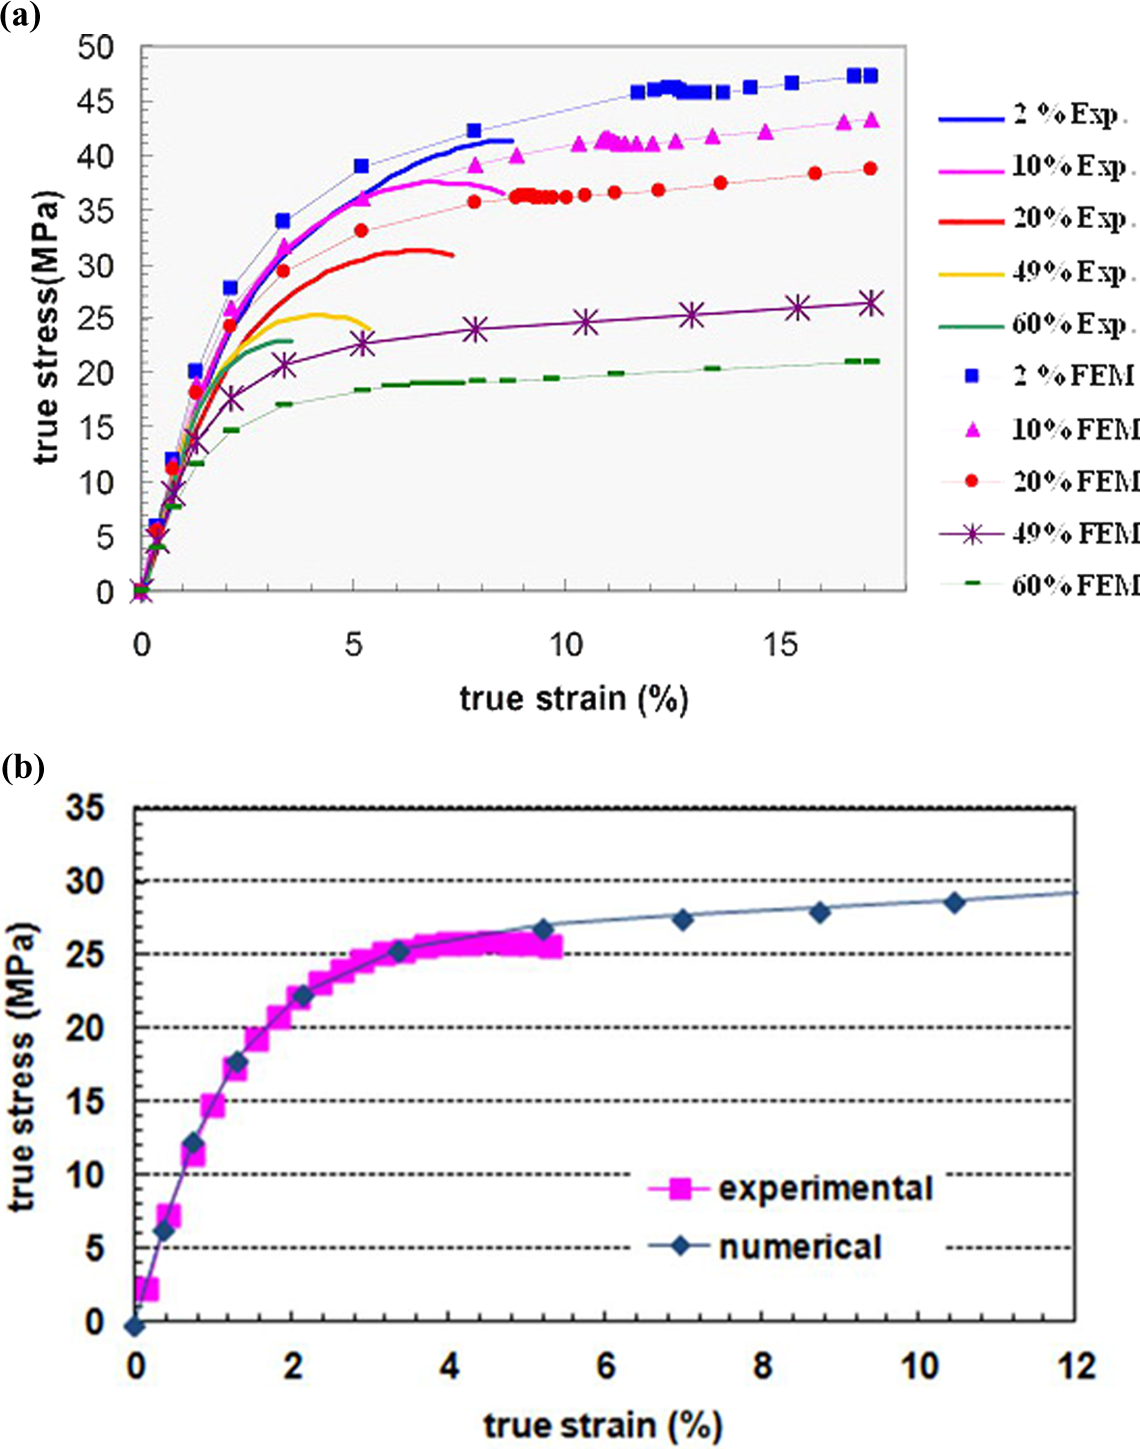
Experimental and numerical tensile true stress versus strain curves: (a) for different fibre volume contents; (b) for49% fibre in volume.
When fibre diameter is 0.35 mm and matrix Young’s modulus is 1573.0 MPa at a loading rate of 20 mm/min, the numerical true stress–strain curve is in agreement with the experimental one for the content of fibre volume 49% as shown in Figure 6(b). In the next section, this numerical stress–strain curve predicted by random fibre FE model is directly used in the homogeneous FE model of the spruce fibre/PP composite in order to simulate its fracture behaviour.
To sum up, using the present random fibre FE model, the tensile simulation shows that the volume content and the diameter of fibre have effects on the numerical prediction of the tensile behaviour of this short fibre composite. The tensile numerical stress–strain curve, which is close to the experimental curve, can be predicated using suitable fibre diameter in the random fibre FE model.
Analysis and comparisons of fracture behaviour for 49% spruce fibre/PP
Methods for comparing the numerical simulations with the DIC experiments are given in this section. The strain field of CT composite specimens is obtained from the experimental displacement fields by combining the DICM with ABAQUS code. Then, the stress fields and the value of J-integral are obtained farther by means of using the experimental stress–strain curve of the biocomposite in ABAQUS code. Using this method, all the experimental parameters about the fracture behaviour of the composite, including the stresses, strains, J-integral, COD and CTOD, are measured directly and indirectly. The results of this way are given by open triangle solid lines shown in Figures 7, 8, 10 and 11.
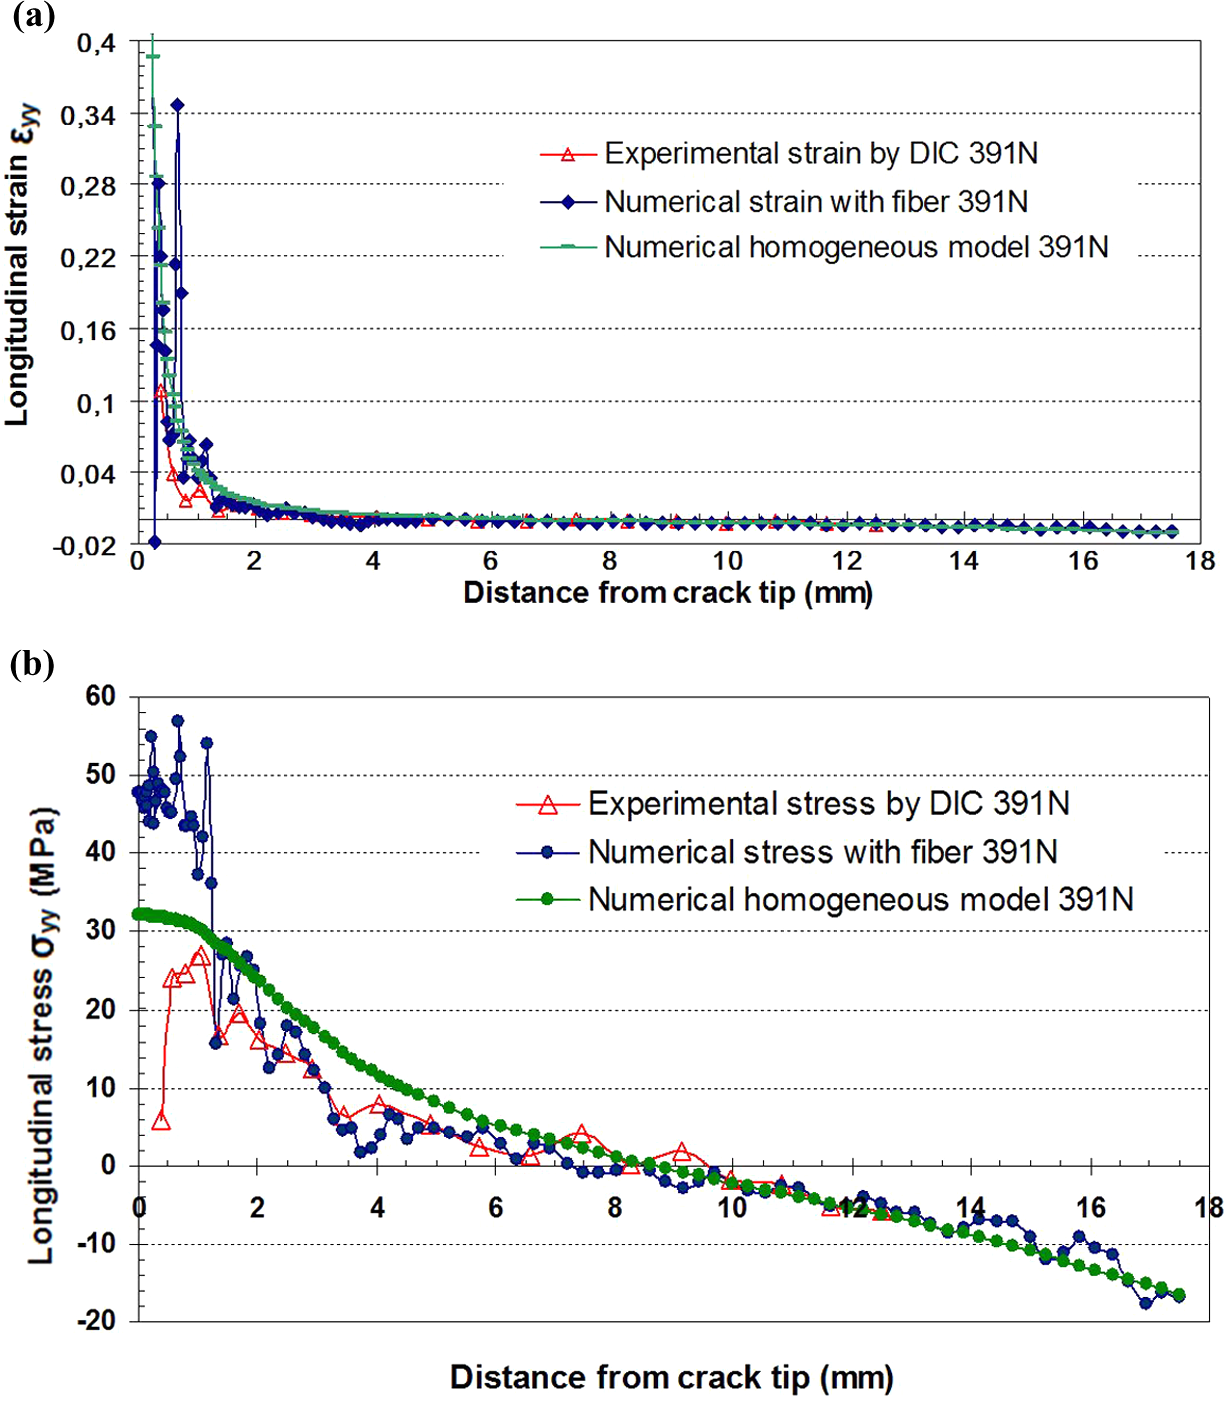
The ∊ yy and σ yy in net section at load 391 N for composite with 49% fibre in volume using digital image correlation in experimental and numerical random and homogeneous models: (a) ∊ yy; (b) σ yy.
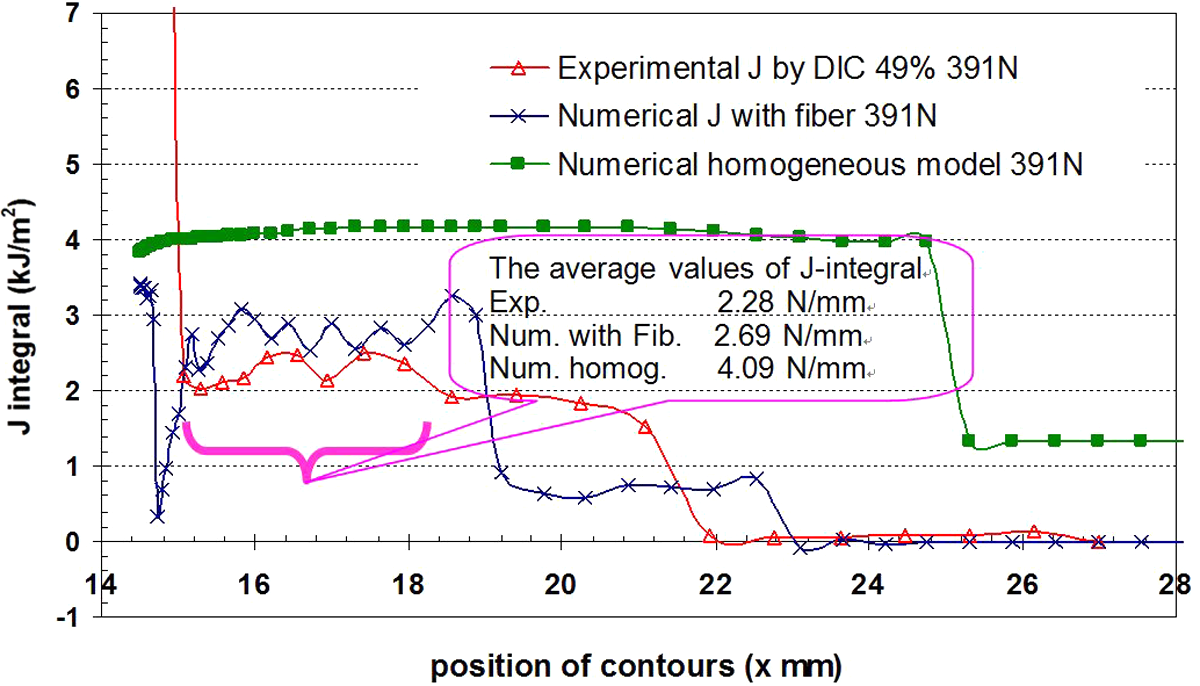
J-integral at load 391 N for composite with 49% fibre in volume using digital image correlation in experimental, numerical random and homogeneous models.
The random elements of spruce fibres are generated using the FORTRAN preprocessed program, which is developed in present work. The FE model of spruce fibre/PP composite with random fibres is created. The fracture behaviour and tensile behaviour of the biocomposite are directly simulated using this FE model. The numerical stresses, strains, J-integral, COD and CTOD are calculated by the random fibre FE model. The results of this second way are shown by solid circle or cross lines in Figures 7, 8, 10 and 11.
The third way is the simulation of homogeneous FE model; its results are shown by solid square lines in Figures 7, 8, 10 and 11. The numerical stress–strain curve predicted by random fibre FE model is directly used in the homogeneous FE model of the spruce fibre/PP composite in order to simulate its fracture behaviour, as discussed in the above section.
Figure 7(a) and (b) show the longitudinal strain ∊ yy and stress σyy following the y-coordinate near the crack tip in net section at load 391 N, respectively, for composite with 49% fibre in volume using DIC experimental and numerical random and homogeneous model. From the comparison, it is clear that the fluctuations appeared in the distributions of strain ∊ yy and stress σ yy of random fibre model, which reflect the influence of the microstructure of spruce fibre on the stress and strain in the composite. The anisotropy and random distribution of spruce fibres in the mesoscopic scale would result in the local inhomogeneity and anisotropy of the composite in the mesoscale, which further lead to local inhomogeneity in mesoscopic stress and strain, while the values of strain and stress in homogeneous model are the average results in macroscopic scale. Thus, the results of the random model can be able to fairly reflect the local inhomogeneity and the influence of random fibre microstructure in the composite.
The J-integral for composite with 49% fibre in volume are given at 391 N as shown in Figure 8 using DIC experimental and numerical random fibre and homogeneous models. The plots of J-integral versus the position of J-contours show that both the varieties of numerical J-curves are similar to one of the experimental J values. The values of J-integral of the random fibre model and experiment fluctuate near an average value in the region from 15.2 to 18.27 mm of the J-contour positions (in the front of crack tip). The value of J-integral in this region is the preferred value for the present work, and it is important to control the fracture behaviour of the composite. At same applied load, there are different results of J-integral between experiment and both numerical random and homogeneous models. At the load 391 N, the average J value of random fibre model is 2.69 kJ/m2 and the experimental one is 2.28 kJ/m2; they are closer than the homogeneous model, which is 4.09 kJ/m2.
The curves of applied load versus extension of experiment and both numerical models are given in Figure 9 for the composite with 49% fibre in volume using DIC experimental and numerical random and homogeneous models. The results show that experimental and both numerical random and homogeneous models have different extensions at same applied loads, which are higher than 100 N.
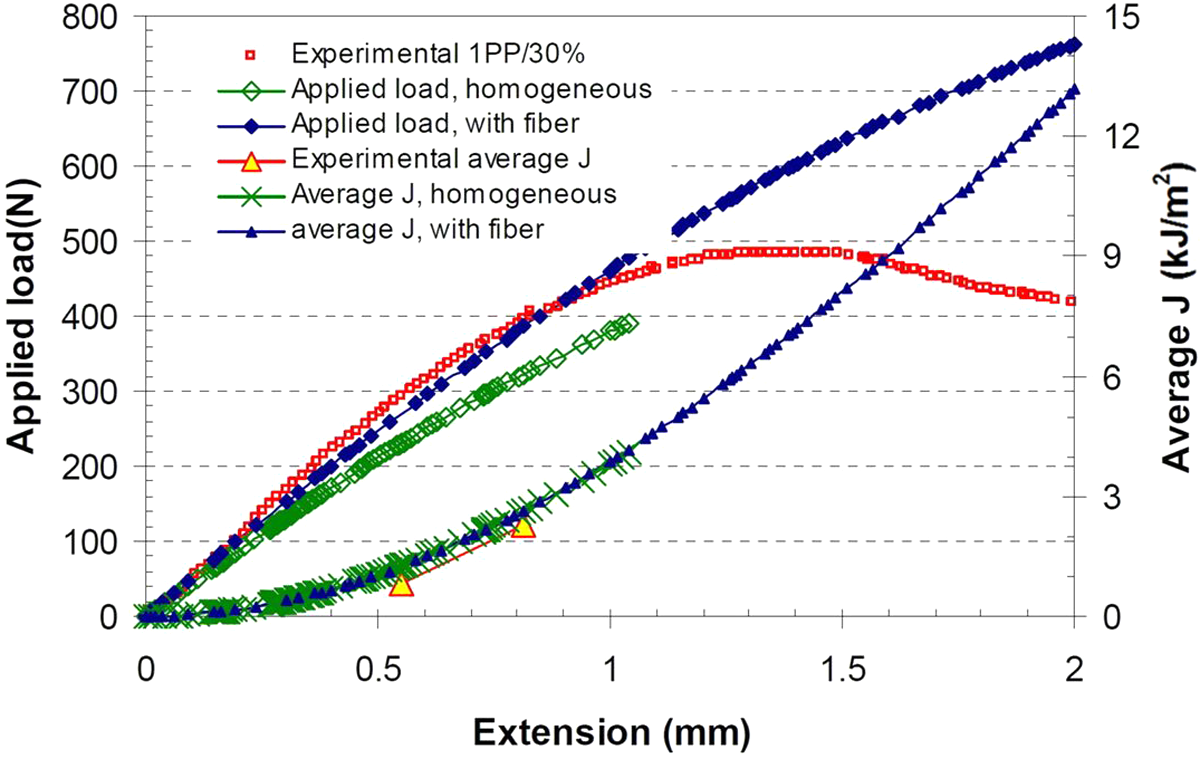
Average J value and applied load versus extension for composite with 49% fibre in volume.
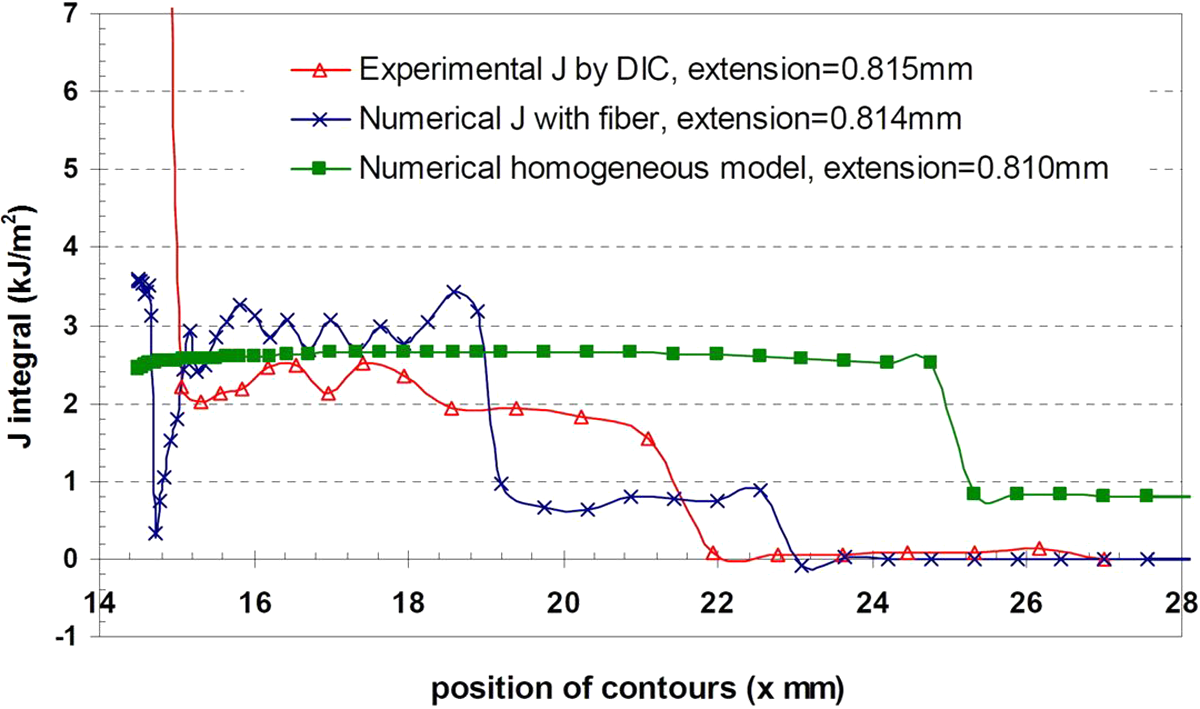
J-integral at 0.81 mm extension for composite with 49% fibre in volume using digital image correlation in experimental and numerical random and homogeneous models.
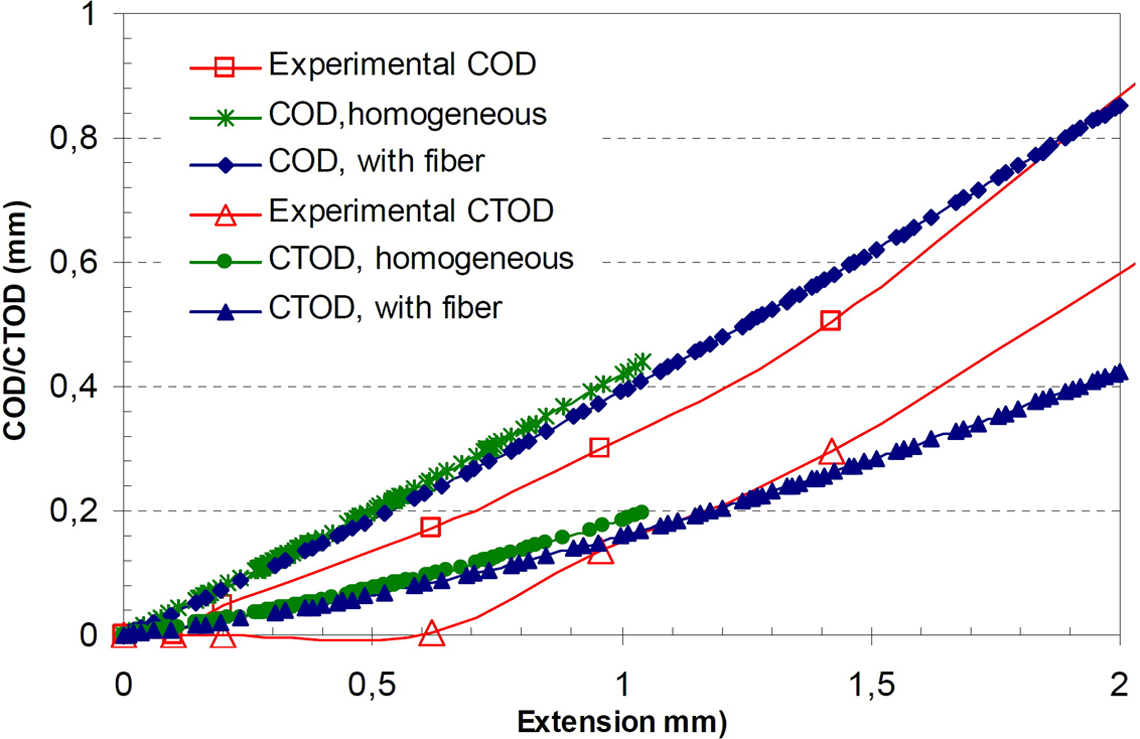
COD and CTOD versus extension for composite with 49% fibre in volume. COD: crack opening displacement; CTOD: crack-tip opening displacement.
Figure 9 gives the curves of extension versus the average J value in the above region of the contour position for experiment and both numerical models. It shows that the curves of extension versus the average J value for different FE model and experiment are almost same, and both numerical average J values are in agreement with the experimental value at the same extension load. If the curves of applied load and average J value versus extension are plotted in the same Figure 9, it is not difficult to explain the difference of average J values between experiment and both numerical random and homogeneous models at the same applied load.
According to the above analysis or from Figure 9, it can be concluded that if the comparison of the average J value between experiment and both numerical models is carried out from the point of view of the extension load, their values or curves will be closer at same extension load than at same applied load. Figure 10 gives the results of comparison between the experiments and both numerical models at 0.81 mm extension load with an applied load of 391 N, the average value of J-integral obtained from the experiment is 2.26 kJ/m2, from numerical random model is 2.87 kJ/m2 and from the numerical homogeneous model is 2.62 kJ/m2. From the view of the extension load, the results of experiment and both random and homogeneous models can be understood deeply.
The curves of COD and CTOD versus extension for composite with 49% fibre in volume are shown in Figure 11 using DIC experiment and numerical random and homogeneous models. The results show that both numerical curves of COD and CTOD are consistent varieties with the experimental curves at the beginning. But the prediction of CTOD from both models has difference with experimental CTOD. The simulation of both random fibre and homogeneous models is only suitable for the short fibre-reinforced composite without damage, such as fibre–matrix interface debondings and crack growing. The critical values of COD and CTOD should be determined using further experiments of the composite in order to exactly give the applicable region of the random fibre FE model.
The longitudinal ∊ yy strain maps in front of the crack tip at an applied load 391 N for spruce fibre/PP composite using DIC method, homogeneous model and random fibre model are shown in Figure 12. It can be found from these strain maps that the strain contour of the homogeneous model is smoother than the others, and the contour of random fibre model is sharp and fragmentized because of the influence of the microstructure of spruces fibres in the composite. Because the deformation measured by DICM is the average deformation of the region of the correlation sub-window at the measurement point, the pattern of strain contour of DIC experiment is between both numerical ones, neither sharp nor smooth. Both strain maps of DIC and random fibre model can be able to reflect the influence of the microstructure fibres on the strain concentration around the crack tip of this biocomposite, and the homogeneous FE model can approximately give a region of the strain concentration.
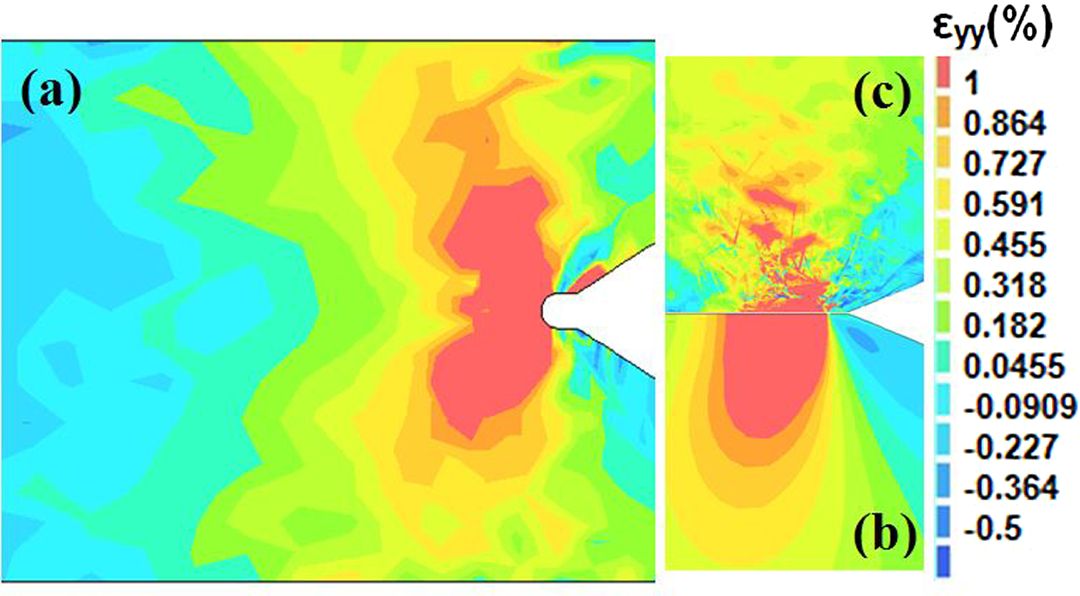
Longitudinal ∊ yy strain maps in front of the crack tip at applied load 391 N for (a) spruce fibre/PP composite using DICM; (b) in homogeneous model and (c) in random fibre model. PP: polypropylene; DICM: digital image correlation method.
Conclusions
The comparisons between experiments and both numerical results help one to understand the results and phenomenon of DIC experiments in detail and to improve the numerical models in order to be closer to the experimental phenomenon and to increase the knowledge about the fracture behaviour of this biocomposite. The conclusions from the present study noted are described below:
We have realized a direct numerical simulation of fracture behaviour for random short spruce fibre-reinforced composites. An FE model with random spruce fibres for PP composite is developed using ABAQUS code and the preprocessed program of the random fibre elements generation in FORTRAN. For calculations, wood fibres have been considered as linear elastic bodies and PP matrix as an elastic–plastic material.
The tensile behaviour of the composite is simulated by this random fibre FE model in order to consider the influence of volume content and diameter of the fibre on its macroscopic tensile behaviour.
The influence of natural spruce fibres on fracture behaviour of the composite is predicted by this random fibre FE model; meanwhile, its macroscopic fracture parameters are calculated using a homogeneous FE model with the macroscopic tensile stress–strain curve that is predicted by the random fibre FE model.
Finally, the numerical results of both homogeneous and random models have been completely compared with the experimental results that have been obtained using DICM. This comparison indicates that random fibre FE model of random short spruce fibre-reinforced composites can be able to fairly reflect the influence of random fibres’ microstructure in the composite on its fracture behaviour. The numerical predictions of the fracture parameters of the composite, such as stress, strain, J-integral, COD, CTOD and so on are consistent with the DIC experimental results.
The comparison of the two FE models with the experiments show that in a region in the front of the crack tip, the average values of J-integral are in good agreement when the numerical and experimental CT specimens of the short spruce fibre-reinforced composites are subjected to the same extension.
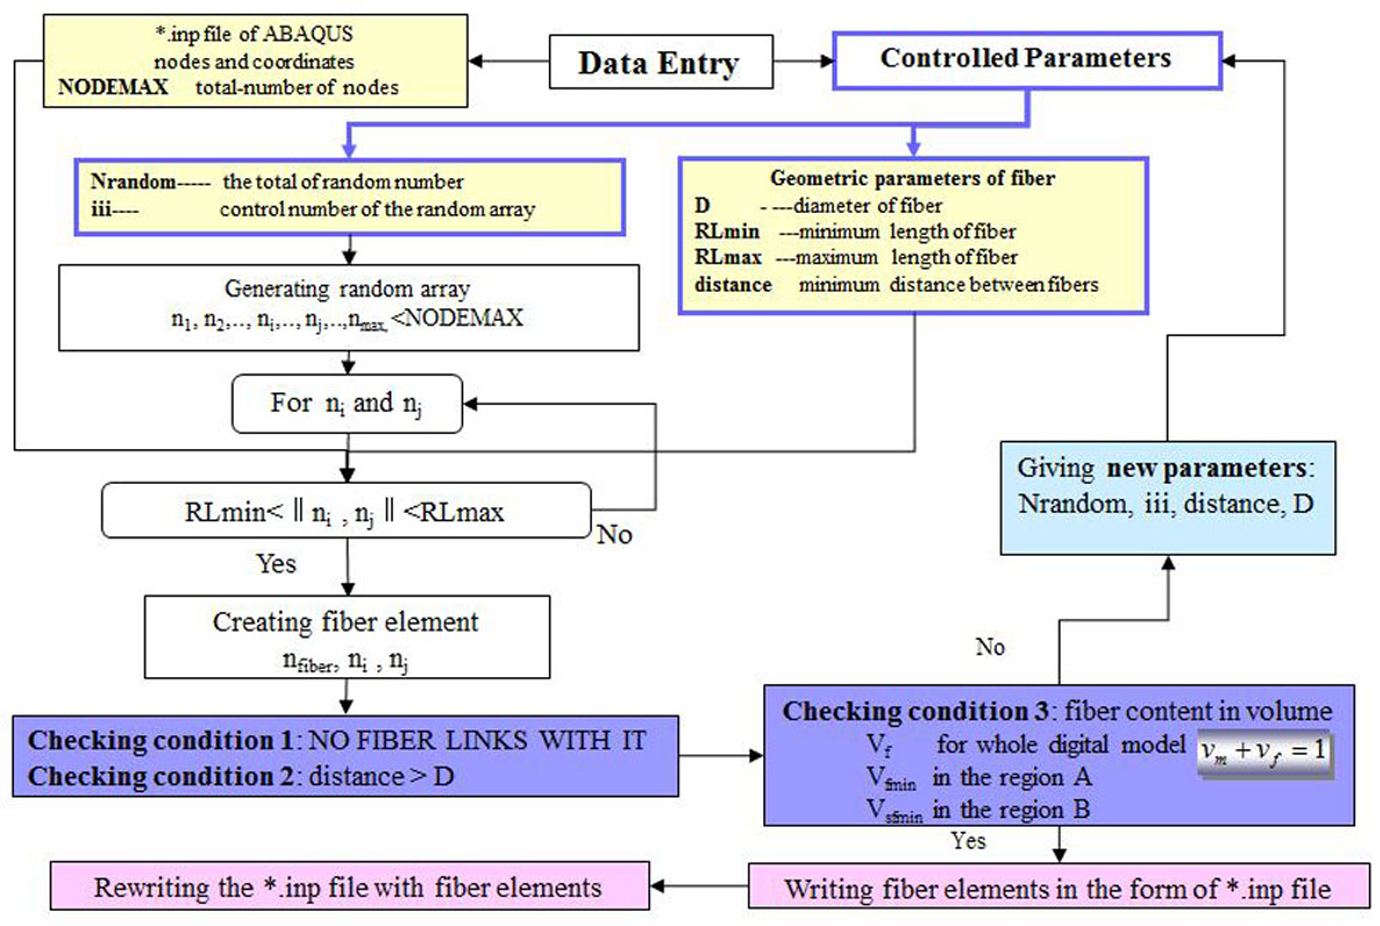
A flow chart of the random fibre elements generation program in FORTRAN code.
Footnotes
Appendix 1
Funding
MS is grateful to the Poitou-Charentes Region for its financial support and to Laboratoire de Mécanique et de Physique des Matériaux (LMPM) for the invitation. The first author would also like to thank the National Natural Science Foundation of China (No: 10972155).