
Abstract
The U.S. Army Engineer Research and Development Center (ERDC) executed a load test and verification simulation on a novel thermoplastic composite bridge, T-8518, located on Tuckers Road in Camp Mackall, North Carolina. The bridge was made with 94% recycled plastic material, primarily recycled high-density polyethylene. An M1 Abrams battle tank and a loaded dump truck were used as a live load to determine the appropriate military load classification (MLC) and civilian load rating for the bridge superstructure. The bridge was designed to support the M1 Abrams battle tank with a gross weight of 63.5 tones to replace a dilapidated timber bridge that, because of its condition, was limited to a maximum load of 4.26 tones. A finite element analysis (FEA) of the entire superstructure based on the load test results indicated that the bridge exceeded design specifications and performed in a normal linear–elastic manner with relatively small viscoelastic responses for all loads.
Keywords
Introduction
The U.S. Army owns hundreds of timber bridges, and many of them either have reduced load ratings or are closed because of material degradation. Timber bridges are susceptible to multiple maintenance issues such as damage from moisture, rot, and insects. Because of these maintenance issues and the limited load capacity of aging timber bridges for certain vehicles, recycled plastic lumber (RPL) material has been proposed for bridge construction. Plastic lumber is an attractive substitute for natural wood because it diverts waste plastic from landfills and is inherently resistant to many environmental issues. To investigate the applicability of this material to military operations, the Engineer Research and Development Center (ERDC) conducted live load testing and load rating determination of an RPL bridge in Camp Mackall, North Carolina, made with 94% recycled plastic material, primarily recycled high-density polyethylene. RPL is a wood-like product made from recovered plastic or recovered plastic mixed with other materials that can be used as a substitute for concrete, wood, and metals. The product is clean, nontoxic, nonporous, and lasts longer than wood. In addition, all types of RPL, except for wood-filled RPL, are moisture and chemical resistant, impervious to insects, flexible (can be curved and shaped), maintenance free, and do not need sealants or preservatives. The original plastic lumber products had an elastic modulus (stiffness) at least an order of magnitude less than even the most common wood species used in construction.
Objective and scope
The goals of the research were to collect field test data using a bridge load test procedure to accurately characterize the behavior of the RPL bridge, to determine the bridge load capacity ratings for both civilian and military vehicles, and to determine if the RPL structure could safely carry an M1 tank. Instrumentation for the load tests included strain transducers, vertical displacement sensors, and foil strain gages placed at 94 locations on the bridge deck, deck support beams, and pile foundations. The data analysis portion of this investigation included the use of a detailed finite-element model to calculate the bridge’s responses to the loads from a dump truck 32.65 tones and to verify that an M1 tank 64.41 tones could safely cross the bridge. Subsequently, the model was used to generate a military load classification (MLC) for the bridge deck in accordance with Army FM 3-34.343, 1 based on the assumption that the foundation piles could also support the loads.
Background
The plastic lumber industry originated in Japan and Europe during the early- to mid-1970s where new equipment was being developed to make large cross-section thermoplastic polymer products. The prospect of a dwindling wood supply in that part of the world and the possibility of using these products as wood lumber substitutes drove the development of the industry there, where products were made mainly from postindustrial plastic waste. 2
As the recycling efforts started to gain momentum, experts in the United States were considering plastic lumber manufacturing processes as a possible alternative to landfilling the abundance of available postconsumer waste plastic containers. 3 More than 8 billion pounds of plastic containers are produced each year in the United States, with the majority ending up in landfills due to the lack of demand for their resins. 4 The commercial viability of the plastic lumber industry in the United States is now being driven by the economic and logistical need to reduce disposal quantities of waste plastics and by the development of more cost-effective designs and construction methods.
A basic problem with unreinforced plastic lumber as compared to wood in structural applications is that RPL has a lower modulus of elasticity and an even lower modulus when loaded over a long time. A comparison of mechanical properties of wood, along the grain, with plastic and plastic lumber indicates that the lower modulus of plastic is a much bigger issue than any strength comparison. 4 Incidentally, wood is several times less stiff and strong when measured orthogonal to the growth axis as compared to along the growth axis. Almost any plastic lumber compares rather favorably in terms of both stiffness and strength in this situation. The materials that are typically used in plastic lumber are viscoelastic in terms of their mechanical properties. This means that there is a time dependence to their mechanical properties. 5
In 2003, an all-plastic lumber bridge was built using I-beam plastic lumber structural members. This bridge, located in the Wharton State Forest, New Jersey, was designed for a Class H-20 rating 18.1 tones (18,100 kg), since it had to be able to support a fire truck that might be needed to answer a call in that part of the forest. The I-beam design reduced the construction time and materials needed to build a bridge structure with the same load capacity when compared to a timber bridge with conventional joist and beam construction. While the costs were not fully analyzed and documented, this I-beam design appears to be competitive with conventional treated wood, on a first-cost basis, because of the reduced labor time to complete the bridge. When life cycle costs are taken into consideration, the design is even more advantageous. 2
At Camp Mackall, North Carolina, a thermoplastic composite bridge was constructed to replace a conventional timber bridge ID T-8518 with an American Association of State Highway and Transportation Officials (AASHTO) load rating of HS-20. To accommodate future training requirements, the new thermoplastic bridge was designed to support passage of a 64.4-tone M-1 Abrams tank and was cost competitive with the traditional wood timber bridge designed to carry the same load but with the durability that would require minimal maintenance over its 50-plus year life.
Bridge description and material characteristic
Bridge T-8518 at Camp Mackall, North Carolina, is a three-span structure constructed entirely of RPL members, including the superstructure and the piles. A group of consulting engineers from New York designed the bridge structure using protocol developed for plastic lumber as part of the ASTM standards development for these products. It was constructed with relatively short longitudinal stringers and a plank deck. The stringers were 45.72 cm by 45.72 cm I-beams with 7.62 cm thick flanges and a 12.7 cm thick web. The I-beams were fabricated from two manufactured T-sections that were glued and screwed together (Figure 1). The I-beam design reduced the construction time and materials needed to build a bridge structure with the same load capacity when compared with the conventional timber joist and beam construction. The stringers were continuous over the three spans and placed adjacent to each other with 0.3175 cm space between the flanges. Each span was approximately 3.65 m long with relatively simple bearing connections. The 7.63 cm thick by 30.48 cm wide deck planks were aligned transversely across the bridge and attached by deck screws to the top flange of the I-beams.
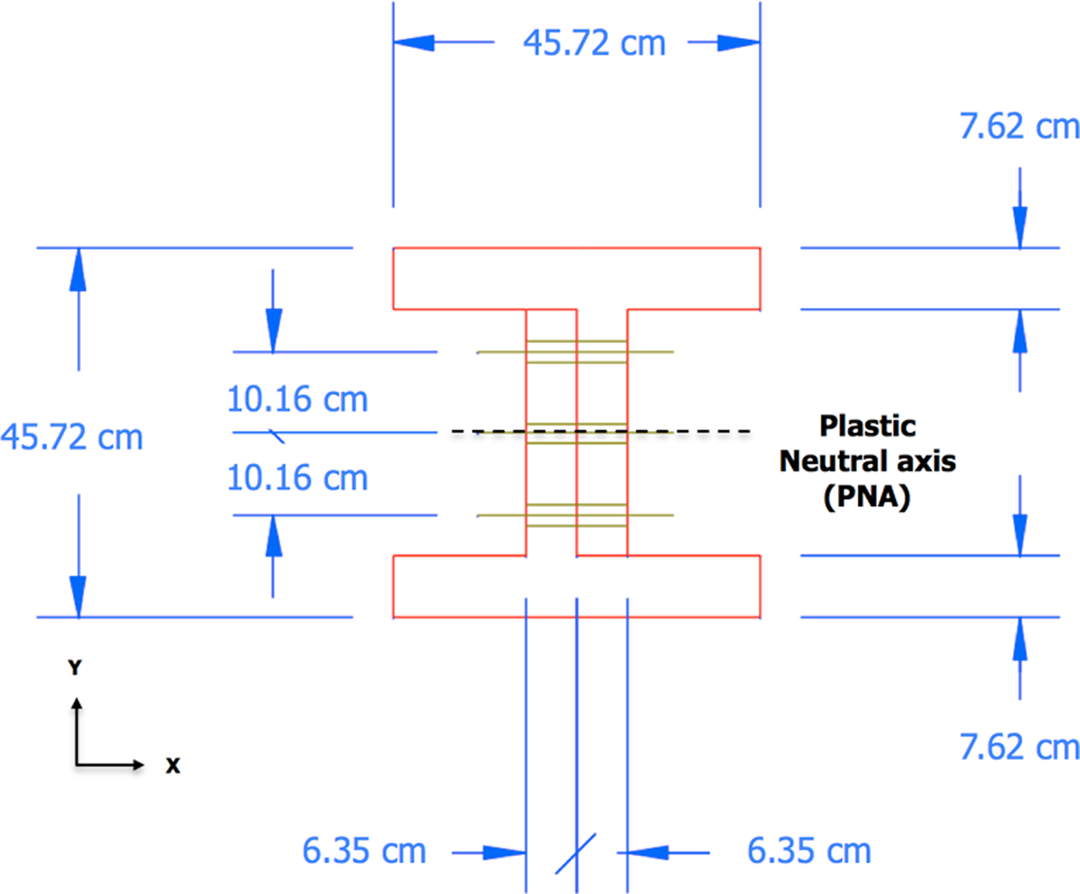
RPL I-beam cross section. RPL: recycled plastic lumber.
A profile of Bridge T-8518 is depicted in Figure 2. The substructure consisted of abutments with three RPL piles and interior piers with four piles driven about 18.29 m deep. The design pile capacity was an allowable load of 18.14 tones, with an ultimate load of 54.43 tones. The consulting engineers used slightly modified traditional timber bridge design methodology but with slightly lower allowable stresses for the thermoplastic composite materials. The material properties utilized in the design as well in the load rating calculation are shown in Table 1.
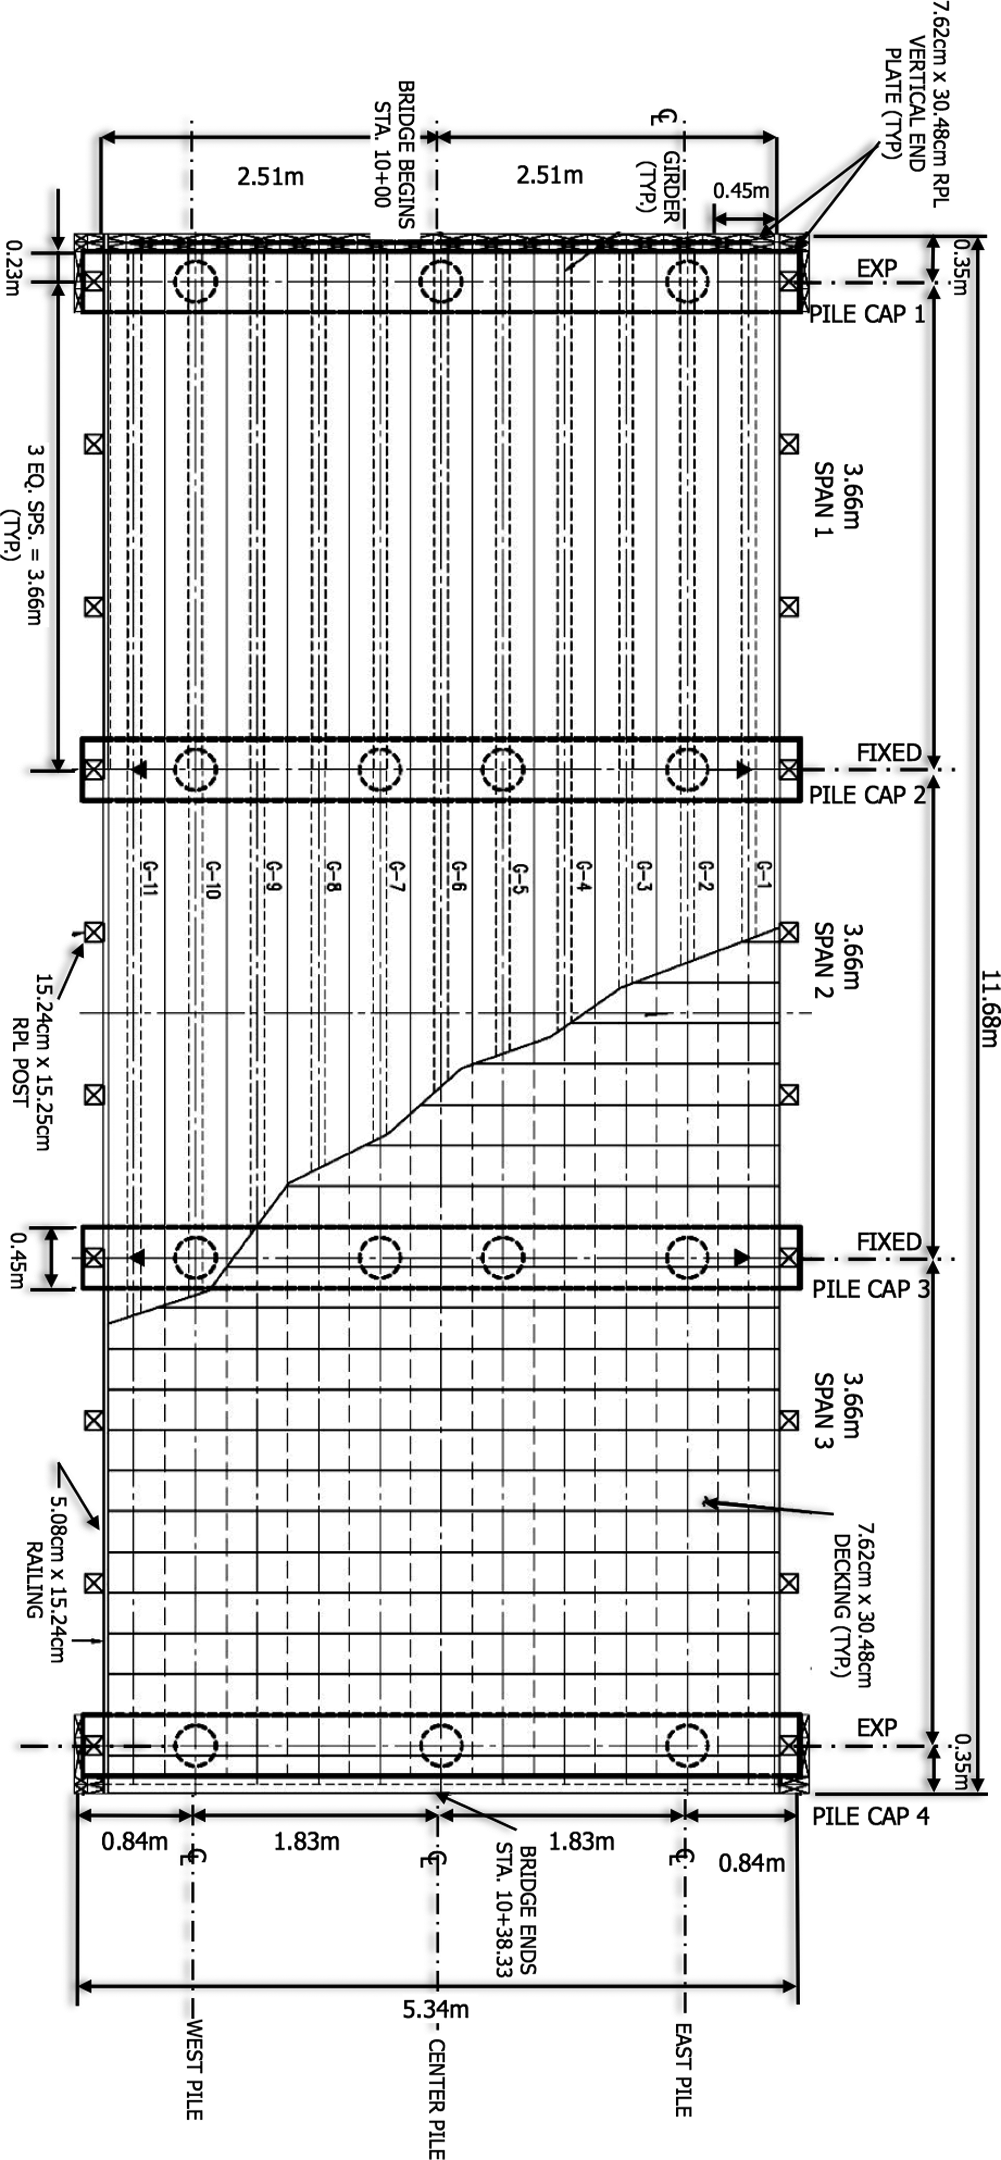
Geometric characteristic of bridge T-8518.
Design values for thermoplastic composite bridge.
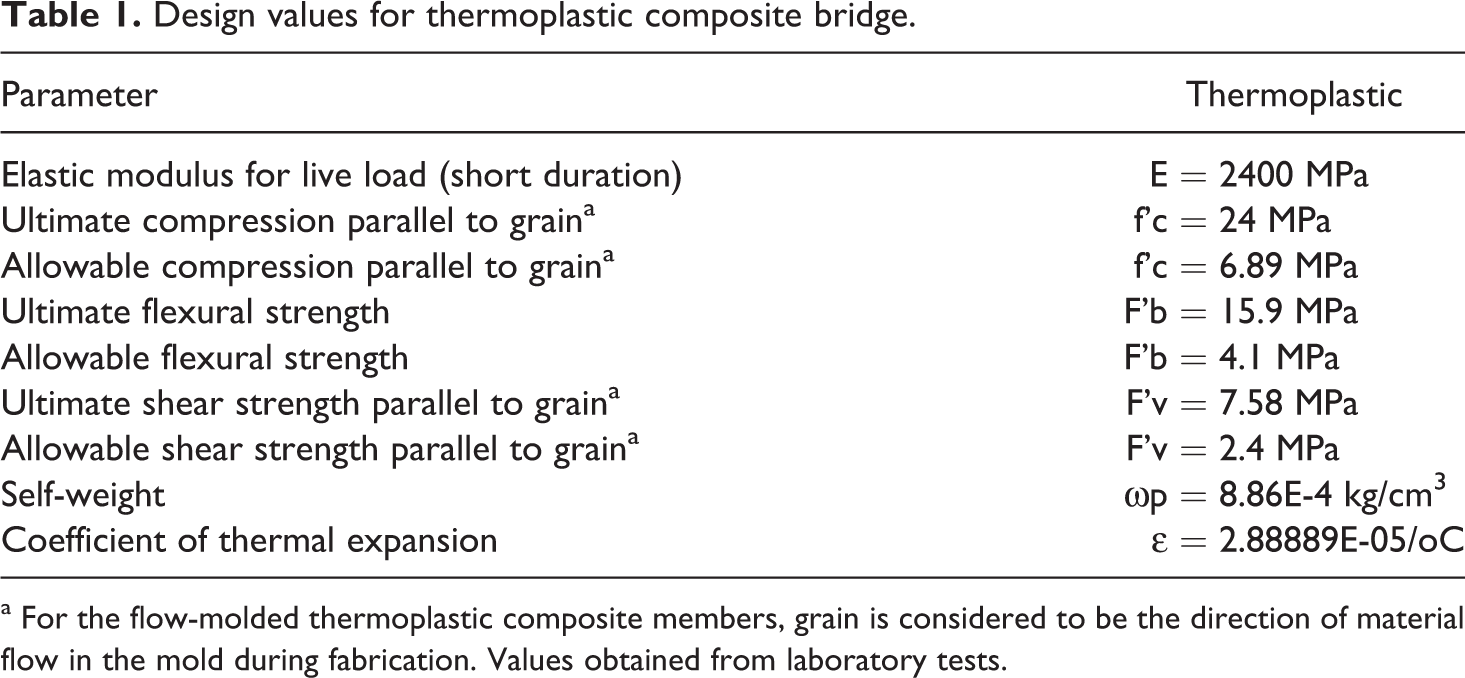
a For the flow-molded thermoplastic composite members, grain is considered to be the direction of material flow in the mold during fabrication. Values obtained from laboratory tests.
It is a nontrivial effort to design safe, efficient RPL structures capable of bearing heavy loads over long time periods due to the nonlinear nature of the mechanical properties of polymers and polymer composites. Polymers and polymer composites are subject to creep (permanent deformation that occurs due to a long-term constant load). The Non-linear Strain Energy Equivalence Theory (SEET) is a semi-empirical model that was developed and used to predict long-term creep from short-term stress–strain experiments conducted at different strain rates.
Nosker et al. (2010) performed stress–strain experiments in uniaxial compression where SEET is used to calculate a safe but efficient design stress for structural bridge components (Figure 3). 6 The ultimate flexural strength of thermoplastic material can reach to 15,857 kPa but only 4,136 kPa, a fraction of the ultimate strength, is utilized for an allowable stress in bridge design because of conservatism and creep control. As long as the applied stress is within 4,136 kPa, this material is predicted to avoid any creep effect the next 25 years of constant loading.
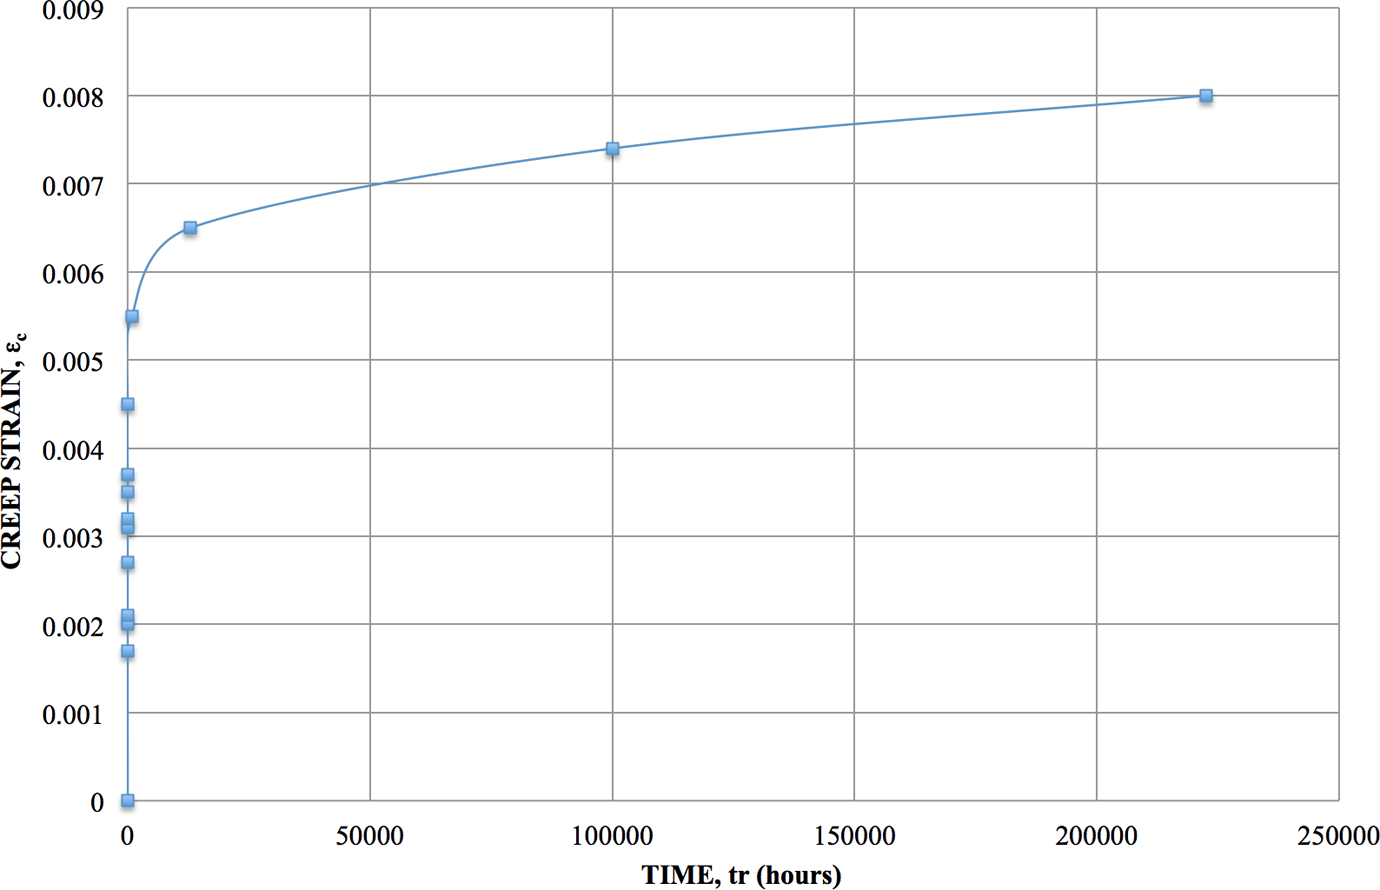
Predicted creep curve for thermoplastic.
Experimental
Structural testing information
Load testing instrumentation included 57 strain transducers and 7 vertical displacement sensors. The purpose of the instrumentation was to determine the load transfer characteristics of the superstructure. Strain transducers were attached with glue-mounted tabs as shown in Figure 4(a) and were typically located at mid-span and near the supports of the stringers, as well as one interior bent and one pile. Vertical displacements were measured at mid-span of six adjacent stringers (Figure 4(b)) at span 1 and also at the bent immediately adjacent to an interior pile. The locations of the sensors on the structure are shown in Figure 5. All sensor measurements were recorded with the BDI Wireless Structural Testing System STS-Wifi.
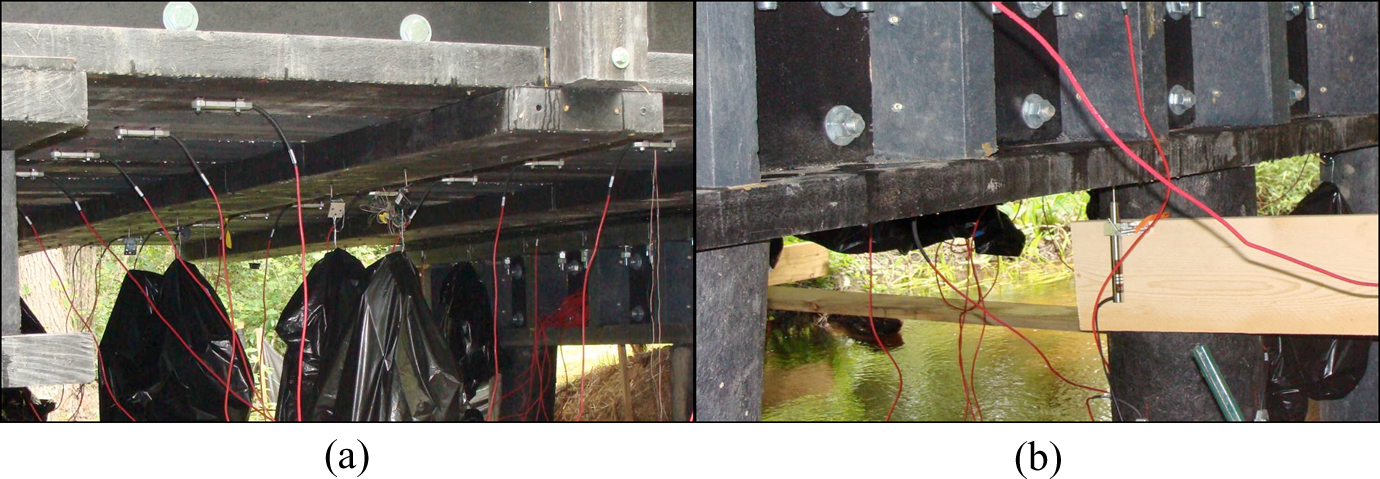
(a) Strain transducers. (b) LVDT at interior bent.
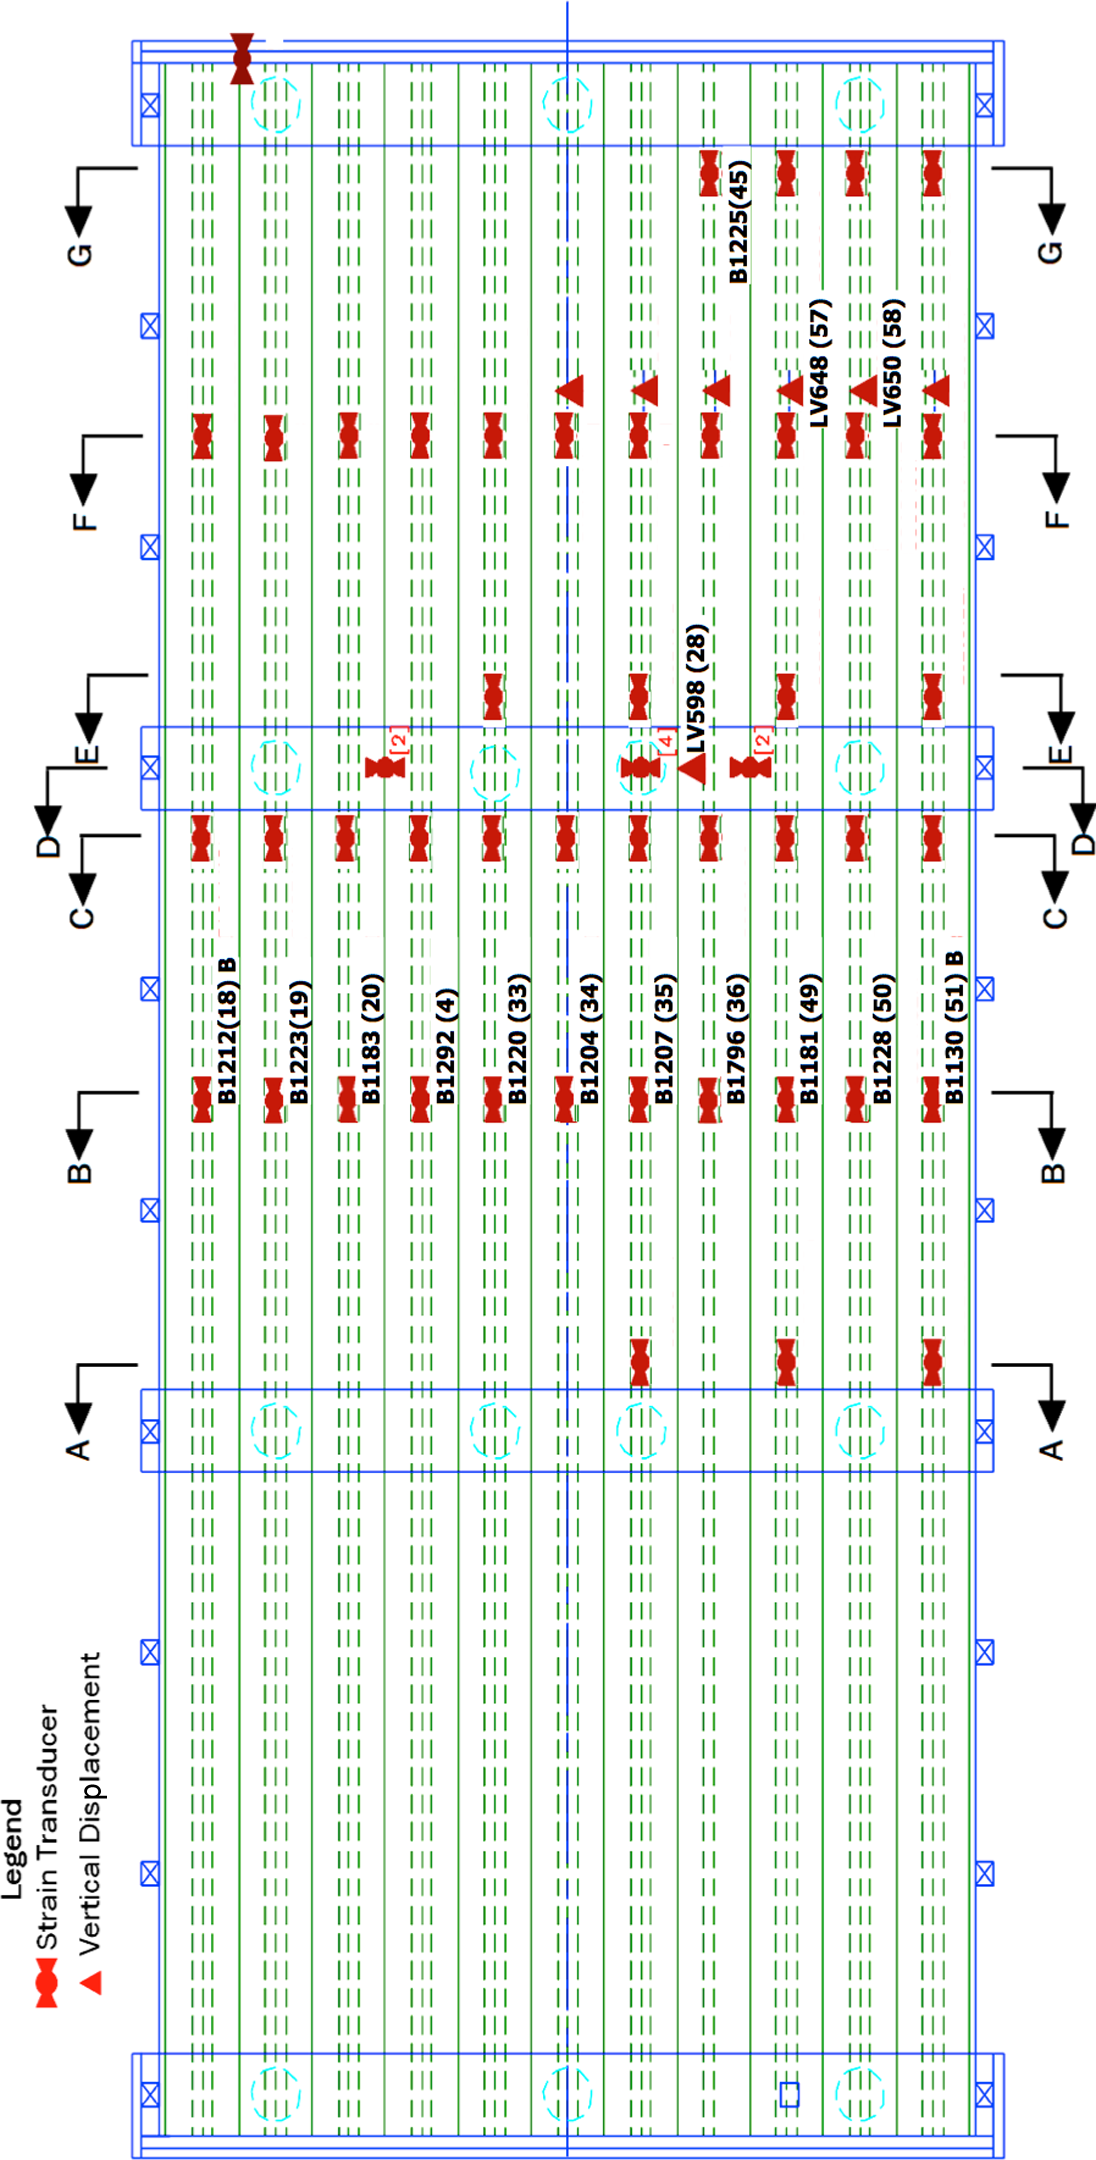
Structure plan with BDI sensors locations and sensor numbers.
As the live load tests were performed, strains and displacements were recorded as a specific vehicle was driven across the bridge along prescribed paths. All measurements were recorded at a rate of 40 Hz. Vehicle position was monitored along with the sensor measurements so that all measured responses could be correlated with applied load. Most of the tests were conducted quasi-statically with the vehicles traveling 4.82 to 8.04 km/h. Because of the viscoelastic nature of the RPL, two static tests were also performed to capture the responses of sustained loads.
Field load test
Initial tests were conducted with a 32.65-tone 3-axle dump truck at speeds of 24.14 and 40.23 km/h, and the bridge response, in terms of longitudinal strain and vertical displacements, was recorded. The dump truck was driven across the bridge along three different paths, and each path was repeated at least once to verify reproducibility in responses and test procedures. A computer model, calibrated using the strain results from the dump truck test, was used to determine if it would be safe to use an M1 Tank (64.42 tones gross weight) at a speed of 8.04 km/h to conduct the controlled load test. Because of the width of the tank relative to the bridge, only one travel path was utilized for the load test.
Load tests results
Responses from duplicate crossings were examined for both the dump truck and the M1 Tank to determine if all responses returned to zero after each load cycle, indicating that the structural responses were elastic and that no permanent damage was induced in the bridge. More variability occurred in the strain and displacement history data for the M1 tank crossing as compared to the data for the dump truck because of the difficulty in steering the tank and following an exact path.
As with most bridge structures, some degree of end restraint was observed at the abutment beam bearing locations. Figure 6 shows the bottom flange stress history from a location near the abutment beam bearing. This effect is only important to the model calibration procedures because it can reduce the measured mid-span moment by several percentages. The end restraint should be ignored for the load rating purposes. Three interesting observations can be made with relation to the end restraint based on the test results. First was the presence of negative stress spikes at the instant each axle reached the very end of the stringers. The negative stress was due to the stringers extending slightly past the center of the abutment piles such that a small cantilever effect occurred. The fact that this cantilever effect was detectable indicates that there was very little rotational restraint present at the stringer bearings. The second observation was the tendency for the stress history to drift in the negative direction (compression), even though the primary flexural response was positive when the axles crossed span 3. The negative trend in stress was an indication that the ends were restrained against axial motion. The downward flexure/displacement in the stringers caused the bottom flanges to displace outward due to the axial restraint at the intermediate support. The resistance to this displacement caused a small degree of axial compression in the stringer. The third observation was the slight curve in the stress influence lines, which was related to the second observation in that it was a function of the horizontal resistance applied to the bottom flange of the stringers. The theoretical influence near a simple support would be straight lines associated with each axle response. The curved influence indicates some degree of end restraint such that a negative moment at the bearing condition is present. While the support cannot resist significant moment, the horizontal reaction was applied eccentrically to the stringer's neutral axis and created a small amount of negative moment.
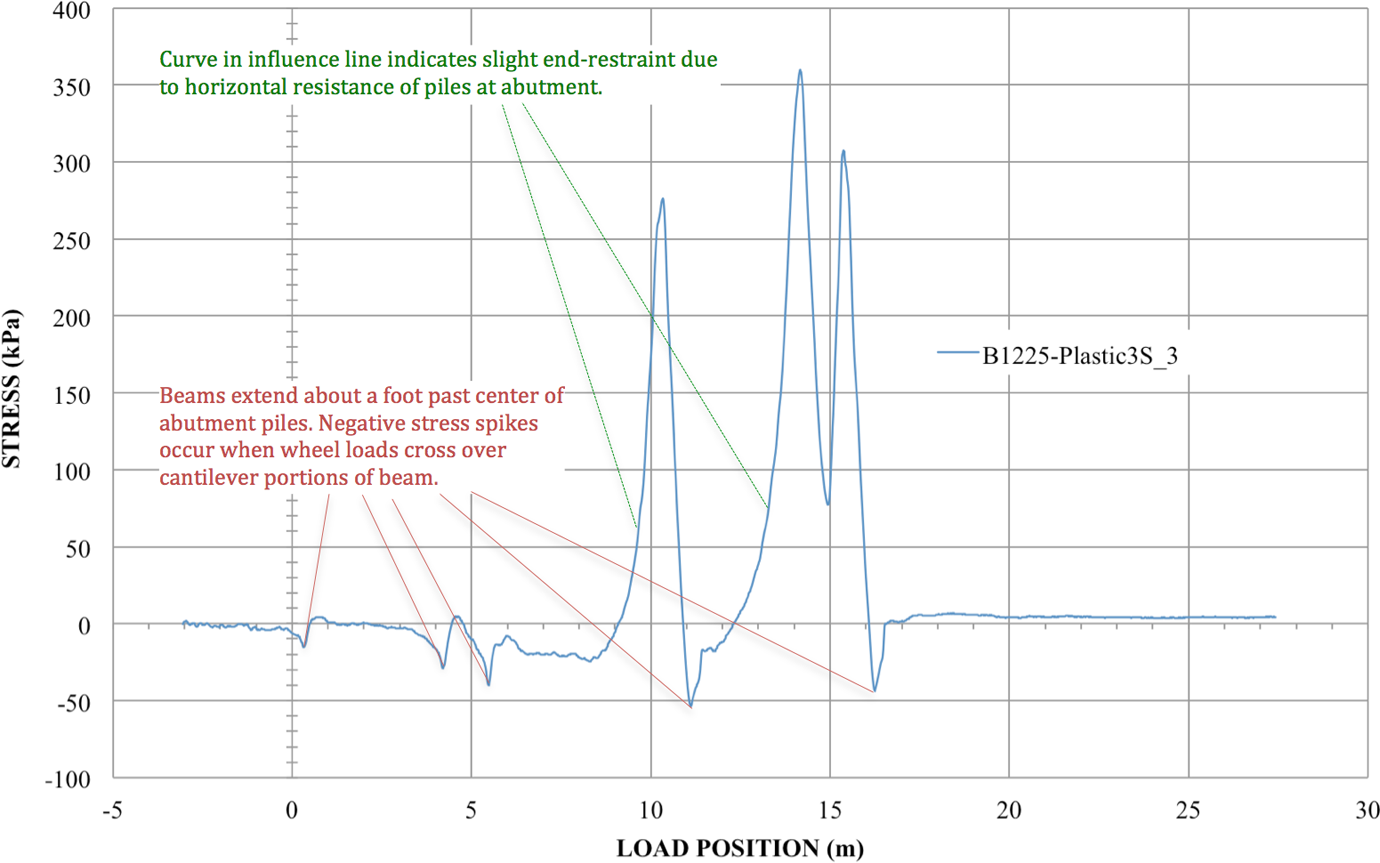
Response effects due to stringer end restraint.
In most bridge structures, the bents and abutments are assumed to be extremely rigid compared to the superstructure. However, since the piles were made from the same recycled plastic material as the superstructure, the displacement in the piles was a significant portion of the overall superstructure displacement. Figure 7 shows the displacement histories at a stringer mid-span location and the pile at bent 2 due to the truck and tank crossing, respectively. For the dump truck crossing, the pile displacement was approximately 45% of the beam displacement. During the tank crossing, the pile accounted for approximately the same percentage of displacement but the magnitudes were approximately double those from the dump truck crossing.
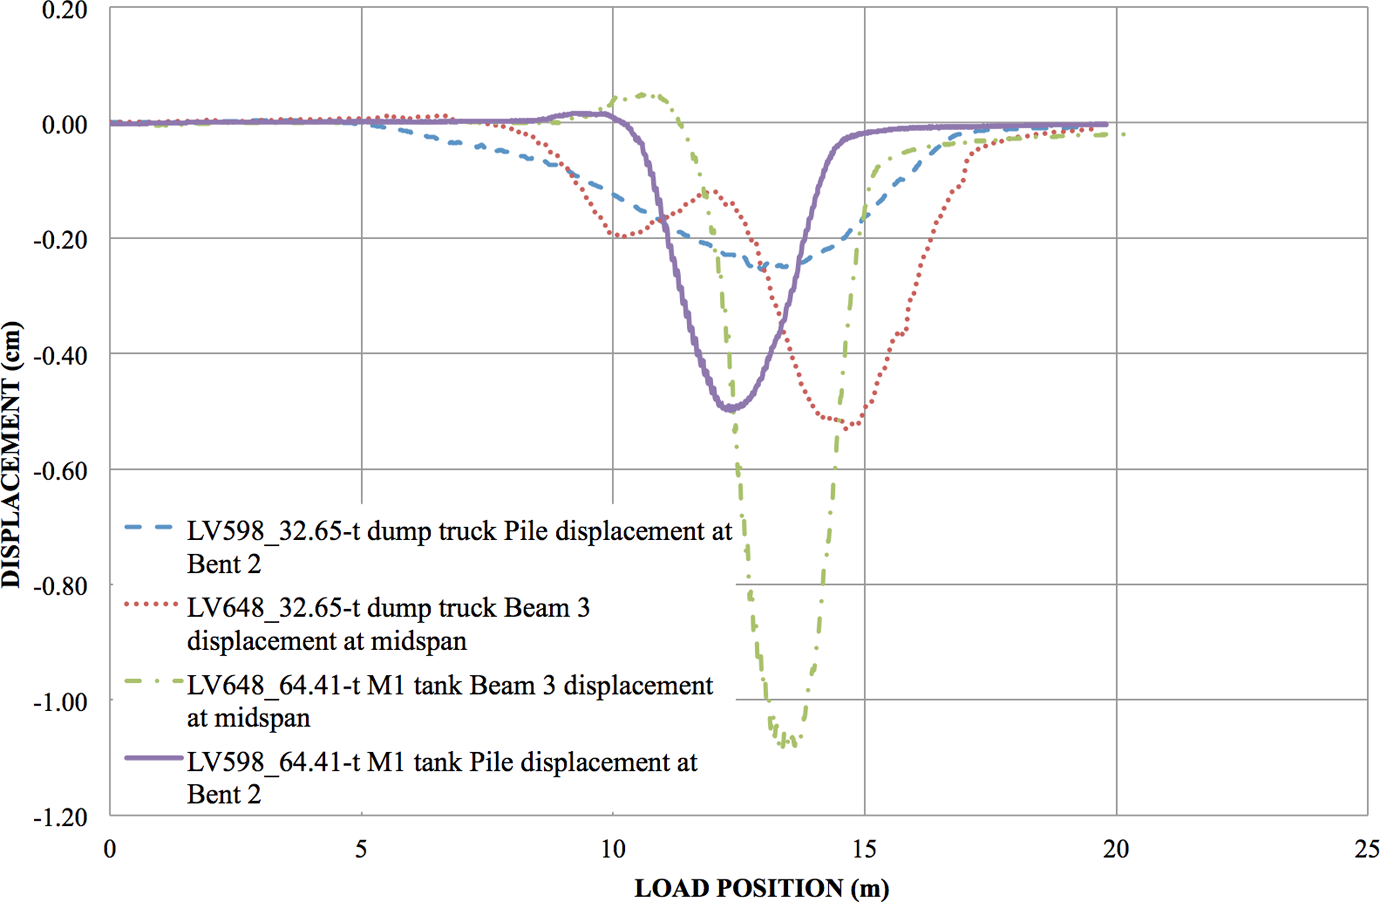
Stringer and pile displacement due to 32 tones.
The responses from the tank were large enough that viscoelastic behavior was notable, though responses did return to zero at a time lag of a minute or more required for complete recovery. Figure 8 shows the displacement history during the static test where the tank was parked on the middle of the bridge for a period of 5 min before being driven completely off the structure. The viscoelastic behavior is first noted during the static loading as the displacements continue to increase over a period of a few minutes and then again during the recovery process after the load was removed.
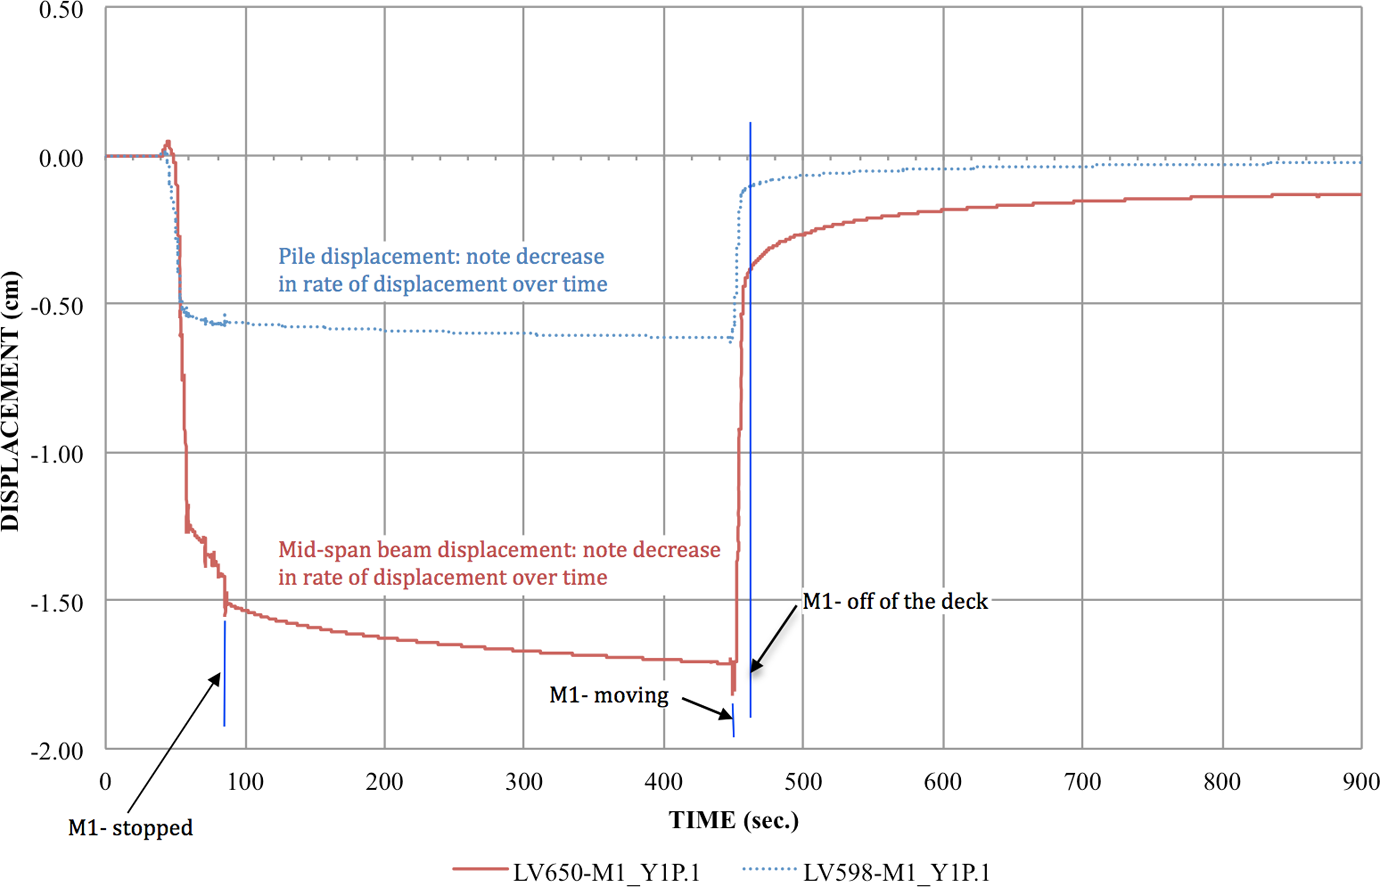
Viscoelastic displacement observed during static test.
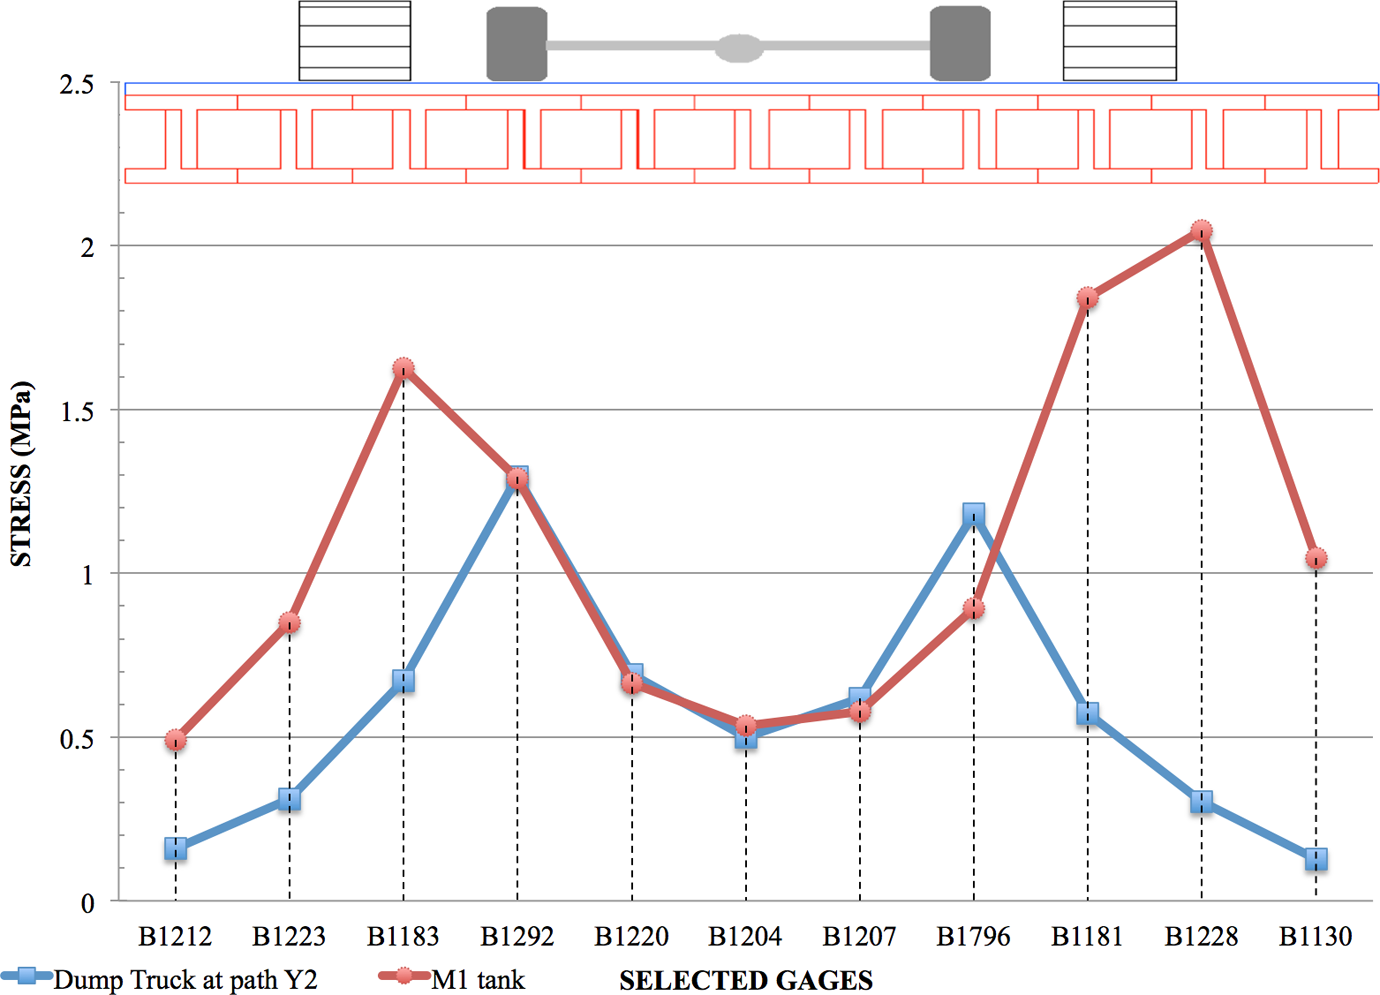
As a means of observing lateral distribution of wheel loads, bottom flange stresses associated with maximum mid-span moments were plotted for all beams at a mid-span cross section. Figure 9 shows the stress distribution for the dump truck and M1 tank crossings at the centerline of the bridge. However, due to the close spacing of the RPL beams, the lateral wheel load distribution is reasonably good. The apparent wheel load distribution factor for a single beam is approximately 41% for the dump truck and 34% for the M1 tank.
Lateral strain distribution at mid-span.
The maximum strain and displacement measurements were extracted from each crossing and converted to stress using an elastic modulus E of 2,413 MPa. The load test results indicate that E is closer to 2,760 MPa. The maximum recorded strain and stress with the 32.65 tones dump truck was 637 micro-strain and 1.53 MPa. For the M-1 tank, the maximum recorded strain and stress was 740 micro-strain and 2.04 MPa. Peak displacements for the vehicles were 0.55 and 1.33 cm, respectively. It is important to note that these peak responses were due to live load only, and little to no dynamic component was generated during the load test procedures.
Numerical modeling and load rating
Finite element model
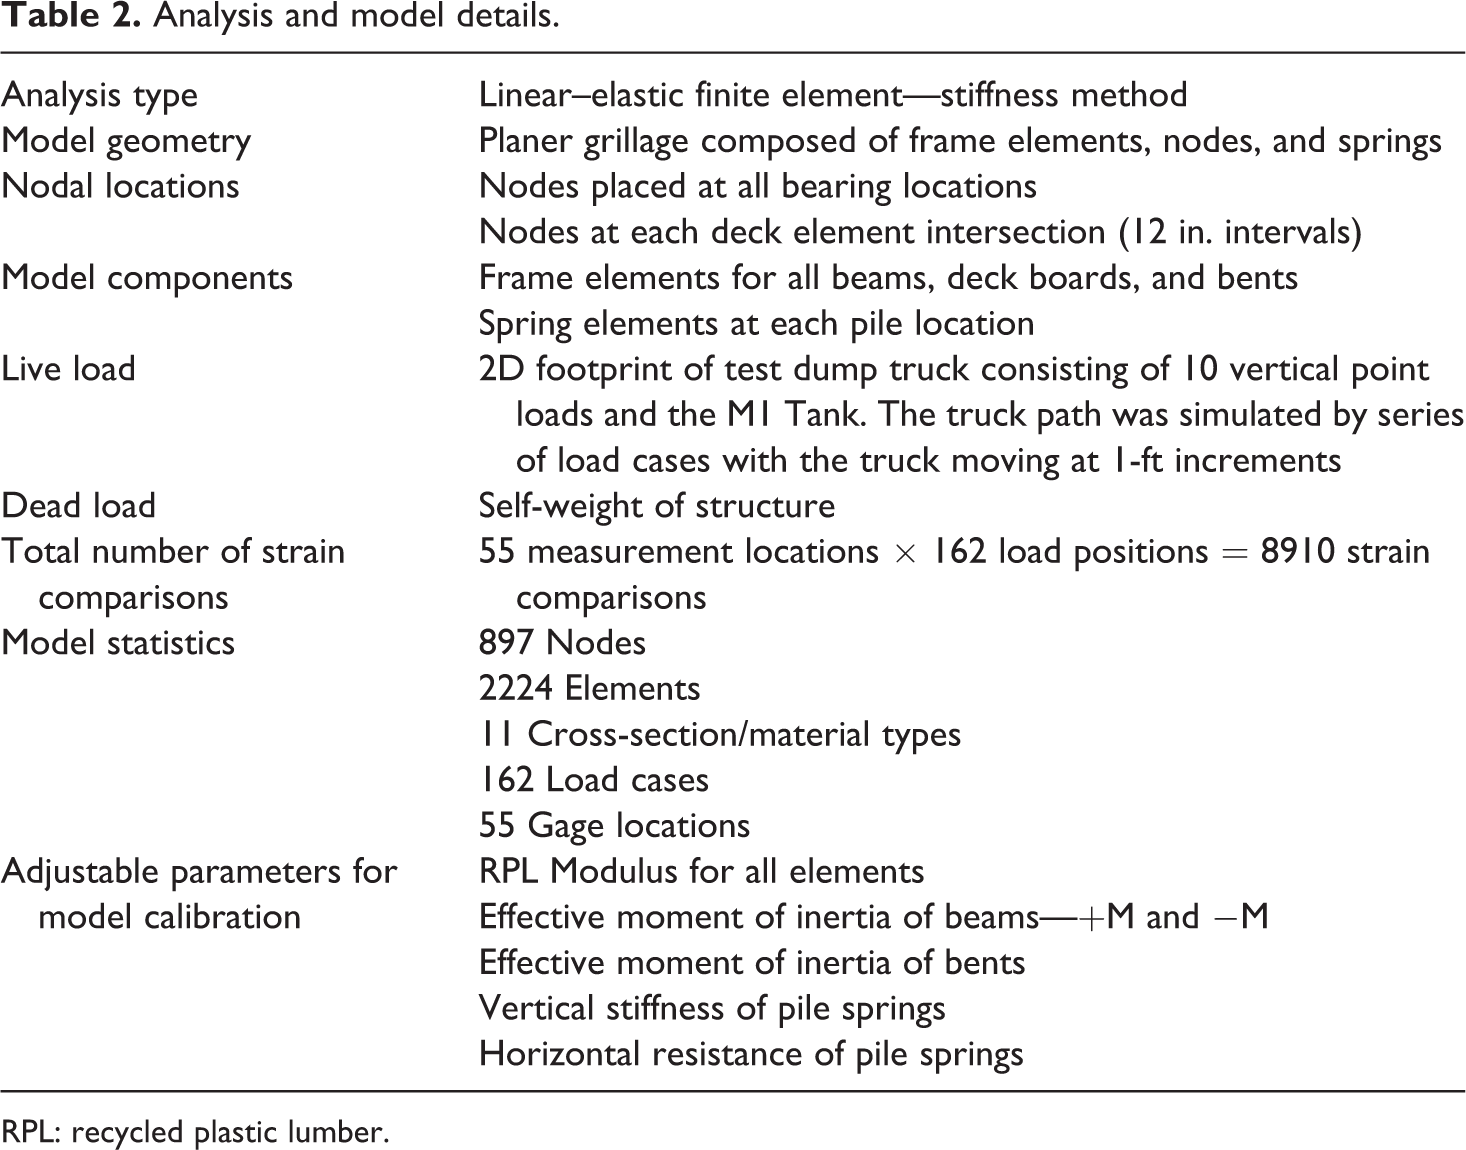
A two-dimensional linear–elastic finite element simulation produced the load rating. All parts of the bridge including the beams, deck boards, and bents were represented by frame elements using the BDI WinGEN 7 structural analysis and correlation software. Transducer locations were input in the model for calibration with the field data. Details regarding the structure model and analysis procedures are provided in Table 2. In the numerical model, the dump truck and the M1 tank loads were simulated using point forces applied to the top surface of the model along the same paths that the actual test vehicles followed in crossing the bridge.
Analysis and model details.
RPL: recycled plastic lumber.
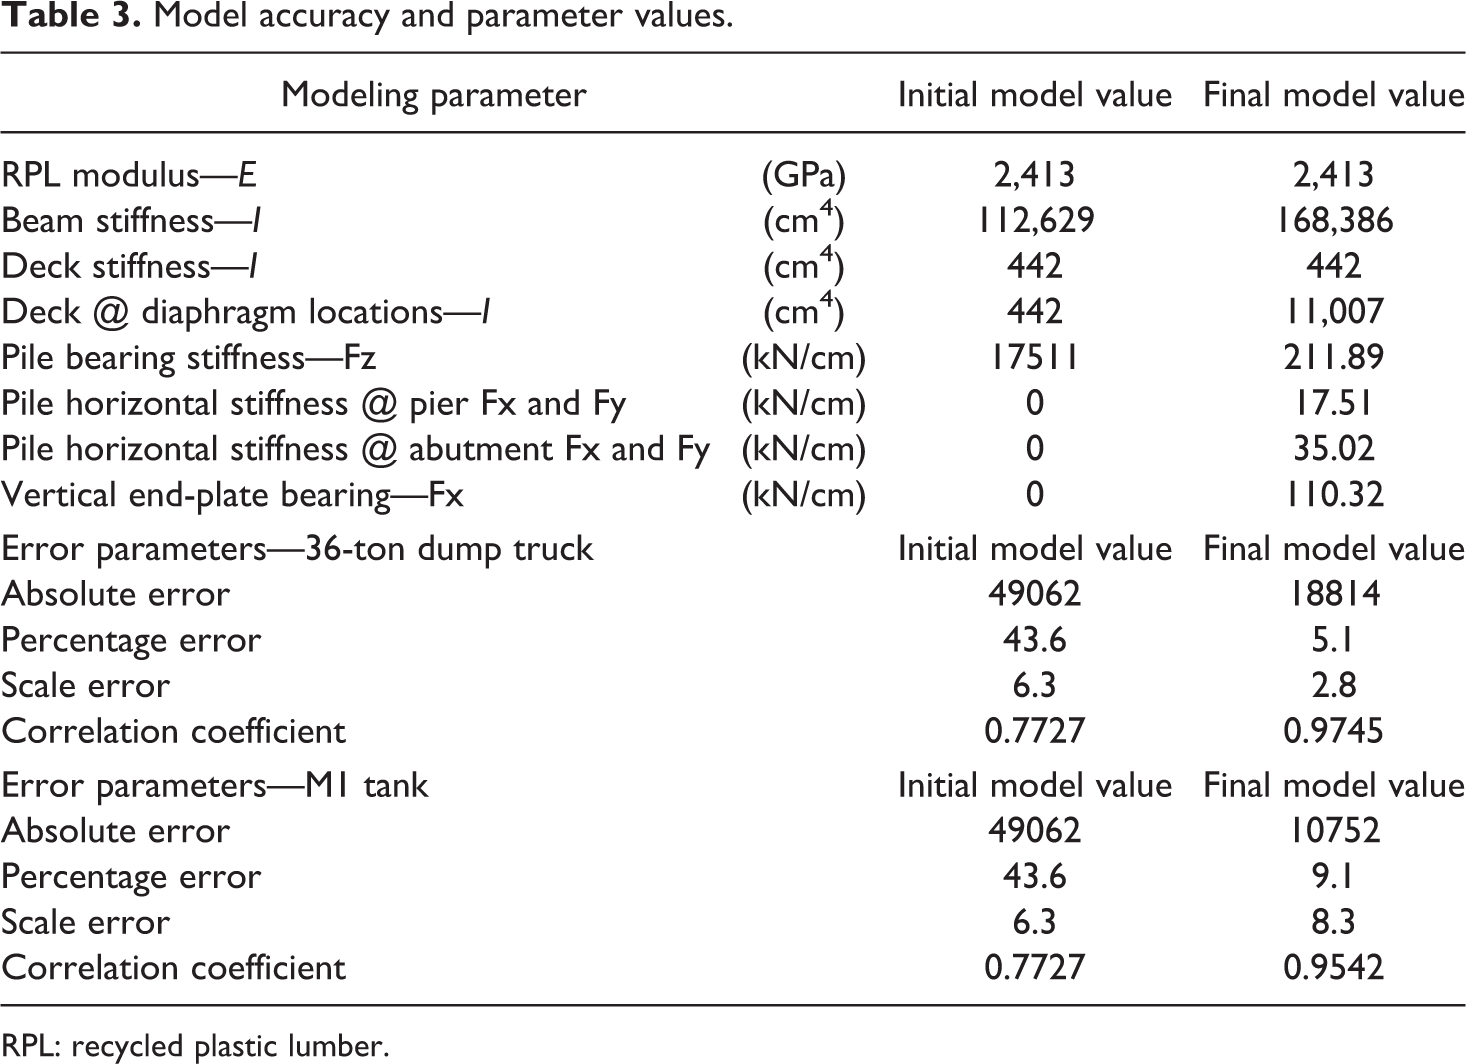
The BDI WinSAC 8 software was used to analyze and calibrate the analytical model. Limits of properties, such as modulus of elasticity, moment of inertia, and spring constants were calibrated in the model to best match the field results. WinSAC performs a statistical analysis of the model analytical results, as compared to the test results, to arrive at a final calibrated model from which load ratings can be calculated. The parameter and model accuracy values used in the initial model and obtained for the final model are provided in Table 3 for both tested vehicles.
Model accuracy and parameter values.
RPL: recycled plastic lumber.
During the optimization process, various error values were computed by the analysis program WinSAC that provides a quantitative measure of model accuracy and improvement. The error was quantified in four different ways, each providing a different perspective of the model's ability to represent the actual structure, that is, an absolute error, a percentage error, a scale error, and a correlation coefficient.
The absolute error is computed from the absolute sum of the strain differences and is typically used to determine the relative accuracy from one model to the next and to evaluate the effect of various structural parameters. Because the absolute error is in terms of micro-strain (m∊), the value can vary significantly depending on the magnitude of the strains, the number of gages, and the number of different loading scenarios and is used to determine the relative improvement of a particular model.
A percentage error is calculated to provide a better qualitative measure of accuracy. It is computed as the sum of the strain differences squared divided by the sum of the measured strains squared. A model with acceptable accuracy will usually have a percentage error of less than 10%. The scale error is similar to the percentage error except that it is based on the maximum error from each gage divided by the maximum strain value from each gage. The correlation coefficient is a measure of the linearity between the measured and computed data and determines how well the shapes of the computed response histories match the measured responses. A good model will generally have a correlation coefficient greater than 0.90. A poor correlation coefficient is usually indicative of a major error in the modeling process, such as poor representations of the boundary conditions or incorrectly applied.
The majority of the model calibration effort was spent in simulating the flexibility of the piles, the flexibility of the deck, and the actual truck paths. Because of the close beam spacing and flexible deck, the measured responses were very sensitive to small changes in lateral truck position. Variations in the truck path, as small as 10.16 cm left or right, had a significant effect on each beam’s stress history. Because of this, it was easier to match the dump truck data, as it was easier for the dump truck to travel in a straight line than it was for the M1 tank. Even then small variations occurred along each path, so maximum stresses were matched at each instrumented cross-section.
Results show some variation in stiffness for the deck and the beams. It could not entirely be determined if the variations were related to material properties, or to construction/geometry effects. Slight composite behavior between the deck and the beams appeared to be present. The composite behavior should not be considered during load rating procedures because it is likely that the deck screws will loosen with time and normal usage of the deck.
The primary goal of the test was to obtain a realistic estimate of the strength of the thermoplastic bridge and then provide a basis for load-rating standard design and rating loads. A load rating is usually defined as the ratio between live load capacity and live load demand. Because the bridge was constructed of RPL components, there are no applicable AASHTO specifications for the material. 9 The response behavior of the material was defined as elasto-plastic. Allowable stress and ultimate stress values were given for axial, flexure, and shear responses. The allowable stress values corresponded to stress limits that the members could withstand for a long period of time, 25 years, and still return to their original state after the load was removed. 5 The ultimate stress values were generally three to four times greater than the allowable stresses. Due to the extremely low modulus of the RPL compared to most structural materials, displacements associated with ultimate stresses would be extremely large, and the responses would be well out of the linear range. The most appropriate load rating method was determined to be allowable stress. The allowable stresses provided were assumed to be consistent with the inventory load rating limits, because the inventory limit represented a stress level that could be applied repeatedly without reducing the service life of the bridge.
For allowable stress design (ASD), the entire factor of safety is built into the stress limit.
10
The dead load and live load responses are both given the same level of importance and reliability and a load factor of 1.0 is applied to both the load effects. While this is generally not the case, it suggests a factor of safety against the collapse of at least 3. Load ratings were performed on the calibrated model according to AASHTO load and resistance factor rating (LRFR)
9
methods using the allowable stress/serviceability limit state, equation (1),
10

where RF is the rating factor for individual member; C is the member capacity; γDC is the LRFD load factor for structural components and attachments; DC is the dead load effect due to structural components; γDW is the LRFD load factor for wearing surfaces and utilities; DW is the dead load effect due to wearing surface and utilities; γP is the LRFD load factor for permanent loads other than dead loads = 1.0; P is the permanent loads other than dead loads; LL is the live load effect and IM is the impact effect, either AASHTO or measured.
The flexural capacity of the beams C in equation (1) is defined as:
where φc is the condition factor; φs is the system redundancy factor, φ is the LRFD resistance factor, and Rn is the nominal member resistance.
For live loads, a design vehicle HS20-44 and the AASHTO legal loads, type 3, type 3S2, and type 3-3 were simulated on the calibrated finite element model to perform the initial civilian load rating of the bridge. For the estimation of MLC (a load rating of the bridge for military vehicles), the M1 tank and the hypothetical MLC 801 were used for the estimation of the final wheeled and tracked MLC of the bridge. An impact factor of 30% 10 was applied to all live load responses wheel and track vehicles. The load rating factors for the four AASHTO vehicles and the MLC tracked and wheeled vehicles for moment and shear are shown in Table 4.
Vehicle rating factors and responses—positive moment in RPL beams.
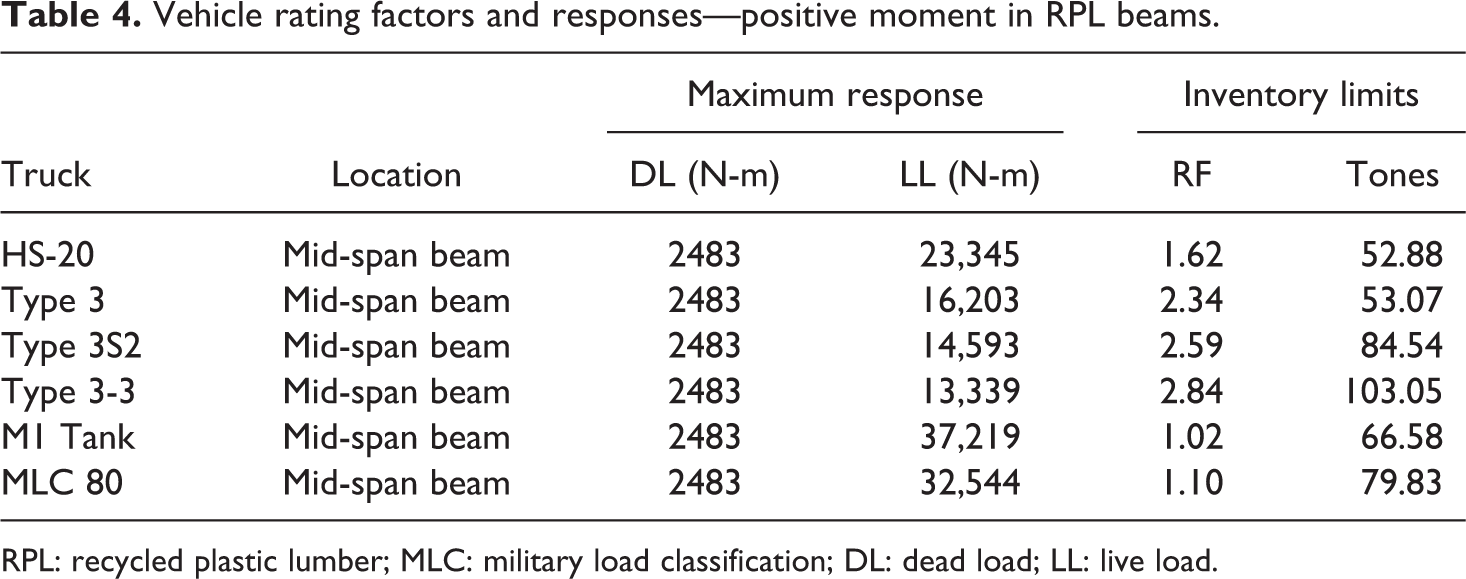
RPL: recycled plastic lumber; MLC: military load classification; DL: dead load; LL: live load.
Table 5 shows an example computation of an inventory load-rating factor for a mid-span beam element with HS-20 loading and Table 6 for the MLC (tracked) loading. Resistance, condition, and system factors shown in Tables 5 and 6 were obtained from the LRFR code. 9 The controlling limit state was always flexure of the RPL beams. Using this criterion, an LRFR of 1.62 and 1.02 were calculated for civilian wheeled vehicles and tracked military vehicles, respectively.
Rating factor calculation for HS-20.a
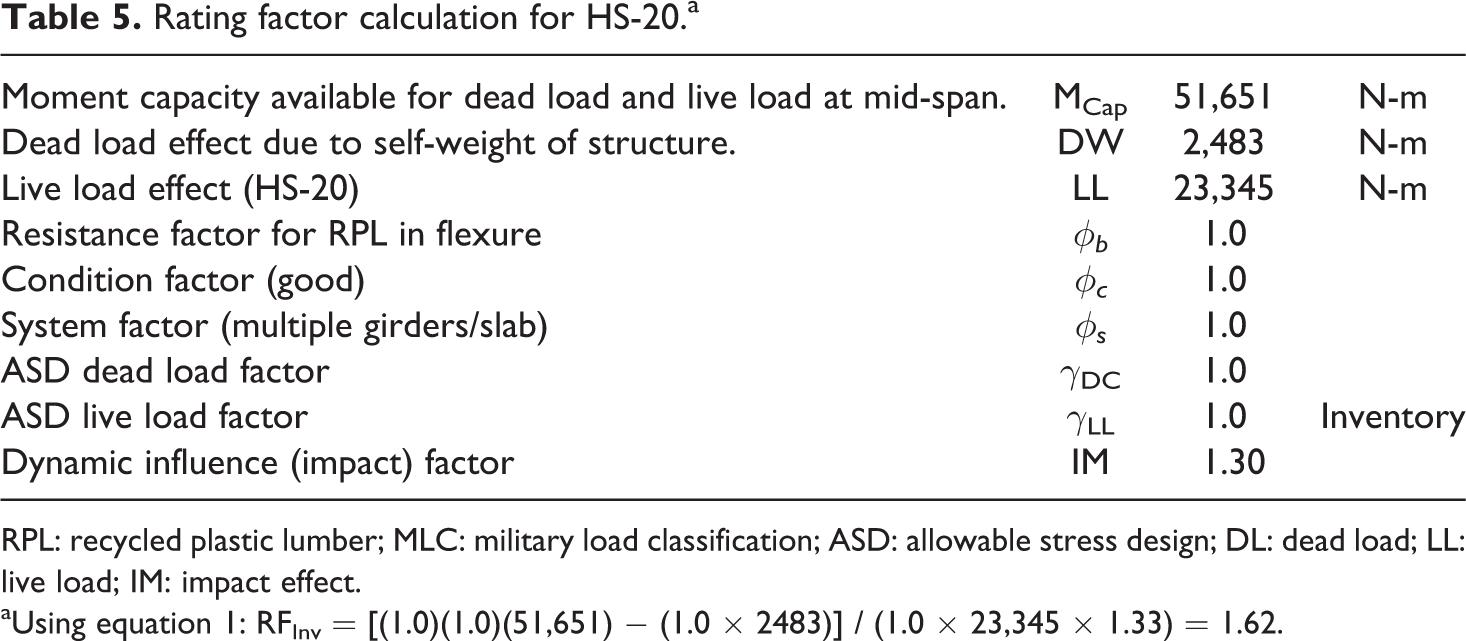
RPL: recycled plastic lumber; MLC: military load classification; ASD: allowable stress design; DL: dead load; LL: live load; IM: impact effect.
aUsing equation 1: RFInv = [(1.0)(1.0)(51,651) − (1.0 × 2483)] / (1.0 × 23,345 × 1.33) = 1.62.
Rating factor calculation for M1 tank (tracked).a
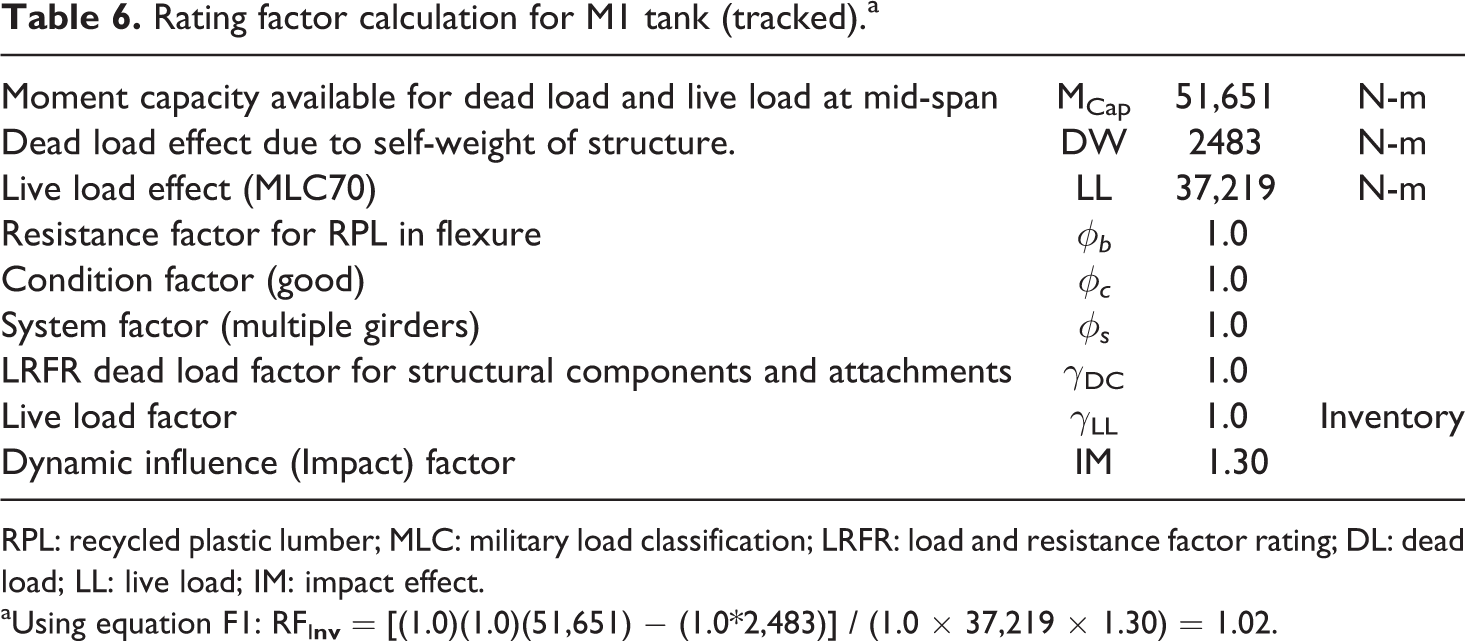
RPL: recycled plastic lumber; MLC: military load classification; LRFR: load and resistance factor rating; DL: dead load; LL: live load; IM: impact effect.
aUsing equation F1: RFI
The bridge is given a load rating of 66.2 tones (66,200 kg) for tracked vehicles that represent an MLC 73 and 80 tones (80,000 kg) for wheeled vehicles. The difference in results between the tracked and wheeled vehicles is because the distribution for a single beam is approximately 41% for the dump truck and 34% for the M1 tank.
Conclusions
The research presented in this article evaluates the behavior and establishes the structural strength of the RPL bridge in Camp Mackall, North Carolina. Important conclusions drawn from this investigation are as follows:
From the load rating analysis using the ASD method, the RPL bridge was rated as 1.62 and 1.02 for civilian and tracked military vehicles, respectively.
Results from both sets of tests (the 32.65 tones dump truck and the 64.41 tones M1 tank) indicate that the structure generally performed in a normal linear–elastic manner. Relatively small viscoelastic responses were observed with the heavier M1 tank. A long duration static test with the tank showed that it took several minutes for the bridge to reach maximum deflection after the load was applied, and a similar amount of time for the measurements to return to zero after the load was removed, consistent with the material properties of RPL and the intended design. One difference between the load test results for the RPL bridge and other conventional bridge structures was that strain and displacement magnitudes were relatively high. While this was expected due to the low modulus of the material, the notable observation was the amount of displacement induced in the RPL substructure. Load ratings for this bridge were computed using an allowable stress method due to material properties. The allowable stresses provided were within the linear–elastic response range and were associated with a stress limit where all deformations could be recovered after a 25-year load application. A load rating based on ultimate load would have been difficult because the responses would have been extremely nonlinear with large deflections that would limit future span lengths between 12 ft and 15 ft using the same beam cross-section configuration. The load rating results indicated that the bridge performed as good as or better than designed. The inventory load rating factor for the HS-20 vehicle was 1.62, indicating it can handle HS-32. The load rating factor for the 144-kip M1 tank was 1.02, which provides an MLC of 73. The load rating factors and conclusions presented in this article are provided as recommendations based on the structure's response behavior and condition at the time of load testing. The structure was brand new and considered to be in good condition. Any structural degradation or damage must be considered in future load ratings. While there certainly are property differences between thermoplastic composite materials and natural wood, appropriate design considerations and material formulation (i.e., unreinforced versus reinforced) enable these materials to be used in high load-bearing applications for all types of structures.
Footnotes
Acknowledgements
The authors would like to thank the U.S. Army Training Facility Camp Mackall at North Carolina for allowing the construction and load test execution of the RPL bridge at their facility. Permission to publish this information was granted by the Director the Geotechnical and Structures Laboratory, U.S. Army Engineer Research and Development Center.
Funding
This research received no specific grant from any funding agency in the public, commercial, or not-for-profit sectors.