
Abstract
In this work, the mechanical behavior of polyhyroxyalkanoate (PHA)/poly(lactic acid) (PLA) blends is investigated in a wide range of compositions. The mechanical properties can be optimized by varying the PHA contents of the blend. The flexural and tensile properties were estimated by different models: the rule of mixtures, Kerner–Uemura–Takayanagi (KUT) model, Nicolai–Narkis model and Béla–Pukánsky model. This study was aimed at investigating the adhesion between the two material phases. The results anticipate a good adhesion between both phases. Nevertheless, for low levels of incorporation of PHA (up to 30%), where PLA is expectantly the matrix, the experimental data seem to deviate from the perfect adhesion models, suggesting a decrease in the adhesion between both polymeric phases when PHA is the disperse phase. For the tensile modulus, a linear relationship is found, following the rules of mixtures (or a KUT model with perfect adhesion between phases) denoting a good adhesion between the phases over the composition range. The incorporation of PHA in the blend leads to a decrease in the flexural modulus but, at the same time, increases the tensile modulus. The impact energy of the blends varies more than 157% over the entire composition. For blends with PHA weight fraction lower than 50%, the impact strength of the blend is higher than the pure base polymers. The highest synergetic effect is found when the PLA is the matrix and the PHA is the disperse phase for the blend PHA/PLA of 30/70. The second maximum is found for the inverse composition of 70/30. PLA has a heat-deflection temperature (HDT) substantially lower than PHA. For the blends, the HDT increases with the increment in the percentage of the incorporation of PHA. With up to 50% PHA (PLA as matrix), the HDT is practically constant and equal to PLA value. Above this point (PHA matrix), the HDT of the polymer blends increases linearly with the percentage of addition of PHA.
Introduction
The use of biodegradable polymers from renewable resources to replace the petrosource polymers is increasing worldwide. The actual growing of petroleum cost and the overuse of landfills combined with environmental factors and policies are making a swift in the general sense of the use of biopolymers. 1 Several biopolymers and their blends are being used in a large spectrum of utilities. This new type of polymers allied to the life cycle analysis is making a turnover in the polymer industry.
However, it is mandatory to find biopolymer blends with properties that fulfill the product’s technical specifications at a low price, decreasing the ratio of price–quality.
From the universe of biodegradable polymers from natural resources, the polyhydroxyalkanoate (PHA) presents mechanical properties that can replace a large spectrum of petrosource polymers, namely in the automotive industry. However, due to its actual price, the solution is not economically viable for mass consumption. Poly(lactic acid) (PLA) is a lower cost polymer but does not meet the full requirements of polymers for automotive components, for example, in terms of temperature resistance. Furthermore, both polymers show a low-impact toughness.1–3 To make a competitive solution, it is necessary to reduce the price and increase the temperature resistance and the toughness of the final polymer. One way is to blend PHA with a less expensive biopolymer, such as PLA.
Biopolymers and their blends
PLA is a polymer produced by the fermentation of simple sugars such as glucose and maltose from corn or potato, sucrose from cane or beet sugar and lactose from cheese. 2 It is a linear aliphatic polyester thermoplastic used as package materials and in production of cloths, carpet tiles, surgical and biomedical applications, among others. The PLA mechanical properties have been reported in the literature.1–7 Several investigations have been made on PLA blends with poly(∊-caprolactone), 8 poly(butyl acrylate), acrylonitrile– butadiene–styrene 4 among several other studies. Several works for tailoring the recurring of PLA properties to fibers are also being conducted.3,5,6,9,10 All of these works state that the adhesion between fiber and matrix allows to have a real fiber reinforcement. That is translated into a general increase in the mechanical properties.
PHA is a generic designation of polyester polymers produced by the bacterial fermentation of sugars and lipids. These polyesters are a carbon storage and energy reserves in bacteria such as Ralstonia eutropha, Bacillus megaterium, Azotobacter chroococum, and so on and have a wide range of mechanical properties (e.g. strength and Young’s modulus). The PHAs are semicrystalline polymers with melting temperatures ranging from 120 to 180°C depending on the chemical composition.
Several works studied the PHA/PLA blends. Gérard and Budtova 3 showed that PHA and PLA are immiscible polymers. They also state that although both PLA and PHBV are brittle polymers, blends containing a small amount of PHBV in a PLA matrix showed a significant ductile plastic deformation. Noda et al. 11 reported that when 10% PHA was added to PLA, the percentage elongation of the blends improved significantly. This was attributed to the increase in the amorphous phase of the blend.
This work presents the results on an investigation on the mechanical properties of a full-spectrum composition of PHA/PLA blends. A total of 11 different samples were prepared, with intervals of 10% variation in the phases. Pure samples of pure PHA and PLA (PHA/PLA ratios of (100:0) and (0:100), respectively) and for all these samples, the tensile, flexural and impact properties were studied. It also measures the heat-deflection temperature (HDT) of each sample.
The achieved data were compared with theoretical models and gave us a full scope of the mechanical behavior of PHA/PLA blends.
Mechanical properties prediction models
The mechanical properties of the blends (indicated by the subscript b) can be predicted by models assuming different interfacial behaviors between phases: Well-disperse phases with perfect adhesion (e.g. rules of mixtures) spherical inclusions of one polymer in a continuous polymer matrix with perfect adhesion or no adhesion (e.g. Kerner–Uemura–Takayanagi (KUT) model) spherical inclusions with variable interphase interactions, ranging from poor to good adhesion (Nicolai–Narkis, (NN) model and Béla–Pukánsky (BP) model).
These models will be described in the following. They will be used to interpret the adhesion between the polymer phases within the PHA/PLA blend.
Rules of mixtures
The rule of mixtures (ROMs) considers a perfect adhesion between the matrix (indicated by subscript m) and the dispersed phase (indicated by subscript d) and a perfect dispersion of the spherical inclusions in the matrix. This model can be used to predict the initial modulus and the tensile stress of the blend, respectively


where E b is the initial modulus of the blend, E d is the initial modulus of the disperse phase, E m is the initial modulus of the matrix, Ø d is the weight fraction of the disperse phase, σ b is the maximum stress of the blend, σ d is the maximum stress of the disperse phase and σ m is the maximum stress of the matrix.
KUT model
The KUT model treats the blends as spherical inclusions of one polymer, having initial modulus of E
d, in a continuous matrix of another polymer having a modulus E
m. The Poisson’s ratio of the matrix (υ
m) is taken to be 0.5.
8
This model has two variations. One assumes perfect adhesion (equation (3)) at the blend interface and the other assumes no adhesion (equation (4))


Nicolai–Narkis model
In the NN model, the interphase interaction constant, K, is a function of the blend structure. For spherical inclusions, K = 1.21 stands for the extreme case of poor adhesion; interphase adhesion takes place for values of K < 1.21. When K = 0, the adhesion is sufficient so that the polymer matrix strength will not decrease due to blending, that is,
The NN model assumes that both phases are of a no adherent type and the maximum stress is a function of either the area fraction or the volume fraction of the dispersed phase. The NN model is given by

In this work, the calculation of K values by adjusting equation (5) to the experimental data gives a measure of the adhesion between both phases.
BP model
In the BP model, the maximum tensile stress of the blend is determined by the maximum stress of the matrix, the volume fraction of the dispersed phase and the effective load-bearing cross section

B is a parameter that relates the load-bearing capacity of the disperse phase and depends on the size of the contact surface between the polymer and the disperse phase and on the properties of the interphase that is formed. The lower the B parameter the lower is the adhesion between phase (i.e. B = 0 no adhesion case). The highest the B is, the better is the adhesion between the phases. The phase aggregation decreases the surface available for the polymer and, therefore, drives a decrease in the value of B. 3 The calculation of this factor, B, allows the estimation of the load-bearing capacity of the dispersed phase in the blend (Table 1).
Models used in this work to interpret blend structure.
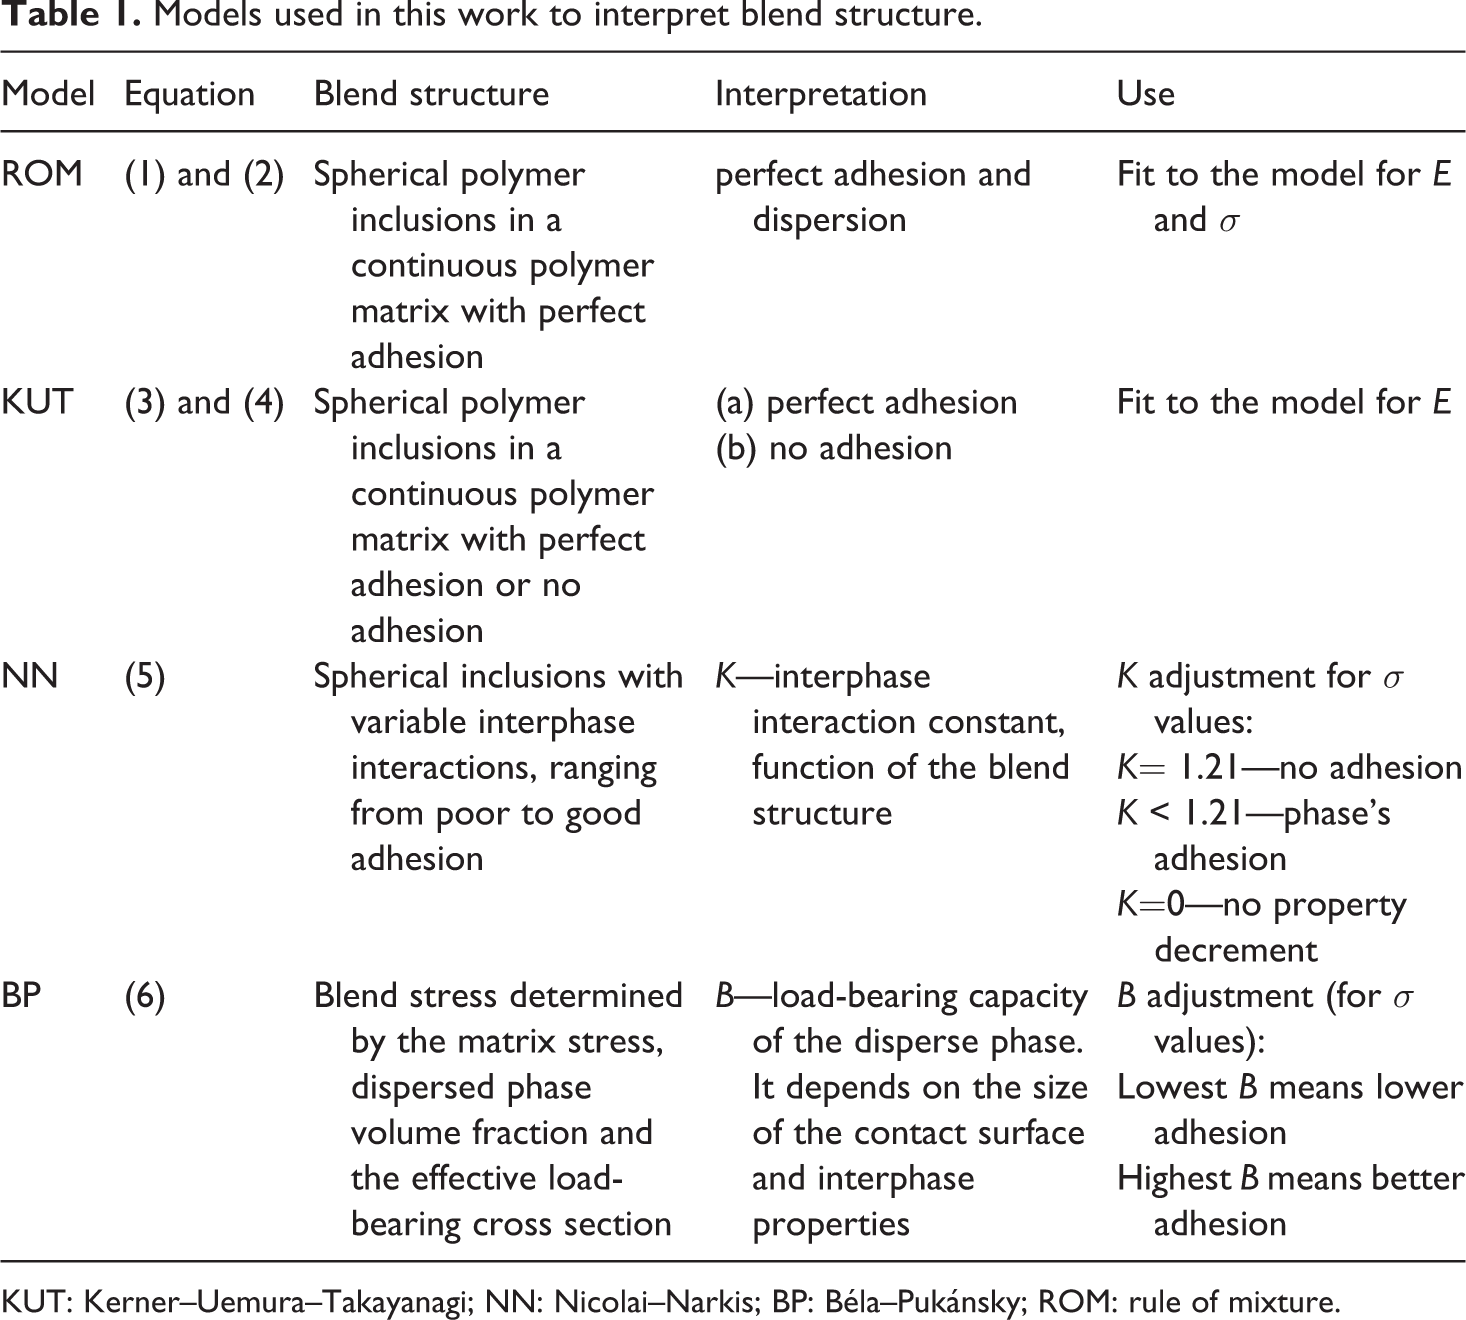
KUT: Kerner–Uemura–Takayanagi; NN: Nicolai–Narkis; BP: Béla–Pukánsky; ROM: rule of mixture.
Experimental work
Materials
The polymers used in this work are: PHA, under the trade name PHI002, manufactured by Natureplast (France) PLA, under the trade name Ingeo Biopolymer 3251D, manufactured by NatureWorks LLC (USA)
The manufacturers provided the data properties as presented in Table 2.
Raw material manufacturer’s data sheet properties values.
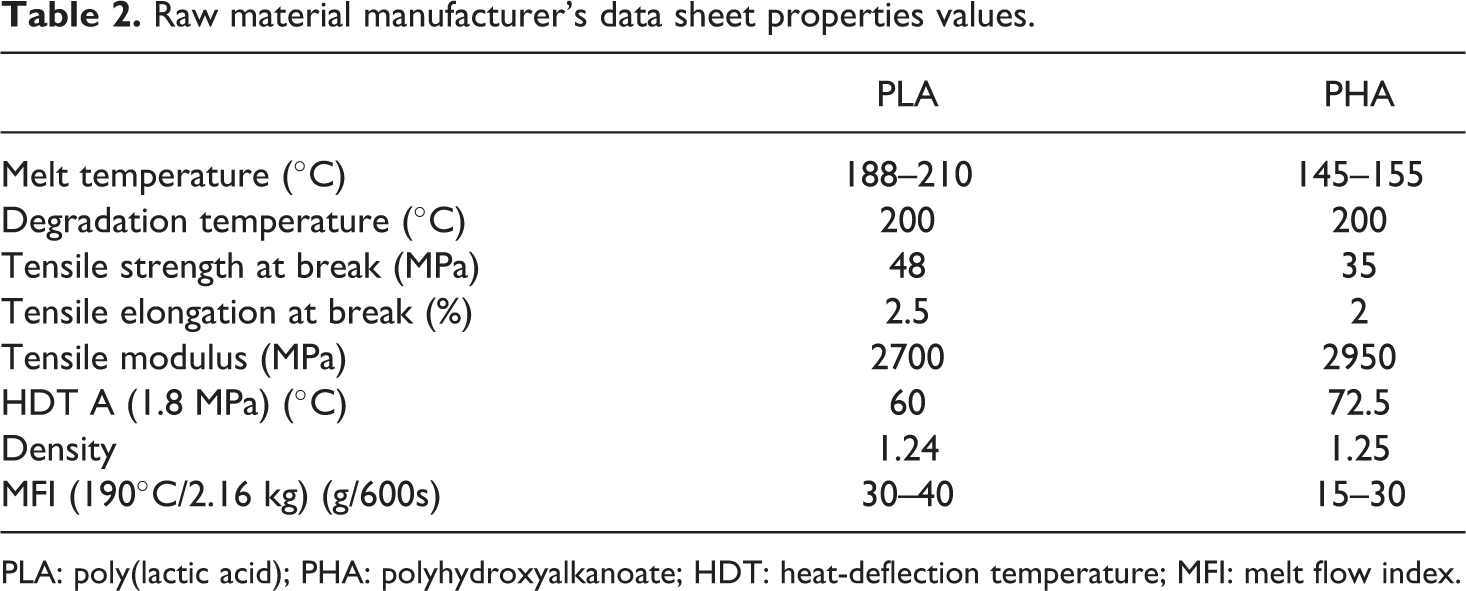
PLA: poly(lactic acid); PHA: polyhydroxyalkanoate; HDT: heat-deflection temperature; MFI: melt flow index.
Blends preparation
The polymers were oven-dried at 60°C for 24 h before processing and kept in separate ziploc bags. Just before the injection, the polymers are weighed and then mixed using a home-made rotational drum. The blend is then injected into a Ferromatik Milacron K85 (Ferromatik Milacron, GmbH, Germany) injection machineused to produce tensile test specimens.
The mold temperature was set at 20°C and the injection temperature profile is presented in Figure 1.
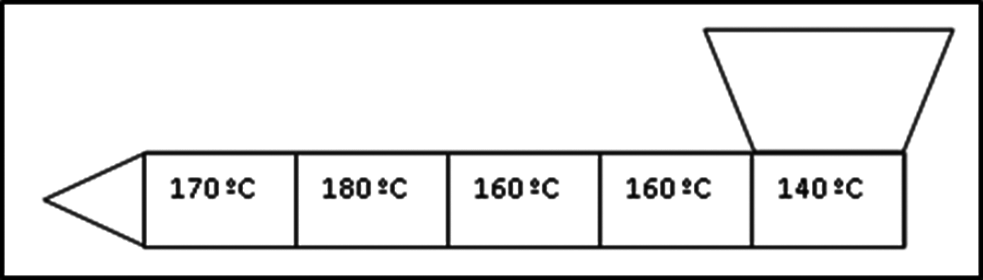
Injection temperature profile.
The temperature profile was established by combining the melting temperature of the polymers, the degradation temperature and the injection molding conditions suggested by the supplier’s datasheets. The other injection parameter is the injection velocity: 20 mm/s (corresponding to an injection flow rate of 6.3 cm3/s). Eleven different samples were prepared with intervals of 10 wt% of variation of the material’s ratios, starting in PHA/PLA ratio of: [100:0] (neat PHA)and ending at PHA/PLA ratio of [0:100] (neat PLA).
The blends were injection molded in the form of specimens with the following dimensions (according to the respective standard): Flexural and HDT specimens: 12 × 150 × 6 mm3 prismatic bars; Impact specimens: Ø60 × 2 mm discs; Tensile specimen (type II): dog-bone-shaped specimen with a reference cross section of 6 × 4 mm2 and 57 length; and a grip cross section of 19 × 4 mm2 and overall length of 183 mm.
Mechanical testing
Flexural properties
A Universal Tiratest 2705 5 kN machine (Tira GmbH, Germany) was used to measure the flexural properties according to ASTM D790 standard. A 3-point flexural test has been used, with a crosshead speed of 2.56 mm/min and a spam of 96 mm. Tests were performed in a standard laboratory atmosphere of 23 ± 2°C and 50 ± 5% relative humidity. The envisaged flexural properties assessed were the initial modulus, the maximum stress and the strain at maxim stress. At least 11 specimens were tested for each blend composition.
Tensile properties
To measure the tensile properties according to ASTM D638, a universal mechanical testing machine Shimadzu AG-X (Shimadzu Corporation - Scientific Instruments, Japan) 100 kN, equipped with a 50-mm Shimadzu extensometer, was used. A crosshead velocity of 5 mm/min was used, and the testes were performed in a standard laboratory atmosphere of 23 ± 2°C and 50 ± 5% relative humidity. A grip distance of 150 mm was used. The envisaged tensile properties assessed were the initial modulus, the maximum/yield stress and the strain at break. At least 11 specimens were tested for each blend composition.
Impact properties
Instrumented impact tests are performed according ISO 6603-2 standard in a CEAST Fractovis plus (Instron, USA) instrumented falling weight impact machine (velocity of 1 m/s and fall mass of 20 kg). All performed tests were carried out in a standard laboratory atmosphere of 23 ± 2°C and 50 ± 5% relative humidity. From the force–displacement curve, the impact toughness was calculated. The impact data presented are the average of seven measurements.
Heat-deflection temperature (HDT) measurements
To measure the HDT, according to ISO 75-2, a RAY-RAN HDT apparatus (Ray-Ran, United Kingdom. Ray-Ran HDT/Vicat 4 station apparatus) was used. This test used the method HDT A with an applied stress state of 1.8 MPa and an increasing temperature speed of 120°C/h. The tests were carried out in a standard laboratory atmosphere of 23 ± 2°C and 50 ± 5% relative humidity. The presented HDT results are the average values of three measurements.
Results and discussion
The results of the tensile tests of the PHA/PLA blends are given in Table 3.
Tensile properties of PHA/PLA blends.
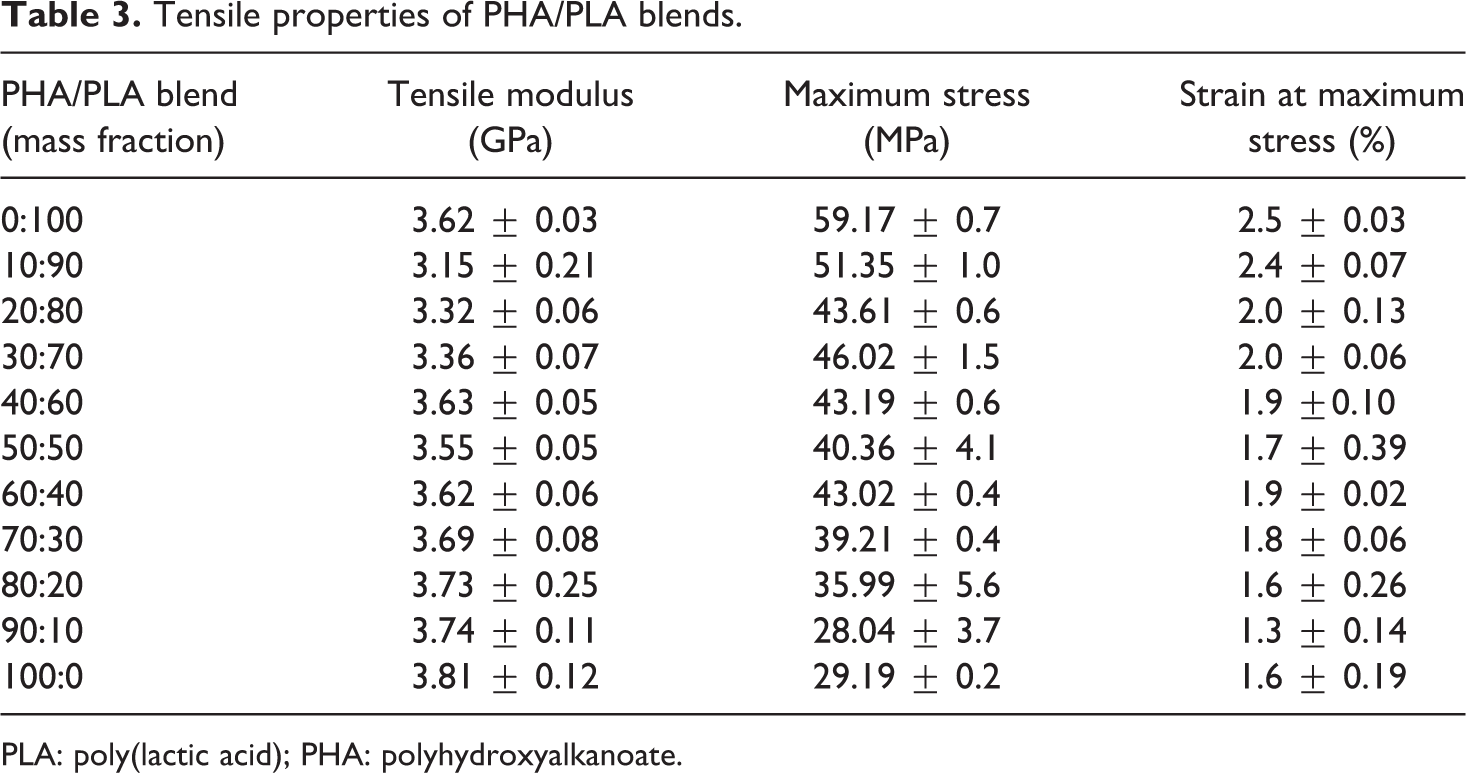
PLA: poly(lactic acid); PHA: polyhydroxyalkanoate.
Based on the predictive models, the estimated mechanical properties are presented in Table 4.
Predicted tensile modulus.
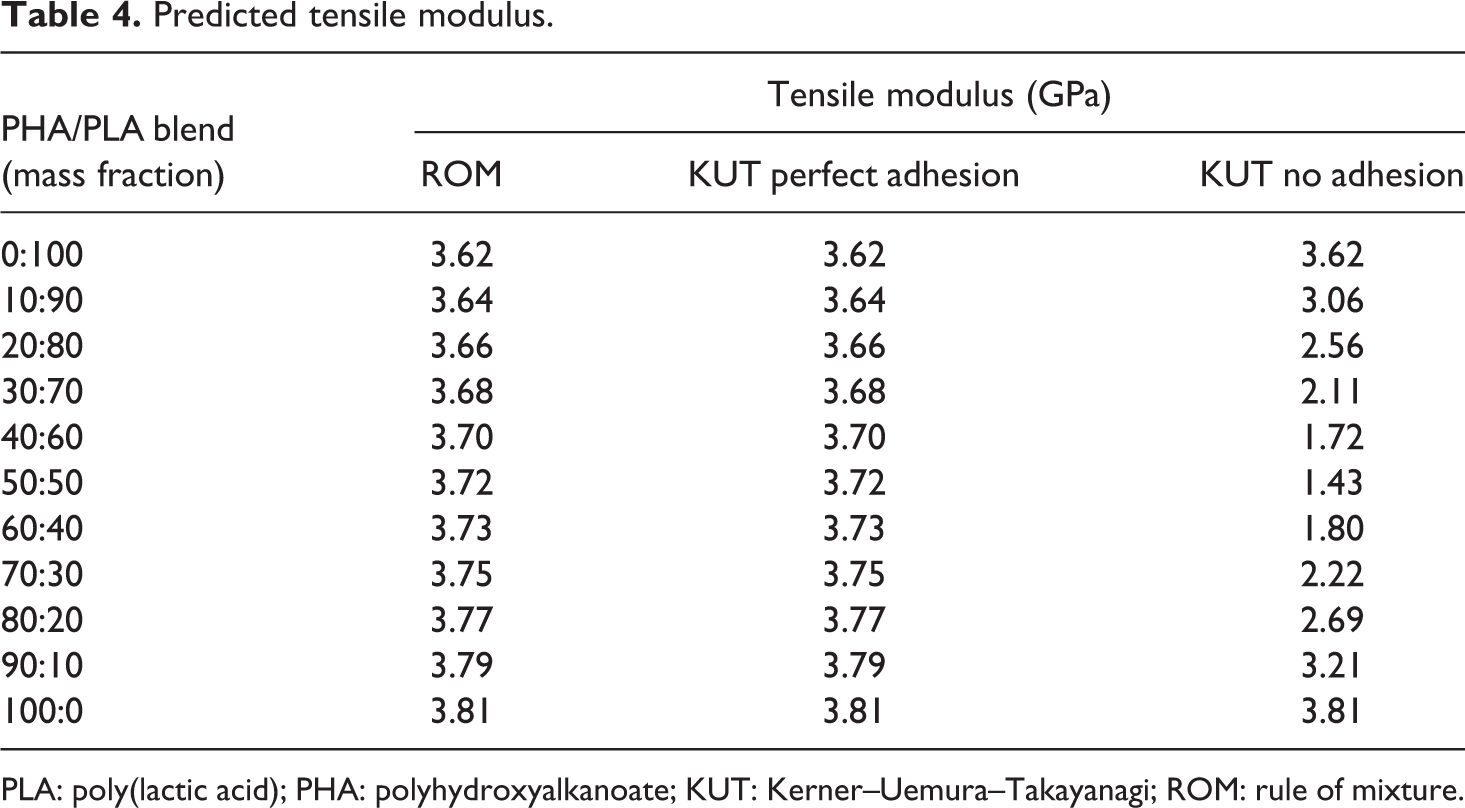
PLA: poly(lactic acid); PHA: polyhydroxyalkanoate; KUT: Kerner–Uemura–Takayanagi; ROM: rule of mixture.
Figure 2 shows the evolution of the initial modulus, E, with the PHA weight fraction, based on the data from Tables 2 and 3.
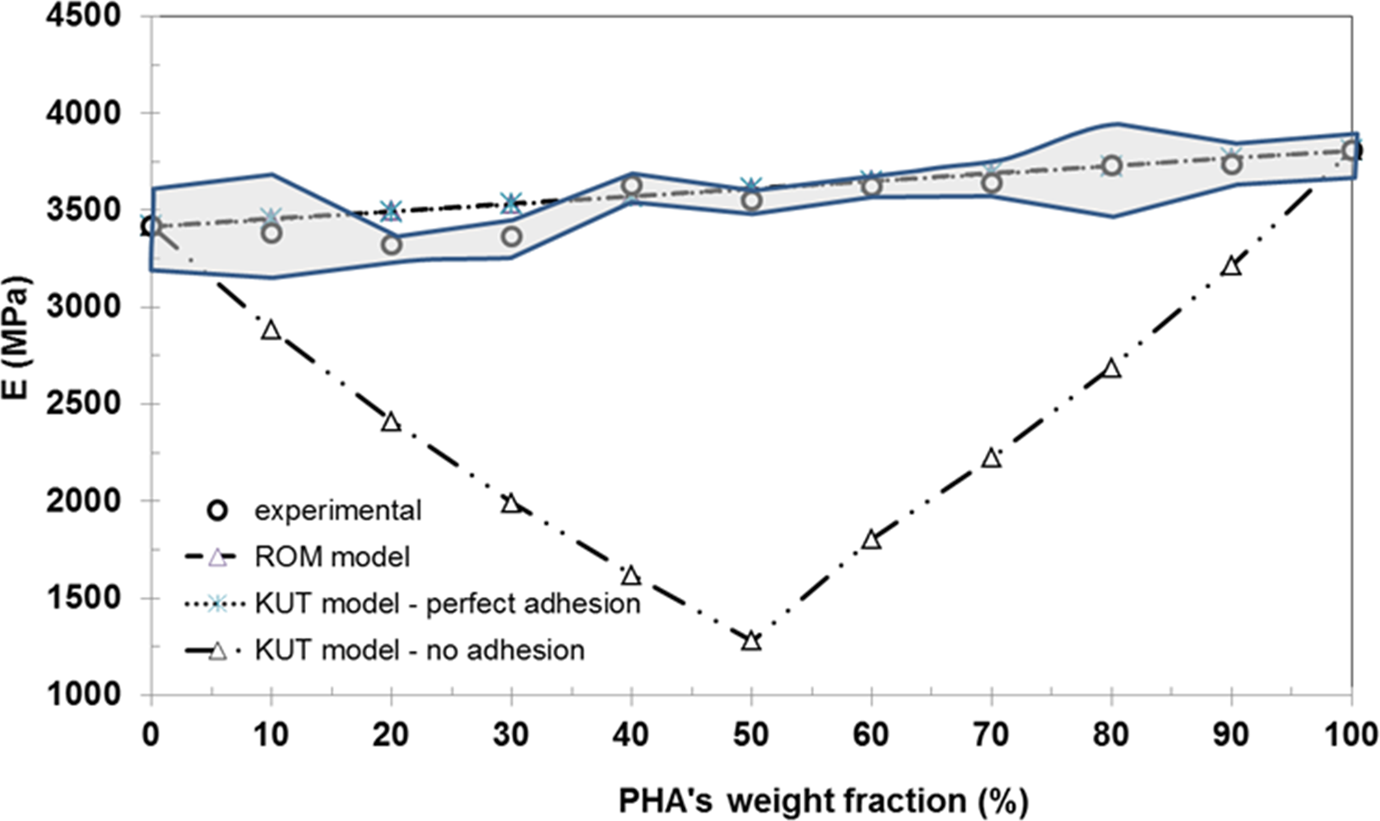
Tensile initial modulus, E, results and predicted values from models.
The increase in PHA on the blend results in a general increase in the initial tensile modulus. This is expected since the initial modulus of PHA is slightly higher than PLA. Figure 2 also presents the predictions of E based on the above-mentioned models: ROM and KUT models are perfect with no adhesion between the phases. Two main issues can be observed: (i) the KUT model with no adhesion does not give good predictions of E; (ii) both the ROM and the KUT models with perfect adhesion give good predictions of the variation in E with the weight faction of PLA in the blend. The maximum deviation between the KUT perfect adhesion prediction and the experimental value is about 5%. These results anticipate a good adhesion between both the phases in the PHA/PLA blends. Nevertheless, for low levels of incorporation of PHA (up to 30%), where PLA is expectantly the matrix, the experimental data seem to deviate slightly from the perfect adhesion models, suggesting a decrease in the adhesion between both polymeric phases when PHA is the disperse phase.
The maximum stress of the blends can also be estimated from the above presented prediction models. From the NN and BP models, the parameters K and B can be calculated giving estimations of the interphase interaction and of the load-bearing capacity of the disperse phase, respectively. The calculated values are expressed in Table 5 for each blend, resulting from the matching of the experimental data to the model results.
Adjusted values for K and B for PLA/PHA blends.
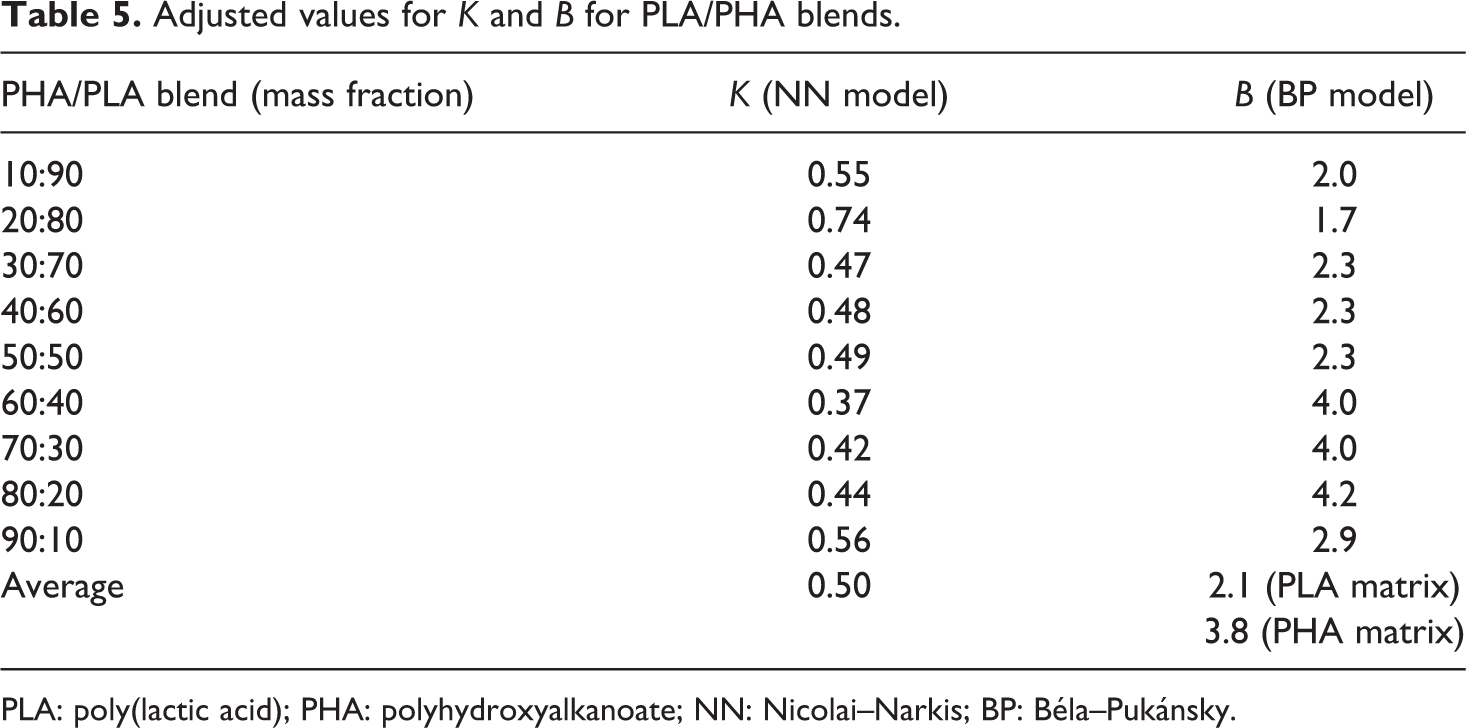
PLA: poly(lactic acid); PHA: polyhydroxyalkanoate; NN: Nicolai–Narkis; BP: Béla–Pukánsky.
Figure 3 shows the variations in K and B with the weight fraction of PHA. K values are always lower than 1.21, meaning that a good adhesion between both the phases is achieved. The values of B parameter are also relatively high, indicating a good adhesion between the phases. Furthermore, in the PLA fraction of 50–60%, the values of K show a drop and that of B a sudden increment that can be attributed to phase inversion in the blends. Again, for the lower levels of incorporation of PHA (PHA as disperse phase), the K values are higher indicating a lower adhesion between both phases when PLA is the matrix. For this dilution regime, the B values are lower, indicating a lower load-bearing capacity of the PHA disperse phase, also due to the low tensile strength of this phase.
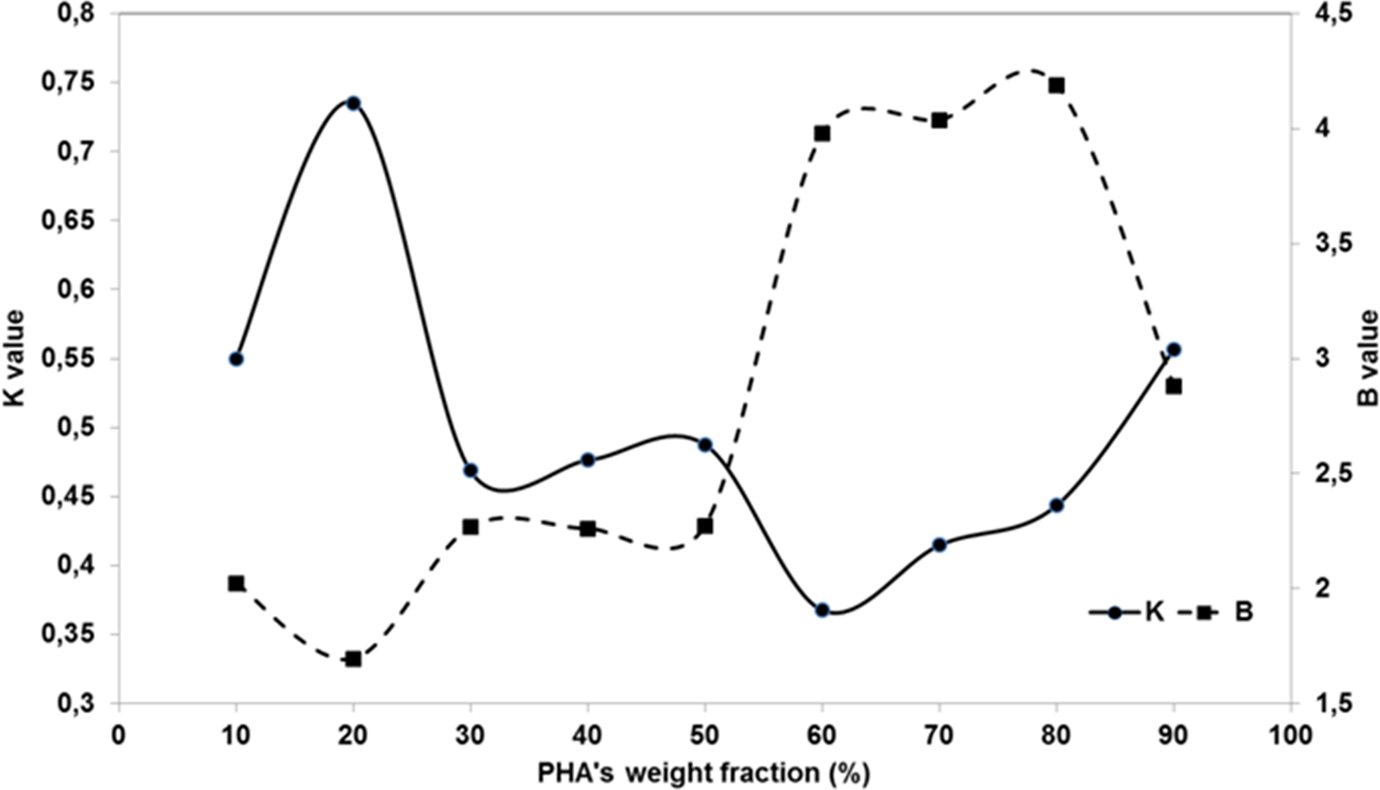
Variations in K and B parameters of NN and BP models with weight fraction of PHA. PHA: polyhydroxyalkanoate; NN: Nicolai–Narkis; BP: Béla–Pukánsky.
Table 6 presents the predictions of the tensile stress for ROM, NN (with different K values) and BP (with average B value) models for the various PHA/PLA mass fractions. For percentages of incorporation of PHA higher than 60% (PLA as matrix), the NN and BP models do not show a good agreement with the experimental data.
Models’ predictions of maximum stress.
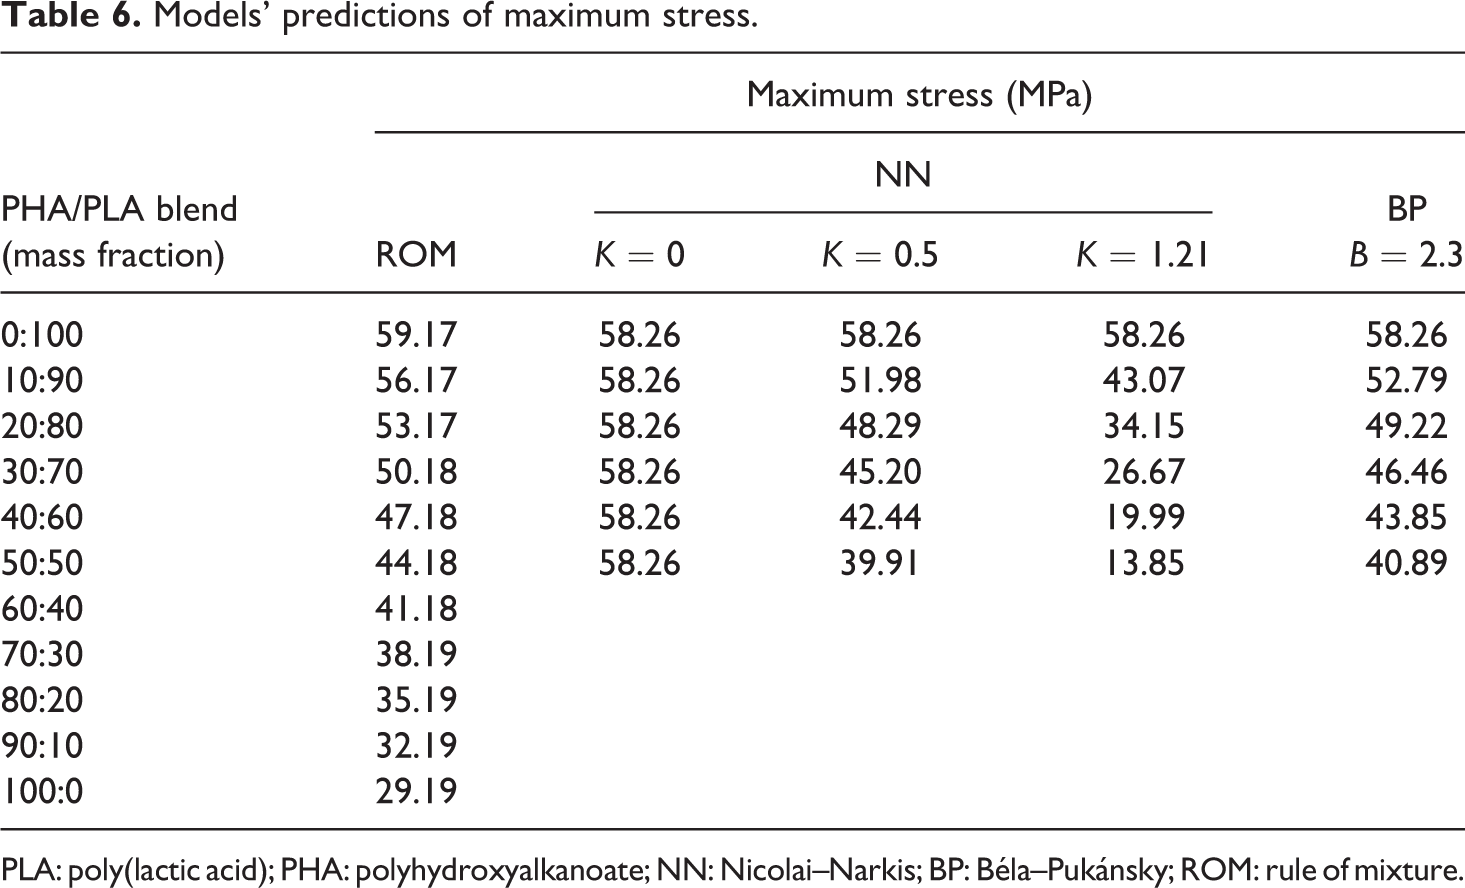
PLA: poly(lactic acid); PHA: polyhydroxyalkanoate; NN: Nicolai–Narkis; BP: Béla–Pukánsky; ROM: rule of mixture.
Figure 4 shows the variations in the tensile maximum stress with percentage of PHA and respective model predictions.
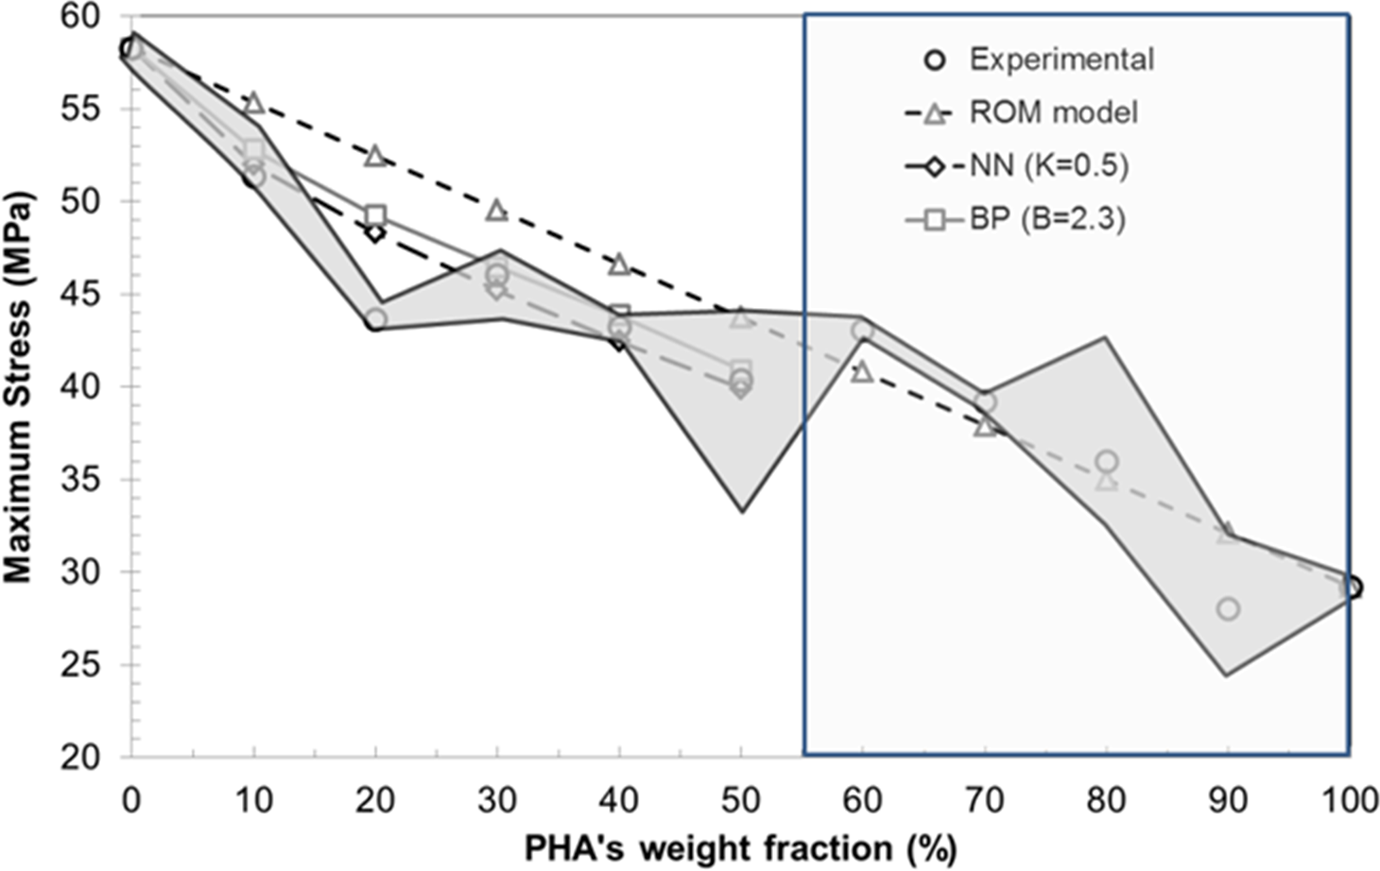
Tensile maximum stress results and predicted values.
The increase in PHA on the blends results in a general decrease in the maximum stress of the blends. The ROM model fits well with the experimental data for the larger amounts of PHA incorporation, suggesting a very good adhesion between PHA matrix and the PLA disperse phase. For low percentage of PHA, the phase adhesion is small, and the experimental data deviate from ROM predictions. In this regime, the values of K and B were adjusted in order to fit better the models’ predictions. Values of K = 0.5 and B = 2.3 were found to be 50% of PHA (above this value, a best fit is obtained for K = −1.2 and B = 4.0). These values regarding both NN and BP models corroborate that the interphase adhesion is promoted when PLA is the disperse phase.
The flexural test results of the blends are given in Table 7.
Flexural properties of PHA/PLA blends.
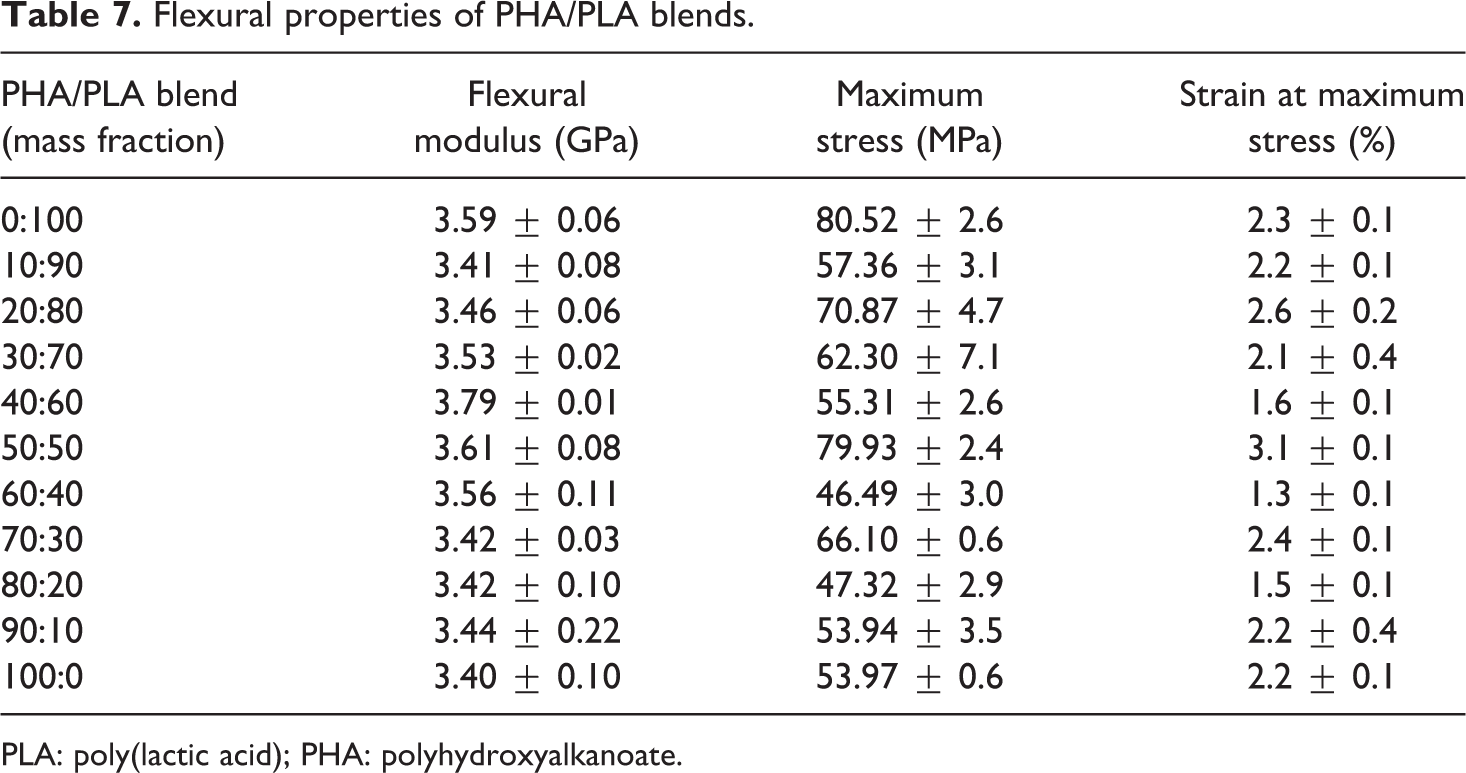
PLA: poly(lactic acid); PHA: polyhydroxyalkanoate.
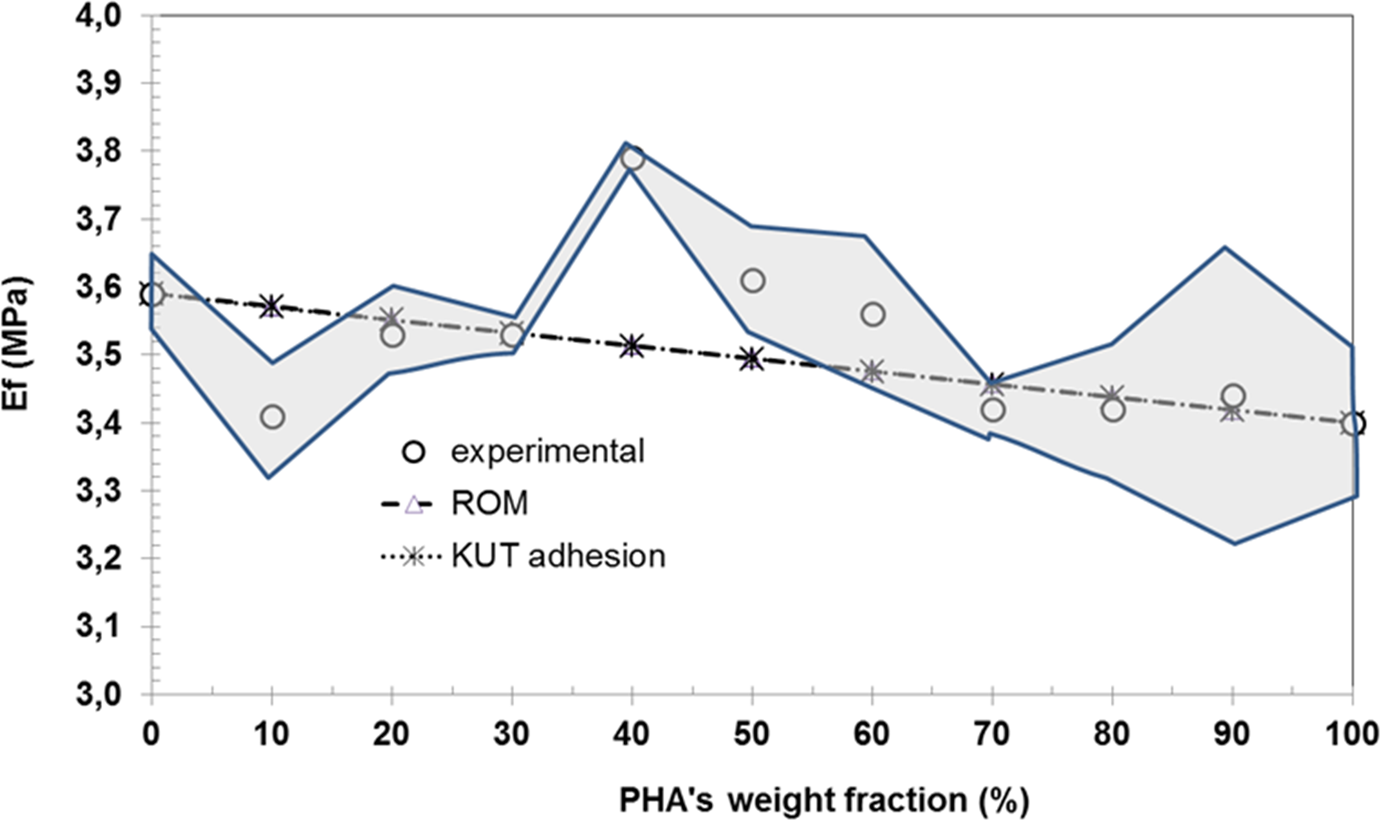
The experimental variation in the flexural modulus as a function of the PHA fraction is small (3.52%).
Figure 5 shows the variations in E f, with percentage of PHA and respective models’ predictions. Conversely, to the tensile modulus, here for the flexural modulus, the ROM does not apply over the full range of compositions. Only for high percentage of incorporation of PHA (as matrix), the ROM is valid. In the case of PHA as disperse phase, the variations in E f with PHA fraction are not conclusive. The E f of the blends seems to be more sensitive to the morphology of the low-fraction component (e.g. dispersion, size and aspect ratio).
Flexural Young’s modulus results and predicted values.
Also, ROM and KUT adhesion models give same predictions of E f as a function of PHA fraction.
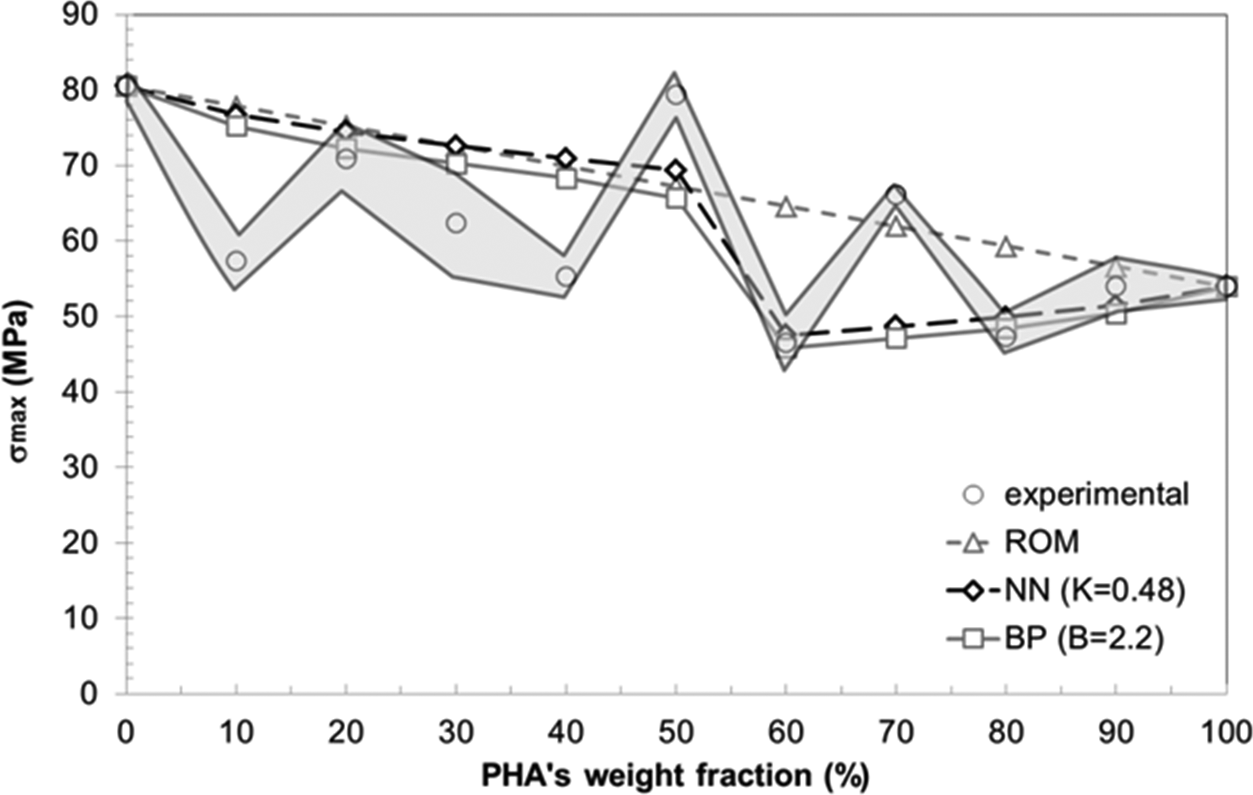
Figure 6 shows the variations in maximum flexural stress with percentage of PHA and respective models’ predictions. Again, the increase in PHA in the blends drives to a general decrease in the maximum stress. As for the flexural modulus, the variations in σ max with percentage of PHA are subjected to high fluctuations. In general, the ROM does not give satisfactory predictions, even for larger amounts of incorporation of PHA. For low percentage of PHA, the experimental values are always smaller than the ones predicted by ROM, thus evidencing a low level of adhesion between both the phases. This also happened in the tensile response, when PHA is the disperse phase, the adhesion is less. In this regime, the values of K and B were also adjusted in order to better fit the models’ predictions. Values of K = 0.48 and B = 2.2 were found to be 50% of PHA for both NN and BP models, respectively. These values are very close to the obtained tensile tests (K = 0.45 and B = 2.3). Adjustments for the case of PLA as disperse phase give K = 0.22 and B = 2.6. The K value is reduced substantially when compared with PHA as disperse phase, this means a better adhesion between the phases; B slightly increases as a reflex of this better adhesion, but the load-bearing capacity of the disperse phase seems to remain unchanged. When comparing with the tensile test results of K = −1.2 and B = 4.0, it seems that under flexural loading, the adhesion and load-bearing capacity of the PLA disperse phase are much smaller than that of the tensile loading.
Flexural maximum stress results and predicted values.
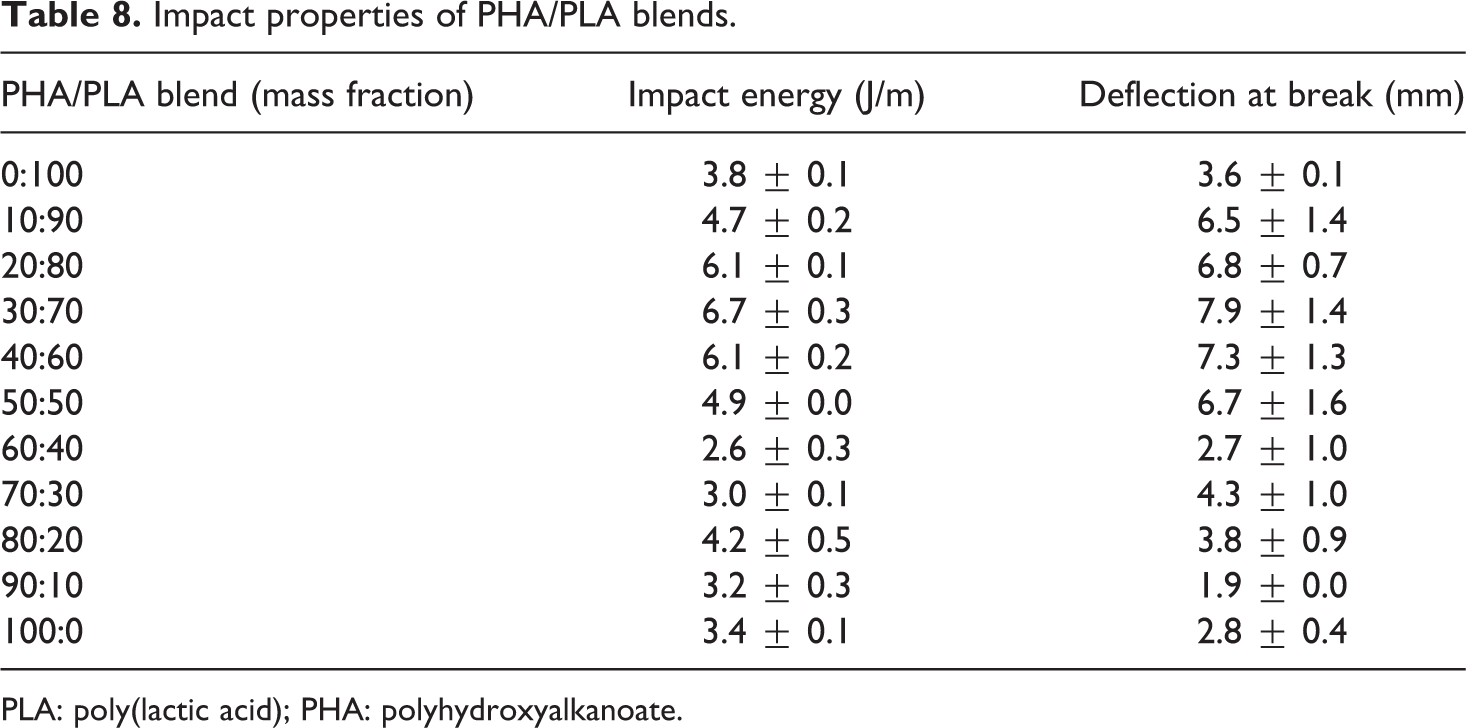
The impact results of the tested blends are given in Table 8. As an example, Figure 7 presents the impact force over time for the blends 70:30 and 30:70 (PHA:PLA). The latter blend shows higher impact force levels, but lower deformation capability.
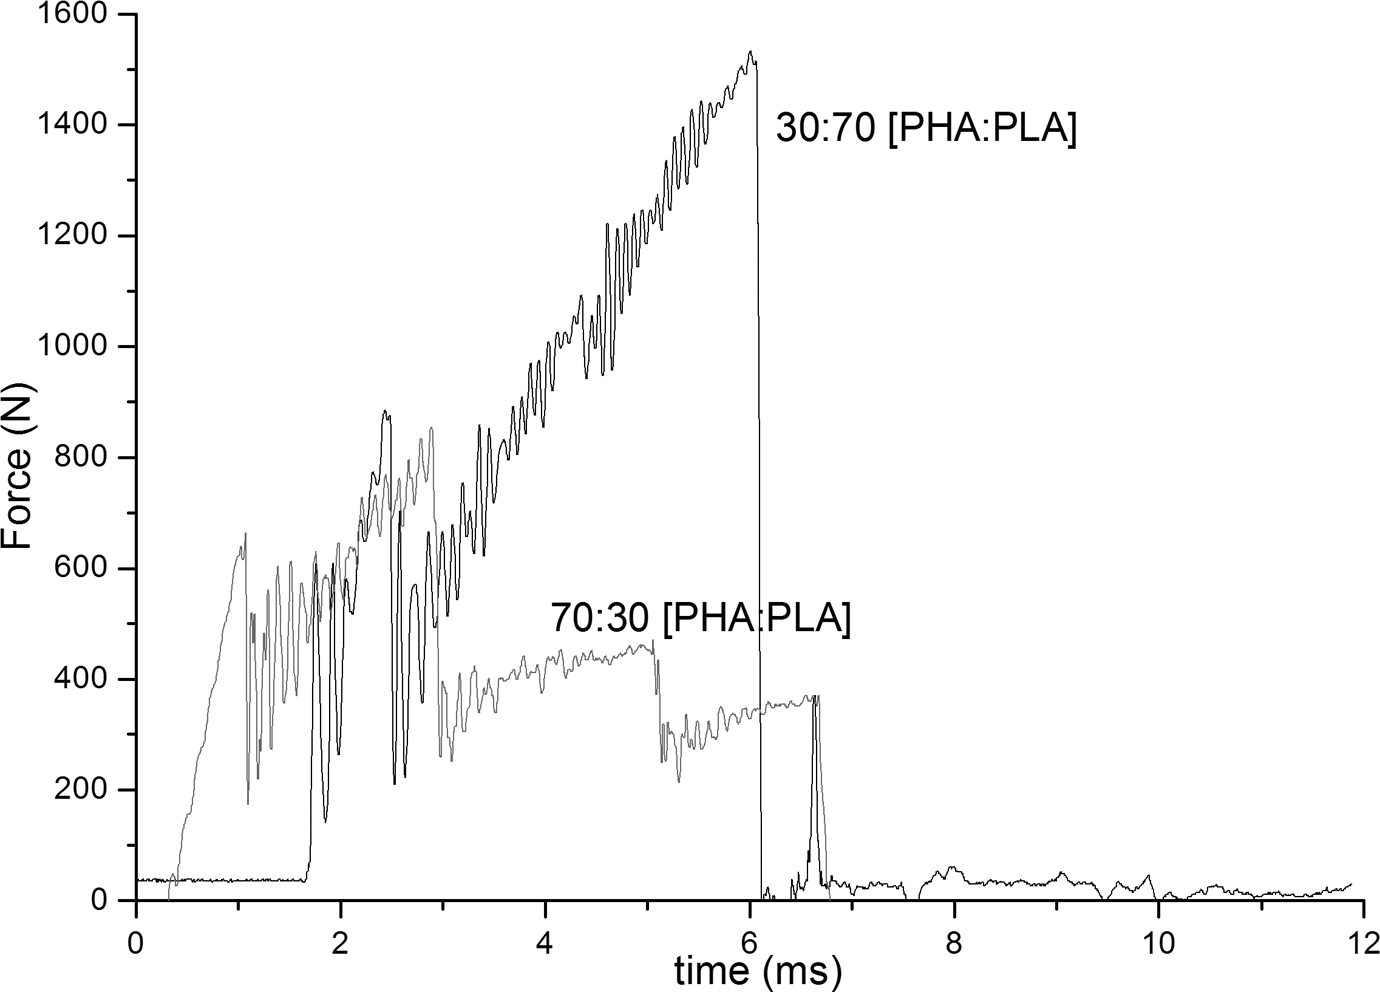
Impact results of the 30/70 and 70/30 (PHA/PLA) blends. PLA: poly(lactic acid); PHA: polyhydroxyalkanoate.
Impact properties of PHA/PLA blends.
PLA: poly(lactic acid); PHA: polyhydroxyalkanoate.
The impact energy establishes the amount of energy that the material can absorb until it breaks. Table 8 also shows the deflection at break.
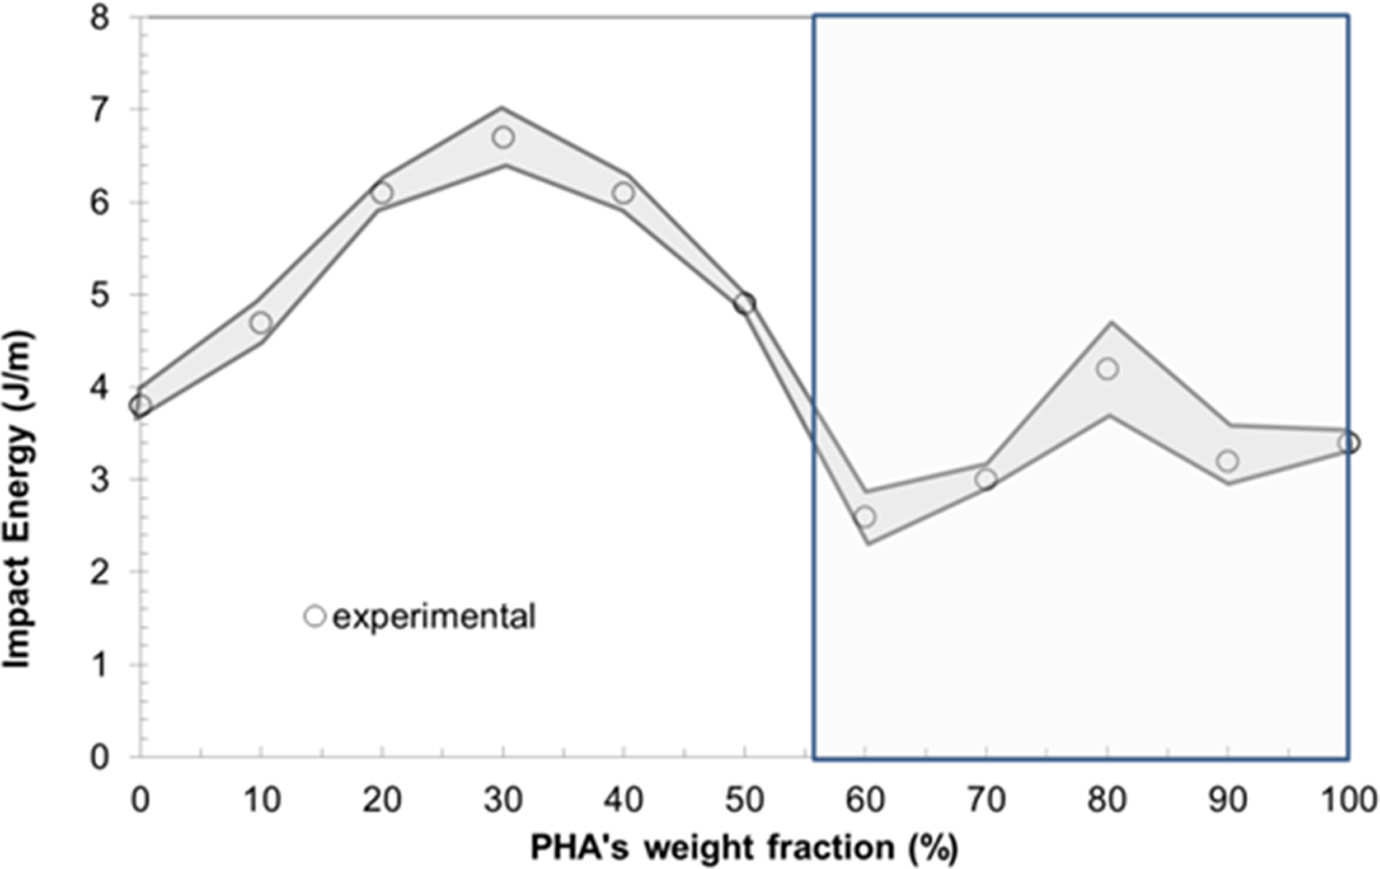
The impact energy values vary by 157.7% over the entire blend composition. This is quite surprising as both neat polymers show quite similar impact energies (PLA has a higher value of approximately 12% of 3.8 J/m). Figure 8 shows the variations in the impact energy with blend composition. Two local maximum can be found corresponding to different types of matrices. Phase inversion appears to occur for 50–60% of PHA, as already mentioned. But under impact conditions, this is more evident. It is also interesting to observe that for blends with PHA weight fraction lower that 50% (i.e. PLA matrix and PHA as disperse phase), the impact strength of the blends is substantially higher than the pure base polymers. The highest synergetic effect is found when the PLA is the matrix and PHA is the disperse phase for the blend PHA/PLA of 30/70. The second maximum is found for the inverse composition of 70/30.
Impact strength (experimental).
The toughening of polymer blends has been related to the ligament thickness, that is, the distance between the disperse phase particles. This ligament thickness is dependent upon the amount of disperse phase and the diameter of the filled particles. The morphology of the interphase region is different from the bulk matrices, which can lead to much better impact energy for small values of the ligament thickness (i.e. high amount of small size disperse phase).
The variations in the elongation at break (at impact velocity) with blend composition show a similar evolution as the impact energy, as depicted in Figure 9.
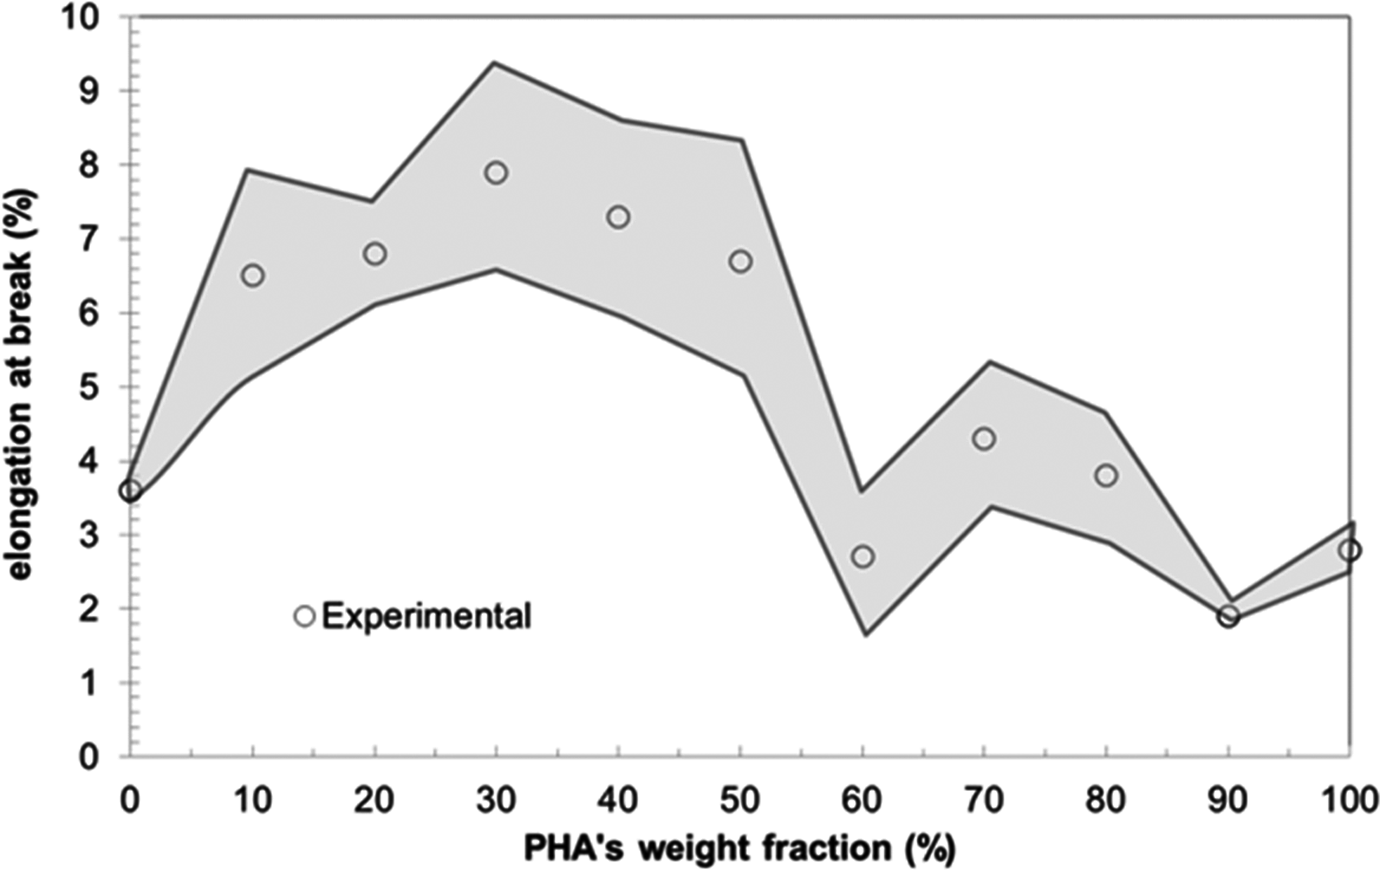
Impact elongation at break (experimental).
The impact of elongation at break varies by 315.8% over the entire blend composition. Again, this is quite surprising, as PLA shows an elongation at break of only 28.6% higher than that of PHA (and of 3.6%). Noda et al. 11 have reported a similar effect in the addition of PHA to PLA and observed that when 10% PHA was added to PLA, the percentage elongation of the blends improved significantly. This was attributed to the increase in the amorphous phase of the blend. In our case, the maximum elongation was observed for the (PHA/PLA) 30/70 weight fraction, where the elongation was 119 and 182% higher than that of neat PLA and PHA, respectively.
The HDT results are given in Table 9 and Figure 10 for all blend compositions.
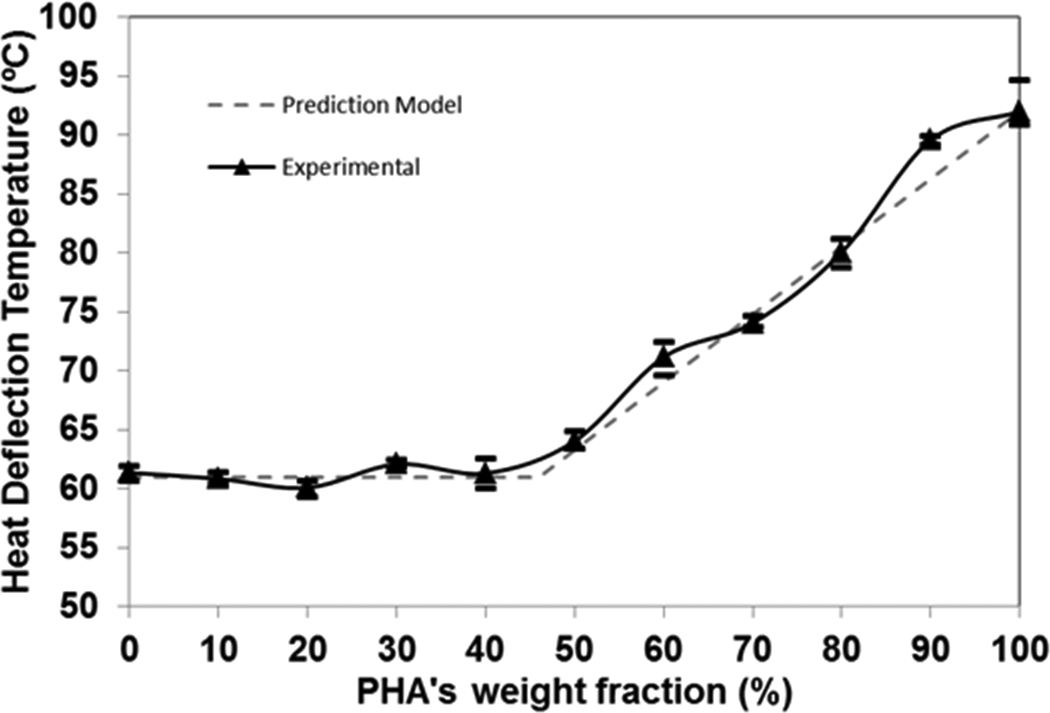
Experimental and predicted HDT evolution over PHA composition. PHA: polyhydroxyalkanoate; HDT: heat-deflection temperature.
HDT of PHA/PLA blends.
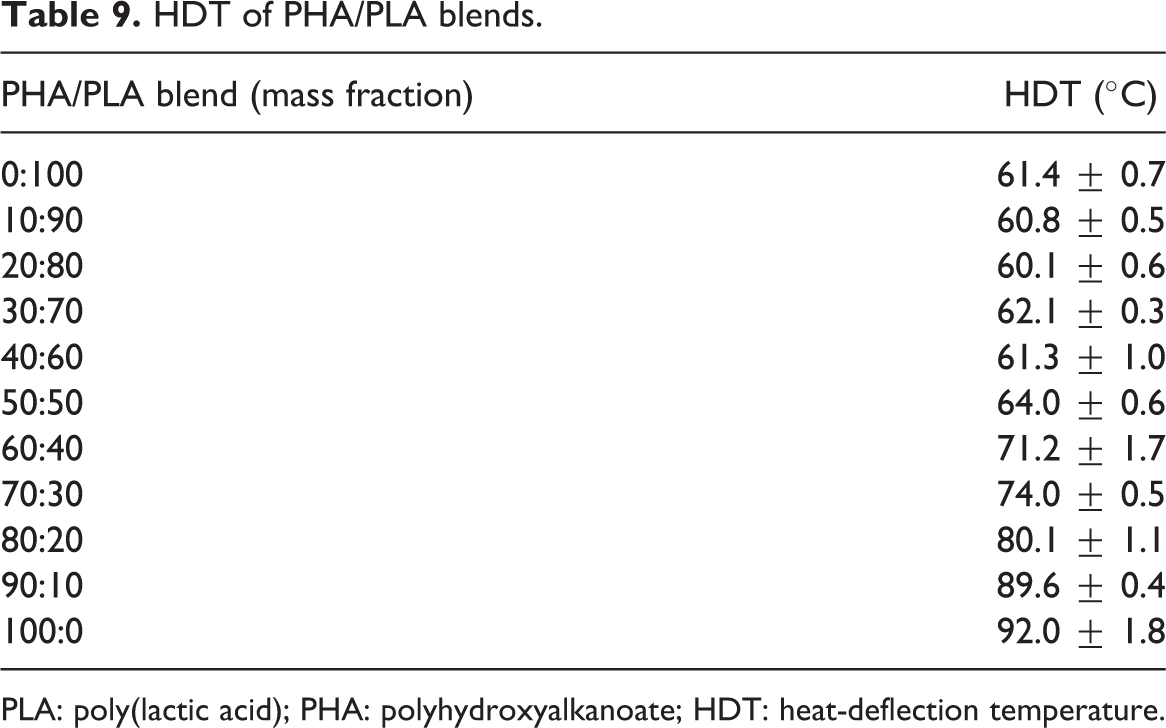
PLA: poly(lactic acid); PHA: polyhydroxyalkanoate; HDT: heat-deflection temperature.
PLA (61.4°C) has an HDT substantially lower than PHA (92.0°C). For the PHA/PLA blends, the HDT increases with the increment in the percentage of incorporation of PHA. Up to 50% PHA (PLA as matrix), the HDT is practically constant and equal to PLA value. Over this point (PHA matrix), the HDT of the polymer blends increases linearly with the percentage of addition of PHA.
This behavior is dependent upon the amount of disperse phase. It is possible to verify, as seen in the other tests, that at around 50% PHA, a phase inversion occurs and the thermal behavior changes. For weight fractions of PHA lower than 50%, the PLA is the matrix and dictates the HDT value. When the PHA becomes the matrix of the blend (above 50% wf), the HDT increases and reaches a value close to the neat PHA value.
Composition determines the behavior of the PHA/PLA blends, as expected. It also affects the morphology development of both the phases with consequences on the response of the blends. Next work will report the effect of composition upon the developed morphologies of the blends.
Conclusions
The properties of biodegradable polymers such as PHA and PLA can be tailored to achieve a given performance. PHA/PLA blends over the full ratio of compositions were investigated in this work. The blends were injection molded and their mechanical (tensile, flexural and impact) and thermal (HDT) behaviors were assessed. The increment in PHA fraction decreases both the tensile and flexural moduli of the blends. For the tensile modulus, a linear relationship is found, following the rules of mixtures (or a KUT model with perfect adhesion between phases), denoting a good adhesion between the phases over the composition range. Conversely, for the flexural modulus, the ROM does not apply over the full range of compositions; and only for high percentage of PHA, the ROM models become valid and evidence good phase adhesion. E f of the blends seems to be more sensitive to the morphology of the low fraction component (e.g. dispersion, size and aspect ratio) than the tensile one. The incorporation of PHA in the blend leads to a decrease in the flexural modulus but, at the same time, increases the tensile modulus. The maximum stress of the blends can be estimated from the presented prediction models.
Prediction models and material property characterization allowed unambiguous detection of the interfacial behavior of the polymer blends.
PHA/PLA blends can have good impact properties. The best impact properties are achieved with a 30/70 (PHA/PLA) weight fraction ratio blend. The highest synergetic effect on impact is found when the PLA is the matrix and PHA is the disperse phase.
Up to 50% PHA (PLA as matrix), the HDT is practically constant and equal to the PLA value. Over this point (PHA matrix), the HDT of the polymer blends increases linearly with the percentage of addition of PHA.
Next studies will focus on the inclusion of natural fibers to obtain high-performance biocomposites.
Footnotes
Funding
This work was financially supported by the Portuguese Science and Technology Foundation (FCT) by the project MIT-Pt/EDAM-SMS/0030/2008 Assessment and Development of integrated Systems for Electric Vehicles and by the Portuguese Science and Technology Foundation (FCT; PhD grant SFRH/BD/42978/2008; NCL).