
Abstract
Polylactic acid nanocomposite was prepared by melt blending polylactic acid (PLA) and transition metal ion (TMI)-modified montmorillonite (MMT; TMI-MMT) using a co-rotating conical twin-screw microcompounder attached with a mini injection moulder. MMT was modified by ion exchange reaction using TMI. Intercalation morphology of TMI on MMT was investigated by x-ray diffraction (XRD) and transmission electron microscopic analyses. XRD patterns indicated penetration of the metal ions into the MMT interlayer and formation of intercalated structure. In order to increase the adsorbed amount of Zn2+ and Cu2+ ions, MMT was previously intercalated with ethylene diamine. Thermogravimetric analysis indicated an increase in the onset of degradation temperature of nanocomposites when compared with virgin PLA. The isothermal cold crystallization kinetics of PLA/TMI-MMT nanocomposites was investigated by differential scanning calorimetry in the temperature range of 100–120°C and the development of relative crystallinity with the crystallization time was analyzed by the Avrami equation. PLA nanocomposites reinforced with TMI-MMT showed a significant increase in tensile and flexural modulus and impact strength when compared with virgin PLA. The flammability studies of PLA/TMI-MMT nanocomposites displayed slow rate of burning and enhanced carbonaceous char formation when compared with virgin PLA matrix.
Keywords
Introduction
In recent years, biopolymer nanocomposites with improved barrier, mechanical, thermal and fire retardation properties have attracted a great deal of attention from both academic and industrial sectors. 1,2 Polymer nanocomposites can be considered as filled materials with at least one dimension of the filler in the nanometre range. Nanoclays have been used as nanoscale fillers in polylactic acid (PLA) and the physical and mechanical properties of the resulting materials largely depend on its solid-state morphology and the level of crystallinity. As organoclays can be intercalated or exfoliated by polymer molecules, the enhancement in modulus, toughness and barrier properties can be achieved at relatively low filler loading (≤5%) in nanocomposites when compared with 30–50 wt% of fillers in the case of conventional composites. 3
The major reason for the limited use of organoclays is their low thermal stability, related to the degradation of organic surfactants in organoclays. Usually, above 170°C, the organic components in organoclays (e.g. quaternary amine surfactant) start to decompose via the Hoffman elimination process 4 releasing combustible alkenes. At the present time, the mechanism of fire retardant (FR) activity in organoclays is not completely understood. It has been suggested that the FR mechanism is mostly of physical nature. Indeed, a variety of polymer–organoclay nanocomposites can be attributed to the presence of non-flammable inorganic particles, higher melt viscosity, reduced gas permeability and increased char formation, which minimize the flow of burning polymer melt and suppress combustion via reduced fuel feed rates. The combustion residue, formed during the burning of clay-filled nanocomposites, comprised layered carbonaceous-silicate structures. In addition, these layered structures can act as a thermal insulator. 5
Many studies deal with the montmorillonite (MMT) intercalation with the metal cations. 6,7 Modification of MMT by adsorption of transition metal ions (TMIs) such as zinc and copper ions may increase the catalytic efficiency of MMT and also be proven to enhance fire retardancy. It appears that the presence of TMI enhances charring and slows down thermal degradation. TMI-modified MMT (TMI-MMT) can significantly improve the thermal stability, reduce the release rate of volatiles products from thermal degradation and increase the content of solid residues upon heating at 800°C in air. 8,9
Understanding of crystallization kinetics is also important because the control of crystallization factors allows for the design of materials with desirable properties. In recent years, there were some articles that discussed on the crystallization kinetics. 10 –12 The physical and mechanical properties of crystallizable PLA largely depend on its solid-state morphology and level of crystallinity, while the crystallinity of PLA is influenced deeply by its composition. Despite extensive studies of PLA, its crystallization behaviour and crystal structure are still not completely understood. Depending on the processing conditions, PLA can crystallize into α-, β- and/or γ-forms. Crystallization of PLA from the melt or from solution under normal conditions results in its most common polymorph, the α-form, with a 103 helical chain conformation, where two chains are interacting in an orthorhombic unit cell. Under very high drawing conditions and high temperatures, 13,14 β-form crystals are obtained, which were first seen in stretched PLA fibres. The crystal structure of this polymorph is not fully solved, although it has been reported that it exists in a threefold helical conformation. The β-form was considered to have a frustrated structure, containing three chains in a unit cell. Molecular simulations suggest that neither a 31 nor a 103 helix can reasonably fit the experimental data. Thus, it has been suggested that it exists in a distorted 31 helical conformation 13 or frustrated structure with randomly oriented chains. Recently, Cartier et al. have introduced a new polymorph of PLA by epitaxial growth on hexamethylbenzene. 14 This phase is suggested to contain two antiparallel helices packed in an orthorhombic unit cell. Therefore, depending on the extent of supercooling, dynamics of the polymer chains, processing and their microenvironment, PLA chains can crystallize into different morphologies with different degrees of perfections. The different crystalline morphologies can affect the chemical stability, physical/mechanical properties and degradation rates in biodegradable polymers. Therefore, a thorough understanding of the crystallization behaviour of PLA is crucial. 15
In the present study, PLA nanocomposites were prepared using a melt blending technique. The effect of TMI-MMT on the thermal, crystallization kinetics and mechanical performance of the nanocomposites has been studied. Also, the morphology of the nanocomposites has been investigated employing x-ray diffraction (XRD) and transmission electron microscopy.
We have prepared a series of TMI-MMT, namely zinc nitrate (ZnNO3)/MMT solvated by ethylene diamine (EDA) and copper sulphate (CuSO4)/MMT solvated by EDA, out of which ZnNO3/MMT solvated by EDA was found to yield better intercalation morphology in the formation of PLA nanocomposites. Hence, we have considered ZnNO3/MMT solvated by EDA for the evaluation of isothermal crystallization kinetics using the Avrami equation.
Experimental
Materials
PLA (Grade: 4042D) with 92%
Modification of natural MMT and preparation of nanocomposites
Modification of MMT by TMI adsorption
MMT of 20 g is dispersed in 150 ml of EDA and the resulting dispersions were mixed with 20 mmol/l of ZnNO3 and placed in an ultrasonicator at 60°C for 2 h followed by stirring at 175 r/min for 24 h at room temperature. The resulting precipitate was filtered by centrifugation for 20 min and subsequently dried at 105°C for 2 and 24 h at 80°. The resulting compounds will be ZnNO3/EDA/MMT, which is designated as TMI-MMT-1. The dried material was then grounded into powder for use as reinforcing clay in the polymer matrix. Similar procedure was followed for preparing the material CuSO4/EDA/MMT, which is designated as TMI-MMT-2.
Processing and fabrication of PLA nanocomposites
Prior to processing, PLA was dried at 50°C for 6–8 h and the nanoclay, that is, TMI-MMT-1 was dried at 80°C for 8–10 h, respectively. PLA nanocomposites were prepared using a co-rotating conical twin-screw microcompounder (DSM Xplore 15, RD Geleen, The Netherlands) attached with a mini injection moulder. The percentages of nanoclays incorporated into PLA were 1, 3, 5 and 7%. The mini extruder is equipped with a conical twin screw of length 150 mm with an L/D ratio 18 and a net capacity of 15 cc. The injection jet attached to the extruder has a maximum force capacity of 160 psi.
The processing temperature was maintained at 172, 177 and 182°C for three successive zones of the extruder with a screw speed of 40 r/min (acceleration rate: 50 r/min). Melt collected from the extruder was immediately injection moulded into specimen using a mini injection jet at a mould temperature of 40°C, a melt temperature of 175°C, an injection time of 5 s and an injection pressure of 145 psi, respectively. The resulting material is designated as PLA/TMI-MMT-1 nanocomposites. Similar procedure was followed for fabricating PLA/TMI-MMT-2 nanocomposites.
Characterization and testing analysis
Morphological analysis
Wide angle x-ray diffraction
Wide angle x-ray diffraction analysis was carried out using an x-ray diffractometer (Shimadzu XRD-700 L X Pert MPD, Kyoto, Japan) that had graphite monochromatic and a Cu Kα radiation source operated at 40 kV and 30 mA. The basal spacing or (d 001) reflection of the samples was calculated from Bragg’s equation by monitoring the diffraction angle 2θ from 1 to 10°.
Transmission electron microscopy
Ultrathin sections of the PLA nanocomposites with a thickness of about 50–70 nm were microtomed at room temperature, using a Leica Ultracut UCT microtome with a diamond knife (Leica, San Marcos, CA, UK). Subsequently, the sections were loaded onto the grits and images were taken using a transmission electron microscope (JEOL-1200 EX, JEOL Ltd, Akishima, Tokyo, Japan).
Thermal analysis
Thermogravimetric analysis
Thermogravimetric analysis (TGA) of the samples were carried out using a thermogravimetric analyzer (TGA Q50, TA equipment, TA Instruments , New Castle, DE, USA). Samples of 10 mg were heated from room temperature to 600°C at a heating rate of 10°C/min under nitrogen (N2) atmosphere. Temperature reproducibility of the equipment at 600°C is ±1°C and for non-volatile matter is ±0.1%, respectively; the corresponding initial and final degradation temperatures and percentage char in all the samples were noted.
Differential scanning calorimetry
The differential scanning calorimetry (DSC) measurements were conducted using a differential scanning calorimeter (DSC Q 20, TA equipment, USA). Samples of ≤10 mg were scanned at a heating rate of 10°C/min under a N2 atmosphere, from 20 to 180°C, to obtain the glass transition (T g), melting temperature (T m) and cold crystallization temperature (T cc). The samples were then cooled at 50°C/min to the predetermined crystallization temperature and allowed to crystallize. The high cooling rate of 50°C/min was used to minimize crystallization of PLA during cooling. The heat evolved during crystallization was recorded as a function of time. Prior to analysis, the calibration was carried out using indium as a standard reference and the reproducibility of the equipment at 180°C is ±0.1°C.
To investigate the overall kinetics of isothermal melt crystallization, the thermal properties of PLA and PLA/TMI-MMT nanocomposites and their crystallization behaviour were studied. The degree of crystallinity (X
c) of the PLA and its nanocomposites was calculated from the reheating DSC data using the following equation

where X c is the percentage of crystallinity, ΔH f is the experimental melting heat of fusion, ΔH 100% is the heat of fusion of 100% crystalline PLA and W w is the weight fraction of nanoclays.
Mechanical properties
Tensile properties of virgin PLA and its nanocomposites were tested as per ASTM D 638 using a universal testing machine (Instron 3382, Instron Corporation, Norwood, MA, USA) equipped with a 100-kN load cell. The gauge length of the specimen is 50.6 mm and the width and thickness are 13.2 and 3.2 mm, respectively. The cross head speed of the test was maintained at 50 mm/min. A minimum of five samples was tested for each formulation, which is conditioned at 23°C prior to testing.
Flexural properties were also tested using the same UTM for rectangular specimen (112 × 12.8 × 3 mm) in accordance with ASTM D790 with a span length of 46 mm and the sample was subjected to 5% flexing at a speed of 1.3 mm/min.
Izod impact testing
Impact properties of virgin PLA and its nanocomposites were also tested in an impactometer (Tinius Olsen 104, Tinius Olsen Ltd, Surrey RH1 5DH, England, UK). The test was carried out for the sample of dimensions 27 × 10.5 × 3 mm bar as per ASTM D 256 using a pendulum of 4.537 kg, which is released from the height of 610–570 mm. Prior to test, the samples were notched at a notch angle of 45° and a V-notch depth of 2.54 mm.
In case of mechanical measurements, a minimum of five samples were taken for each test and the experiment was carried out at a standard temperature of 23 ± 2°C and 50 ± 2% relative humidity. The data reported are the average of five specimens for each test and the corresponding standard deviation values have been reported.
Flame resistance
Virgin PLA and its nanocomposites of dimensions 127 × 12.2 × 3 mm were subjected to horizontal rate of burning in accordance with a UL 94 flammability test and the char was collected afterwards. Five samples were taken for each test and the results are averaged to determine the rate of burning. The char collected after the test was also retained.
Results and discussion
Morphological analysis
Wide angle x-ray diffraction
Figure 1(a) and (b) shows the results of the XRD pattern of nanoclays and PLA nanocomposites with 5 wt% of nanoclays loading. The values of d-spacing of nanoclays and the nanocomposites are also presented in Table 1.
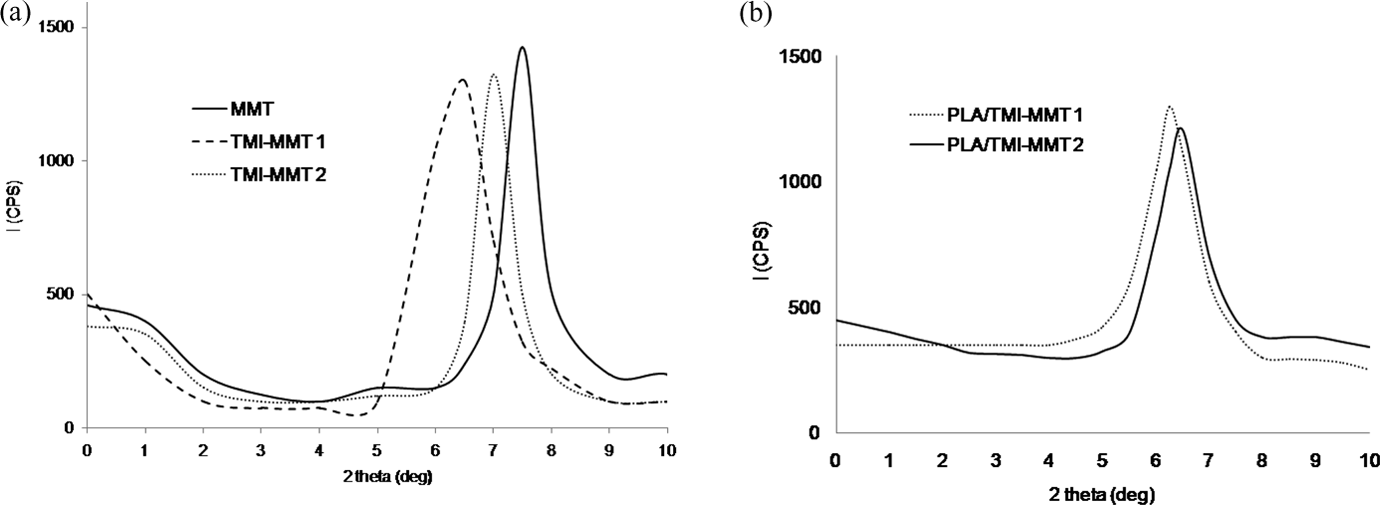
XRD pattern of (a) unmodified MMT and TMI-modified MMT; (b) PLA nanocomposites. XRD: x-ray diffraction; MMT: montmorillonite; TMI: transition metal ion; PLA: polylactic acid.
Diffraction angle (2θ) and d-spacing (Å) values of nanoclays and PLA nanocomposites.
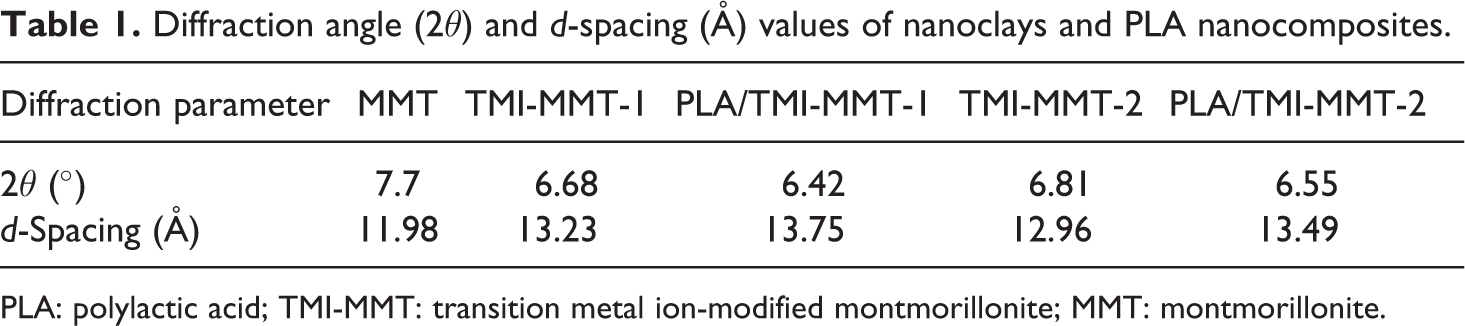
PLA: polylactic acid; TMI-MMT: transition metal ion-modified montmorillonite; MMT: montmorillonite.
As observed from the XRD patterns of the organoclays TMI-MMT-1 and -2, the 2θ values of 6.68 and 6.81° corresponding to a d-spacing of 13.23 and 12.96 Å, respectively, whereas the unmodified MMT shows a 2θ value of 7.70° with a d-spacing of 11.98 Å. Thus, incorporation of nanoclays within the PLA matrix results in an increase in the d-spacing with a shift in diffraction peak to lower angles. The increase in d-spacing of nanocomposites suggests a high degree of intercalation/exfoliation. Furthermore, the d-spacing of TMI-MMT-1 is higher than TMI-MMT-2, which may be due to the higher cation exchange capacity of Zn2+ when compared with Cu2+. 16
In case of PLA/TMI-MMT nanocomposites, it is believed that Zn2+ and Cu2+ ions are coordinated with the water molecules in aqueous solution forming [Zn(H2O)6]2+ and [Cu(H2O)6]2+ complexes. 16 It is assumed that the intercalation of EDA2+ was via the ion exchange reaction with the interlayer (sodium) ions. It is supposed that EDA forms the stable MMT intercalates, because it was not removed from the interlayer during the preparation steps such as washing and drying.
Transmission electron microscopy
Transmission electron micrographs (TEM) of PLA/TMI-MMT-1 nanocomposites are shown in Figure 2.
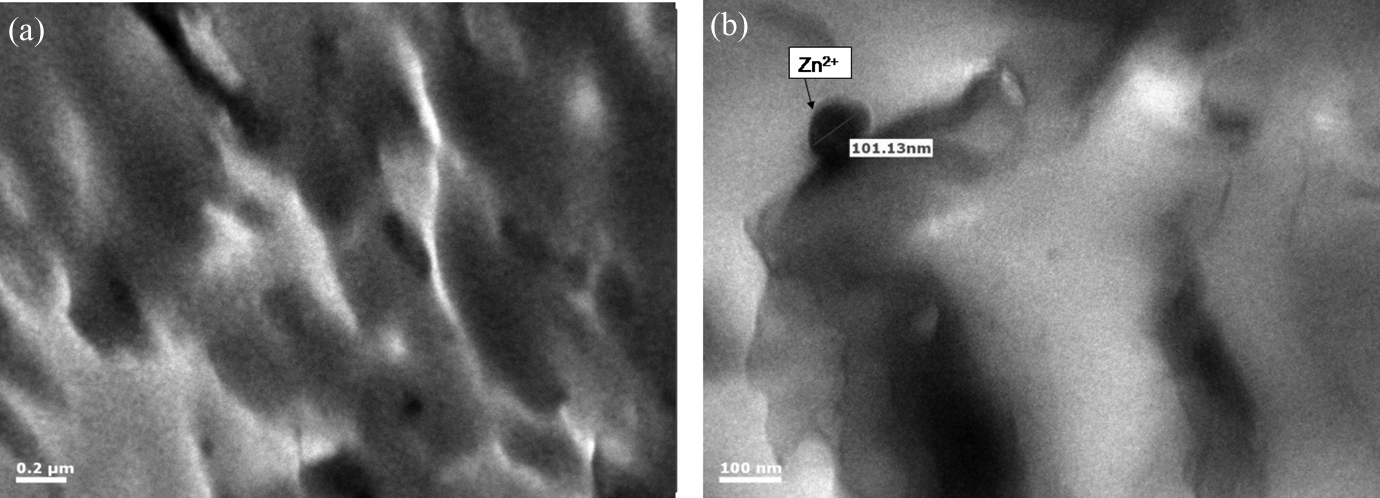
TEM of PLA/TMI-MMT-1 nanocomposites (a) with 0.2 µm magnification and (b) with 100 nm magnification. PLA: polylactic acid; TMI-MMT: transition metal ion-modified montmorillonite; TEM: transmission electron micrographs.
Figure 2(a) and (b) depicts the TEM of PLA/TMI-MMT-1 nanocomposites at different magnifications. As observed from the micrographs, the existence of both intercalated and stacks of agglomerated clay galleries was noticed within the nanocomposite. Clearly, the large anisotropies of the stacked and agglomerated silicate layers are randomly distributed in the PLA matrix. The dark lines in Figure 2 represent the thickness of individual clay layers or agglomerates. Thick darker lines represent stacked silicate layers due to clustering or agglomeration. Figure 2(b) represents the closer view of the silicate layers at 50 nm magnification, which are strongly intercalated into the PLA matrix. This indicates good compatibility and dispersibility of silicate layers with PLA matrix. The large dark spot in the TEM indicates the presence of Zn2+ ion, which confirms penetration and intercalation of metal ions in the polymeric matrix through the silicate layers. Thus, the nanocomposites of PLA reinforced with TMI-MMT are the typical intercalated systems, which is in agreement with the results of XRD.
Thermal properties
Thermogravimetric analysis
The TGA thermogram of unmodified MMT and TMI-MMT is depicted in Figure 3.
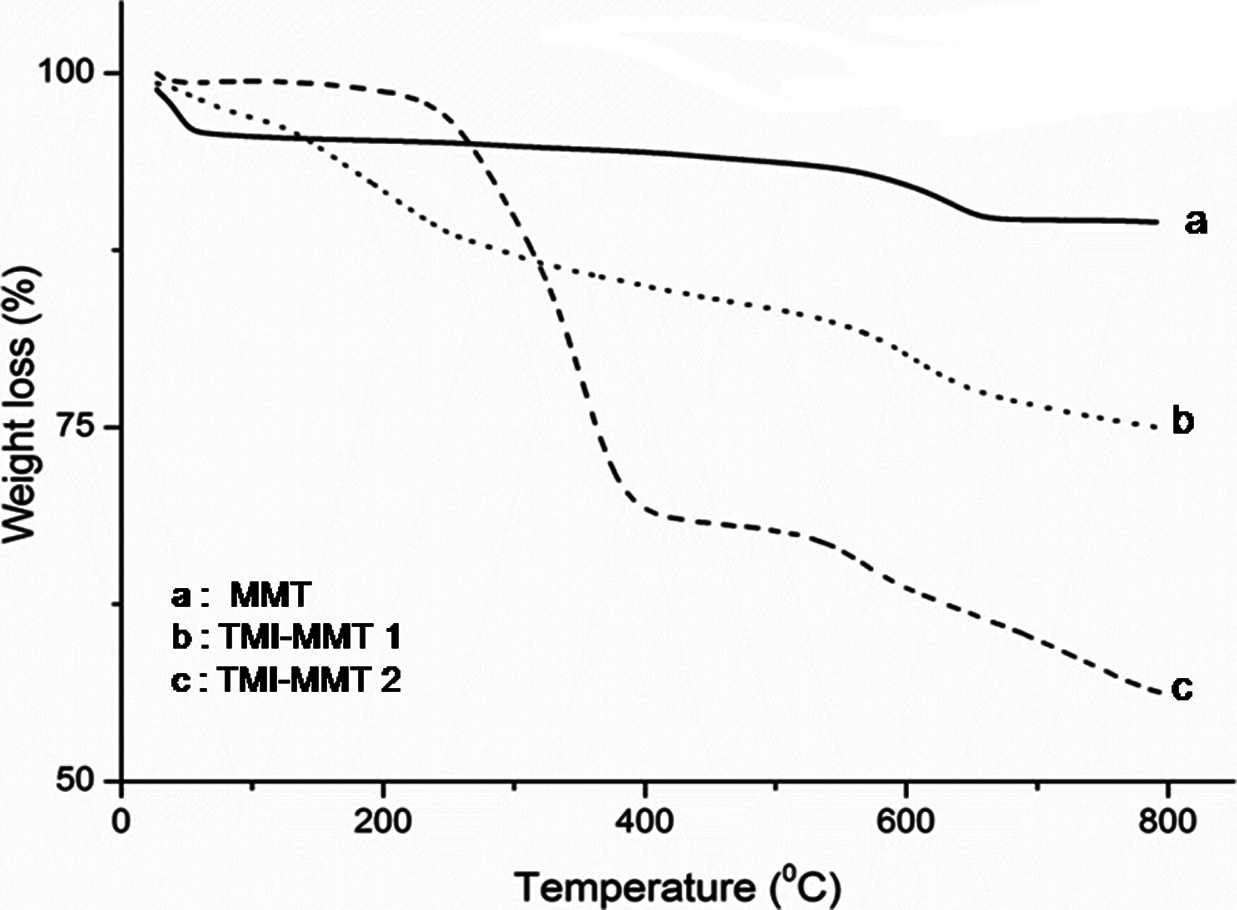
TGA thermogram of unmodified MMT, TMI-MMT-1 and -2. MMT: montmorillonite; TMI-MMT: transition metal ion-modified montmorillonite; TGA: thermogravimetric analysis.
From Figure 3, it is evident that the unmodified MMT exhibits two clear peaks corresponding to the mass loss at 30–65°C and 570–660°C, which is due to the desorption of water adsorbed on MMT and dehydroxylation of the MMT structure, respectively. There were two distinct types of water present in MMT. Type I was the adsorbed water, which has a great mobility and is easy to be removed. Type II constituted the hydration shell around the exchangeable cations and its presence depended on the number of hydrated cations residing in the interlayer spacing. In contrast, the modified MMT, that is TMI-MMT, displayed a four distinct mass loss. The first one is between ambient temperature and 103°C associated with desorption of water, the second weight loss occurs at around 230°C, which is believed to be due to loss of hydration water from the MMT, the third weight loss occurs at around 400°C, which is attributed to the removal of the surfactant. The fourth weight loss found around 510°C is assigned to the loss of structural hydroxyl groups within the clay, this indicates the thermal stability of TMI modified clays. Therefore, the peaks in this region of modified MMT were attributed to the decomposition of the free water. 16
The TGA and derivative thermograms of virgin PLA and its nanocomposites are depicted in Figures 4 and 5.
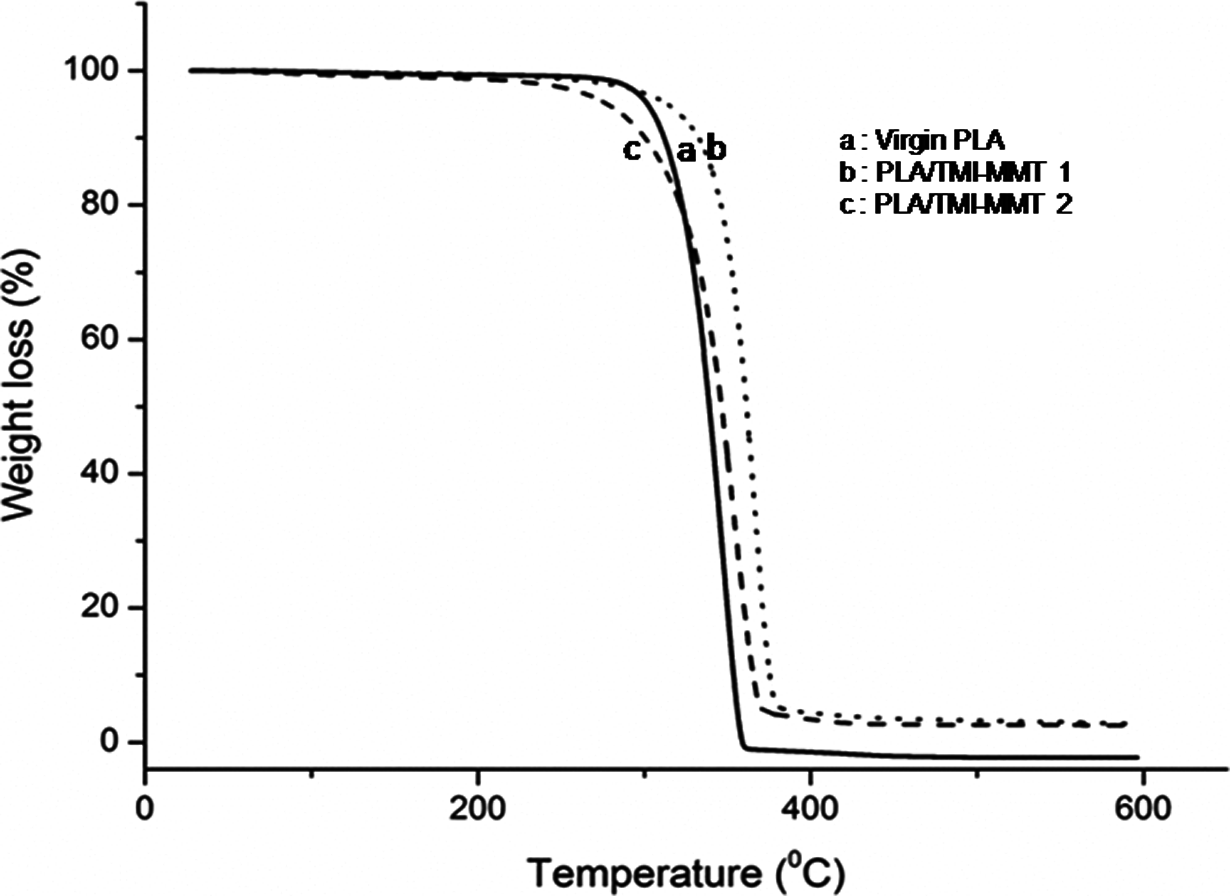
TGA thermogram of virgin PLA and its nanocomposites. TGA: thermogravimetric analysis; PLA: polylactic acid.
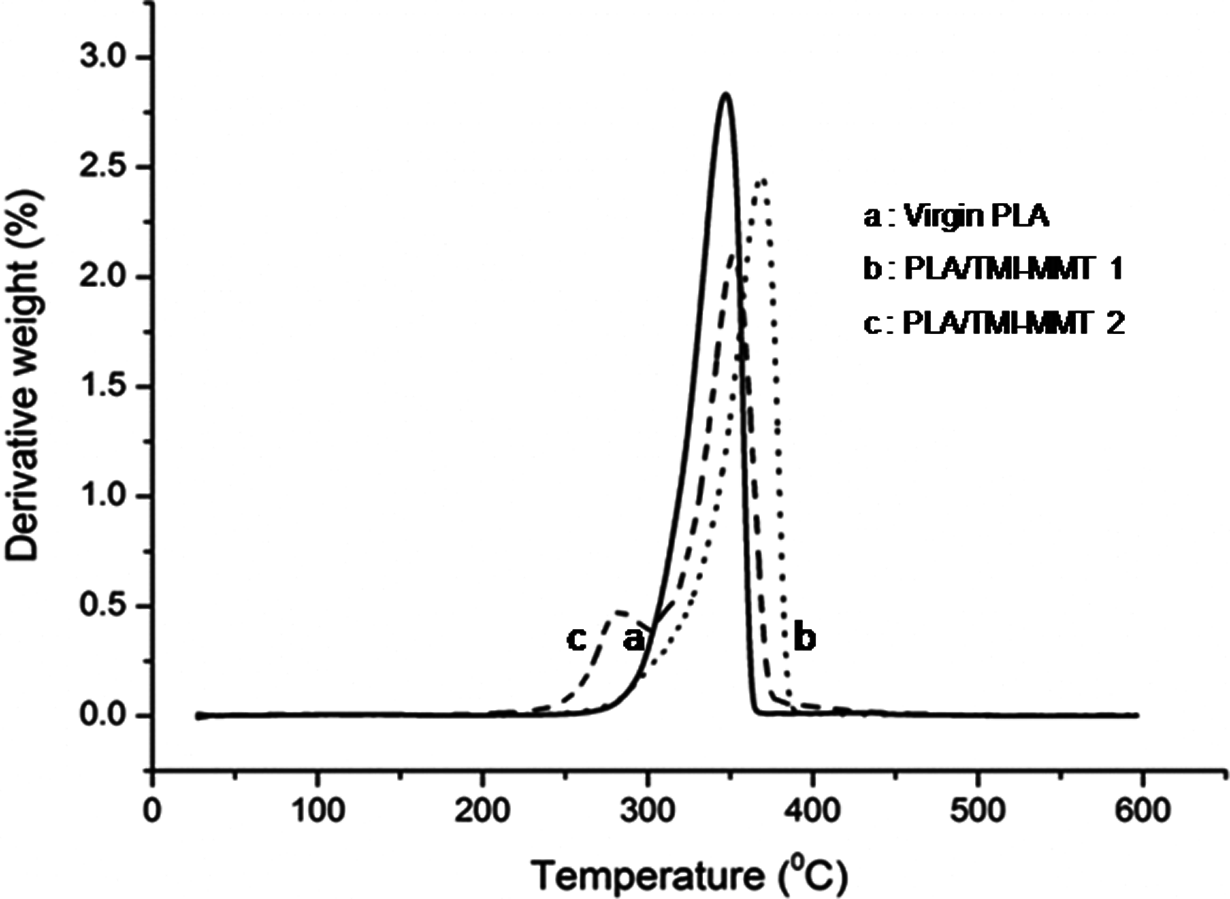
DTG thermogram of virgin PLA and its nanocomposites. DTG: derivative thermogravimetric analysis; PLA: polylactic acid.
From Figure 4, it is evident that virgin PLA exhibits an initial degradation temperature of 258.6°C and a final degradation temperature of 362.3°C, respectively. Table 2 shows initial degradation temperature (T i), temperature at 50% weight loss (T 50) and final degradation temperature (T fd) of virgin PLA and its nanocomposites. As observed from Table 2, T fd of PLA, PLA/TMI-MMT-1 and PLA/TMI-MMT-2 nanocomposites are 362.3, 397.2 and 392.2°C, respectively (Figure 4). This reveals that the addition of nanoclays increased the final degradation temperature of the matrix polymer. This behaviour is probably due to the organoclays that act as retarding agents at higher temperature leading to the formation of intercalated carbonaceous silicate char structure. The increase in thermal stability can also be attributed to an ablative reassembling of the silicate layers, which may occur on the surface of the nanocomposites creating a physical protective barrier on the surface of the material. All the nanocomposites show enhanced final degradation temperature compared to virgin PLA, which is probably due to the charring process facilitated by the presence of catalytically active TMIs. The percentage char in the case of PLA/TMI-MMT nanocomposites was more, which indicated improved flame retardancy in the matrix polymer in the presence of TMI-MMT.
TGA analysis of PLA and its nanocomposites.
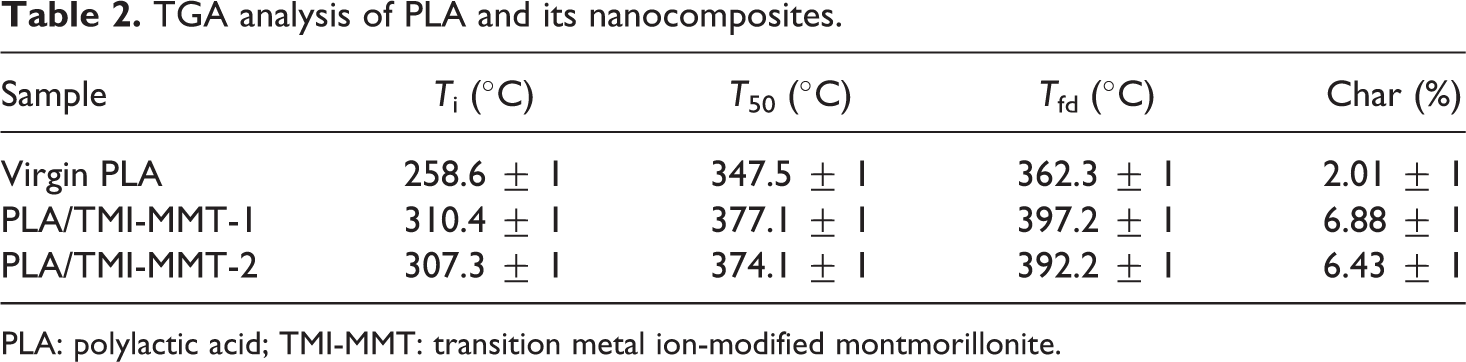
PLA: polylactic acid; TMI-MMT: transition metal ion-modified montmorillonite.
Among all the nanocomposites, PLA/TMI-MMT-1 displayed an optimum thermal degradation temperature in TGA. This may be due to the efficient heat barrier property of intercalated/exfoliated TMI-MMT layered silicate on the surface of PLA matrix. Also it is assumed that the presence of metal complex [Zn(H2O)6]2+ at the interfaces accelerates the thermal stability. TMI-MMT may assist higher char formation during thermal decomposition and also the corresponding nanocomposites showed highest amount of char content at 600°C. The degradation temperature of PLA/TMI-MMT-1 was observed to be 310.4, 377.1 and 397.2°C for T i, T 50 and T fd, respectively. These values are 18.97, 7.85 and 8.45% higher than that of virgin polymer, thus indicating higher thermal stability when compared with virgin PLA
Differential scanning calorimetry
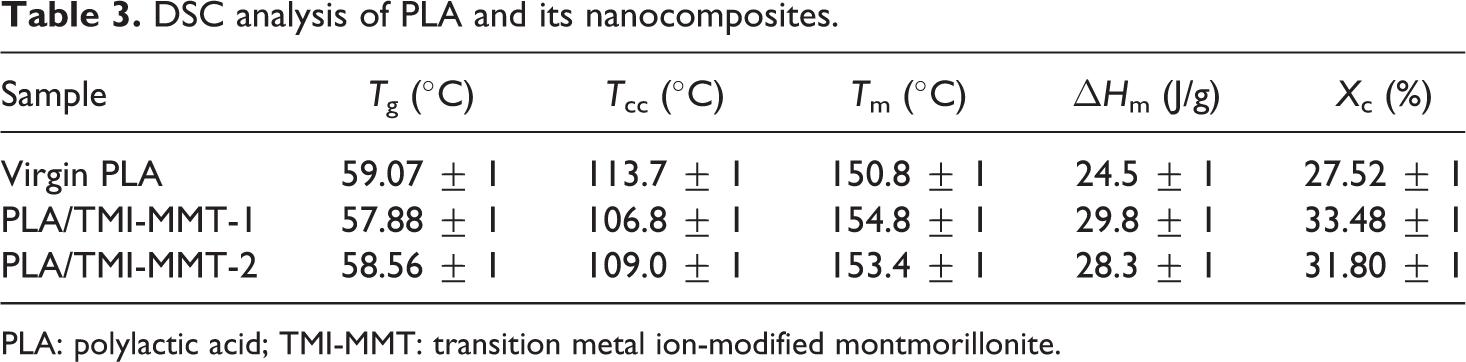
Figure 6 depicts the DSC thermograms of virgin PLA and its nanocomposites derived from the second heating scan. Corresponding T g, T m, T cc and enthalpy of fusion (ΔH m) are also presented in Table 3. All measurements have been carried out immediately after melt quenching scans to erase the previous thermal history in the samples.
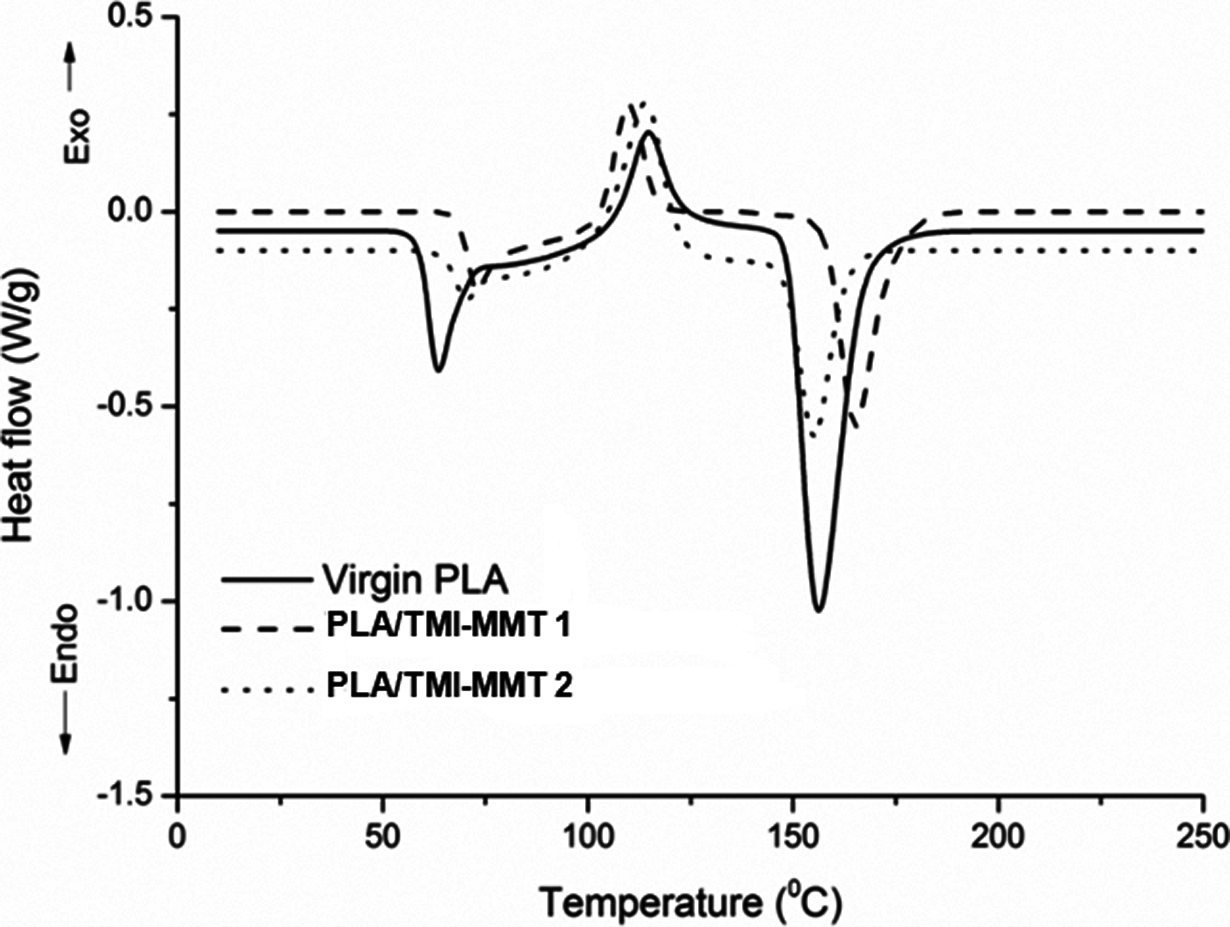
DSC thermograms of virgin PLA and its nanocomposites. DSC: differential scanning calorimetry; PLA: polylactic acid.
DSC analysis of PLA and its nanocomposites.
PLA: polylactic acid; TMI-MMT: transition metal ion-modified montmorillonite.
As evident from Figure 6, the peak in the region at 59.07°C is attributed to T g of PLA. No significant change in T g was observed in the case of PLA/TMI-MMT nanocomposites. The evidence of step-like shape for T g reveals physical ageing in all the samples.
The second transition peak observed in DSC endotherms in the 106–122°C region represents the cold crystallization peak of PLA matrix. As observed from Figure 6, the exotherm reveals decrease in T cc of the matrix polymer to approximately 6–9°C with the incorporation of nanoclays. T cc decreased from 113.72°C for unfilled PLA to 106°C for PLA/TMI-MMT-1 and 109.8°C for PLA/TMI-MMT-2 nanocomposites, respectively. This decrease in T cc is primarily because of the large surface area of the nanoclays that act as nucleating sites, thereby facilitating the crystallization process of PLA. Similar facts have been reported by various authors, wherein the crystallization temperature of PLA has been reduced by 4–10°C with the incorporation of nanoclays. Ray et al. 17 –19 concluded that nanoclays enhanced the rate of crystallization of PLA. Lee et al. 20 studied the thermal properties of PLA nanocomposites system and observed that recrystallization temperature (T c) decreased by the addition of clay when compared with virgin PLA. Nam et al. 21 and Ray et al. have shown that the size of PLA nanocomposite crystallites was significantly smaller than the virgin PLA and the order of spherulites was lower.
The third transition in the thermograms indicated T m of virgin PLA and its nanocomposites. As evident from Figure 6, both the virgin matrix and the nanocomposites depict double melting peaks. The crystallization of PLA on cooling is negligible, whereas it crystallizes on heating (cold crystallization) giving a crystalline phase that melts with two endothermic peaks. The double melting behaviour in PLA can be linked to the formation of different crystal structures of the α-form (pseudo-orthorhombic, pseudo-hexagonal or orthorhombic, melting at higher temperature and the β-form (orthorhombic or trigonal)) 22 that melts in correspondence with the endotherm at low temperature. However, in the present investigation, virgin PLA did not show distinct double melting peaks. A distinct peak at around 148.43°C and a weak shoulder at 149.44°C, respectively, were noticed. The shoulder or low temperature peak is probably formed on the melting endotherm of the original crystallites, whereas the imperfect crystals that have melted at this temperature recrystallize to give crystals at a higher temperature. However, a clear double melting endotherm was observed in case of the nanocomposites systems. It is evident that T m increased with the incorporation of nanoclays.
X c and ΔH m of PLA and its nanocomposites are represented in Table 3. It is evident that X c increased marginally with the incorporation of nanoclays. It is believed that TMI-MMT could act as a nucleating agent to increase the crystallinity of PLA. Also, PLA/TMI-MMT nanocomposites exhibited marginally enhanced crystallinity indicating improved interaction of TMI-MMT nanoclay and presence of metal ions at the interface.
Isothermal crystallization kinetics
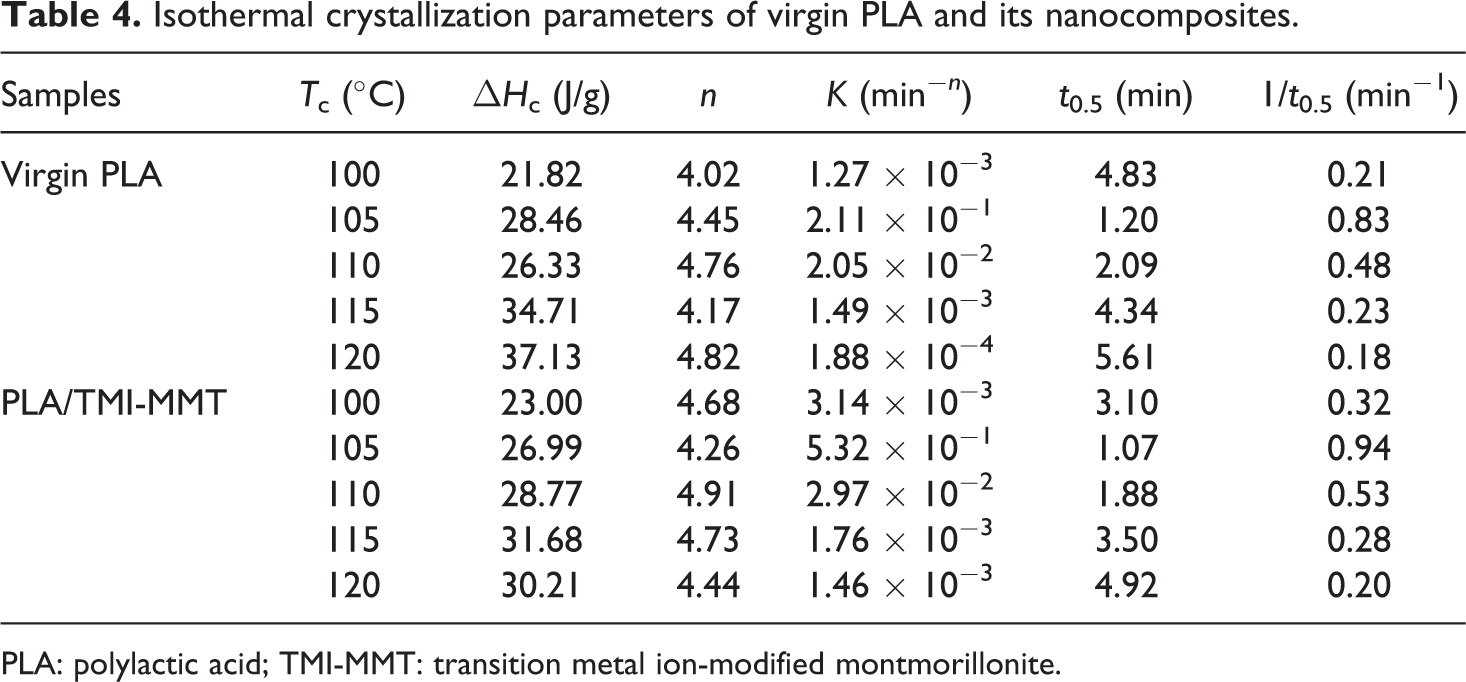
Kinetics of isothermal melt crystallization of virgin PLA and its nanocomposites was studied by cooling the melt rapidly (50°C/min) to crystallization temperature, ranging from 100 to 120°C. The crystallization enthalpy (ΔH c) values presented in Table 4 reveal an increase in ΔH c, as the temperature increases for both virgin PLA and its nanocomposites.
Isothermal crystallization parameters of virgin PLA and its nanocomposites.
PLA: polylactic acid; TMI-MMT: transition metal ion-modified montmorillonite.
The isothermal crystallization kinetics can be better visualized by evaluating the degree of crystalline conversation as a function of time at a constant temperature. The relative crystallinity at different crystallization time, X
t, can be calculated according to the equation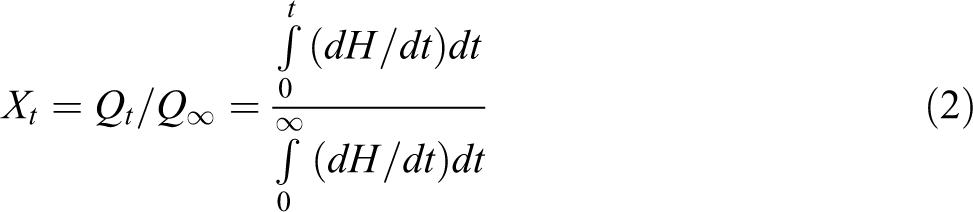
where Qt and Q ∞ are the heat generated at time t and infinite time, respectively, and dH/dt is the rate of heat evolution. Figure 7(a) and (b) shows the variations in the relative crystallinity (Xt ) for the respective isothermal crystallization temperature. It was found that with increasing crystallization temperature, the relative crystallinity was decreasing at a certain crystallization time, which meant that the crystallization rate was decreasing. The fact suggests that the overall crystallization rates of the PLA nanocomposites at high temperature (120°C) is higher than that of the virgin PLA matrix within the investigated temperature range. This may be due to heterogeneous nucleation kinetics of nanocomposites, which depends on well-dispersed TMI-MMT particles in the matrix at high temperature. It is further suggested that the spherulites of PLA nanocomposites have a lower ordering than that of virgin PLA due to the dispersed TMI-MMT particles in the spherulites.
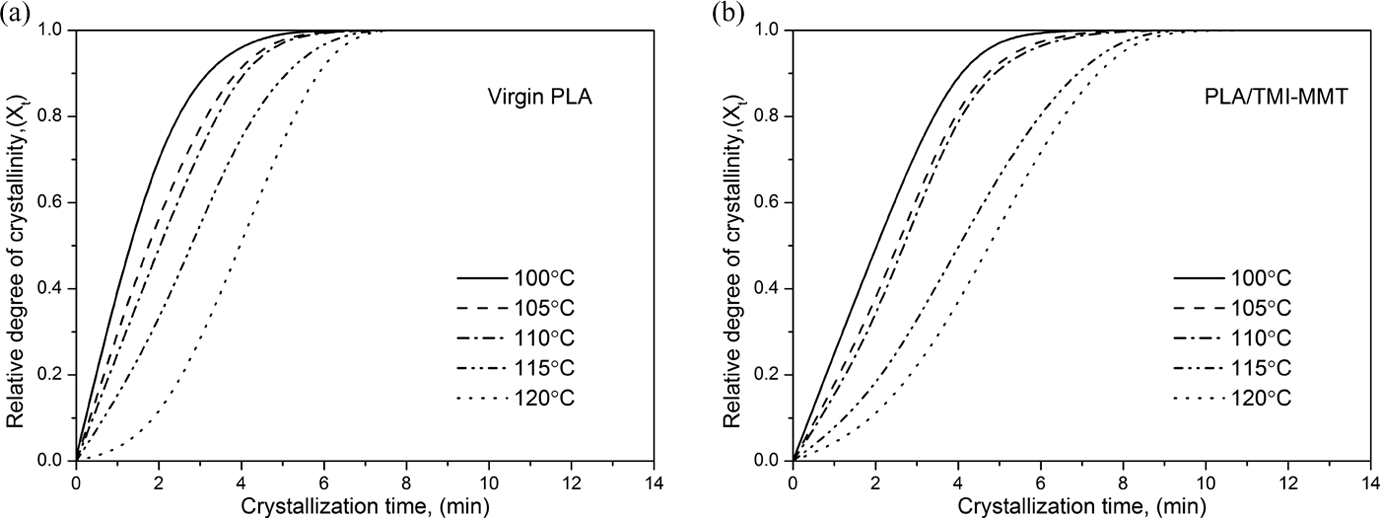
Relative degree of crystallinity as a function of crystallization time (a) for virgin PLA and (b). for PLA/TMI-MMT nanocomposites. TMI-MMT: transition metal ion-modified montmorillonite; PLA: polylactic acid.
The kinetics of isothermal crystallization can be described by the well-known Avrami equation.
23
A time-dependent relative volumetric crystallinity (Xt
) for the isothermal crystallization process is expressed as
or
where t is the time, n is the Avrami exponent and k is the overall crystallization rate constant that contains contributions from both nucleation and growth. Parameters n and k can be obtained from the slope and intercept, respectively, of the Avrami plot of log[−ln(1 − X t)] versus log t shown in Figure 8(a) and (b).
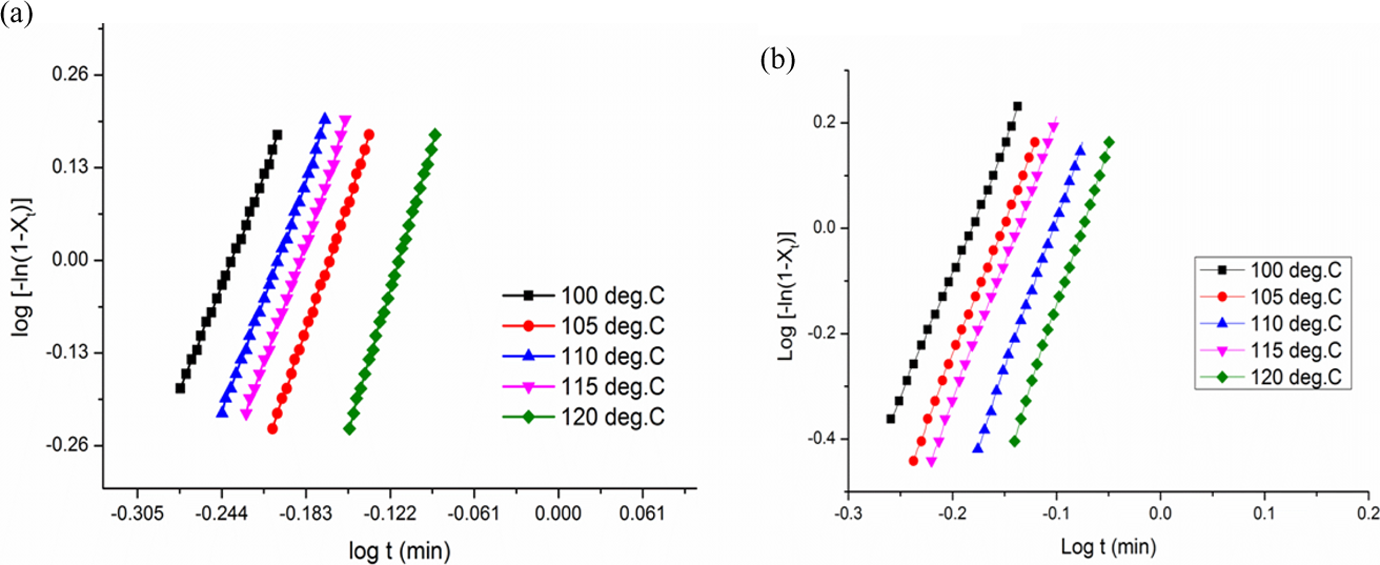
Typical Avrami double-logarithmic plot of (a) virgin PLA and (b) PLA/TMI-MMT nanocomposites. TMI-MMT: transition metal ion-modified montmorillonite; PLA: polylactic acid.
The Avrami parameters n and k were obtained from the plots presented in Table 4.
Lorenzo et al. 24 suggested that the choice of relative crystallinity range was very important and a relative crystallinity range of 3–20% is sufficient for a good Avrami fit. In order to check the validity of the Avrami method for studying the isothermal crystallization kinetics of the virgin PLA and its nanocomposites, the variation in the relative crystallinity (Xt ) for the respective isothermal crystallization temperatures calculated using the values of n and k is presented in Table 4 and the results are plotted in Figure 8. The calculated results fit very well with the experimental data, indicating that the Avrami method can be used to study the isothermal crystallization process in the present investigation.
The Avrami exponent (n) comprises two terms:
where n
d represents the dimensionality of the growth crystals and this quantity can only have, as values, the integer numbers 1, 2 or 3 corresponding to one, two- or three-dimensional entities that are formed. In the case of polymers, only 2 and 3 are commonly obtained as they represent axialites (two-dimensional lamellar aggregates) and spherulites (three-dimensional aggregates of radial lamellae), respectively. The time dependence of the nucleation is represented by n
n. In principle, its value should be either 0 or 1, where 0 corresponds to instantaneous or heterogeneous nucleation and 1 to sporadic or homogenous nucleation. The Avrami n for virgin PLA is in the range from 4.02 to 4.45 in the isothermal temperature range of 100–120
The half-life crystallization time, t
0.5, can be calculated using the equation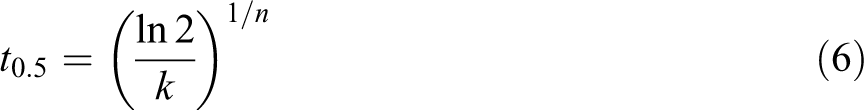
t 0.5 can be either obtained directly from the curve of relative degree of crystallinity with time (Figure 9) or calculated from isothermal parameters n and k using equation (9) and the values are summarized in Table 4.
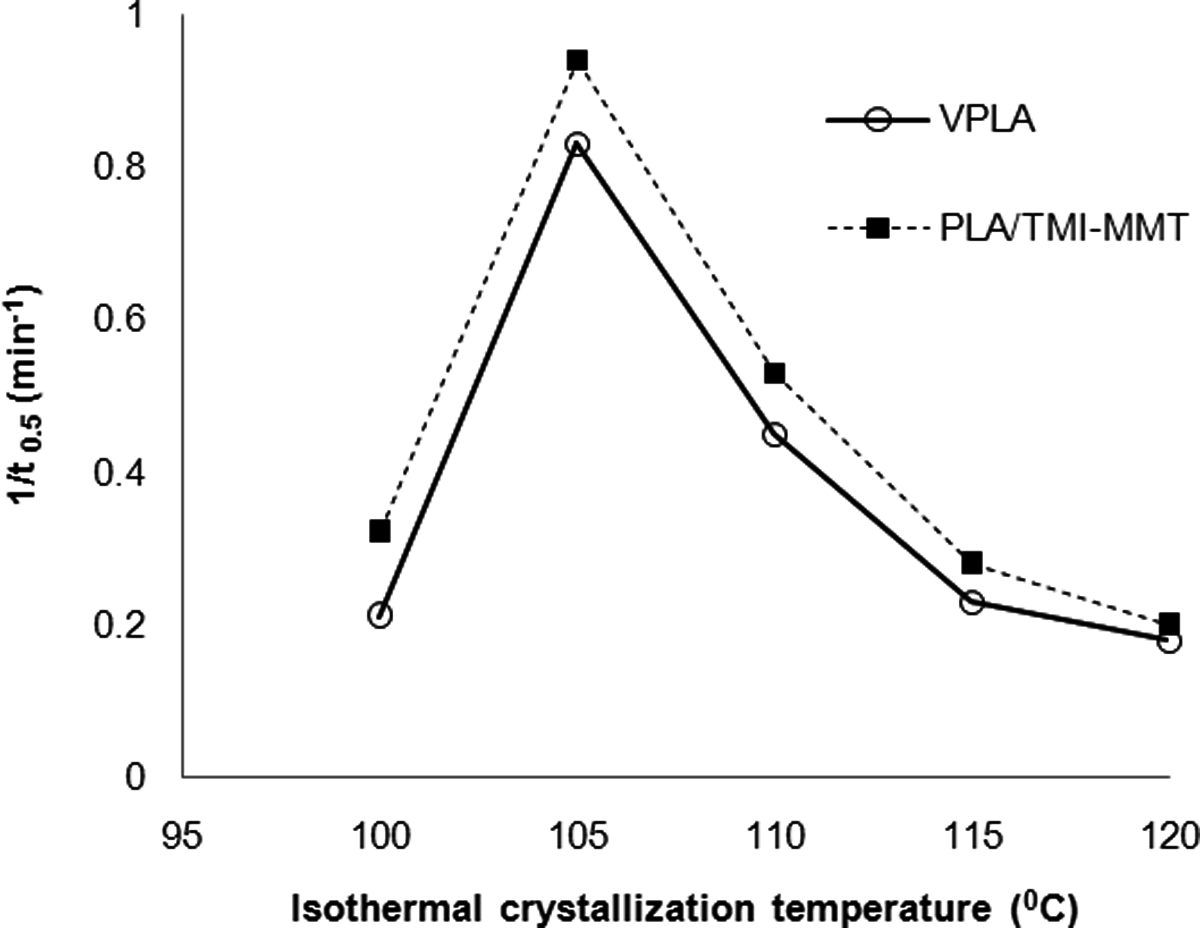
Dependence of 1/t 0.5 of PLA and PLA/TMI-MMT-1 nanocomposites on isothermal crystallization temperature. TMI-MMT: transition metal ion-modified montmorillonite; PLA: polylactic acid.
t 0.5 Values are close to each other for both virgin PLA and PLA/TMI-MMT within the range of crystallization temperatures. The values of 1/t 0.5 can be used to describe the crystallization rate and is shown in Figure 9 as a function of isothermal crystallization temperature. From Figure 9, it is clear that the crystallization rate of PLA/TMI-MMT was faster than virgin PLA. It indicates that the nanosized TMI-MMT particles acted as an efficient nucleating agent. The highest overall isothermal crystallization rate was found to be between 105 and 110°C. The increased crystallization rate due to the addition of TMI-MMT into PLA matrix was also confirmed by the higher values of isothermal crystallization parameter k listed in Table 4. Similar observation of inorganic particle-reinforced PLA nanocomposites exhibited increased bulk crystallization rates relative to virgin polymer. 28 This phenomenon is usually attributed to the higher heterogeneous nucleation rates, as demonstrated by increasing the isothermal crystallization parameter k.
Mechanical properties
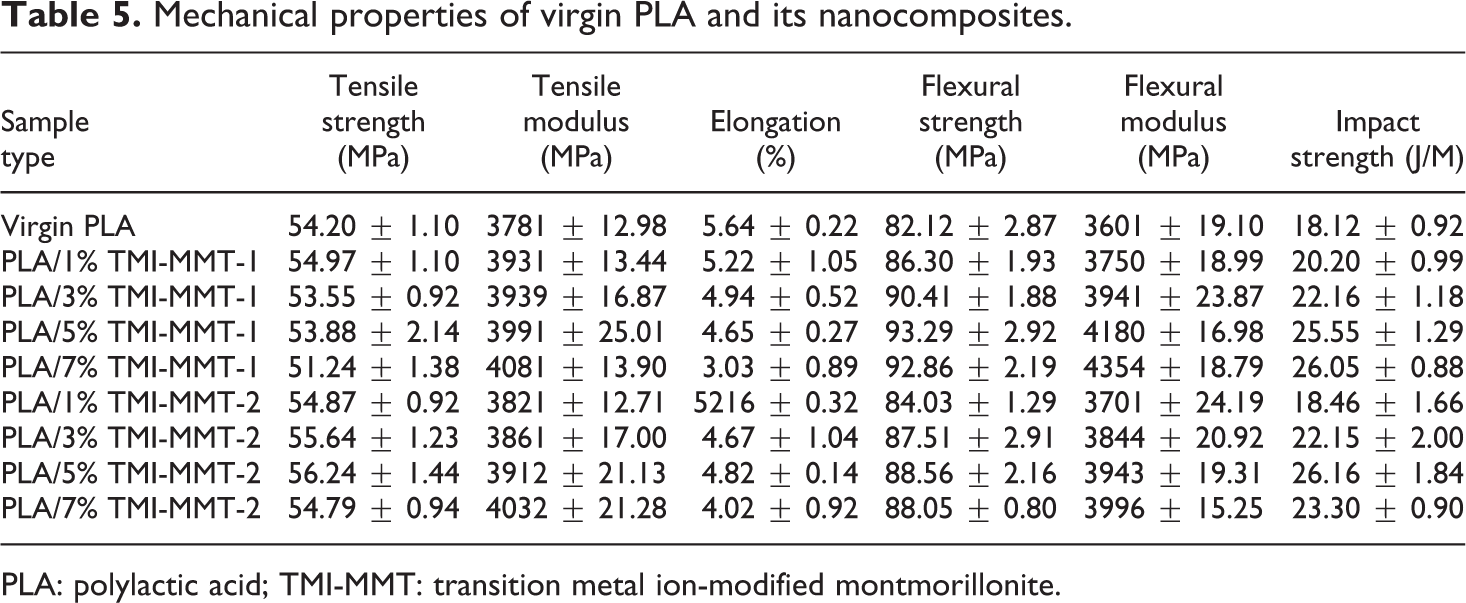
The variation in mechanical properties of PLA and its nanocomposites as a function of clay loading and clay type is enumerated in Table 5. It is evident that the incorporation of organoclay to the tune of 1–7 wt% results in consistent increase in tensile modulus. The tensile modulus of the nanocomposites increased from 3781 to 4032 and 4081 MPa in the case of PLA/TMI-MMT-1 and -2, respectively, with increasing nanoclay loading from 1 to 7 wt%. The tensile strength of PLA/TMI-MMT-2 nanocomposites is marginally increased to 56.24 MPa, which indicates the presence of Zn2+ that facilitated easy penetration of polymer chain into the clay galleries, which in turn increase the intermolecular attraction. However, in both the cases, beyond 5 wt% of nanoclay loading, there was a drop in the tensile strength, which indicates agglomeration of the clay particles that induces microcrack formation in the nanocomposites. The elongation at break also decreased with filler loading as observed in the case of all other filled systems.
Mechanical properties of virgin PLA and its nanocomposites.
PLA: polylactic acid; TMI-MMT: transition metal ion-modified montmorillonite.
Flexural strength and modulus of virgin PLA and its nanocomposites are summarized in Table 5. The flexural strength of the virgin PLA shows a marginal increase from 82.12 to 86.30 and 84.03 MPa in the case of PLA/TMI-MMT-1and -2 nanocomposites at 5 wt% of clay loading. However, in both the cases, beyond 5 wt% of nanoclay loading, there was a drop in the flexural strength. This behaviour may be due to some brittleness appeared in materials in the presence of organically modified silicate particles as supported by reduction in the impact value beyond 5 wt% nanoclay loading presented in Table 5. There is a significant increase in flexural modulus of both the nanocomposites compared with that of virgin PLA. From Table 5, it is evident that flexural modulus increased from 3601 to 4354 and 3996 MPa in case of PLA/TMI-MMT-1 and -2 nanocomposites, respectively, with increasing nanoclay loading from 1 to 7 wt%. This may be due to better intercalation effect of clay into the polymer matrix as supported by XRD results.
The impact strength of the matrix polymer also increased with the increase in the clay loading from 1 to 5 wt%, thereby confirming efficient interaction of the modified nanoclays within the PLA matrix, beyond 5 wt% loading there was a decrease in the strength as the brittleness of the composite increases.
As observed from the test results reported in Table 5, incorporation of TMI-MMT nanoclays results in an increase in the mechanical properties at 5 wt% of clay loading. PLA/TMI-MMT-1 exhibits optimum performance.
Flammability study
Flammability data for virgin PLA and its nanocomposites are summarized in Table 6. The rate of burning of the nanocomposites decreased from 24.33 to 13.70 and 12.00 cm S−1 in the case of PLA/TMI-MMT-1 and -2, respectively, at 5 wt% nanoclay loading. It is evident that incorporation of TMI-MMT to the tune of 5 wt% results in substantial increase in the percentage char formation when compared with virgin PLA, which indicates complete loss of periodicity in TMI modified clay stacks and also confirms that the structure of MMT clay minerals persisted in the combustion process. The increase in the degradation temperature also indicates greater fire retardation activity of the nanocomposites. 29
Flammability data of virgin PLA and its nanocomposites.
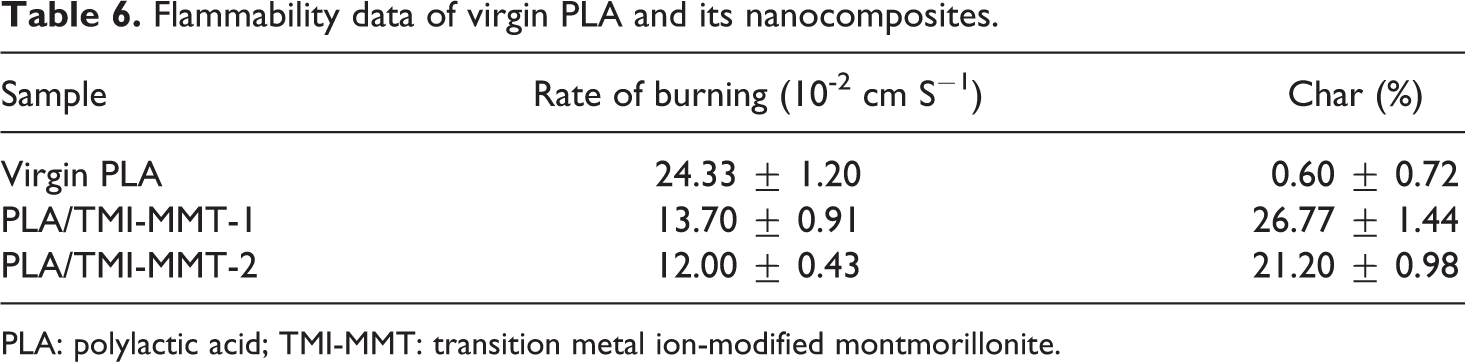
PLA: polylactic acid; TMI-MMT: transition metal ion-modified montmorillonite.
Conclusion
MMT was modified by TMI adsorption and using the modified nanoclay PLA-based nanocomposites have been successfully prepared by employing melt-intercalation technique. A detailed study on the morphology, thermal stability and isothermal crystallization kinetics of the nanocomposites has been investigated. From the experimental findings, the following conclusions are derived.
Mechanical properties showed significant enhancement in flexural and tensile modulus and impact strength in the PLA/TMI-MMT-1 system, revealing efficient compatibility of the matrix with the nanoclay and penetration of the metal ions into the silicate layers interface.
DSC thermograms showed marginal increase in T m and decrease in T cc of the PLA/TMI-MMT nanocomposites. The nanocomposites also showed an increase in X c compared with virgin PLA.
The thermal stability of the matrix polymer also increased in the nanocomposites, thus confirming formation of carbonaceous char layer in the matrix that prevents thermal degradation in PLA. PLA/TMI-MMT displayed higher onset of degradation temperature over virgin PLA, which is probably due to the presence of metal ions.
The Avrami equation described the isothermal crystallization kinetics well for both PLA and PLA/TMI-MMT. The Avrami exponent n for virgin PLA and PLA/TMI-MMT approached 5 when increasing the isothermal crystallization temperature to 120°C, which indicates a three-dimensional crystal growth. The maximum isothermal rate was found to be between 105 and 110°C.
XRD patterns revealed intercalated structure with TMI-MMT nanoclays and PLA/TMI-MMT nanocomposites showing maximum d-spacing. Furthermore, TEM of nanocomposites also confirmed a mixed nanomorphology with the regions of intercalated and exfoliated clay galleries.
Flammability analysis showed slow rate of burning and higher amount of carbonaceous char formation in the case of PLA/TMI-MMT when compared with virgin PLA. Therefore, TMI-MMT can be used as an effective FR in PLA in addition to reinforcing filler.
Footnotes
Funding
This research received no specific grant from any funding agency in the public, commercial or not-for-profit sectors.