
Abstract
Biodegradable polymer nanocomposites of poly(lactic acid) and nanoclay (Cloisite 30B) samples were prepared with compositions of 0%, 1%, 2%, 3%, 4%, and 5% (by mass) nanoclay using extrusion followed by injection molding. An exfoliated morphology was observed using x-ray diffraction. The nanocomposites were investigated for their mechanical properties using dynamic mechanical analysis (DMA) and tensile testing. The combination with 3% nanoclay was found to be optimum as a result of having the greatest mechanical strength. The fracture surfaces of the samples were also observed with the help of a scanning electron microscopy, and the images obtained complied with the experimental values attained for the samples, indicating more ductile fractures for those samples with greater mechanical strength. The thermal properties of the composites were studied with the help of differential scanning calorimetry and DMA data, and it was found that the trend followed by the glass transition temperature values obtained by both the methods was the same.
Introduction
Nanoclay has many advantages. As a result of its small size, it guarantees a greater interfacial area, therefore yielding a more homogeneous composite and causing a greater difference in the material’s properties. In addition to this, it has the benefits of flame-retardant synergy (i.e. the nanoclay helps decrease the risk of the initiation and propagation of fire), 1 barrier properties, relatively low cost, a good combination of stiffness and toughness, and good availability. 2 Nanoclays are therefore currently being used as alternatives to other fillers, such as glass and talc fillers, due to their ability to provide improved mechanical properties with smaller amounts. 2 Nanoclays are used in many different applications such as automotive interiors, bottles for carbonated soft drinks, power tools, and appliance and electronic housings. 2
Poly(lactic acid) (PLA) is completely obtained from renewable resources such as corn and sugar beets 3 and not from oil-based materials like other polymers. It is considered to be a material with much potential due to its outstanding biodegradability, high tensile strength and good compatibility. 4 It does not produce nitrogen oxide gases even when burned. 5 However, despite all these advantages, PLA has the drawbacks of having a low toughness and therefore cannot be processed as extensively as would be required for various applications. 6 This limits the applications for which PLA can be used. As a result, much research is being done to improve PLA’s processability and toughness. 6 Such measures include producing nanocomposites where nanoclay is used to reinforce the PLA and thus improve its properties.
Problems with nanoclays, when using them in polymer composites, include the issues of their dispersion (the distribution of the nanoclay particles throughout the polymer) and exfoliation (the separation of the nanoclay platelets). It is imperative that good dispersion be achieved, and that this dispersion not be at the cost of critical characteristics such as flow, impact, or modulus. 2
There are several ways in which bionanocomposites can be prepared, and these are similar to the techniques used for other composites as well. 7 These methods include solution intercalation where the matrix is soluble and the fibers are swellable. The constituents are then mixed together and the fibers replace the solvent in the matrix solution. Thereafter, the mixture is dried, leaving behind the composite material. Yet another method is in situ intercalative polymerization in which the fibers are swollen in a liquid monomer or in the presence of a solution of the monomer. Polymerization is then initiated and so the matrix grows with the fiber along with it, thus producing the composite material. Finally, there is a method of melt intercalation which involves heating the mixture of the matrix and fibers to a certain point. 7 This method has the benefits of being more easily used in conjunction with processes such as extrusion and injection molding, relative to other preparation processes, and it leads to an improvement in the mechanical and thermal properties of the nanocomposite material. 7 Melt intercalation is currently the most commonly used method for forming bionanocomposites. In addition, with respect to the composites studied in this article, the PLA forms the matrix, while the nanoclay plays the role of the reinforcing fibers.
There have been many recent studies conducted in the area of nanoclay composites, and the review article by Ray and Okamoto gives an idea of the extensive research being done in this field. 8 For instance, Li et al. found that adding nanoclay and core-shell rubber particles to PLA improved the material’s mechanical properties, and the properties could be modified depending on the percentage of constituents used, thus enabling the tailoring of the composites for particular applications. In addition, it was concluded that the surface chemistry of the fillers is a critical factor in determining how effective the improvement in mechanical properties is. 9 Yet another study by Thunwall et al. showed how taking measures to increase the dispersion of the nanoclay in the polymer matrix did not always lead to an improvement in the final properties of the nanocomposites; this also depends significantly on the adhesion between the different components. 10
Polymer nanocomposites, especially at low compositions of nanoclay (less than 5%), display outstanding enhancement in their mechanical and optical properties as well as heat resistance, moisture and gas permeability, biodegradability, and flammability, relative to the virgin polymer or traditional micro- and macrocomposites.11 –13 The nanocomposites also have the advantages of low density, transparency, good flow, better surface properties, and recyclability. 14 What is more, since these improved properties are generally observed at lower nanoclay content, the nanocomposites produced tend to be far lighter in weight than conventional composites. 8 The nanocomposites do not need any special processing since the constituents may be simply melted and mixed together. Therefore, no organic solvents would need to be used in the production procedure, which can be performed easily using conventional processing techniques such as injection molding and extrusion. 15 This also implies potentially low production costs. In addition, when disposed of as part of compost, these biodegradable nanocomposites are safely decomposed into carbon dioxide, water, and humus as a result of microorganism activity. 16
The primary reason for the above-mentioned improved properties is the enhanced interaction at the interface between the polymer matrix and the nanoclay. 8 The enhancement of mechanical properties in the nanocomposites is therefore highly dependent on the aspect ratio of the dispersed clay particles. The large aspect ratio of the nanoparticles being considered makes the enhancement of mechanical properties observed for these nanocomposites possible. 8 Indeed, a small weight percentage of nanoclay properly dispersed throughout the PLA matrix creates a much higher surface area for polymer–filler interfacial interactions than that found in conventional composites. 5 In fact, the improvement in the properties of clay nanocomposites is most often attributed to the complete exfoliation of the silicate layers in the polymer matrix. However, none of the processing techniques currently employed lead to complete exfoliation, and this may be a consequence of the increased tendency of clay nanoparticles to agglomerate. 17
Nanoclay polymer composites may be used in various areas such as automobiles (they are already used in the Hummer and Impala 15 ), aerospace, electronics, pigments, and construction materials (structural panels and building sections). 18 They can therefore be used in structural applications 19 in green buildings. They can even be used as nanocomposite foams. 20 Such composites have excellent potential; in fact, “according to several sources (Chemical Business Newsbase, Plastic News), a significant increase in turnover of ∼100% per year leading to a value of ∼1500 million Euro (∼500,000 t/year of polymer nanocomposites) is [sic] expected in 2009” 15 as a result of the commercial use of such materials. At the same time, it must be realized that improvements in nanocomposite design, production procedures, economies of scale, and rising costs for nonrenewable fossil resources could all be required to create a more promising economic situation for biodegradable polymers in general.
The PLA-nanoclay composites made as part of this research contained Cloisite 30B nanoclay. This particular variety of clay was chosen since it is known to have excellent exfoliation with PLA due to the favorable enthalpic interactions between the chemical constituents of the clay and the PLA.11,21 It has been found that PLA-nanoclay composites, prepared in the same way as those discussed in this article, follow an interesting trend with respect to their thermal properties. These nanocomposite materials were found to undergo an increase in thermal stability, relative to neat PLA (the starting material), with the optimum composition being 3% (w/w), which showed the greatest improvement in thermal properties. 11 It is therefore the objective of this research to find out whether or not a similar trend is observed in the mechanical properties for such PLA-nanoclay composite materials. To that end, 1%, 2%, 3%, 4%, and 5% (by mass) nanoclay-PLA composites are investigated and their morphology is studied with the help of x-ray diffraction (XRD) data. The scanning electron microscopy (SEM) images of the material fracture surfaces are investigated to better understand the improvement in mechanical properties. This article also discusses the trend in glass transition temperatures (T g) of various composite samples using both dynamic mechanical analysis (DMA) and differential scanning calorimetry (DSC) data.
Materials and methods
Materials
The nanoclay used to prepare the composites, Cloisite 30B, was supplied by Southern Clay Products (Gonzales, Texas, USA). PLA under the commercial name PLA 4060D (poly-
Preparation of PLA-nanoclay composites
The pellets of PLA and the powders of the nanoclay were dry mixed at room temperature with compositions of 0%, 1%, 2%, 3%, 4%, and 5% (by mass) nanoclay (Cloisite 30B). For example, when the 1% composite was being prepared, 50 g of PLA was mixed with 0.5 g of nanoclay. The mixture was then placed in the New Brunswick Scientific Innova 40 (New Brunswick Scientific, Enfield, CT, USA)where it was shaken at room temperature and therefore dry mixed at 300 rpm for an extended amount of time (i.e. more than 2 h). This ensured that the PLA pellets were well coated by the nanoclay. The SEM image of the coated PLA pellet surface (Figure 1) gives pictorial evidence of a well-coated PLA pellet surface.
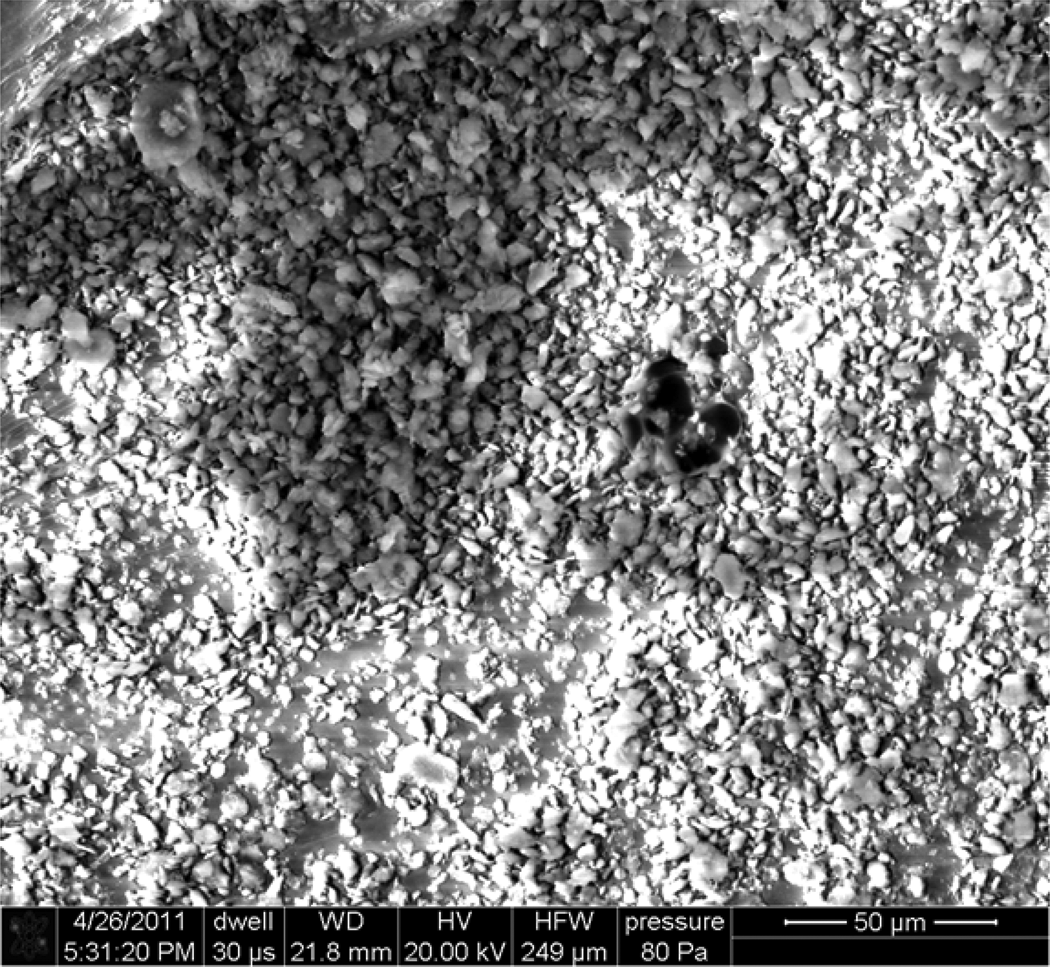
SEM image of the surface of a PLA pellet covered with nanoclay particles. PLA: poly(lactic acid); SEM: scanning electron microscopy.
The mixture was then taken and melted to a temperature of 150°C and mixed using the HAAKE Thermo Scientific MiniLab II Rheomex CTW5 twin-screw microcompounder (Thermo Fisher Scientific, Waltham, MA, USA) at a screw torque of 550 N cm. The extruded material was thus the composite material, but it needed to be in a form that could be used for testing the materials’ mechanical properties. For this purpose, the HAAKE Thermo Scientific MiniJet II (Thermo Fisher Scientific, Waltham, MA, USA) was used, and tensile test specimens (“dog-bones” as shown in Figure 2(a)) and “DMA bars” (as shown in Figure 2(b)) were molded from the composite material. The cylinder temperature was 185°C, while the mold temperature was 50°C. The tensile test specimens produced had a 16 mm gauge length, 3 mm width, and 2.9 mm thickness. In addition, the 4% and 5% nanoclay samples were increasingly difficult to mold due to their relatively high clay content. Due to the adhesive properties of clay, they tended to stick to the metallic molds and so were very difficult to remove from them. Thus, the reproducibility of the 4% and 5% samples was not very good in the sense that making repeated samples of the 4% and 5% composites with minimal defects was a challenging task. In order to overcome this shortcoming, multiple samples were tested for each of the percentage compositions and the trend followed by most of the samples was assumed to be characteristic of that particular percentage composition.
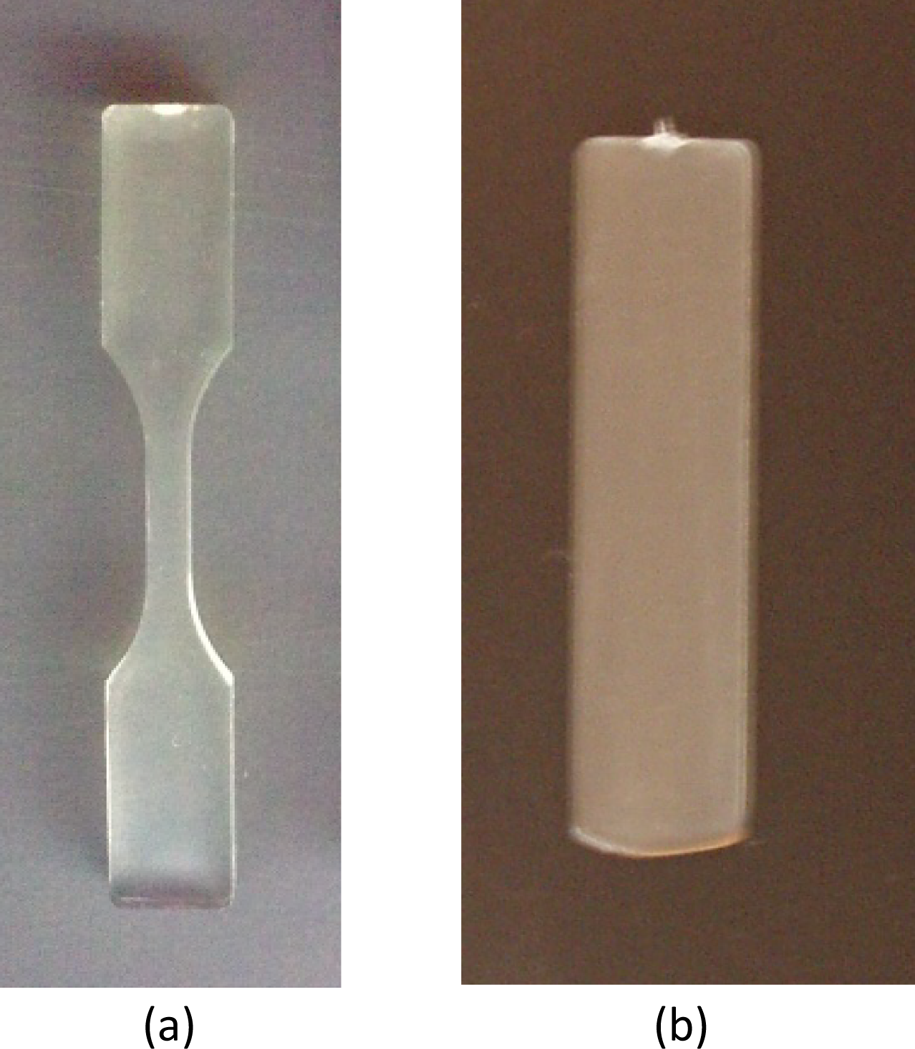
Specimens used for (a) tensile testing (“dog-bone”) and (b) DMA (“DMA bar”). DMA: dynamic mechanical analysis.
Morphology of PLA-nanoclay composites
XRD data of the nanoclay as well as of the nanocomposites were obtained with an x-ray diffractometer (X'Pert Pro; PANalytical B.V., Almelo, The Netherlands). The test was performed using grazing incidence so that Ω was fixed at 2° and 2θ varied from 3° to 15°. The reflection transmission spinner was used with a step size of 0.0835°. The XRD graphs obtained as a result were used to characterize the morphology of the nanostructure of the composites.
Tensile testing of PLA-nanoclay composites
Mechanical properties of the composites such as Young’s modulus and elongation at break were determined from the stress–strain curves that were generated from the tensile test. During this test, the material was subjected to a static load and pulled until it reached the fracture point and broke. In this work, Instron 5966 materials testing machine (Instron, Norwood, MA, USA) was used for performing the tensile test at a crosshead speed of 1 mm/min. The test was carried at room temperature and 50% humidity. The tensile test dog-bone specimens used in this investigation had 13.25 mm gauge length, 3.19 mm width, and 3.24 mm thickness. A sample of such a specimen is shown in Figure 2(a).
DMA of the PLA-nanoclay composites
The mechanical characteristics of the composite materials were studied using a Dynamic Mechanical Analyzer (DMA8000; Perkin Elmer,Waltham, MA, USA). The DMA bars (shown in Figure 2(b)) were clamped between the movable and stationary fixtures using the double cantilever setup and then enclosed in the thermal chamber. The analyzer applies oscillations to the test sample while slowly moving through the user-specified temperature range, which, in this case, was from room temperature to 90°C.
DSC of PLA-nanoclay composites
The thermal characteristics of the nanoclay/PLA composites were investigated using a Dynamic Scanning Calorimeter (DSC4000; Perkin Elmer,Waltham, MA, USA). Samples of 6–10 mg were heated from 20°C to 200°C at a rate of 2°C/min in a stream of nitrogen (20 ml/min).
SEM characterization of the PLA-nanoclay fracture surface
The fracture surfaces of the tensile test specimens of both the neat PLA and the 1% PLA-nanoclay materials were mounted on a carbon tape. The microstructure of the samples was imaged at low vacuum using Quanta™ FEG 250 Scanning Electron Microscope (FEI, Hillsboro, OR, USA).
Results and discussion
Morphology of PLA-nanoclay composites
XRD was performed for the nanocomposites samples as well as for the nanoclay starting material. The curves obtained are shown in Figure 3. The data have been vertically offset to make a clear presentation. As is clear from the graph, the nanoclay had a peak at approximately 2θ = 5°. This is similar to the curve found for other types of nanoclay as well and is consequently similar to the data presented in various other publications such as in Ray and Okamoto. 22 This nanoclay peak is not found in the curves of the composites, and the scans obtained for the nanocomposite samples are similar regardless of whether, for instance, the 0% nanoclay or the 4% nanoclay samples are considered. (The 0% nanoclay sample consists only of the composite PLA but has been processed in the same way as samples.) These results corroborate with the findings of Krishnamachari et al. 11 They prove the exfoliation of the nanoclay in the PLA matrix and thus confirm how the nanoclay is well dispersed in the PLA of all the nanocomposites, regardless of the nanoclay percentage being considered. Moreover, the scans show the amorphous nature of the PLA constituent of the nanocomposites.
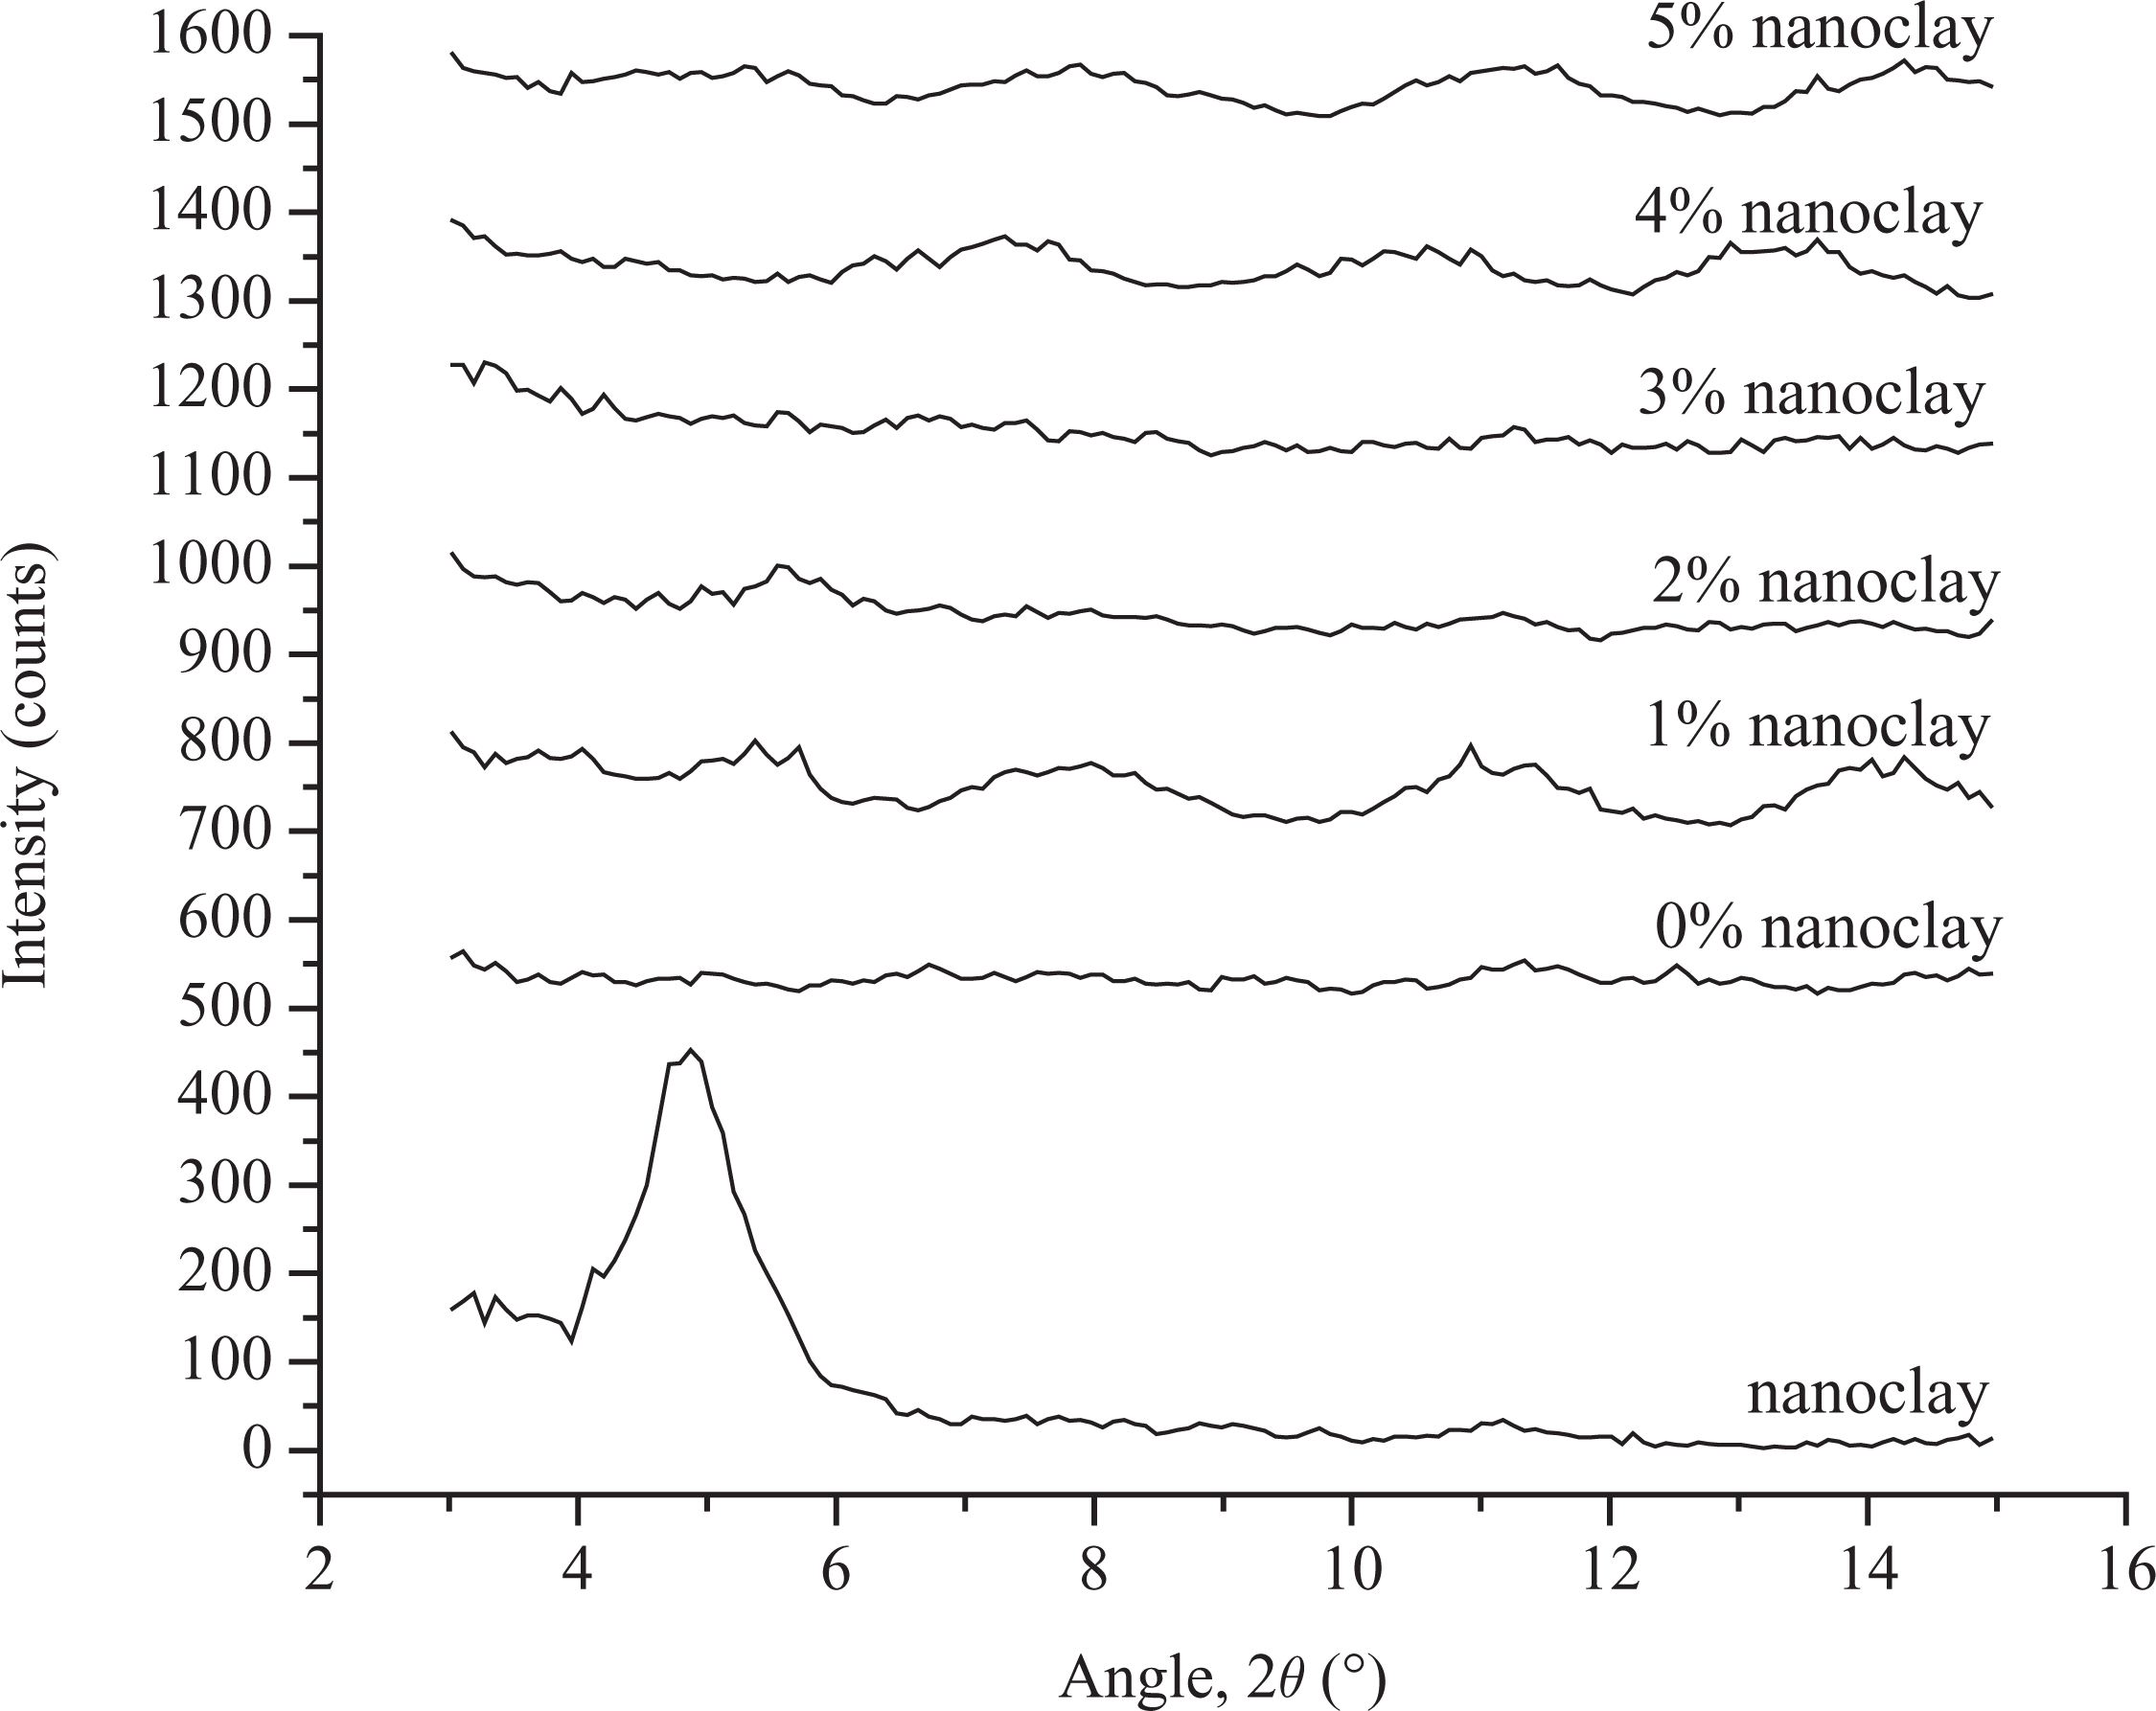
XRD for nanoclay as well as the prepared composites. XRD: x-ray diffraction.
Mechanical analysis
Tensile testing of PLA-nanoclay composites
The samples were tested for their tensile properties, and the curves shown in Figure 4 are obtained as a result. Three samples were tested for each percentage composition and the standard deviation in results obtained was ±5%. As can be seen from the slope of the elastic portions of the curves for all the samples, they all have similar values for Young’s Modulus. However, their values of yield strength are significantly different; with the 1%, 2%, and 3% samples having the highest yield strengths, followed by the neat PLA, then the 4%, and finally the 5% nanocomposite material. These approximate values are also shown clearly in Table 1. It is known that the area under the stress–strain curve represents the toughness of the material. Thus, it can be inferred that the 1–3% composites are tougher than the neat PLA, and so are able to absorb more energy before fracture. This signals an improvement in mechanical properties, and this improvement is not shown for the 4% and 5% nanocomposites samples. This may be attributed to the good interfacial adhesion between the nanoclay particles and the PLA matrix 17 at these lower percentage compositions. This leads to a more efficient transfer of the stress when a load is applied to the nanocomposites, and thus a stronger material is formed.
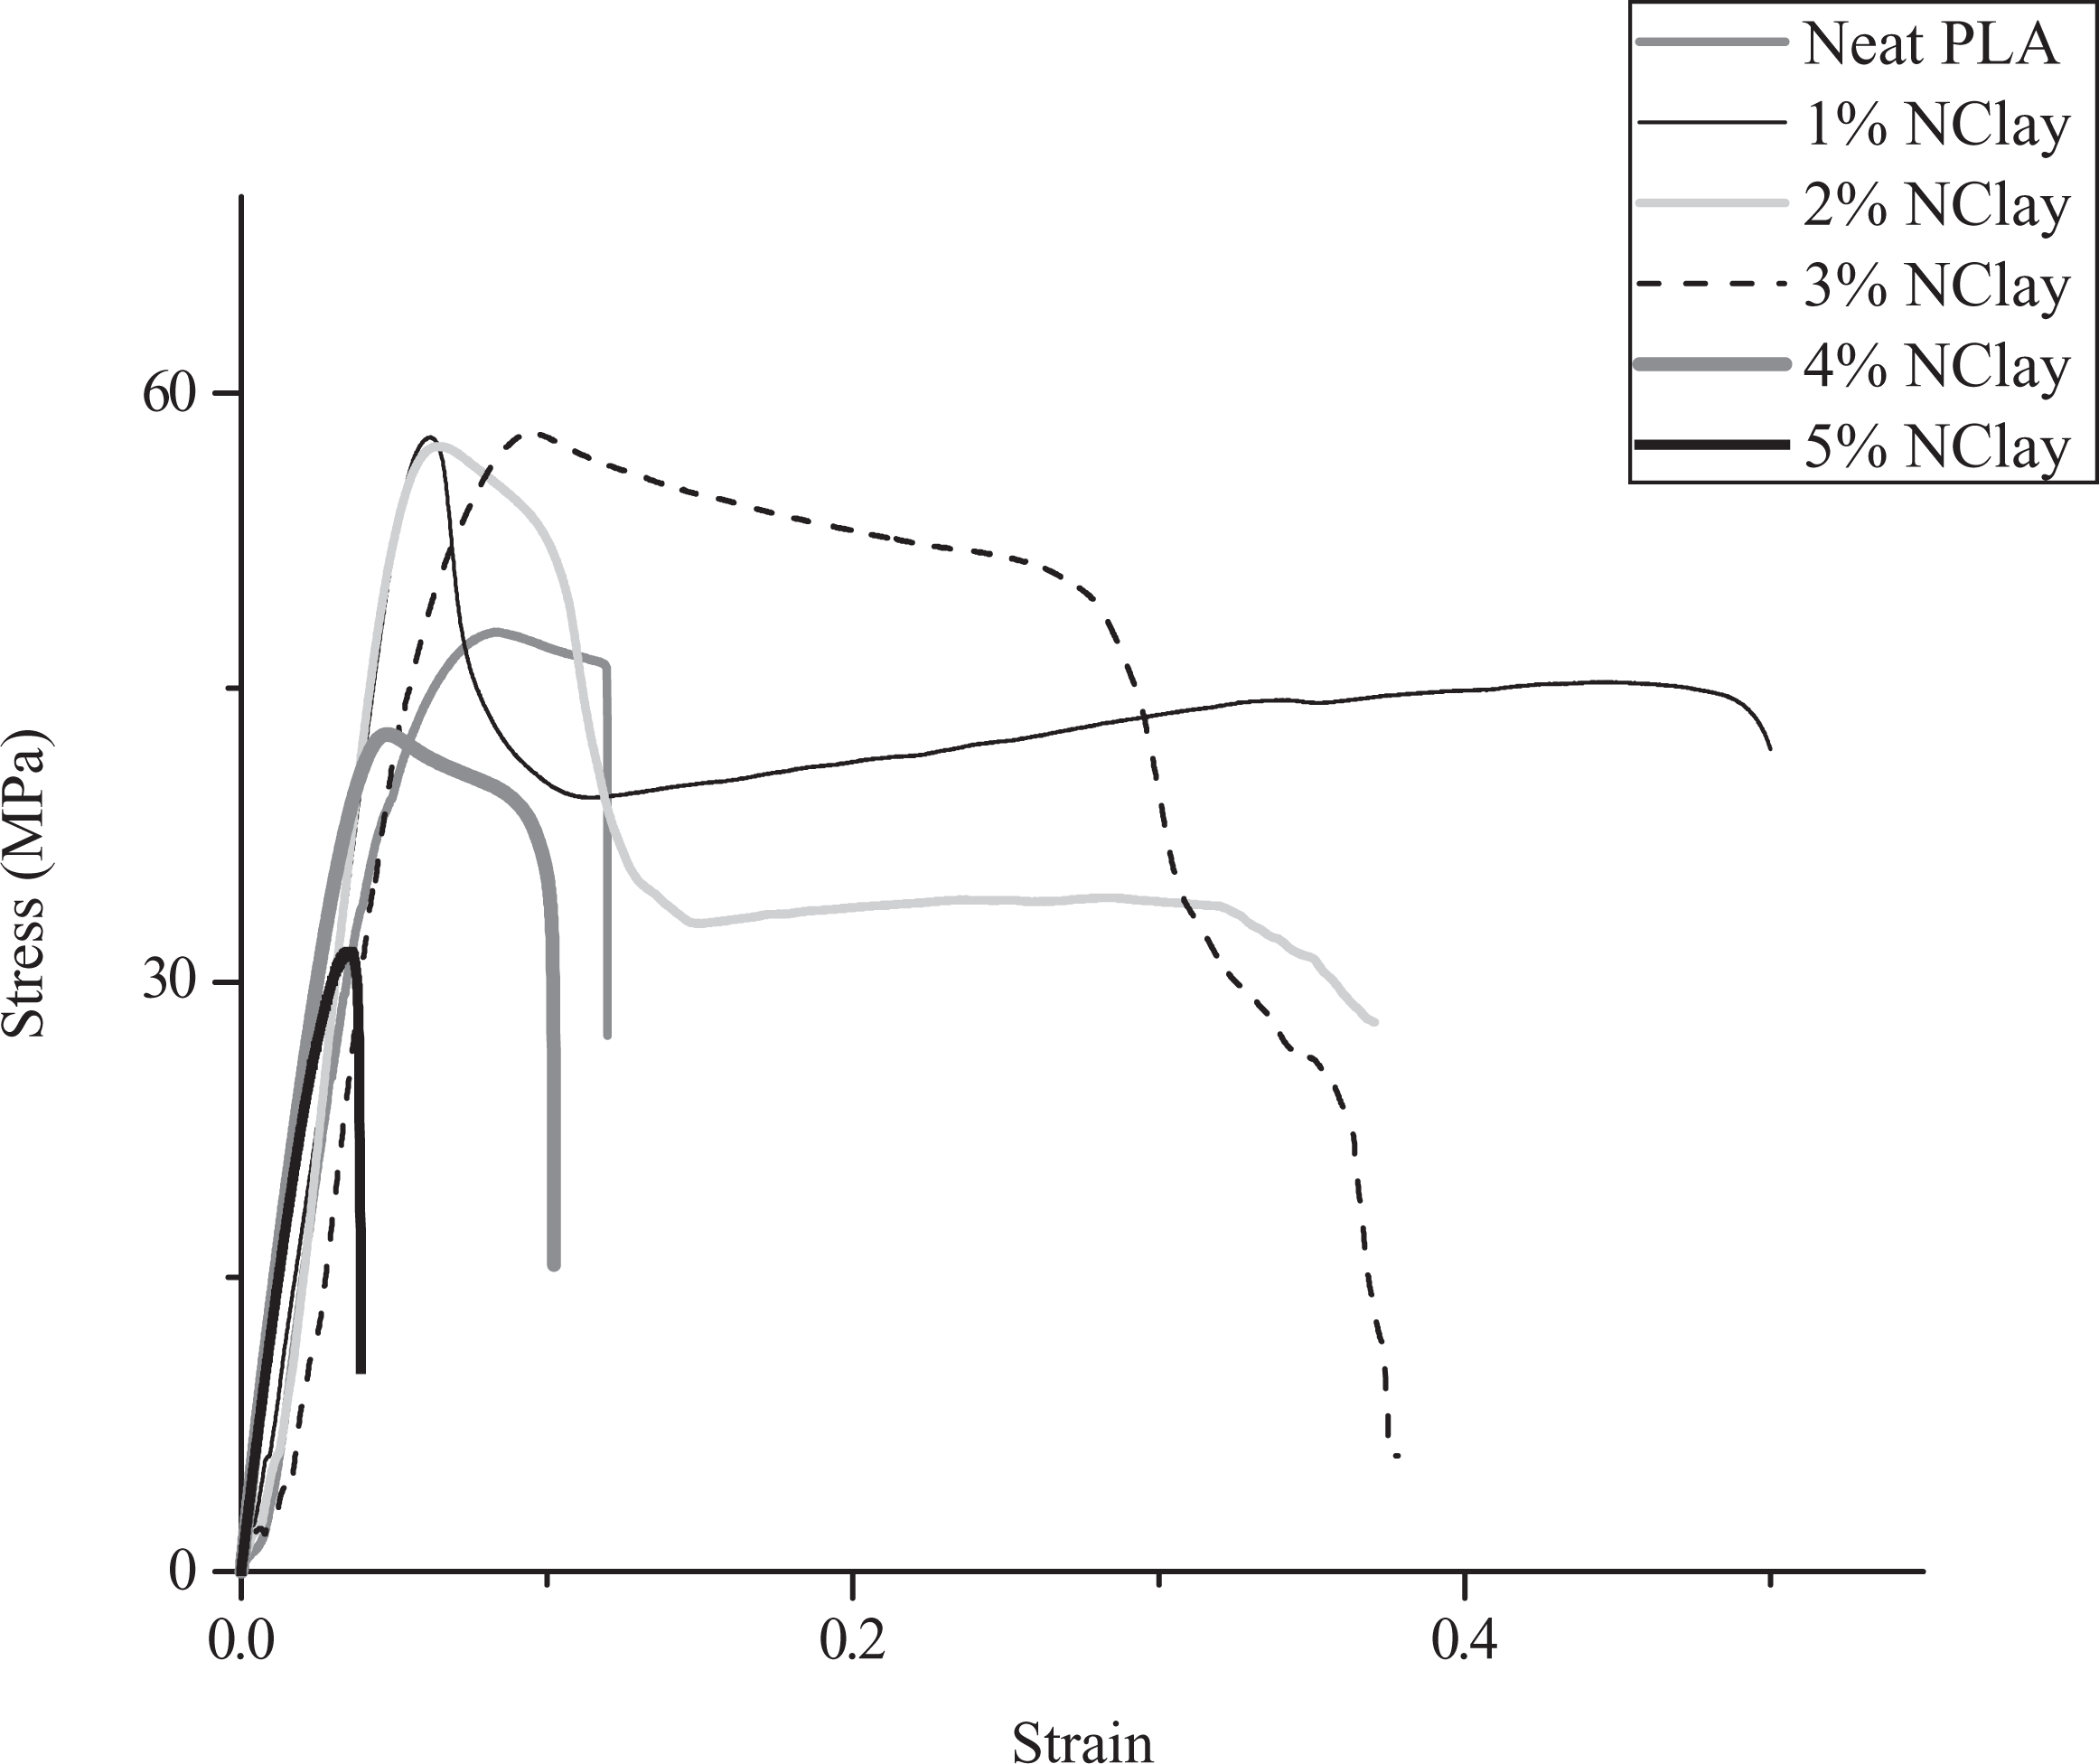
Stress–strain curves of the PLA-nanoclay composites and neat PLA. PLA: poly(lactic acid).
PLA-nanoclay composites and neat PLA results obtained by tensile testing.
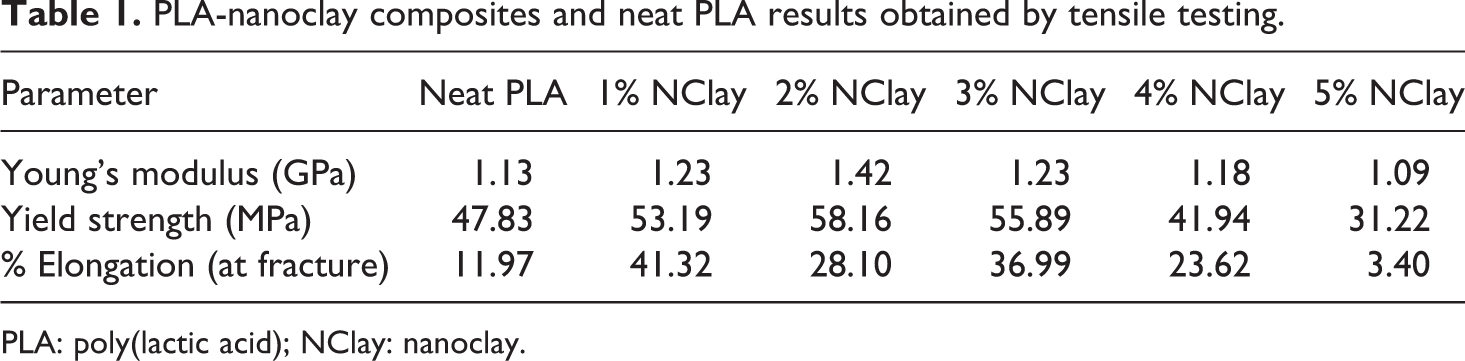
PLA: poly(lactic acid); NClay: nanoclay.
Yet another parameter that may be assessed from the curves of Figure 4 is the ductility of the composites which tends to be greater than that of the neat PLA as they are able to deform plastically to a greater extent before fracture. This is true for all the samples except for that with 5% nanoclay content. This is again supported by the values shown in Table 1, with the 1% composite exhibiting the greatest ductility. In addition, it can be seen that the 1% and 2% samples are quite similar in terms of the trend they follow. This is similar to the trend generally expected for composites. As part of this trend, there is an initial drop in the curve after the material has reached its ultimate tensile strength value. This initial drop is due to the fracture of the clay reinforcement. This drop is followed by a gradual increase in the strength of the material (which is very slight in the case of the 2% sample). This second rise in stress values is representative of the ultimate tensile strength of the matrix and the curve finally ends at the fracture point of the matrix. 23 This behavior is a result of the fact that the reinforcement tends to be of a higher strength but smaller ductility than the matrix. In addition, generally speaking, since composites are relatively macroscopic mixtures of phases/materials, it is logical that in a stress–strain curve of the composites, the individual properties of the component materials would become apparent to a certain extent. Moreover, the decline in the mechanical properties of the nanocomposites after the 3% composition may be attributed to the agglomeration of the nanoclay at these higher nanoclay concentrations, as is also shown by Lam et al. 19 This is also supported with the difficulty encountered in preparing these composite samples of higher nanoclay percentages, as mentioned previously in this article.
DMA of the PLA-nanoclay composites
The DMA bars were tested as specified in the previous section of this article, and the results obtained are shown in Figure 5. It must be mentioned that the DMA technique measures the storage moduli and loss moduli of a material and shows how the mechanical properties of a material vary with temperature changes. The complex modulus of a material, also known as its Young’s modulus, is a summation of its storage modulus and loss modulus. The storage modulus represents the stiffness of a viscoelastic material and is proportional to the energy stored during a loading cycle. It is therefore a measure of dynamic properties as opposed to the Young’s modulus which is a measure of the strength of the material in static conditions. Consequently, the storage modulus and Young’s modulus have different values for a single material, generally speaking. 24
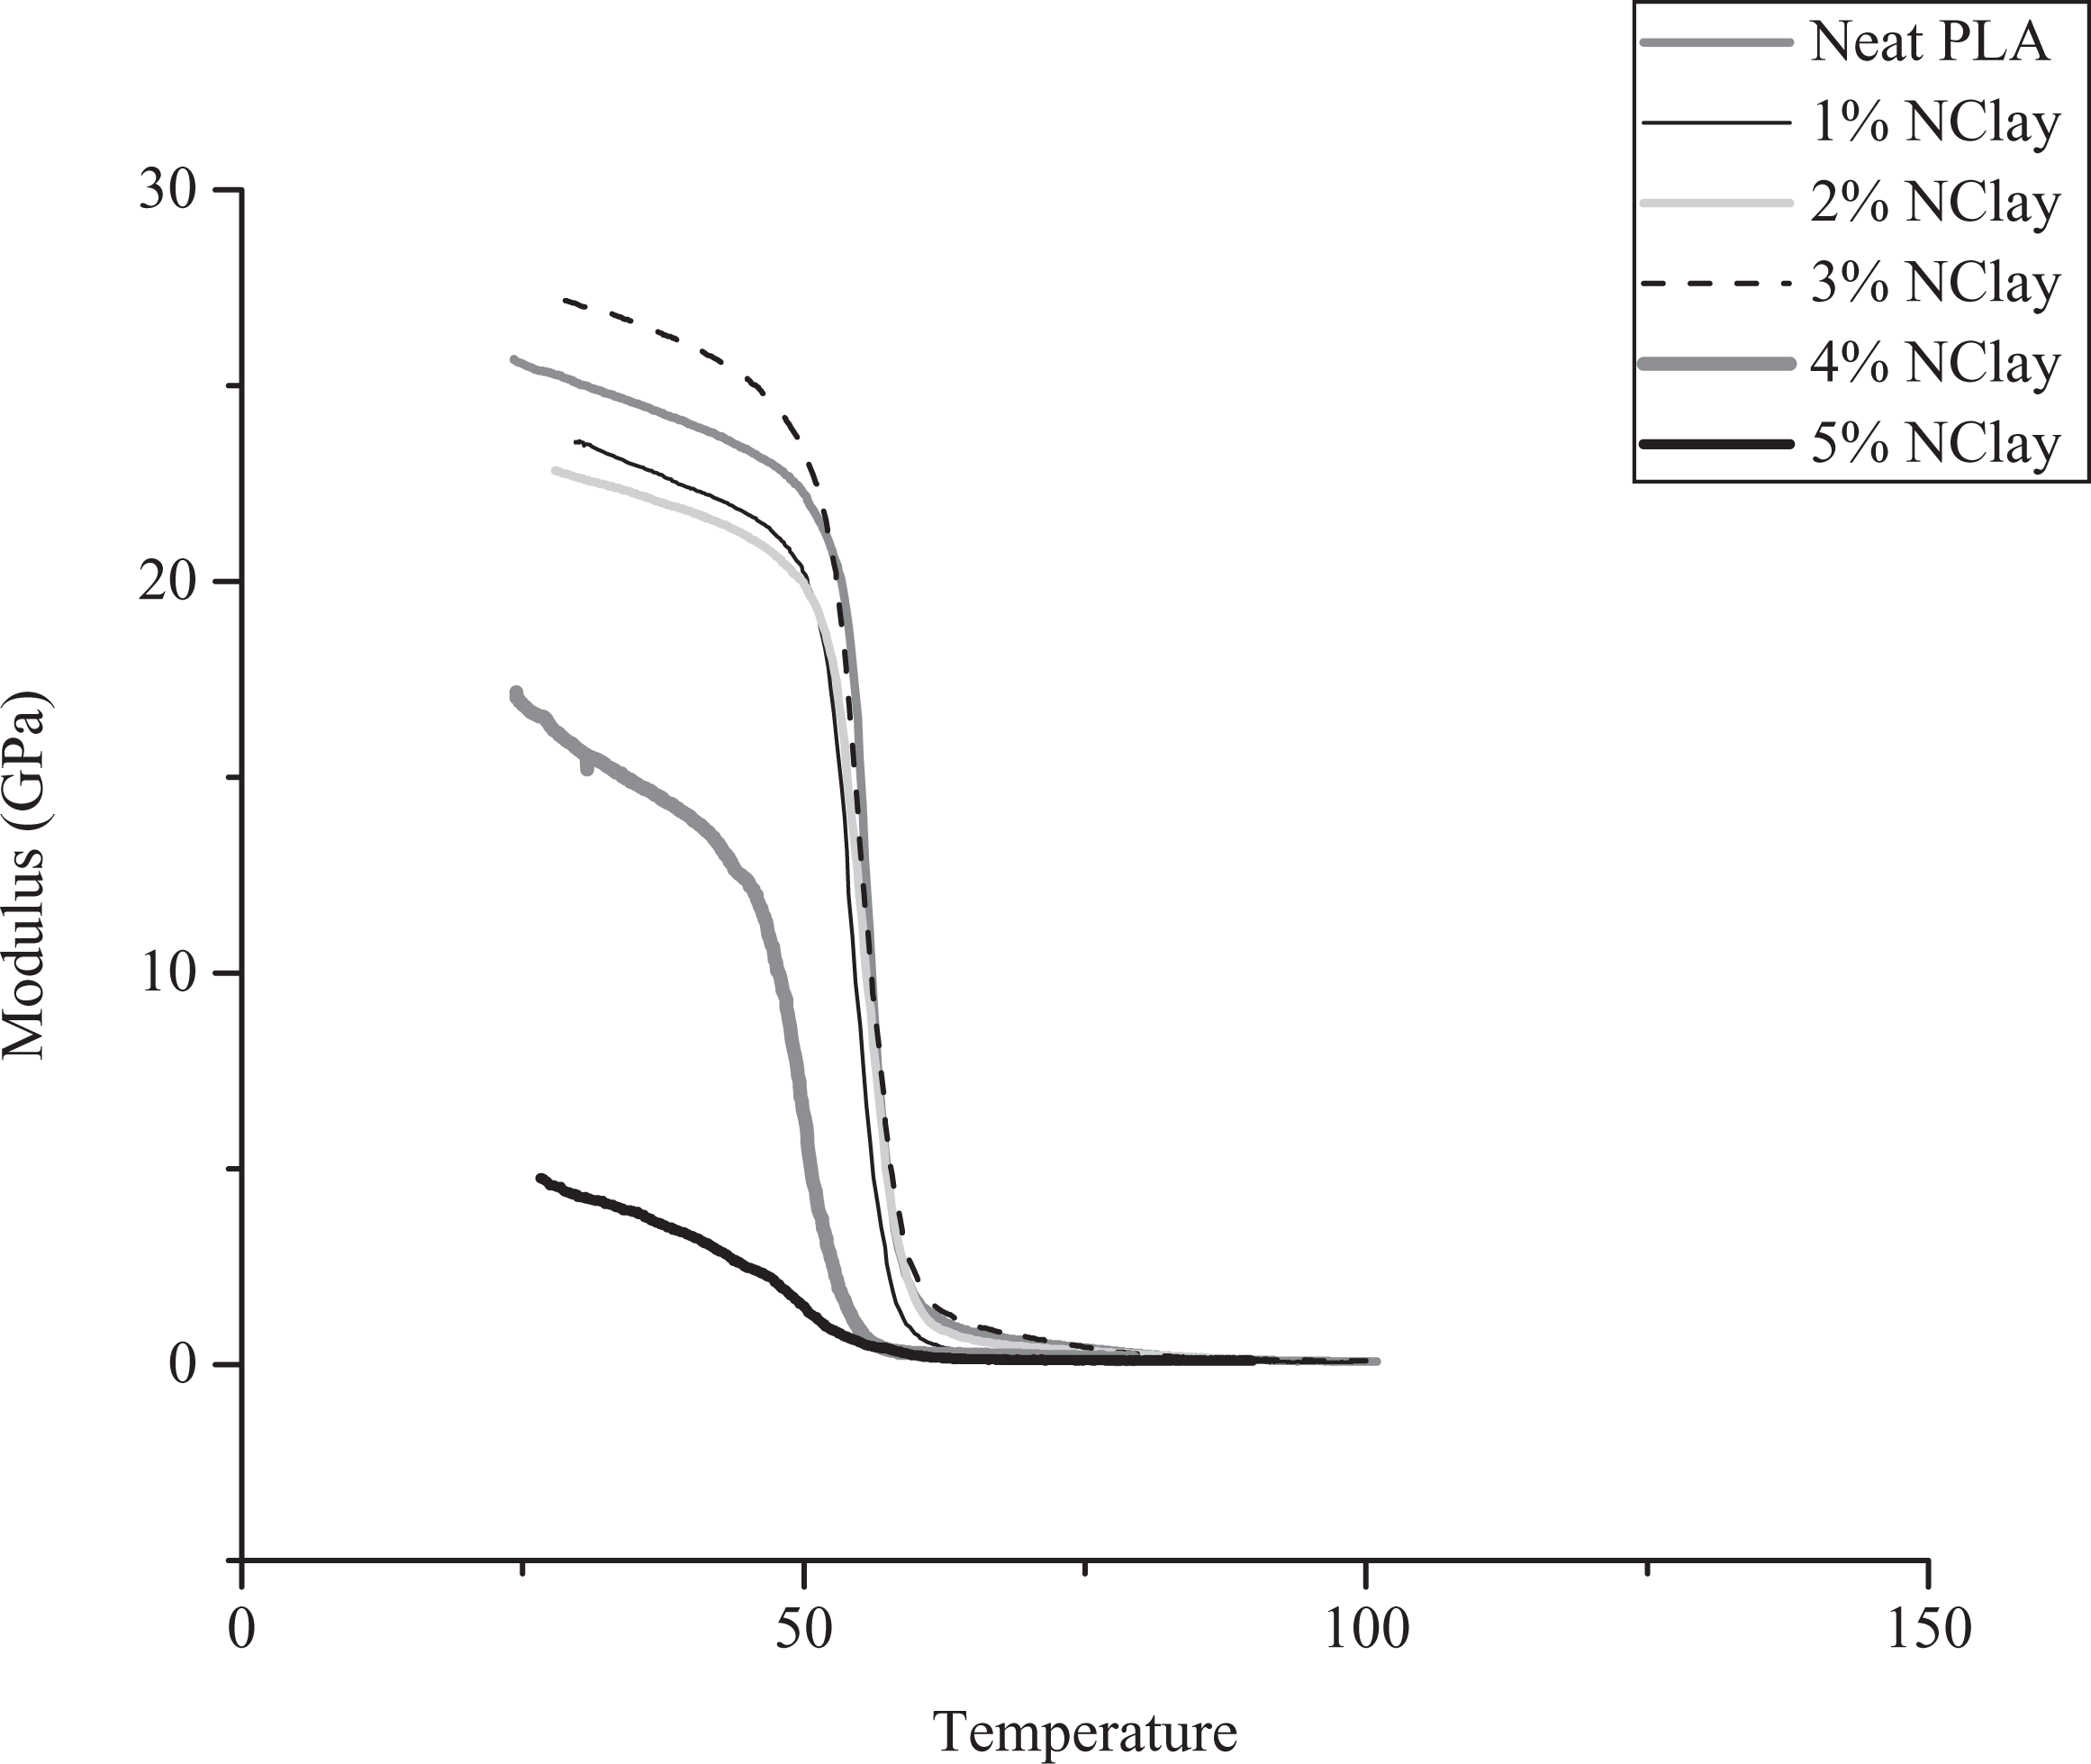
Modulus–temperature curves of the PLA-nanoclay composites and neat PLA obtained by DMA. PLA: poly(lactic acid); DMA: dynamic mechanical analysis.
The variation in the storage moduli of the nanocomposites with temperature is demonstrated in Figure 5, and it can be seen that all the specimens, except those with 4% and 5% nanoclay, experience a drastic decrease in the mechanical strength at the temperature range of approximately 50–60°C, since it is within this temperature range that the T g of PLA lies. With respect to the values of the storage modulus closer to room temperature, it is found that the 1% and 2% composites have similar values which are lower than the corresponding values for neat PLA. It may be interesting to note that even for the tensile test data, the trends followed by the 1% and 2% composites were quite similar to one another. However, the 3% composite displays a jump in the storage modulus value, yielding values even higher than those of the neat PLA sample. The 4% and 5% samples, on the other hand, have values much lower than the 1% and 2% samples. These findings are supported with the values shown in Table 2, which provides storage modulus values at the arbitrary temperature of 30°C.
PLA-nanoclay composites and neat PLA storage modulus values obtained by DMA.
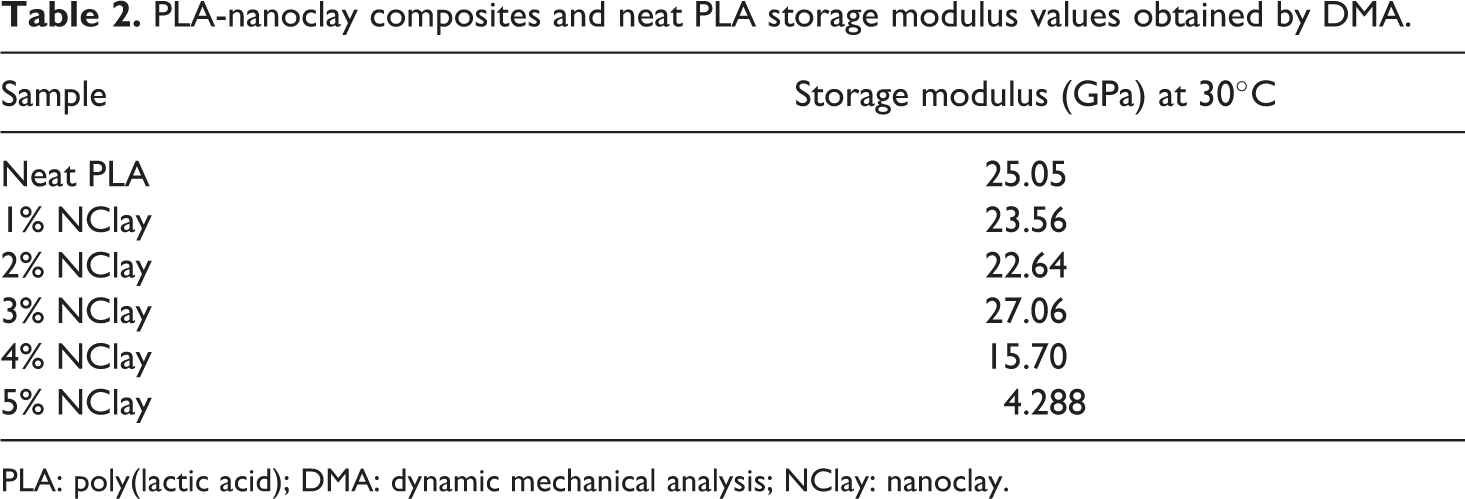
PLA: poly(lactic acid); DMA: dynamic mechanical analysis; NClay: nanoclay.
On the basis of all the mechanical properties described above, it may be deduced that when preparing such composites, the optimum composition to employ is that of using 3% nanoclay.
Thermal analysis
Tg variation
The T g is defined as the temperature at which a polymeric material, upon cooling, changes from a rubbery state to a glassy state. This temperature is not well defined as it occurs gradually over a broad temperature range which is known as the glass transition region. 25 The T g can be calculated from a variety of methods such as DMA and DSC. In the case of DSC data, the specified T g value tends to be the midpoint of the glass transition region and it is usually calculated with the help of the “intersection of the extrapolated tangent lines from the glassy region at lower temperatures and the rubbery region at higher temperatures”. 25 In the case of DMA data, the T g value tends to be the peak of the tan delta curve, where tan delta represents the ratio of the loss modulus of the material to its storage modulus. It must be remembered that DSC and DMA measure different processes and as a result, the T g values obtained by each of these methods may vary. In fact, a difference as great as 25°C can be observed between the data from the DSC and the DMA data for a single material. 24 Furthermore, the T g is exceedingly dependent on the structural, constitutional, and conformational features of polymers, 26 and so factors such as the chain flexibility, cross linking, and molecular weight have a significant effect on the T g value of a polymer. 11
Figure 6 shows the DSC curves of the nanocomposite samples, while Figure 7 shows the tan delta curves for the same samples obtained with the DMA. The values of the T g for different samples obtained through both these procedures are summed up graphically in Figure 8. As explained previously, there is a difference in the T g values for a single sample according to whether the value was obtained through DMA or DSC. In addition, the DMA values are higher than those obtained by way of DSC, and this is supported by the values found in the literature. 27 However, it is important to note that regardless of which instrument was used to obtain the T g value, the trend followed by the T g values from one composition to the next is the same. As part of this trend, at the beginning, the T g gradually increases from neat PLA until it reaches its peak value at the loading level of 2% nanoclay. Thereafter, the value begins to decrease. The initial increase in the T g may be explained by the fact that as clay is added to the PLA, the heat of fusion of the PLA is found to decrease, which leads to a slight decrease in its crystallinity. 21 Moreover, less crystalline PLA is known to have higher glass transition temperatures. 28
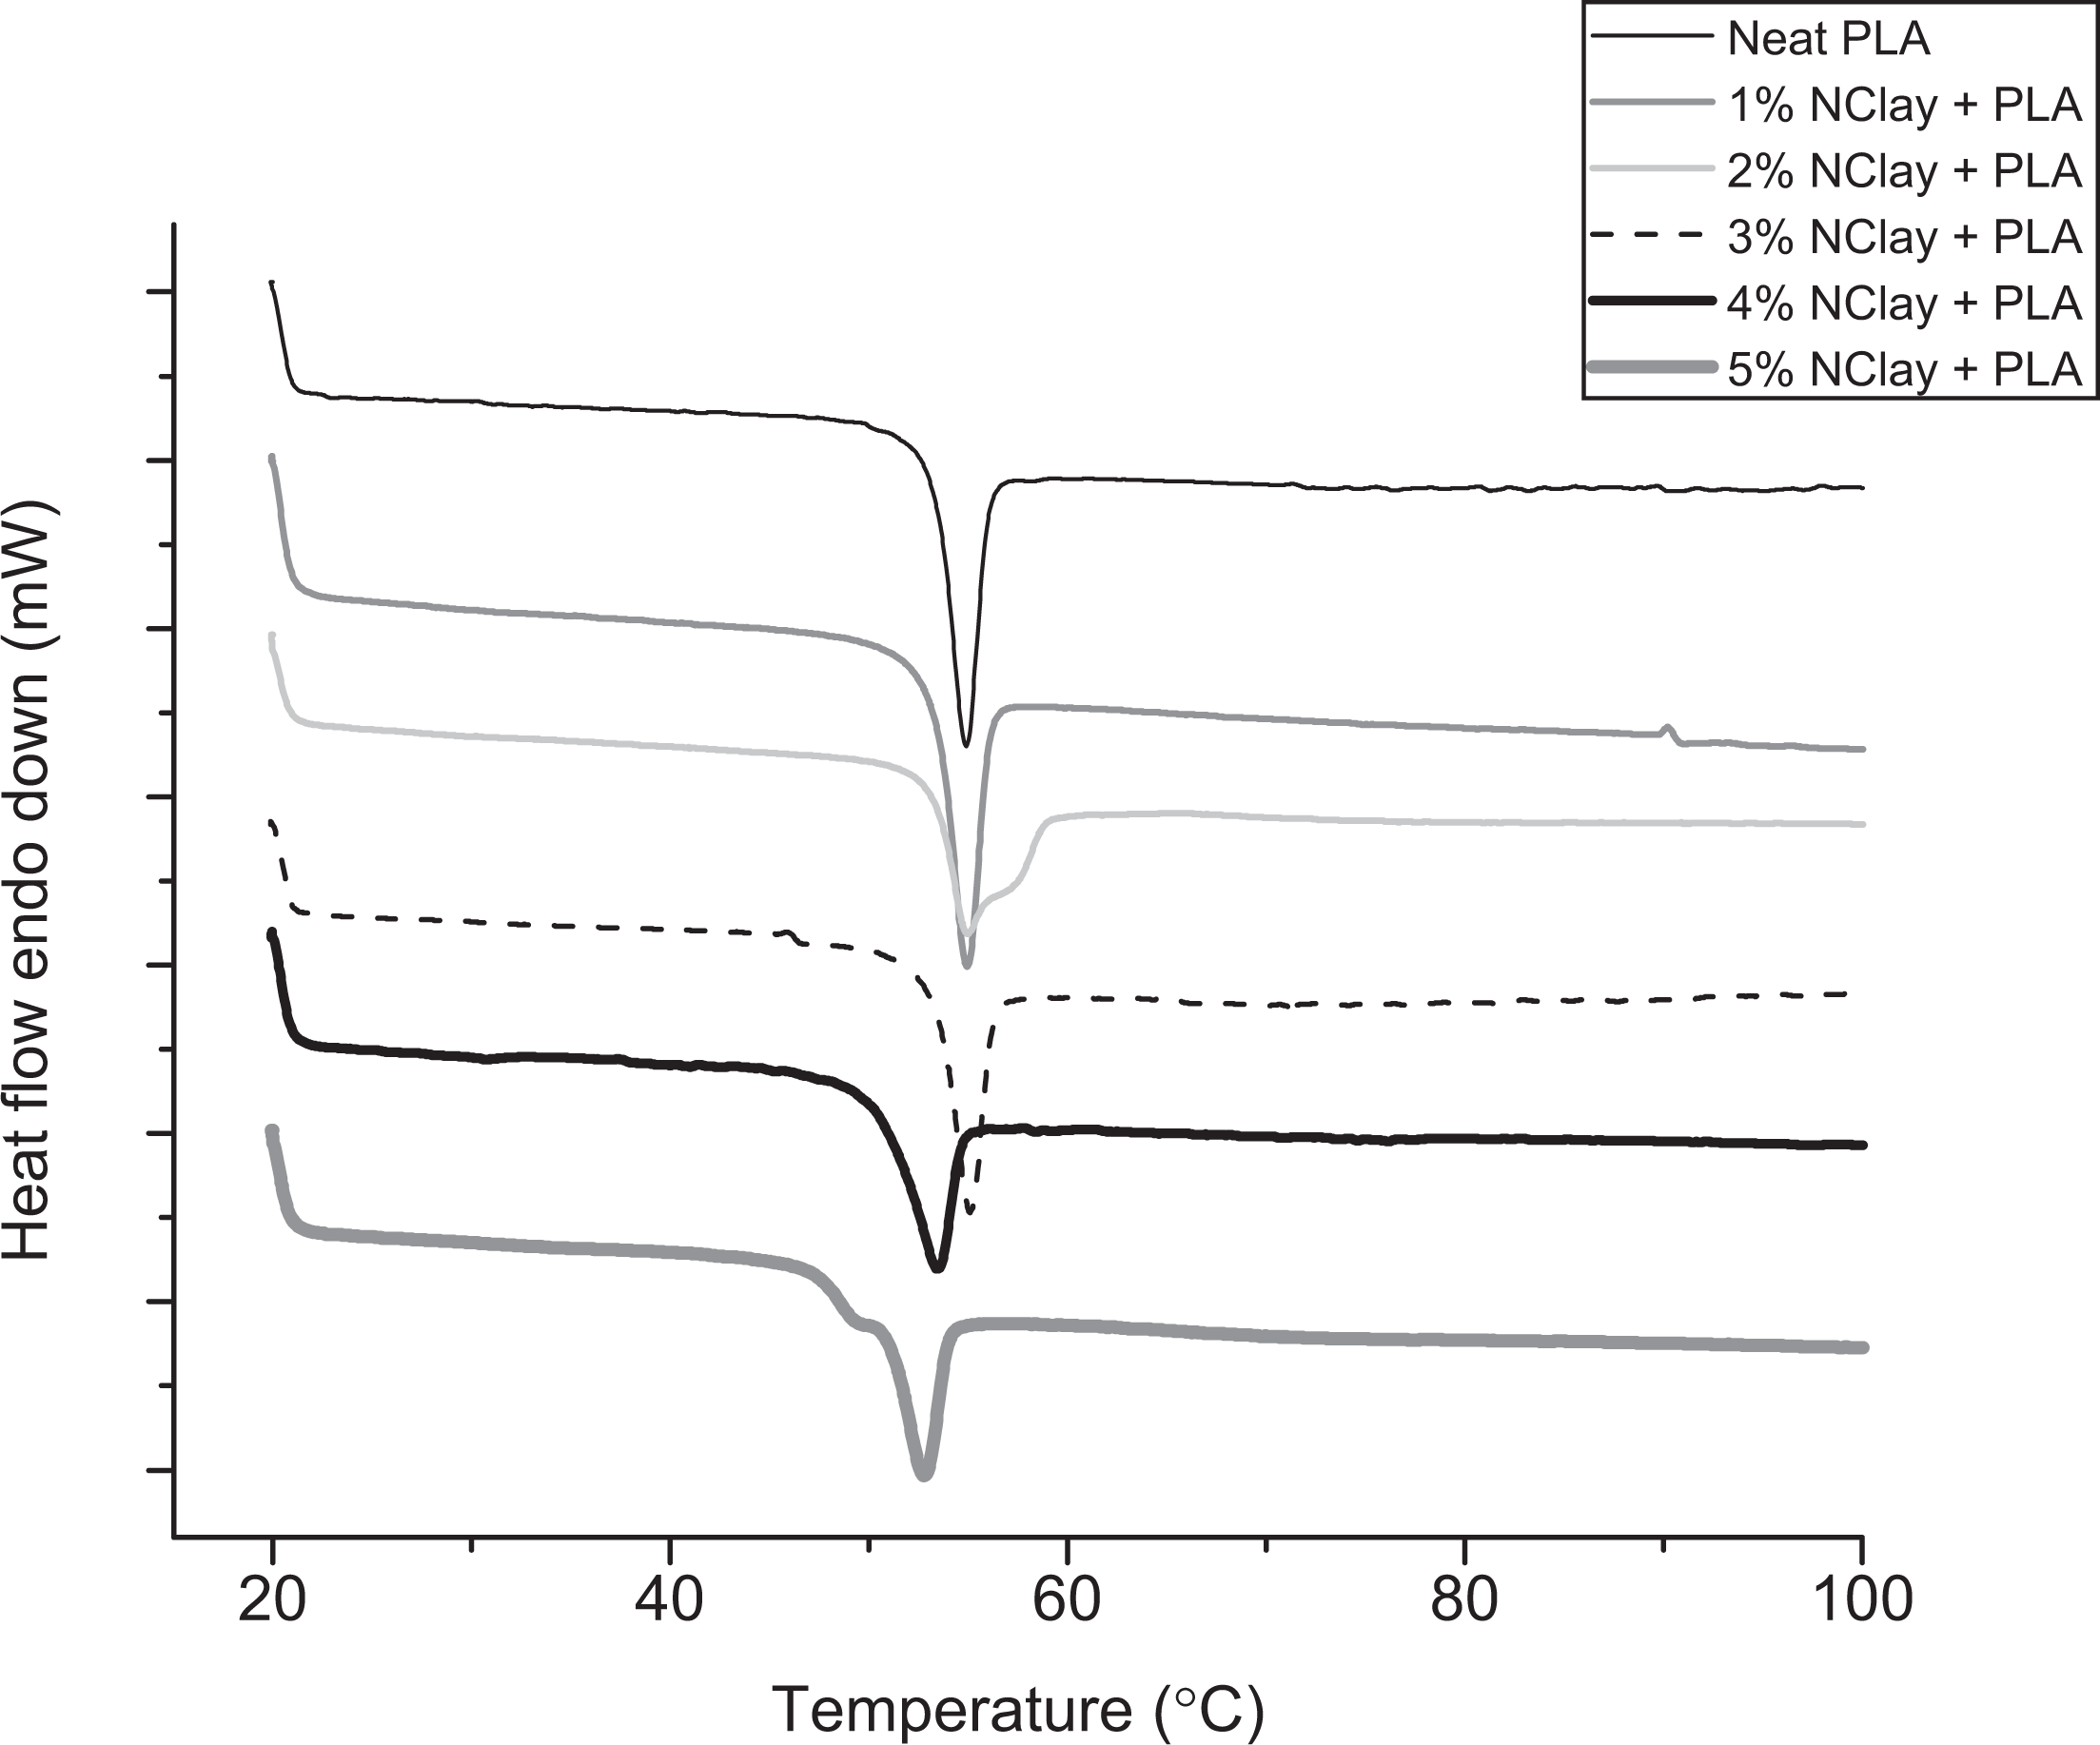
DSC curves obtained for the different nanoclay/PLA composite samples. PLA: poly (lactic acid); DSC: differential scanning calorimetry.
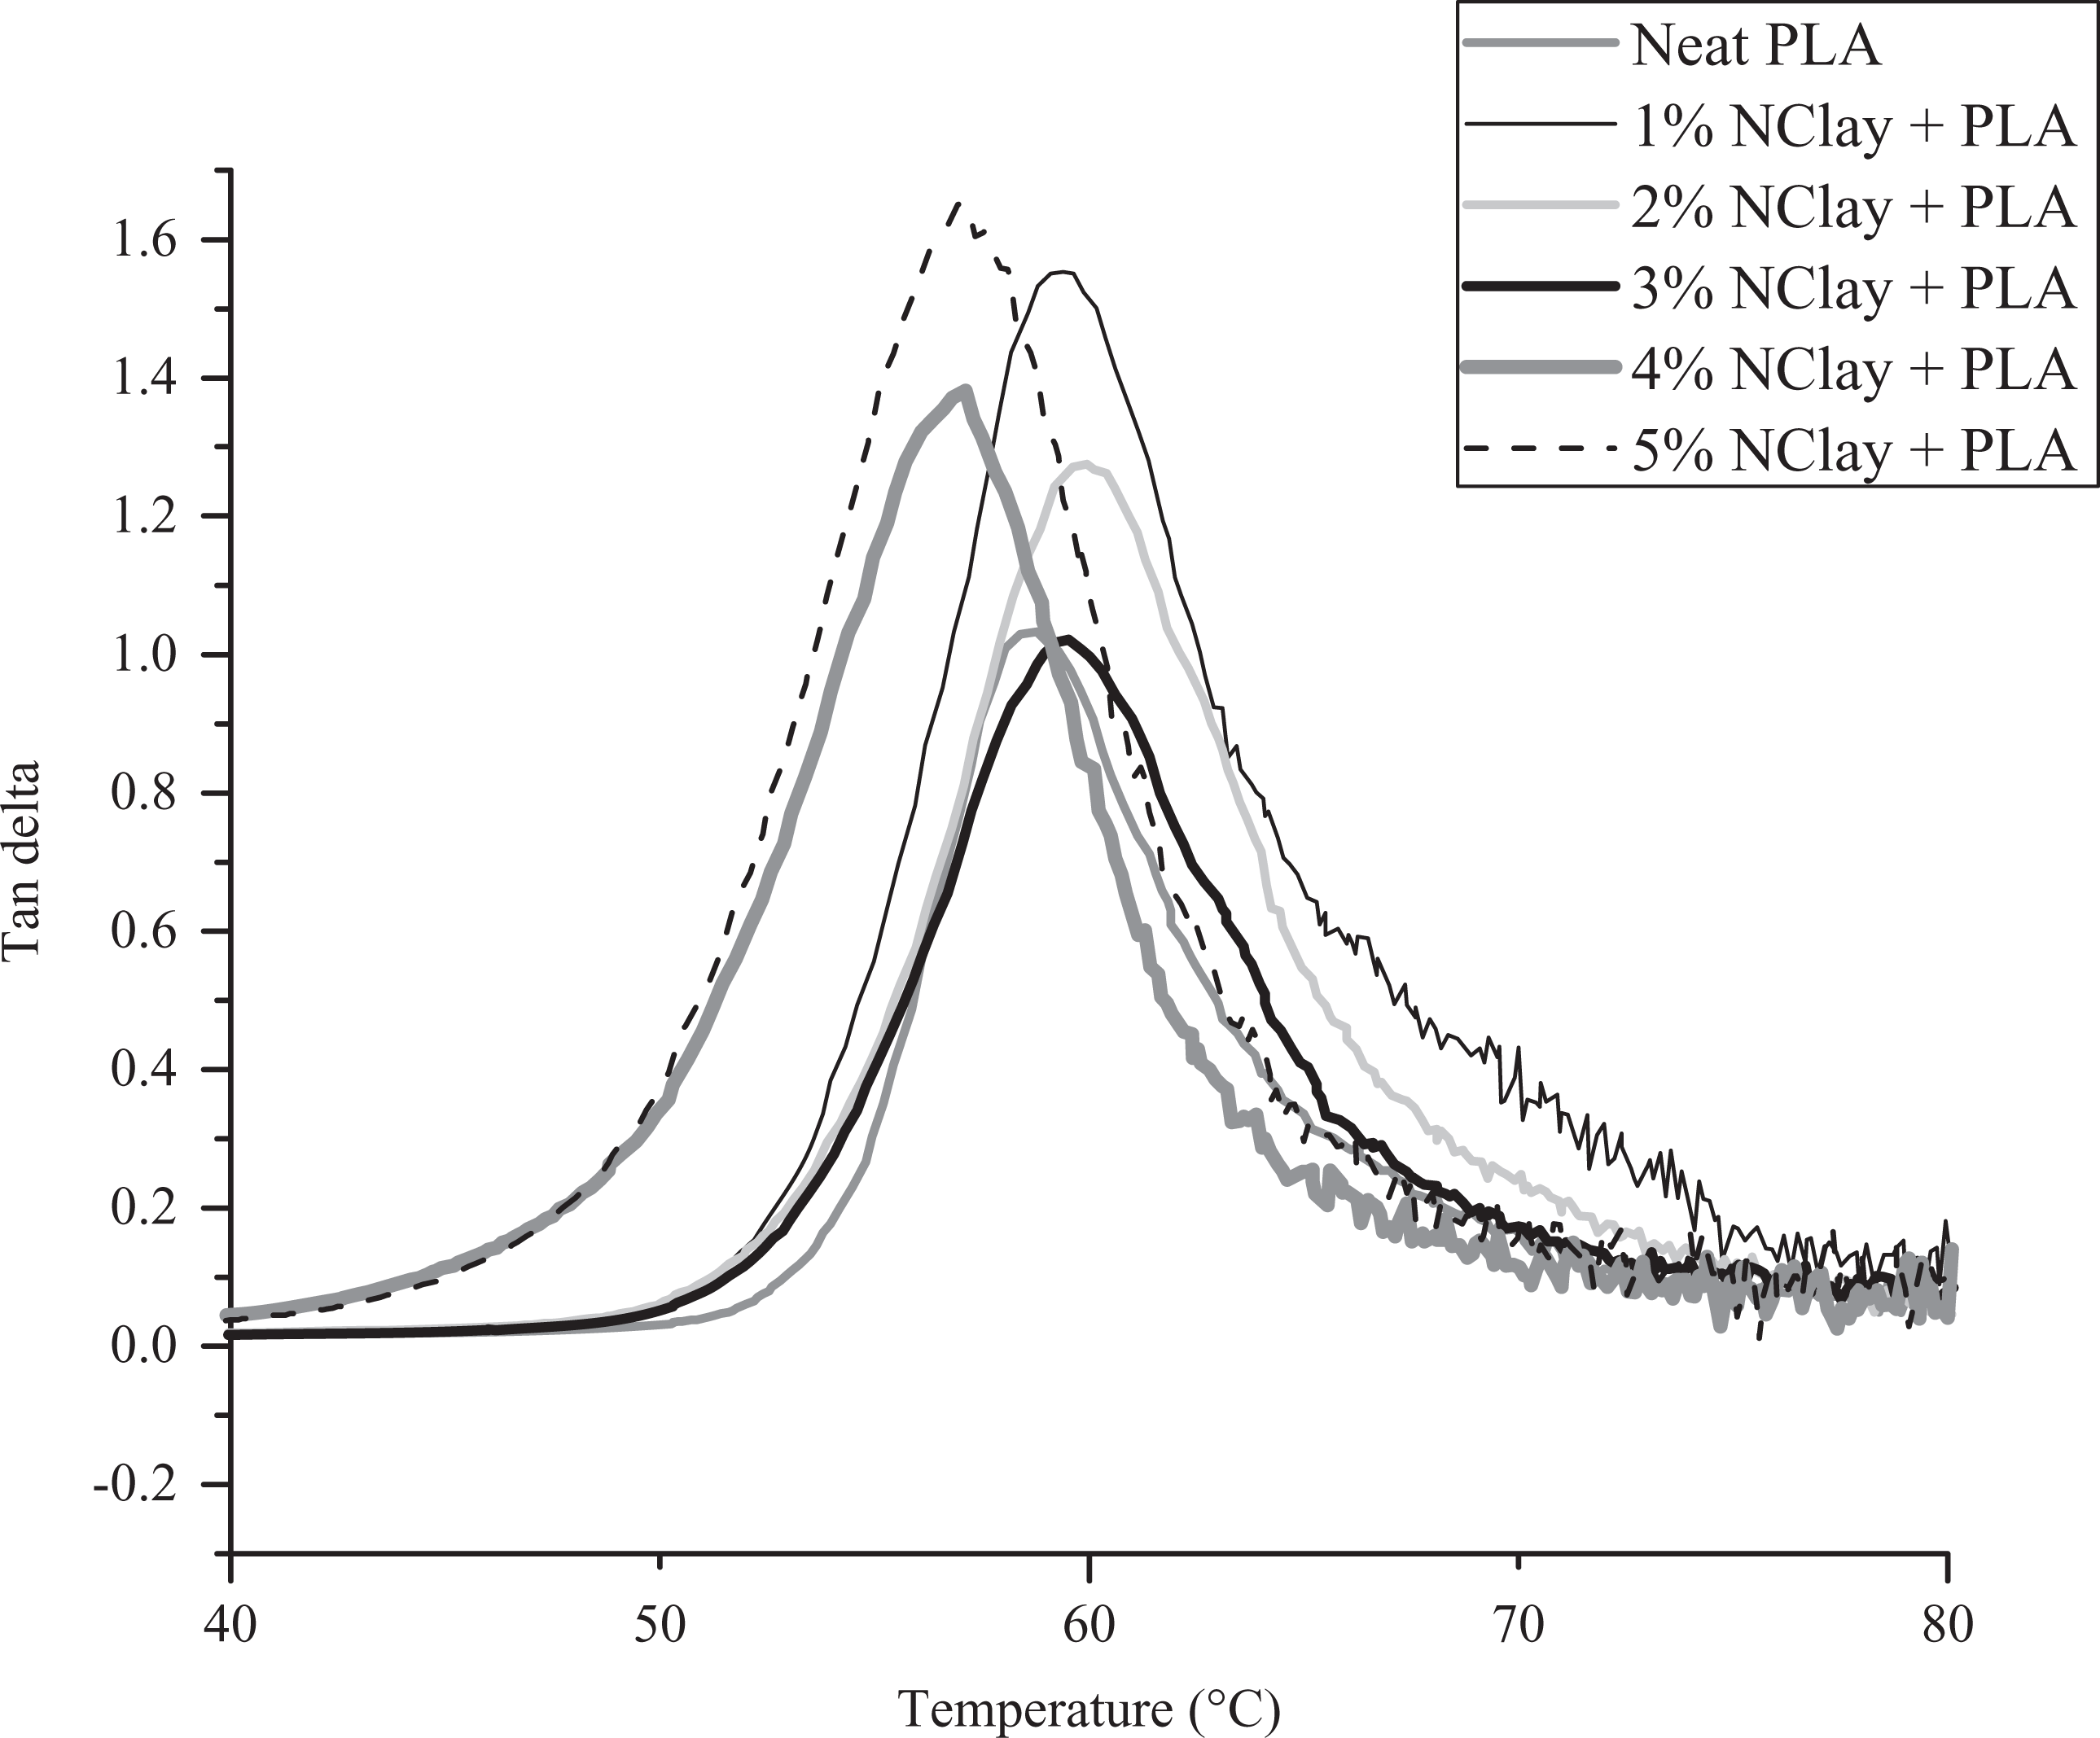
Tan delta curves obtained for the different nanoclay/PLA composite samples using DMA. PLA: poly(lactic acid); DMA: dynamic mechanical analysis.
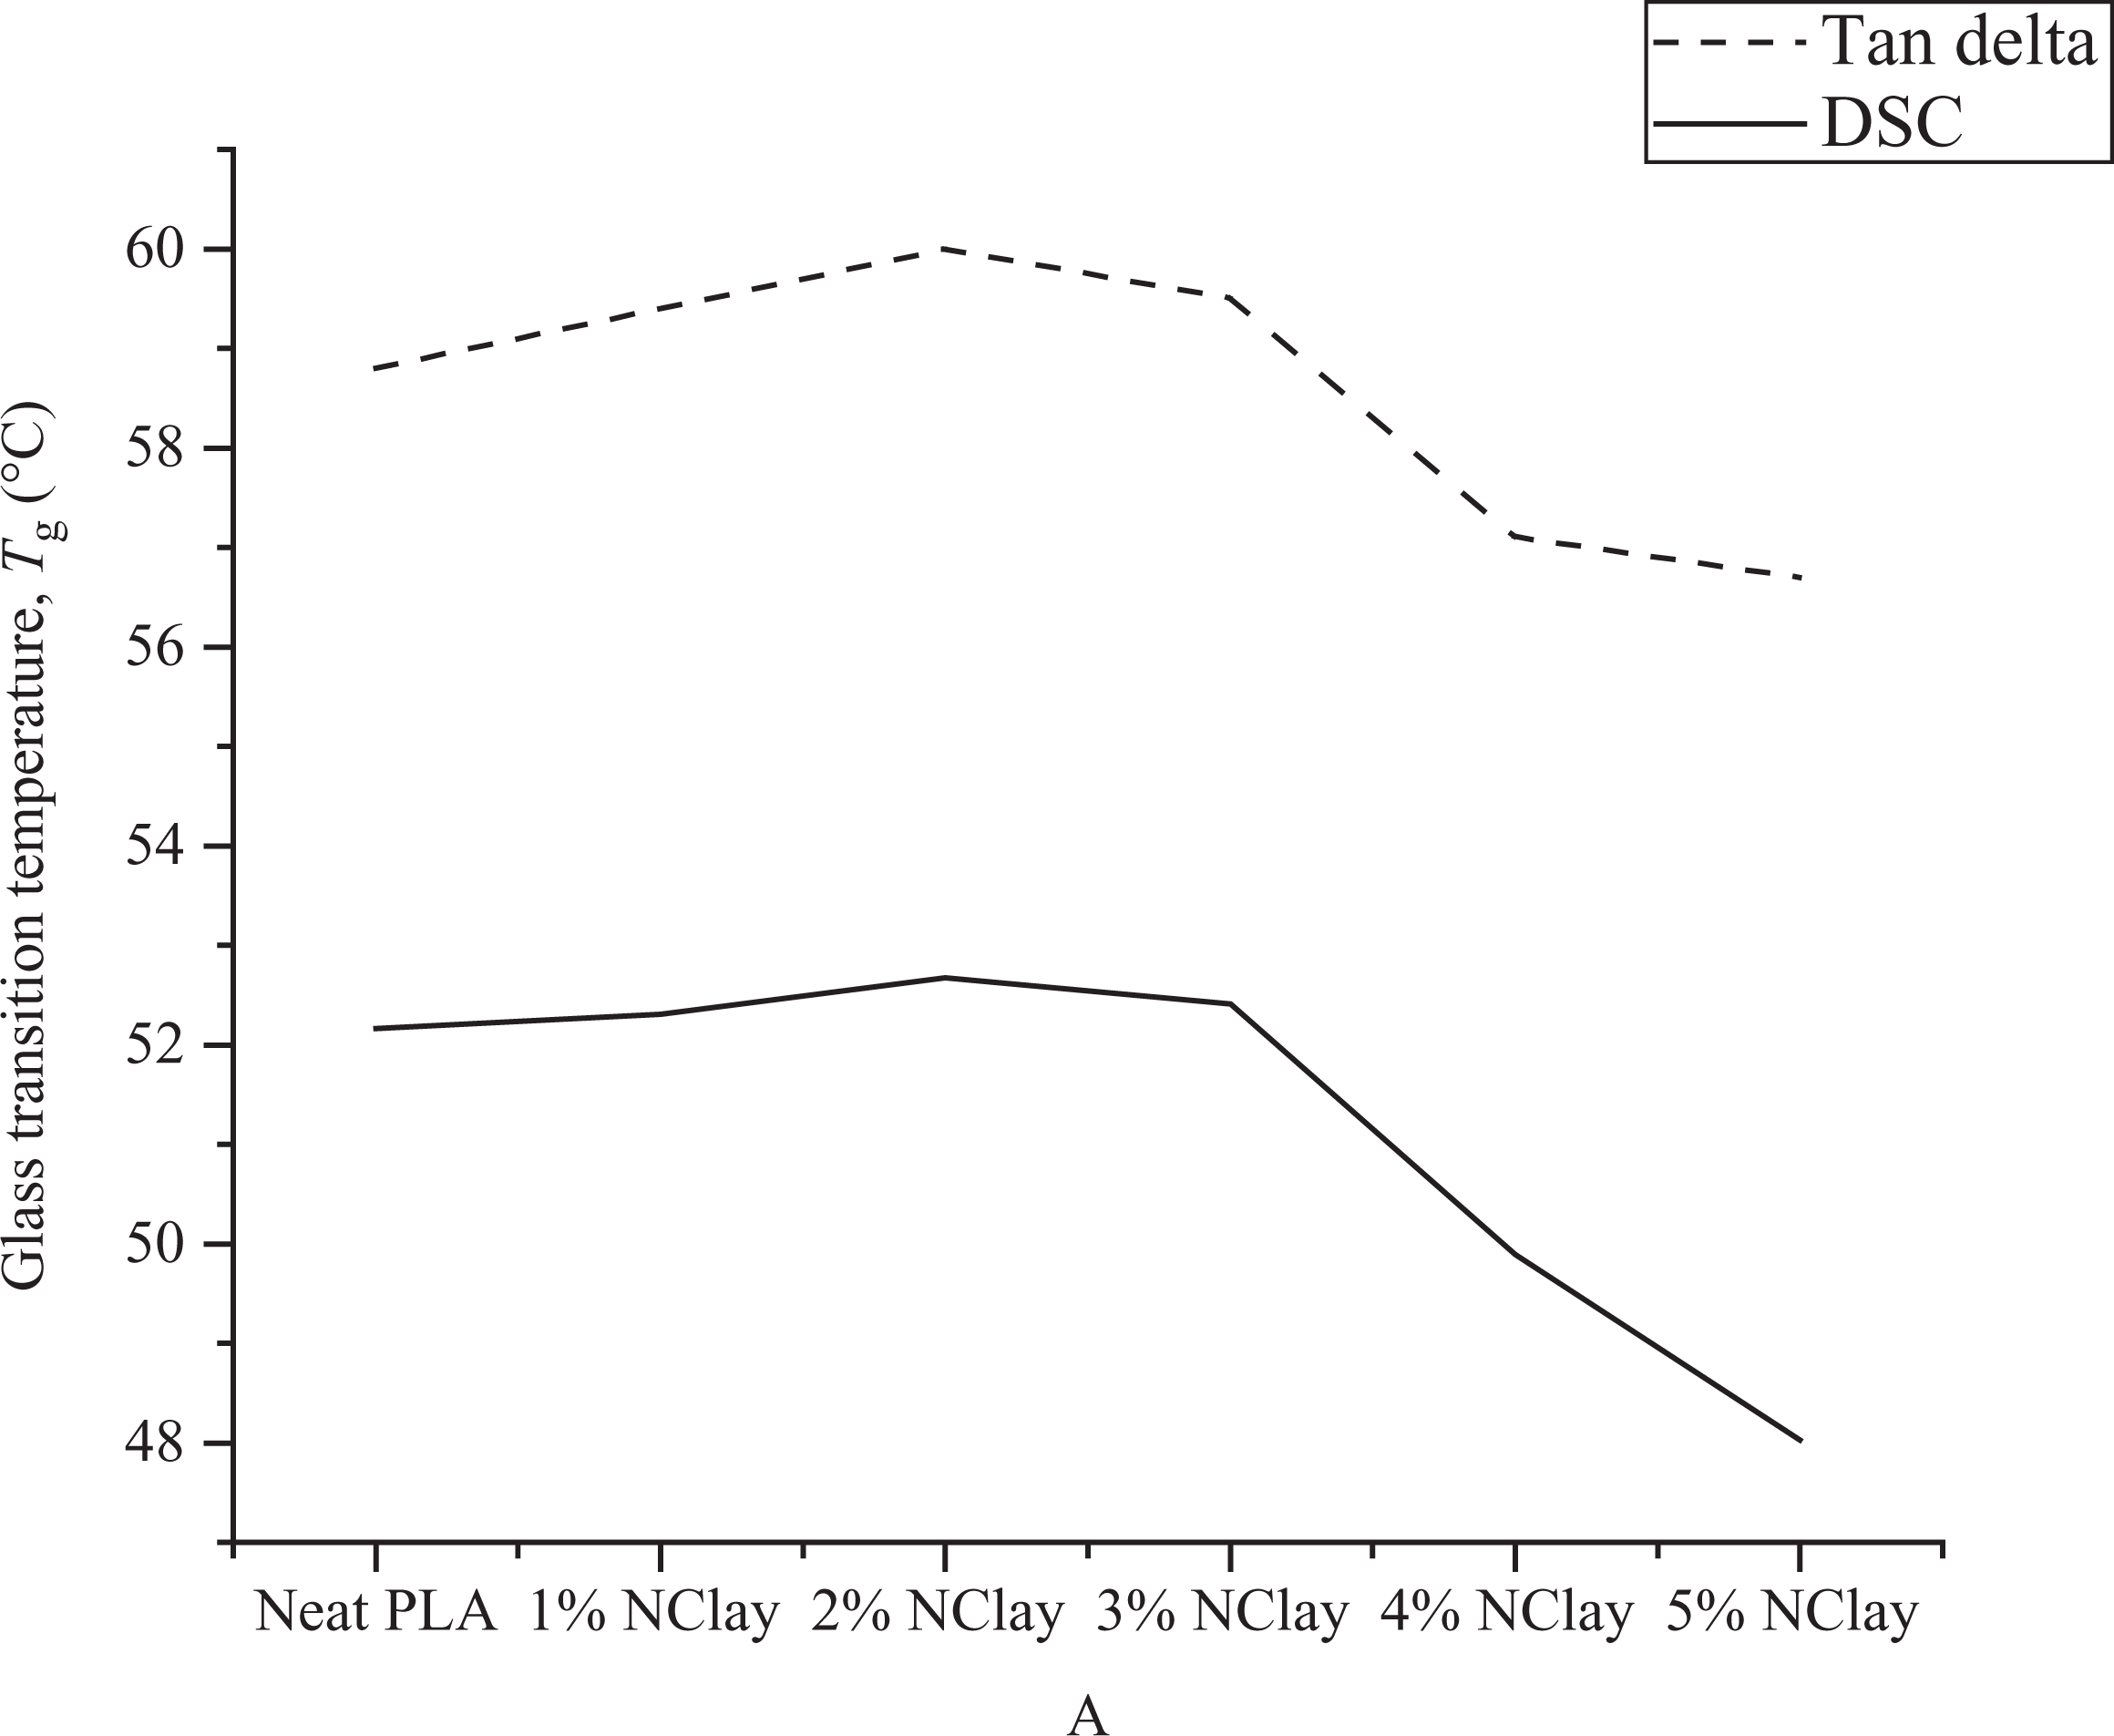
A comparison of the trend observed in the T g values obtained for the various composite samples using both DSC and DMA. DMA: dynamic mechanical analysis; DSC: differential scanning calorimetry; T g: glass transition temperature.
On the other hand, the T g value reaches a maximum at a percentage composition of 2% nanoclay. After that, there is a decrease in the T g values as the clay percentage in the nanocomposites increases. This may be attributed to the opposite of the confinement effect. The confinement effect represents a decrease in the free volume in the polymer matrix due to the cross linking between the carbonyl group of the PLA and the organic modifier of the nanoclay in the form of hydrogen bonds. 11 Since after a certain limit, the nanoclay being added to the PLA no longer causes a decrease in the free volume of the nanocomposites, the larger number of nanoclay particles in the PLA matrix prevents the chains from packing compactly. 11 Thus, the reduced T g values are due to the enhanced flexibility and mobility of the PLA backbones, which are a result of the presence of the nanoclay. 29
It is important to optimize the percentage of clay in the nanocomposites. The Tg is important in that it indicates the temperature at which the polymer will become rubbery and so easier to employ in manufacturing. From that perspective, it would be wise to investigate greater clay-loading levels since it is expected that the T g value will fall even more at loading levels beyond the 5% nanoclay composition, and lower T g values would mean that less energy is needed to process the material. At the same time, if the PLA/nanoclay composite is used in such an application where it is important that it maintain its mechanical rigidity and glassy structure at elevated temperatures, then increased T g values would be preferred and nanocomposites with 2% nanoclay may be favored.
SEM characterization of the material fracture surfaces
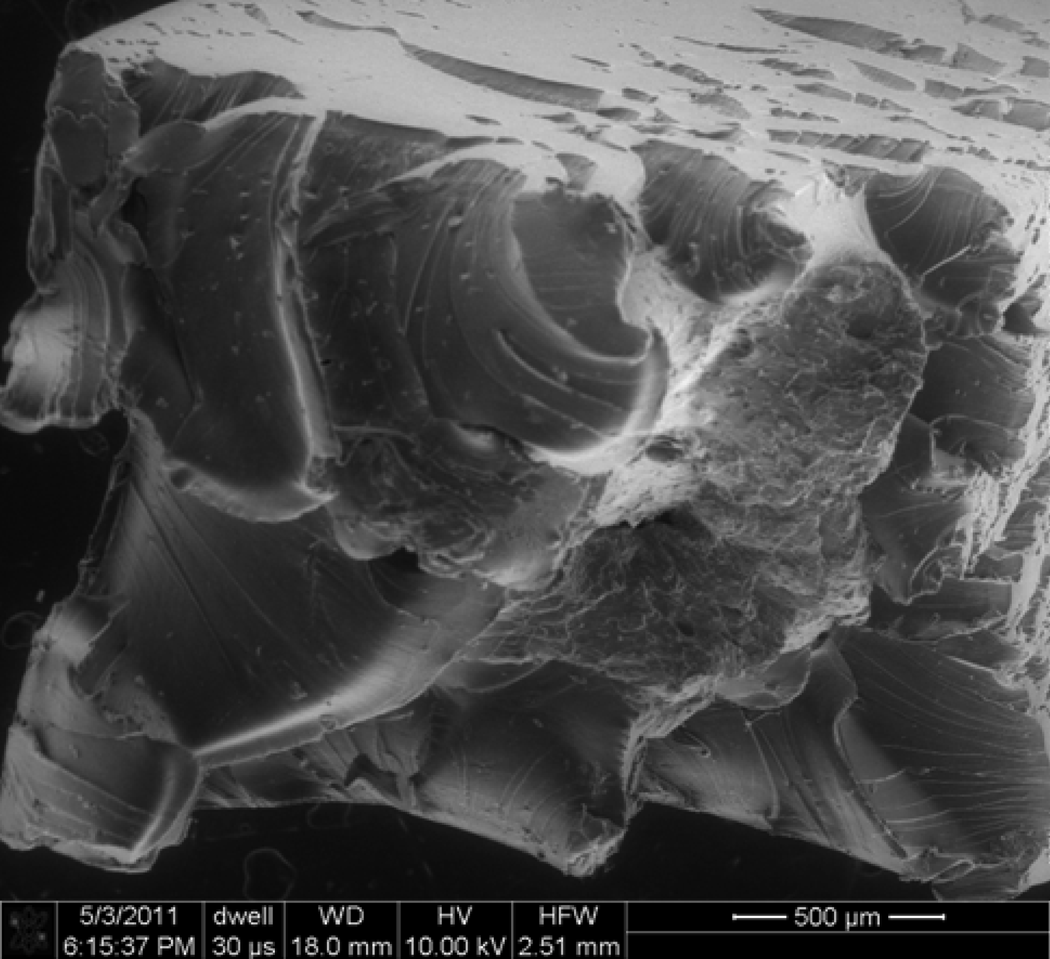
SEM images of the fracture surface of both the neat PLA tensile test specimen (Figures 9 and 10) and the 1% PLA-nanoclay composite tensile test specimen (Figures 11 and 12) were taken. Figure 9 shows that the complete fracture surface and the cleavage that can be seen are characteristic of brittle fracture. This cleavage is shown more detail in Figure 10. Similar images have also been published by Zaidi et al., but those images focus on the difference in the fracture surfaces before and after being exposed to 130 days of natural weathering 30 and do not reflect on the information about the mechanical properties of the composites which can be obtained from the images.
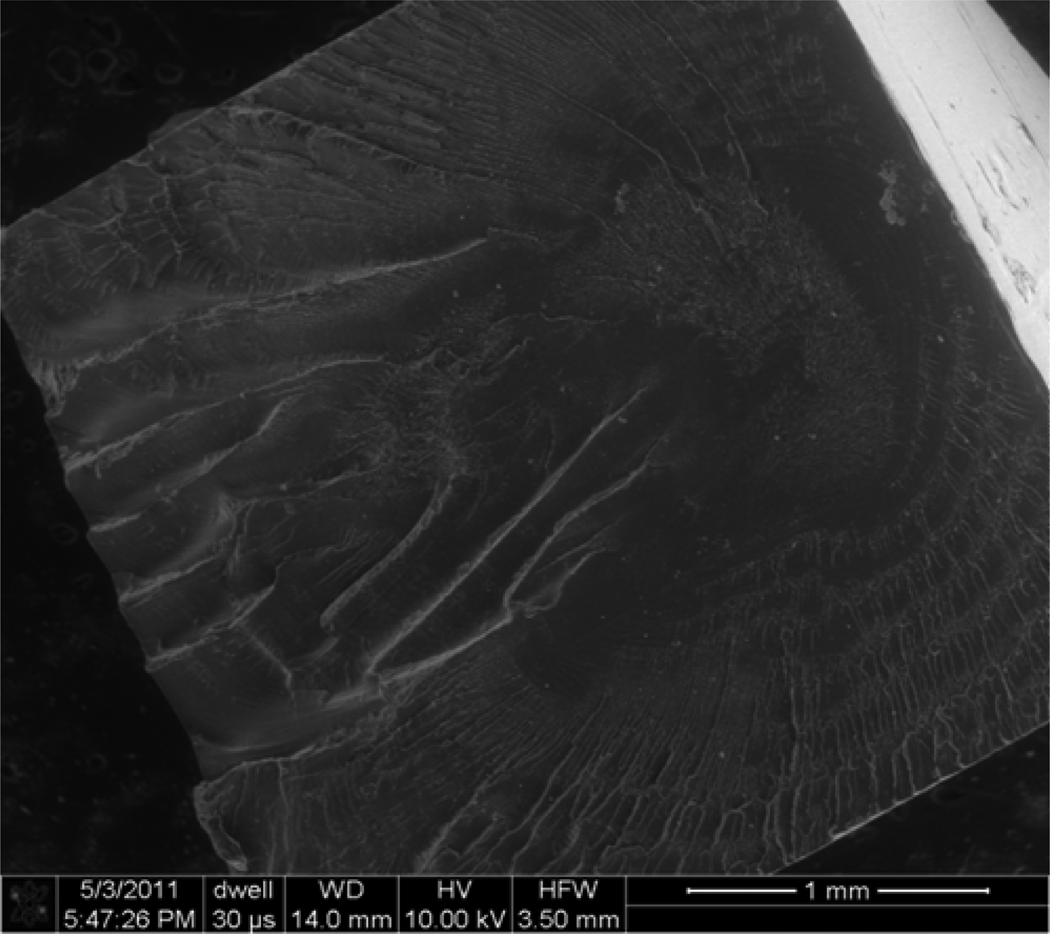
SEM image of the neat PLA facture surface. PLA: poly(lactic acid); SEM: scanning electron microscopy.
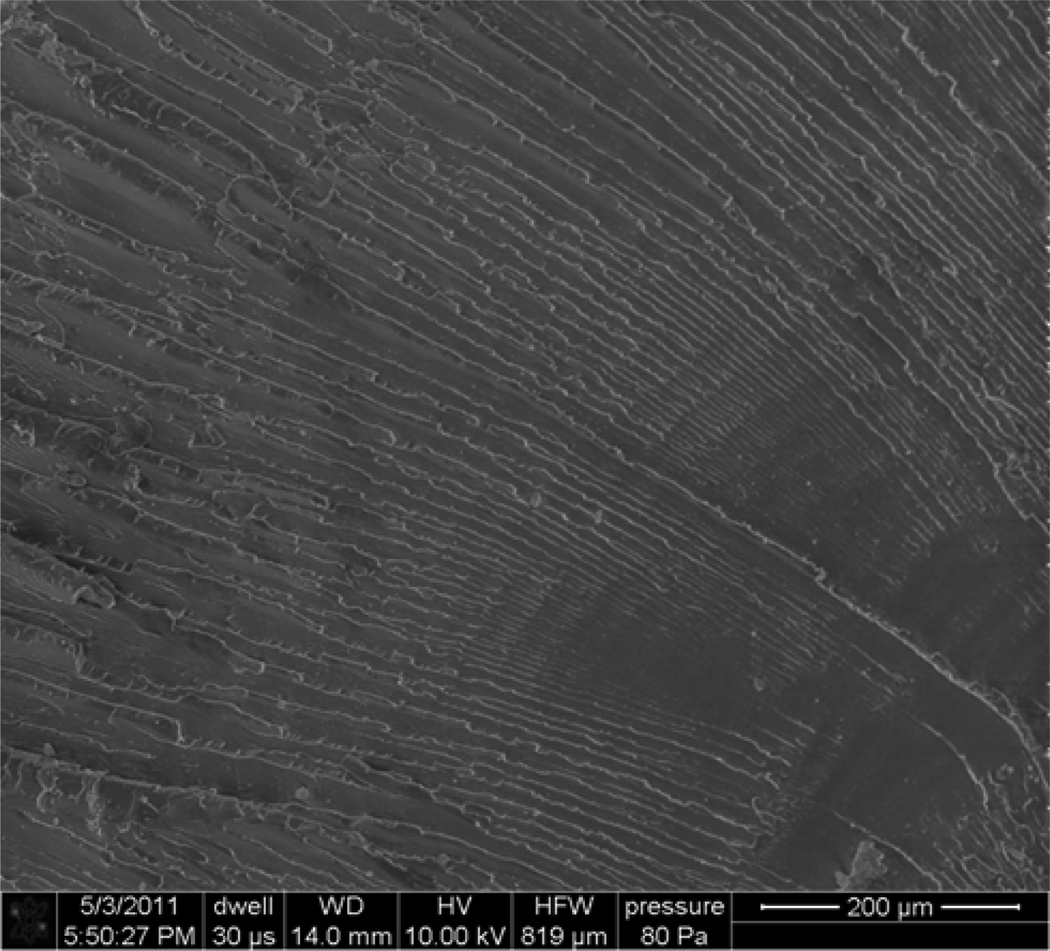
SEM image of the neat PLA facture surface—zoomed in. PLA: poly(lactic acid); SEM: scanning electron microscopy.
SEM image of the 1% PLA-nanoclay facture surface. PLA: poly(lactic acid); SEM: scanning electron microscopy.
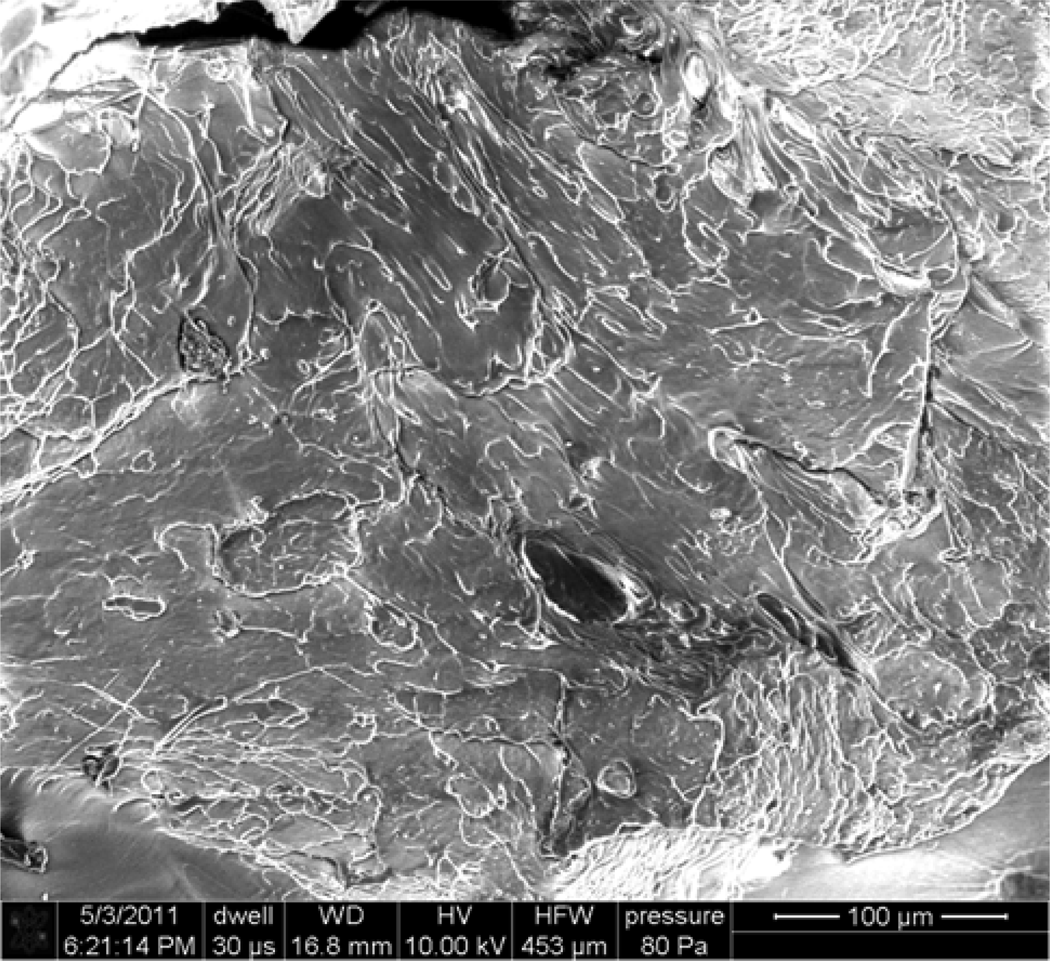
SEM image of the 1% PLA-nanoclay facture surface—zoomed in. PLA: poly(lactic acid); SEM: scanning electron microscopy.
Figure 11 shows the complete fracture surface of the 1% PLA-nanoclay composite, which is notably different from the neat PLA fracture surface. This has what can be said to resemble the “cup-and-cone” fracture surface, which is characteristic of ductile fractures. 31 This type of structure is a result of the fact that in ductile fracture there tends to be necking of the material, and the microvoids within the specimen grow and coalesce in the center of the specimen as the force is applied, ultimately causing failure of the material and giving a structure where the central region has a concentration of holes. This central region of the 1% PLA-nanoclay composite specimen is shown clearly in Figure 12. Consequently, these fracture surfaces show how adding the nanoclay to the PLA has made the material more ductile, and this is in agreement with the results inferred from the stress–strain curves plotted as a result of the tensile tests performed. This ductility implies that the failure of the material takes place with the help of shear yielding, 32 and this leads to the greater strain at break for these nanocomposites with low nanoclay loadings.
Conclusions
Biodegradable polymer nanocomposites of PLA and nanoclay (Cloisite 30B) with compositions of 0%, 1%, 2%, 3%, 4%, and 5% (by mass) nanoclay were prepared by melt extrusion. An exfoliated morphology was achieved for PLA-Cloisite 30B nanocomposite as evidenced by XRD. The nanocomposite samples were then investigated for their mechanical properties using DMA and tensile testing. The combination with 3% nanoclay was found to be optimum as a result of having the greatest mechanical strength. It also had the highest yield strength and storage modulus values. Increasing the nanoclay content to more than 3% by mass led to a drastic deterioration in the mechanical properties of the composite and resulted in composites that were more difficult to fabricate. Thermal properties of the composites were studied with the help of both DSC and DMA data, and it was found that the trend followed by the T g values obtained by both the methods was the same. Finally, the SEM images of the fracture surfaces obtained complied with the experimental values obtained for the samples, indicating more ductile fractures for those samples with greater mechanical strength.
Footnotes
Funding
This research received no specific grant from any funding agency in the public, commercial, or not-for-profit sectors.