
Abstract
Nanocomposite foams based on ethylene vinyl acetate (EVA) copolymer had been prepared by melt blending EVA with the addition of organically modified montmorillonite (OMMT). The clay interlayer spacing was characterized by x-ray diffraction (XRD). The morphology of the foamed samples was studied using transmission electron microscopy and the cell microstructure was characterized by scanning electron microscope. The cell size distribution of the foamed samples was discussed. The effect of OMMT content in the foamed samples on the cellular structure and mechanical properties had been investigated. It had been shown that the OMMT layer could be used as a heterogeneous nucleation agent to decrease the cell size. The uniformity of cell structure of the foamed samples was improved and the physical properties of EVA/OMMT nanocomposite foams were enhanced by the addition of OMMT.
Keywords
Introduction
Polymer nanocomposite foams, which have received increasing attention in both scientific and industrial communities, represent a group of lightweight materials that have been widely used in a variety of industries. 1 Various polymers, for example, polypropylene, high-density polyethylene, polyurethane and ethylene vinyl acetate (EVA) copolymer, and so on, have been used for foam application. 2 Among these thermoplastic elastomeric plastics, EVA containing 12–30% vinyl acetate (VA) have been industrially applied in a broad range of products, including sports gear, insulation materials and drug delivery systems. 3,4 However, there are some disadvantages of EVA, such as poor adhesion, wetting, printing, gas permeability and material compatibility, which restricted its further application. 5,6 Meanwhile, the increasing demand of the quality of life calls for lower density without sacrificing the mechanical properties.
Polymer nanocomposites with the incorporation of montmorillonite (MMT) exhibit superior properties than pure polymer, such as strength, stiffness, thermal and oxidative stability, barrier properties as well as flame retardant behavior. 7,8 These improved properties are generally attained at lower filler content in comparison with conventionally filled systems, and those polymer composites are manufactured commercially for many diverse applications, such as sporting goods, aerospace components, automobiles, and so on. 9 Su et al. 10 investigated the effect of the polar–polar interaction between EVA and organosilicates on the nanoscale structures and rheological properties of their melt blends. The critical shear rate at the transition between these two regimes increased with the intensity of the polar interaction between polymer chains and modified nanosilicates. Kim and coworkers 11 –13 studied EVA/clay nanocomposite foams using melt compounding method. According to their results, the mechanical property, especially the compression set of the foamed materials, was improved with the addition of clay. Hwang et al. 14 studied a series of polymer–clay nanocomposite materials with/without maleic anhydride (MA)-grafted nanocomposites consisting of commercial EVA and organoclay. They found that the addition of organoclay to EVA resulted in an increase in mechanical strength and impact strength and the incorporation of organoclay into the EVA matrix showed a decrease in the cell size, and the rheological results showed the viscosity increased with increasing the organoclay content in the EVA-g-MA nanocomposites.
Although the use of modified clays leads to better application that had been established, the influence of organically modified montmorillonite (OMMT) content on the structure and the properties of EVA foams has not been well demonstrated. In this article, we chose foamed EVA with 1, 3, 5, 7 and 9 parts per hundred (phr) OMMT to prepare EVA/OMMT nanocomposite foams. The dispersion of OMMT in the EVA/OMMT nanocomposites was studied by x-ray diffraction (XRD) and transmission electron microscopy (TEM), and the morphology of the foamed samples was investigated by scanning electron microscope (SEM). In addition, the physical properties and the morphology of the foamed samples were associated to gain knowledge on the relationships between the structure and the physical properties.
Experimental
Materials
EVA named 7350M containing 18% VA was provided by Formosa Plastics (Taiwan). The density of polymer was 0.938 g/cm3 and the melt index was 2.5 g/10 min. OMMT, modified by alkylammonium cation surfactants, was obtained from Zhejiang Fenghong Clay Chemicals Co. Ltd (Zhejiang, China). Azodicarbonamide (AC), used as a blowing agent (degradation temperature range was 202 ± 3°C), was supplied by Jinlang Fine Chemical Co. Ltd (Fujian, China). Dicumyl peroxide (DCP), used as a cross-linking agent, was provided by Akzo Nobel Co. Ltd (The Netherlands). Zinc oxide (ZnO), used as an activator, was supplied by Dongtai Hongyuan chemical factory (Jiangsu, China). Stearic acid (St), used as a lubricant, was supplied by Zhejiang Feixiang Oil Chemical Co. Ltd (Jiangsu, China). Zinc stearate (ZnSt), used as a foaming coagent, was supplied by Dongguan Guohua chemical factory (Guangdong, China).
Preparation of the foamed sample
In the first step, 100 phr EVA were melt-mixed with the addition of 0, 1, 2, 3, 4 and 5 phr OMMT, respectively, in an internal mixer SM-0.5L-K (Suyan, Jiangsu, China) at a screw speed of 50 r/min and at a temperature of 100°C for 10 min. Then, other additives, including 3 phr AC, 1.1 phr DCP, 2 phr ZnO, 1.1 phr ZnSt and 0.8 phr St, were mixed in at a screw speed of 25 r/min and at a temperature of 100°C for 10 min. The low-mixing temperature of 100°C was chosen to avoid the premature decomposition of blowing agent and cross-linking agent in this stage. Then the compounds were taken out from the mill to form a sheet by a twin roll mill XH-401C (Xihua, Guangdong, China) and stored at room temperature for over 5 h before foaming. Finally, the foamed sample was obtained by a flat-panel curing press XH-406 (Xihua, Guangdong, China) for 550 s, at a temperature of 180°C and a pressure of 10 Mpa.
Characterization
X-Ray diffraction
The XRD experiments of the samples were performed from 1.5° to 10° at a scanning rate of 1° per min using x-ray diffractometer (D/max2200PC, Rigaku, Japan). The x-ray beam was generated from the nickel-filtered CuKa (λ = 1.54 Å) radiation in a sealed tube. The basal spacing of the silicate layer, d, was calculated using the Bragg’s equation, 15 which is nλ = 2d sin θ, where λ corresponds to the wavelength of the x-ray, d was the spacing between diffractional lattice planes and θ was the measured diffraction angle or glancing angle.
Transmission electron microscopy
The ultrathin sections with a thickness of 80–90 nm were taken from at −90°C using an ultramicrotome (EM UC 7, Leica, Germany). The morphological analysis were conducted by using TEM (JEM-1230, JEOL Co., Japan), operated at an accelerating voltage of 90 kV.
Scanning electron microscopy
The structures of cells and dispersed clay particles in cell walls were investigated using SEM at 15 kV (TM-1000, Hitachi, Japan). Before the use of SEM, the samples were sputter-coated with gold at a vacuum sputter coater.
The morphology of foams has a great effect on physical properties for polymer foams. For more detailed information from the SEM image, analysis using Image J software 16 was conducted to process the SEM images, Taking one SEM image as an example, the image was disposed by measuring the area of each cell signed a certain color threshold, as shown in Figure 1. Then the image was smoothed and made despeckle repeatedly to keep the final processed cell outline consistent with the original picture. Every cell size was counted by the software and used to get the average cell size.
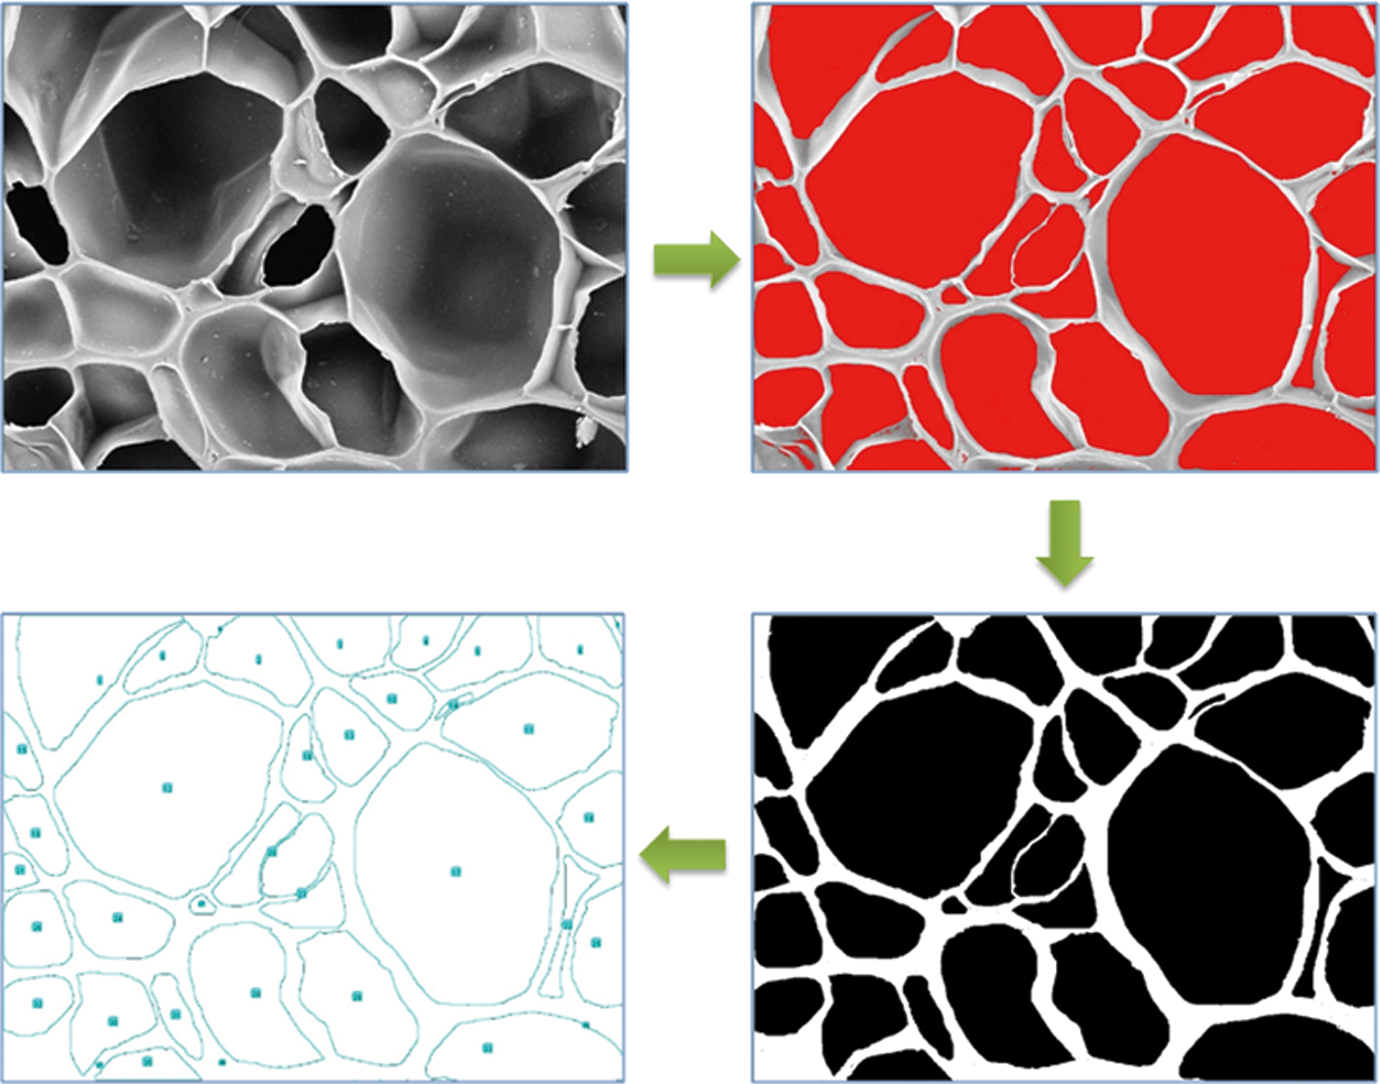
Process of scanning electron microscopic images analysis by image J software.
The function for determining cell density (N
c) in cells per cubed centimeter was determined from equation (1), which was modified by Okamoto et al.
17

The mean cell wall thickness (σ) in micrometers was estimated by equation (2).
18

where ρp and ρf were the density of prefoamed materials and the density of foamed samples in gram per cubed centimeter, and d was the mean cell size in micrometers.
Physical properties of the foamed samples
The density of samples was fast measured by using Electronics Weight Scale (HT-200, A&D, Japan).
The hardness (Shore C) of the surface of samples was measured with the Shore C hardness Tester (Xihua, Guangdong, China).
The rebound resilience (elasticity) was measured using the Rebound Resilience Tester (HT-225, Gotech, Taiwan). The heavy hammer was released from a horizontal position, then striked the foamed sample at a vertical point and went back to a certain height.
Compression set, defined as the measurement of permanent deformation of foams, was tested by compression permanent deformation instrument (Xihua, Guangdong, China). The primary thickness of the samples was 10 mm (T
o), and after compression, the thickness decreased to 50% (5 mm). After 5 h at 50°C, the sample was taken out and the final sample thickness (Tf
) was measured and the compression set was calculated using the following equation, which was modified from the equation reported by Yu and Kim.
19

The tensile strength (stress), elongation at break (strain), tear strength and peel strength of the foamed samples were obtained by desktop tensile strength tester (AI-3000, Gotech, Taiwan.) at room temperature. The speed was 100 mm/min. All measurements were performed for three times to get the average results.
Results and discussion
XRD analysis
Pristine-layered silicates were only miscible with hydrophilic polymers, such as poly (ethylene oxide) and poly(vinyl alcohol). In order to render them miscible with other polymers, the MMT layers must be modified by alkylammonium cation surfactants to get a hydrophobic surface. 20,21 It had been well demonstrated that the replacement of the inorganic exchange cations in the cavities or ‘galleries’ of the native clay silicate structure by alkylammonium cation surfactants could compatibilize the surface chemistry of the clay and a hydrophobic polymer matrix. 22
Figure 2 showed the XRD patterns of the nanocomposites containing 3 phr OMMT in the EVA matrix, the pure EVA and the original OMMT for comparison. As can be seen, the main characteristic diffraction peaks of the OMMT diffraction at 2θ ≈ 2.34° had a sharp signal corresponding to crystalline plane (001) and indicated a layer spacing of 3.77 nm. The interlayer spacing was larger than natural MMT (about 1.2 nm7). Two small signals due to a smaller interlayer distance were also observed, probably caused by a small amount of nonexchanged MMT present as an impurity into the commercial product, 23 corresponding to an interlayer spacing of about 1.86 and 1.23 nm. The XRD pattern obtained from EVA/OMMT showed no peak from 1.5° to 10°, similar to that from pure EVA. This revealed that the majority of the silicate layers of the OMMT were either intercalated to a space of more than 5.88 nm (2θ < 1.5°) or completely exfoliated by the EVA chains, 24 which could be further confirmed by TEM in the following sections.
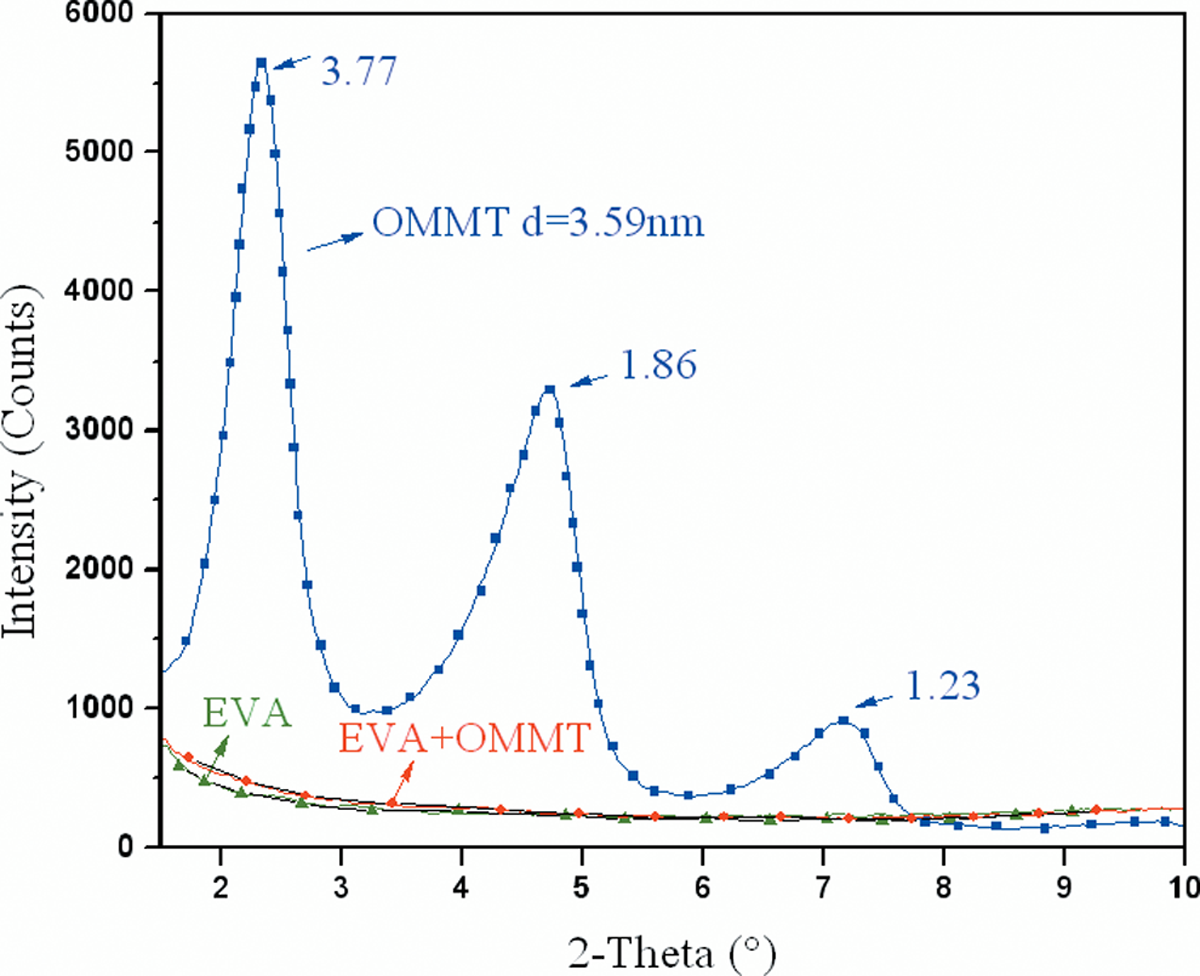
X-Ray diffraction patterns obtained for the samples studied.
Morphologies of the composites
Figure 3 showed the TEM images at low and high magnitude of the nanocomposites for EVA/OMMT3. From the low-magnitude images (Figure 3(a)), we found that the composites were well dispersed at the micron scale. In order to further understand, image at a magnification of 250,000× was taken, as shown in Figure 3(b). We could see that the dark lines, which could be confirmed as the silicate layers of MMT, were dispersed at the monolayer level. Most of the layers were completely exfoliated into a thickness of 1–4 nm and a length of 50–150 nm, that is, the layers were in molecularly thin sheets with a high aspect ratio, attributed to the hydrophobic surface of MMT in the EVA matrix. The exfoliation structure of MMT in the nanocomposites was attained by this approach, consistent with the XRD result supposed earlier. The evenly distribution of MMT might be beneficial to the foam process and the final property of the foamed samples.
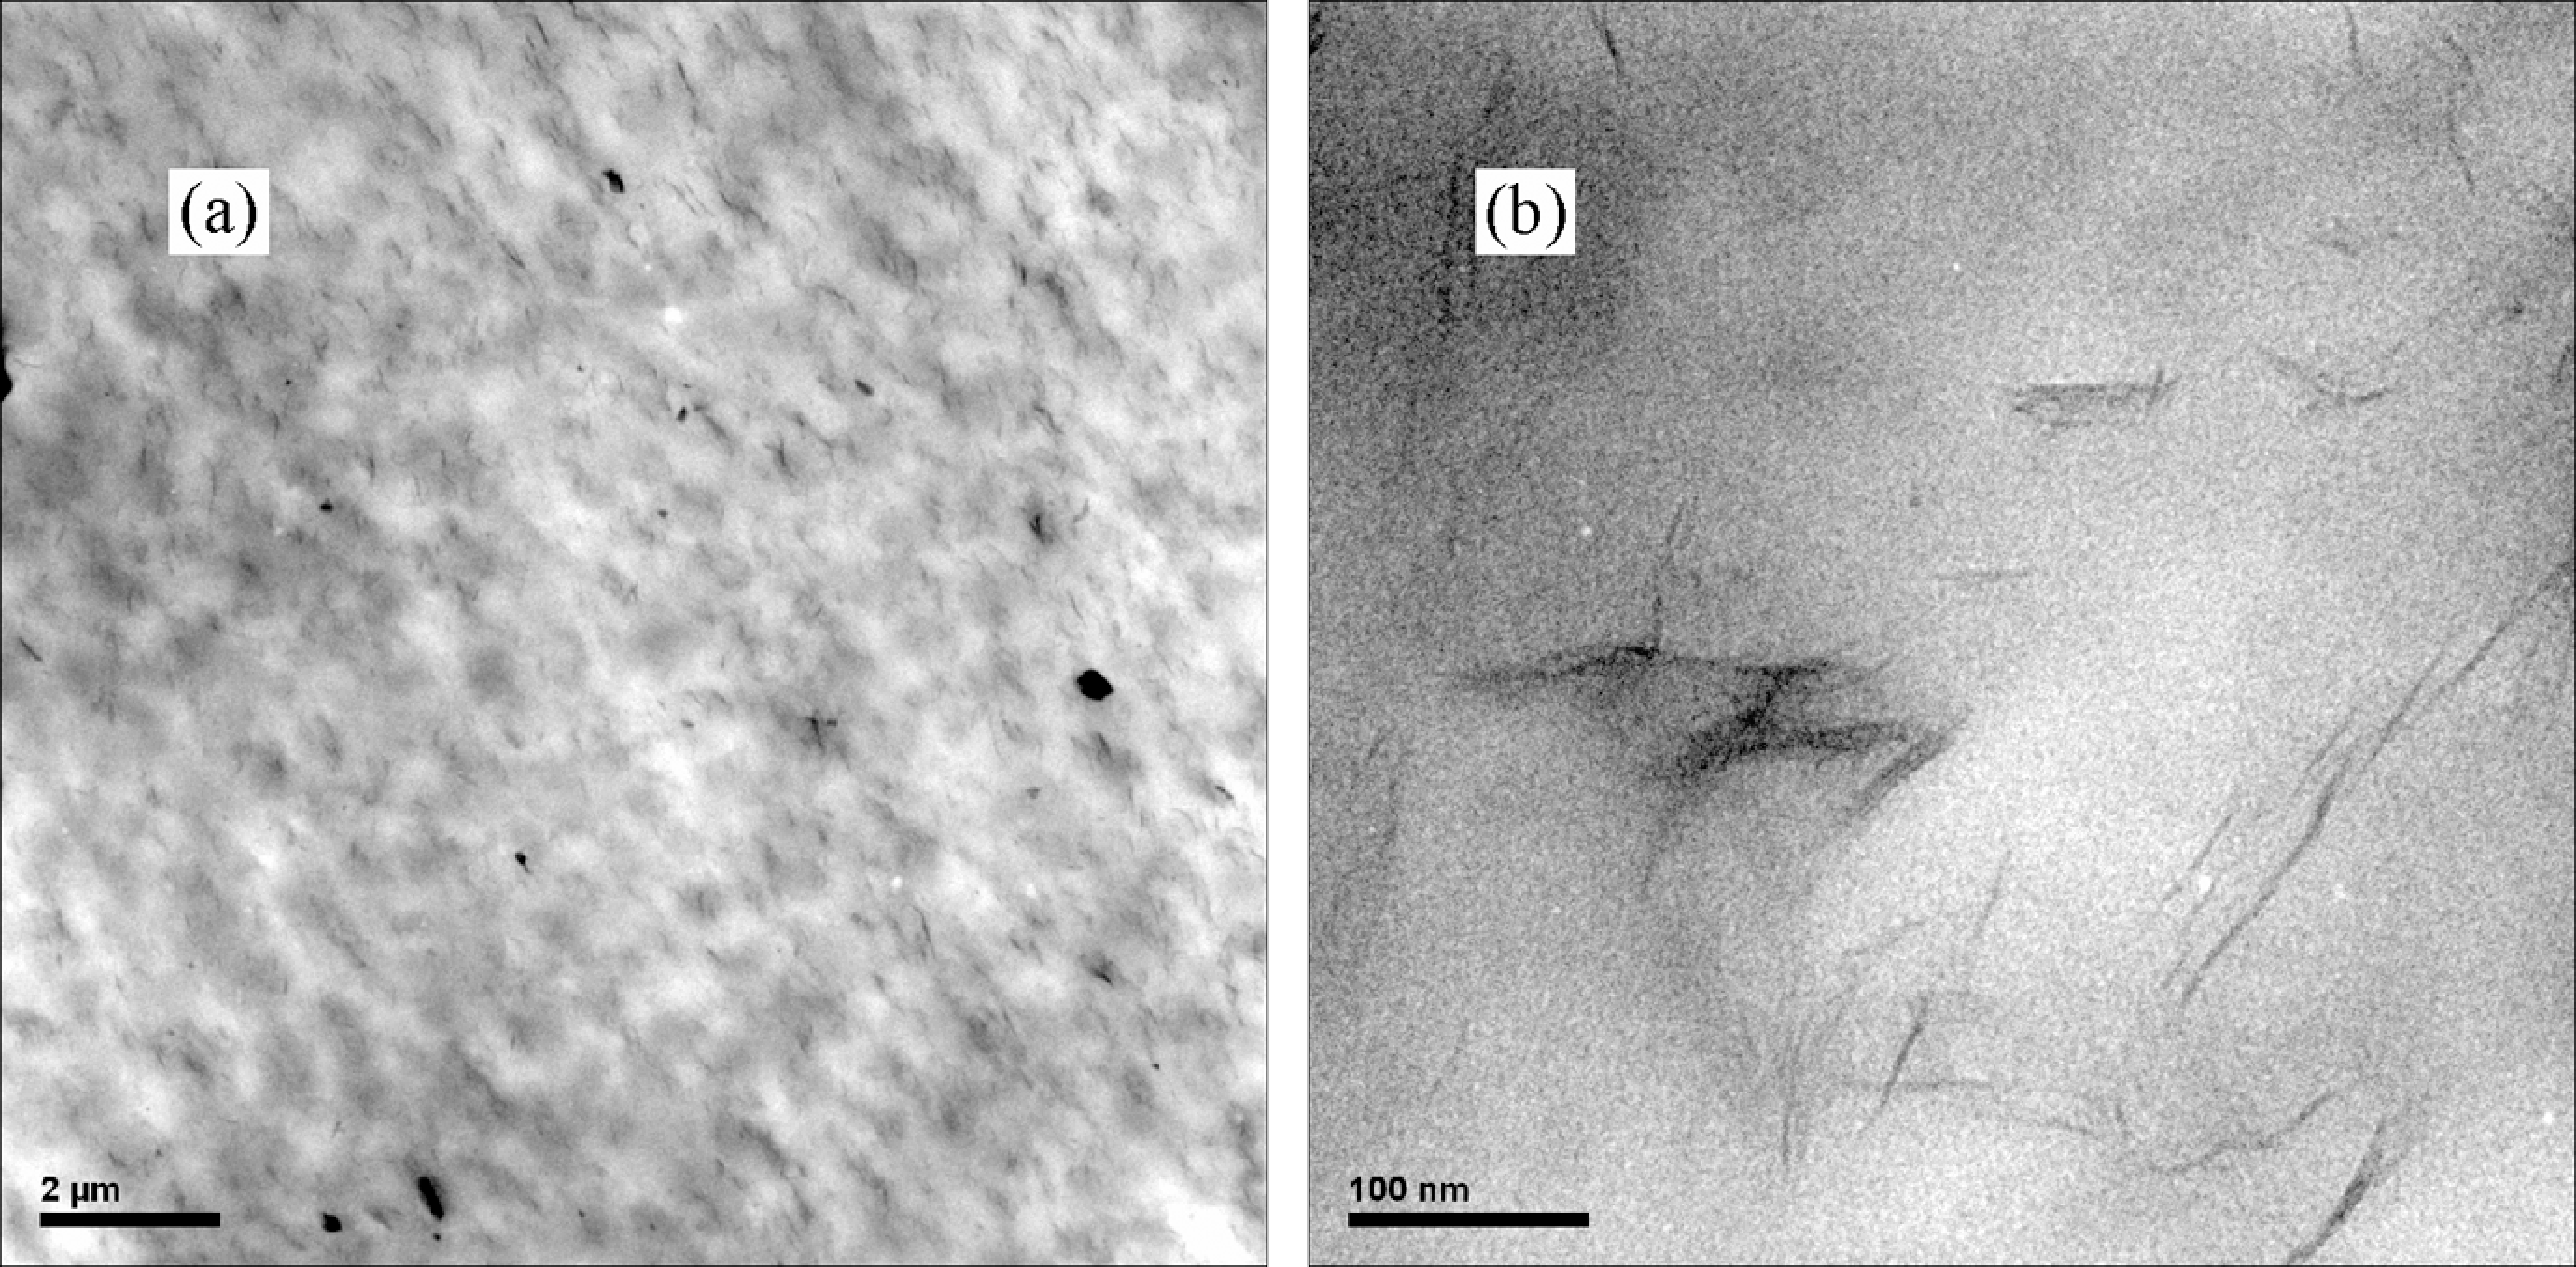
TEM images of the nanocomposites for EVA/OMMT3 (a) at a magnification of ×10,000 and (b) at a magnification of ×250,000. TEM: transmission electron microscopy; EVA: ethylene vinyl acetate; OMMT: organically modified montmorillonite.
Morphologies of the foamed samples
Figure 4 showed the SEM images of the cross-section surfaces of the EVA/OMMT foams and pure EVA foams. All foams exhibited nicely closed-cell structure. Pure EVA foams showed nonuniform cell structure and had large cell size, as shown in Figure 4(a). With the addition of 1 phr OMMT, the cell size was obviously smaller and the diameter of most cells was in similar size. With the increase in OMMT, the structural uniformity of the foams was improved, as shown in Figure 4(b) to (d). Mixing in the molten state, a higher hydrophobicity surface was found to promote an efficient dispersion of the clay and a lower surface energy of the silicate surface and improve compatibility with the polymer matrix. 25,26 What’s more, the strong heterogeneous nucleation effect of the OMMT sheets in this region might lead to the formation of small cells. It could be used as a heterogeneous nucleation agent to decrease the cell size and increase the cell density because of a lower activation energy barrier compared with homogeneous nucleation. 1,27,28
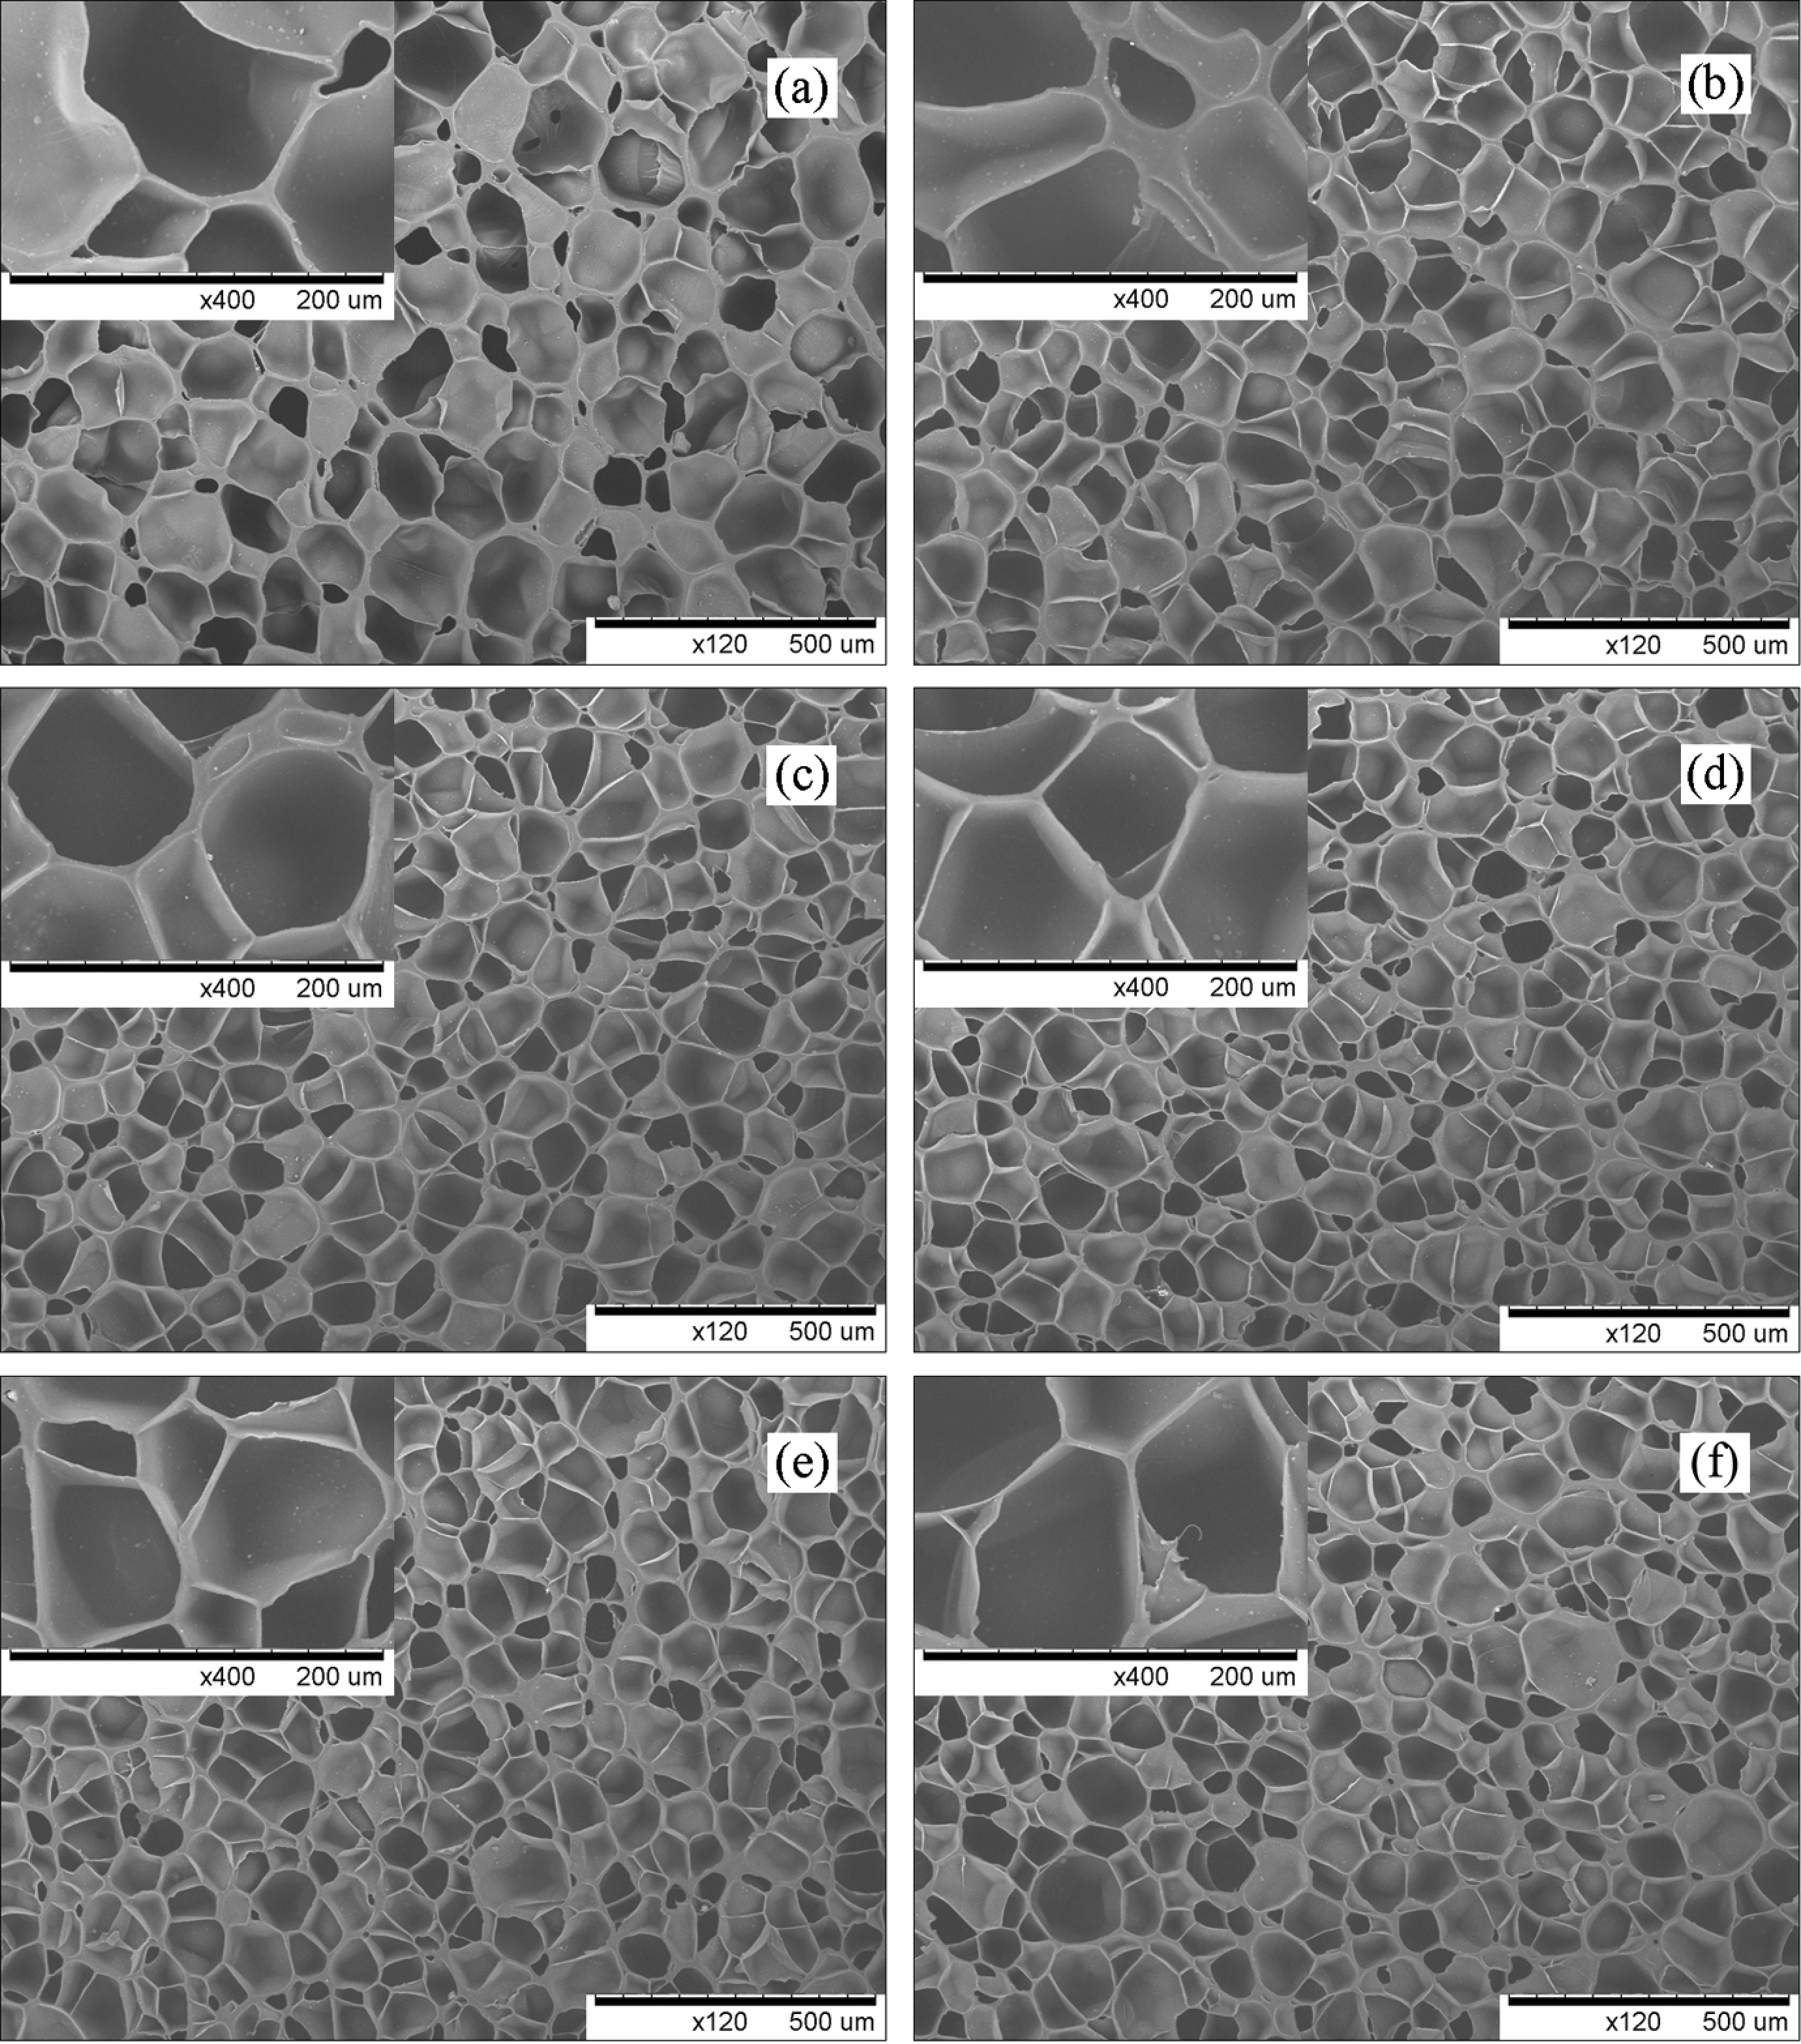
SEM images of the cross-section surfaces of pure EVA and EVA/clay composites foams at a magnification of 120×. (a) EVA, (b) EVA/OMMT1, (c) EVA/OMMT3, (d) EVA/OMMT5, (e) EVA/OMMT7 and (f) EVA/OMMT9 (images on the upper left corner showed an enlarged cross-section at a magnification of 400×). SEM: scanning electron microscopic; EVA: ethylene vinyl acetate; OMMT: organically modified montmorillonite.
The large magnitude image on the upper left corner showed an enlarged cross-section of the foamed samples. It can be found that the nanocomposite foams containing 3 and 5 phr OMMT in the EVA matrix showed uniform cell structure and equal cell wall thickness.
However, when the content of OMMT further increased to 7 and 9 phr, in Figure 4(e) to (f), the foams conformed partly to a normal distribution and a portion of cells was much larger. The uniformity of the foams turned to uneven cell structure with the additional OMMT. It is mostly because the organoclay-filled composites showed fairly good dispersion comprising a mixture of intercalated and exfoliated clay layers at relatively low clay contents, but a partial reaggregation of clay took place at high clay content. 29
To objectify the dispersion of cells in EVA/OMMT nanocomposites foams, we used software Image J to dispose the SEM images. The ρf and ρg were measured using the electronics weight scale. The average cell size, d, was obtained by the software. We could quantitatively obtain the morphological parameters, such as the cell density, N c, and the mean cell wall thickness, σ, of the cells using equations (1) and (2), which were listed in Table 1.
Morphological parameters of the foam samples.
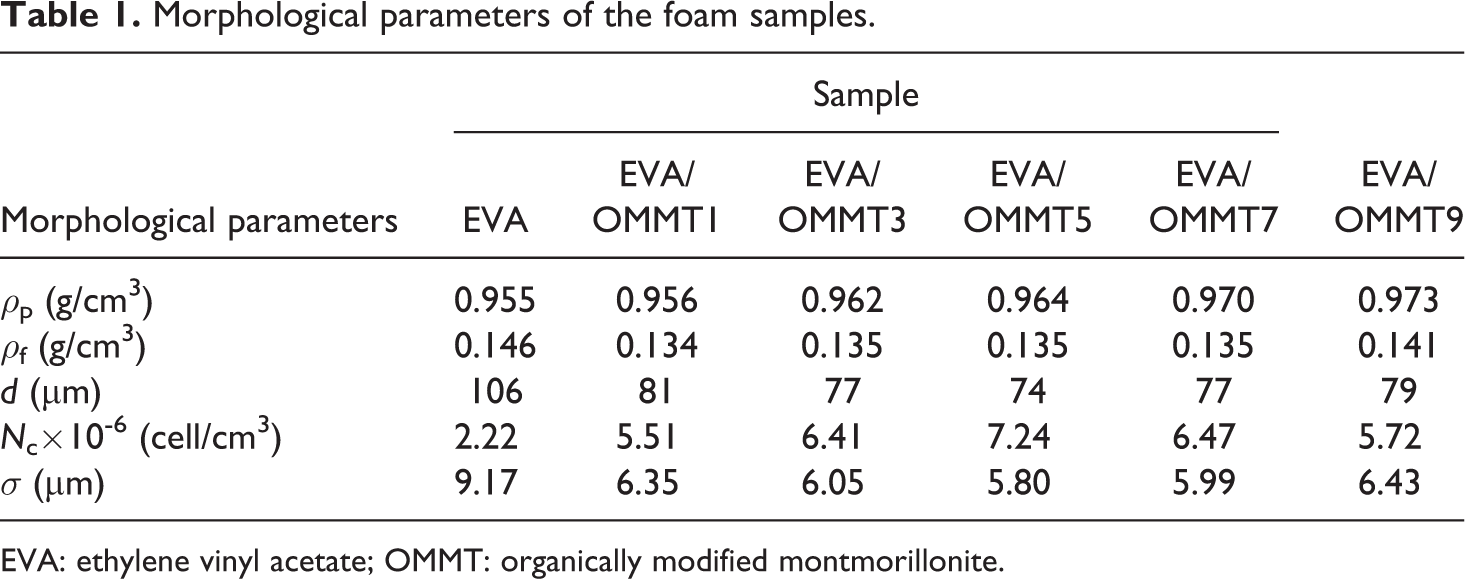
EVA: ethylene vinyl acetate; OMMT: organically modified montmorillonite.
The mean cell size d decreased dramatically with the addition of OMMT, which was anastomotic with SEM photographs. The final ρf was controlled by the competitive process in the cell nucleation, growth and coalescence. It could be seen that its changing tendency was associated with d. The function for determining cell density N c defined by ρf , ρp and d, range from 2.22 × 10⁶ cells/cm3 to 7.24 × 10⁶ cell/cm3. With the addition of OMMT, corresponding nucleation site and the bulk of the foams per unit volume increased. Foams were formed in the boundary between the matrix and the dispersed clay particles in the foam processing. 30 Therefore, the mean cell wall thickness σ decreased, ranging from 9.17 to 5.80 μm.
The cell size distribution could be seen visually by the numeral statistics and analysis, as shown in Figure 5. The mean cell size d of pure EVA indicated that foaming was relatively inconsonant. With 1 phr OMMT, the most cell size decreased. The nanocomposite foams showed smaller cell size and the cell size distribution fitted a normal distribution with 5 phr OMMT, which showed a potential benefit in the aspect of physical properties of the foamed samples. When the addition of OMMT was up to 9 phr, the fraction of large cells was increasing because of the reaggregation effect.
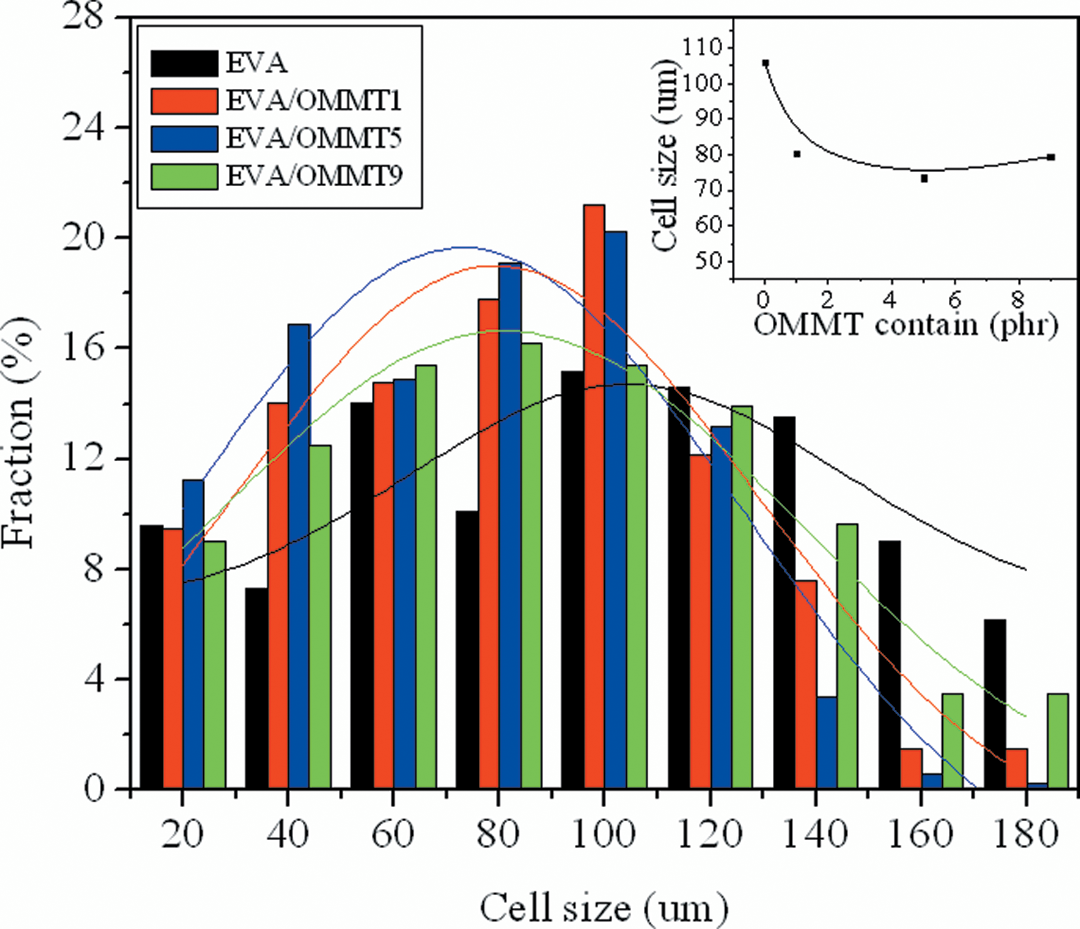
Cell size distribution of scanning electron microscopic images.
Physical properties of the foamed samples
Generally, in composites, the physical properties were related to the dispersion of fillers and interaction between fillers and matrix. Well-dispersed fillers and high interaction between fillers and matrix give higher enhancement to the composites.
Figure 6 showed the density of the foamed samples, which fluctuated with the addition of OMMT. The density of the samples was lower obviously even with 1 phr OMMT, which was consistent with the SEM images. The cell density in the microstructure was associated with the macroscopical density. But when the addition was up to 9 phr, the opposite role was played due to the reaggregation of extra clay, which is as mentioned above.
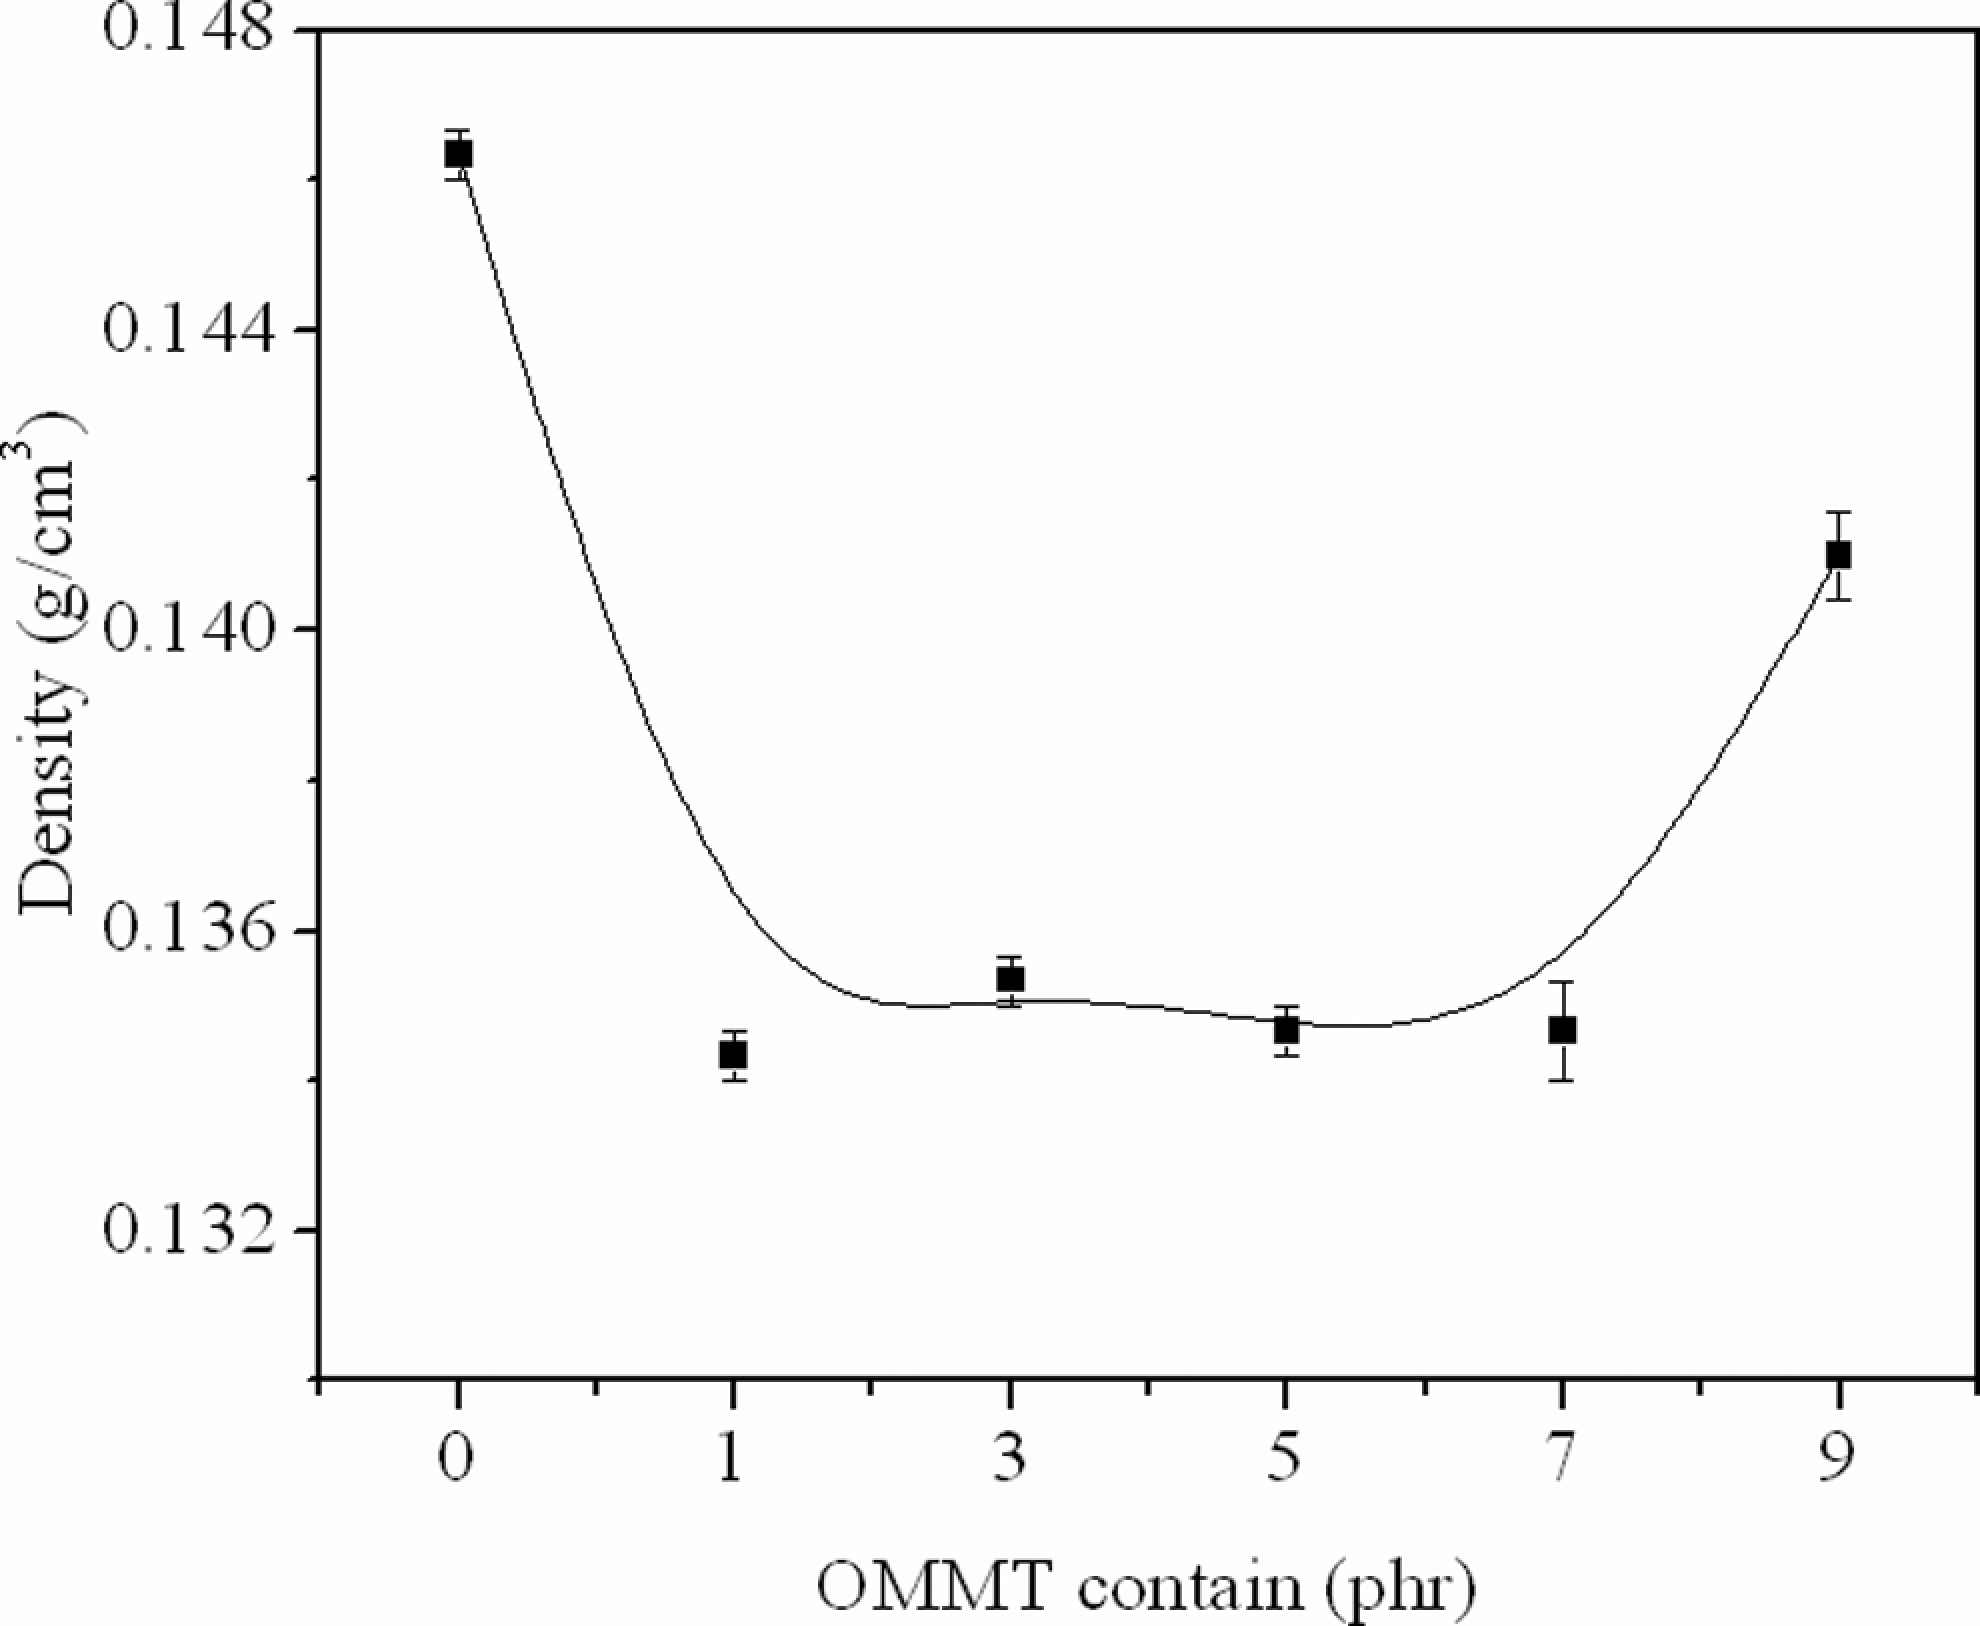
Density of the foamed samples.
Figure 7 showed the results for the hardness (shore C) of the foamed samples. The hardness of EVA foams with 1 and 3 phr OMMT showed a slight decrease, because of their low density. An increase in the hardness was seen with higher addition of clay, due to a reinforcement effect of the OMMT which was harder than the EVA matrix, 31 and the uniform foam structure which devotes to high hardness.
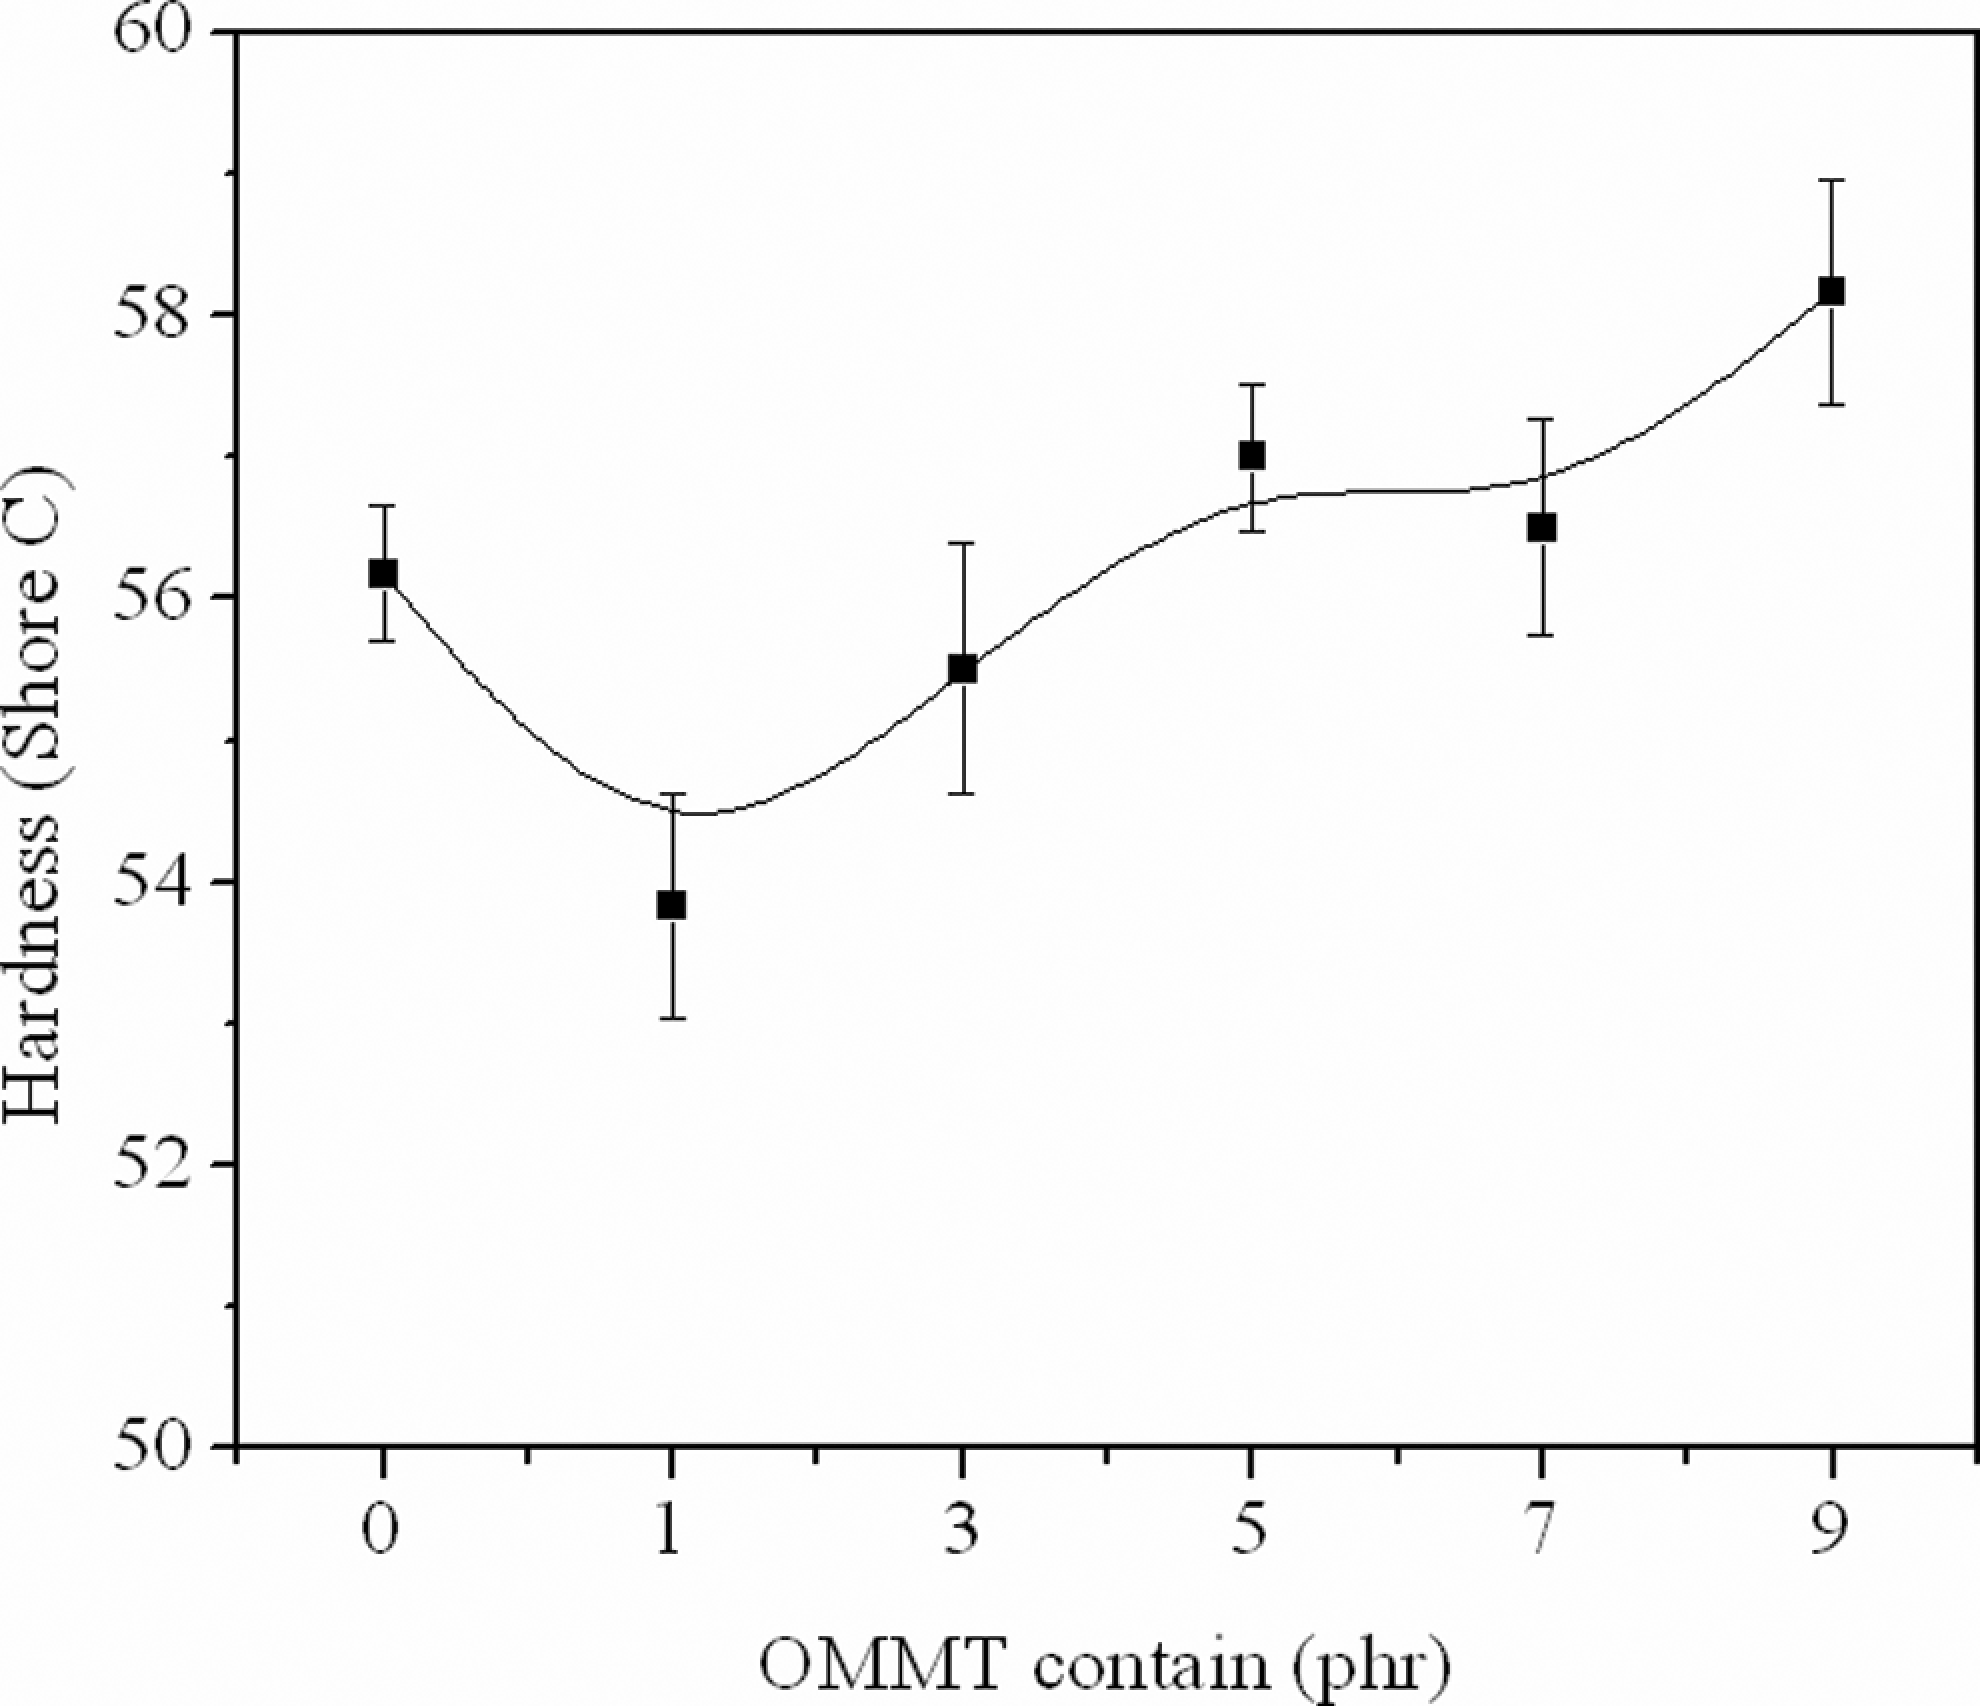
Hardness of the foamed samples.
Figure 8(a) showed results for rebound resilience of the foamed samples. A decrease in the rebound resilience was observed with the addition of clay, possibly caused by the thinner cell wall thickness σ and the lower density of samples. Figure 8(b) showed results for compression set of the foamed samples. We could see the foams with 1 phr OMMT showed a lower compression set, mostly because of the lower density. However, the foamed samples with over 1 phr OMMT showed higher compression set. This was because the effect of uniform cell structure was more than the decreased density. Comparing Figure 8(a) with Figure 8(b), we interestingly found there was no inevitable connection between rebound resilience and compression set.
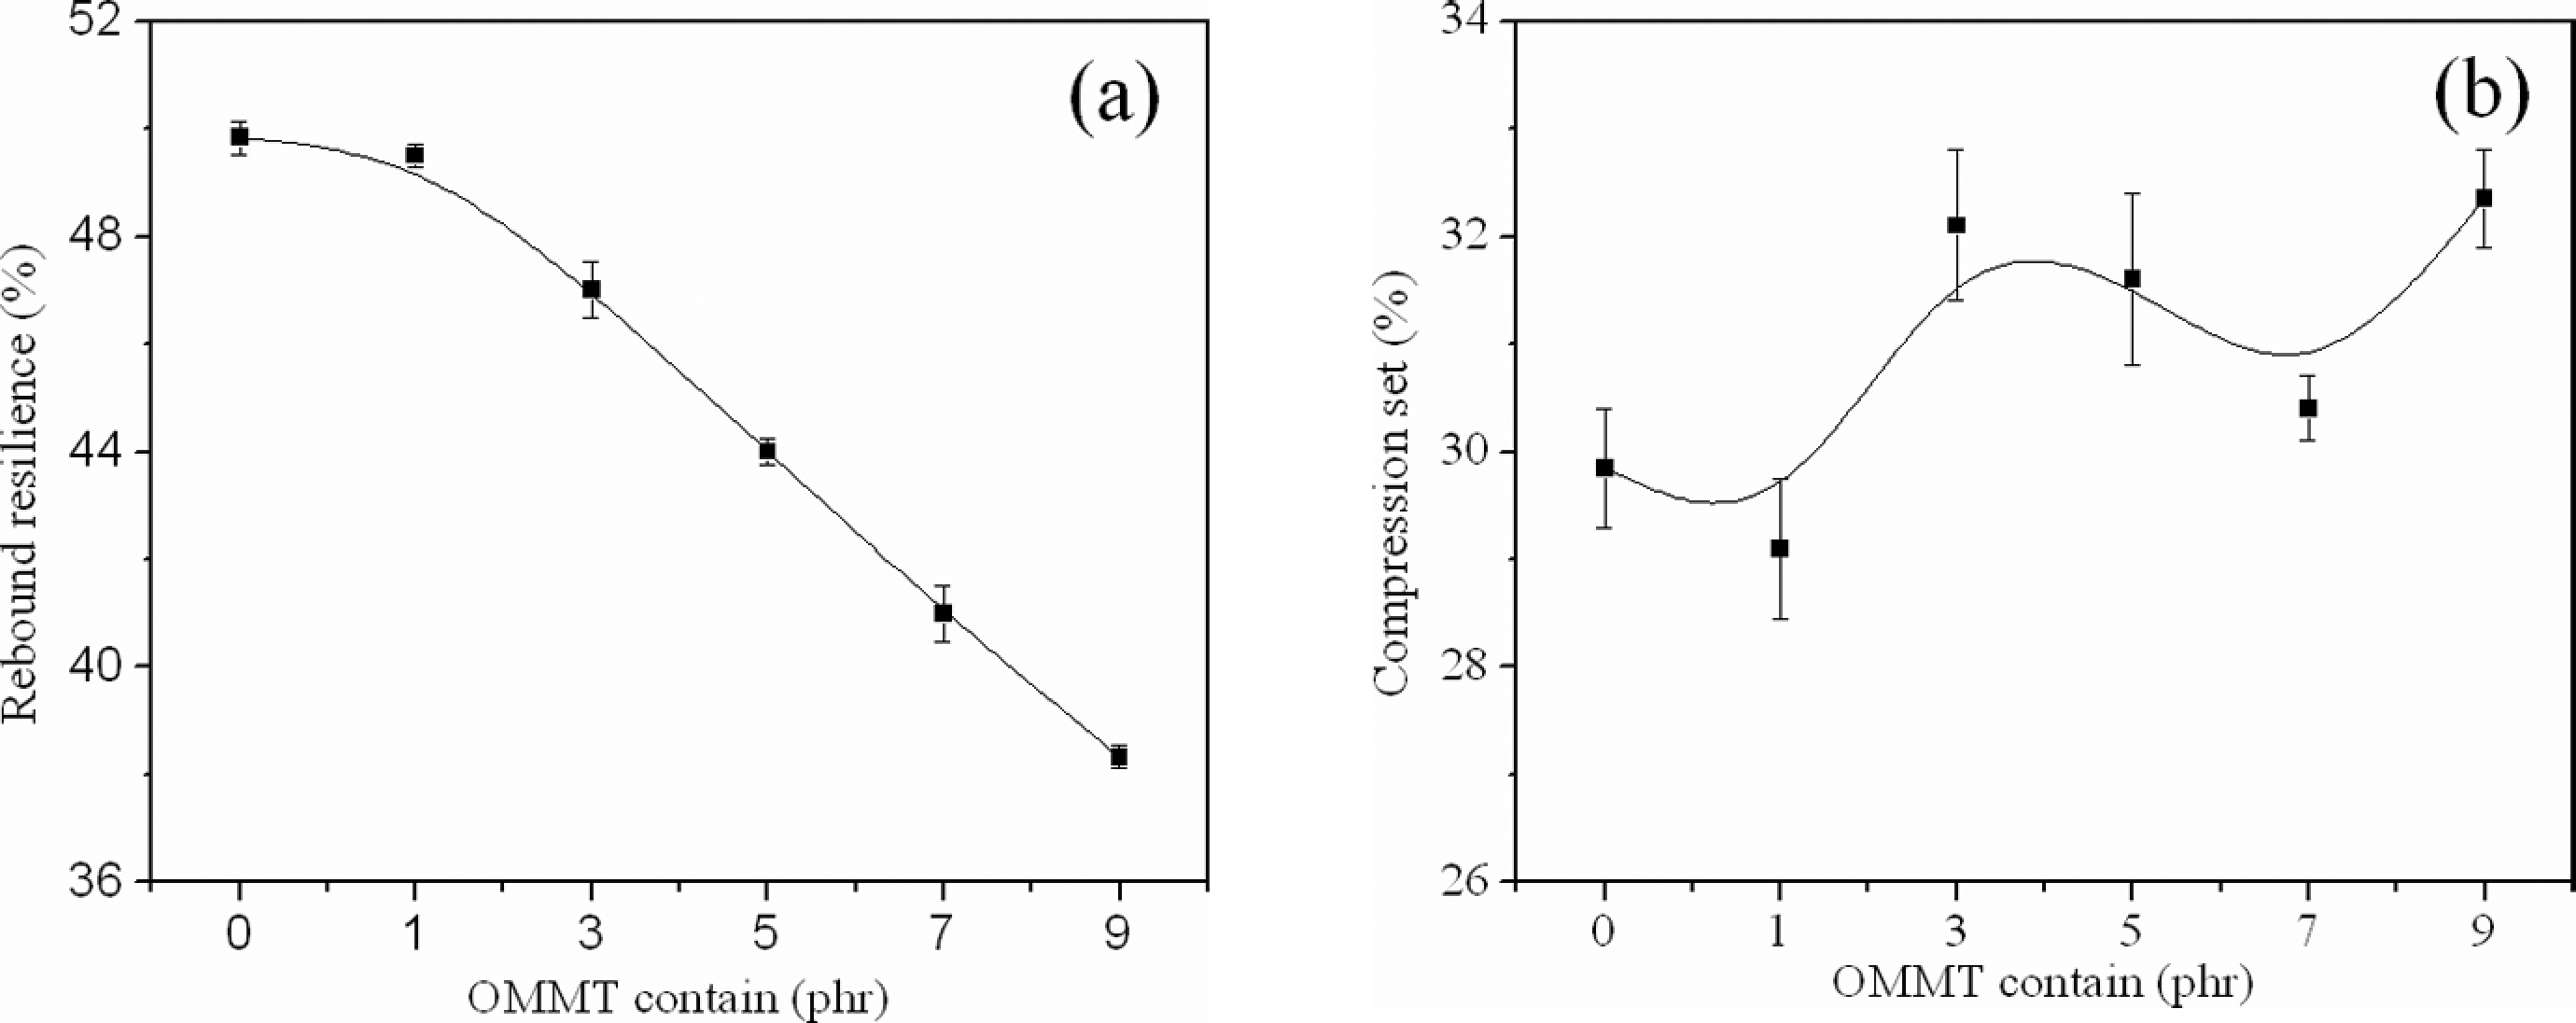
Rebound resilience and compression set of the foamed samples.
The mechanical properties were obtained with the addition of clay in the final application, as shown in Figure 9(a) to (d). The foamed composites showed higher tensile strength, elongation at break, tensile strength and peel strength than pure EVA foams. Within 5 phr OMMT, the foamed samples showed higher improvement of performance with higher clay content. The tensile strength, elongation at break, tensile strength and peel strength was improved by 10.4%, 18.5%, 19.7% and 1.2%, respectively. This showed a potential application value in industry that the EVA/OMMT nanocompostie foams cost less in the same volume and had better mechanical properties, compared with traditional EVA foams. Since the dispersion of clay was effective, the exfoliated and partially exfoliated structures can lead to a reduction in the degrees of freedom and greater interaction between the load/polymer, the effect of relaxation through cooperativity established the existence of a network of interactions along the polymer matrix. 32 The coupling between the tremendous surface area of the clay and the polymer matrix facilitated stress transfer to the reinforcement phase. 33 In addition, the homogeneous and smaller cells were contributed to the uniform cell structure and reduced the occurrence of stress concentration.
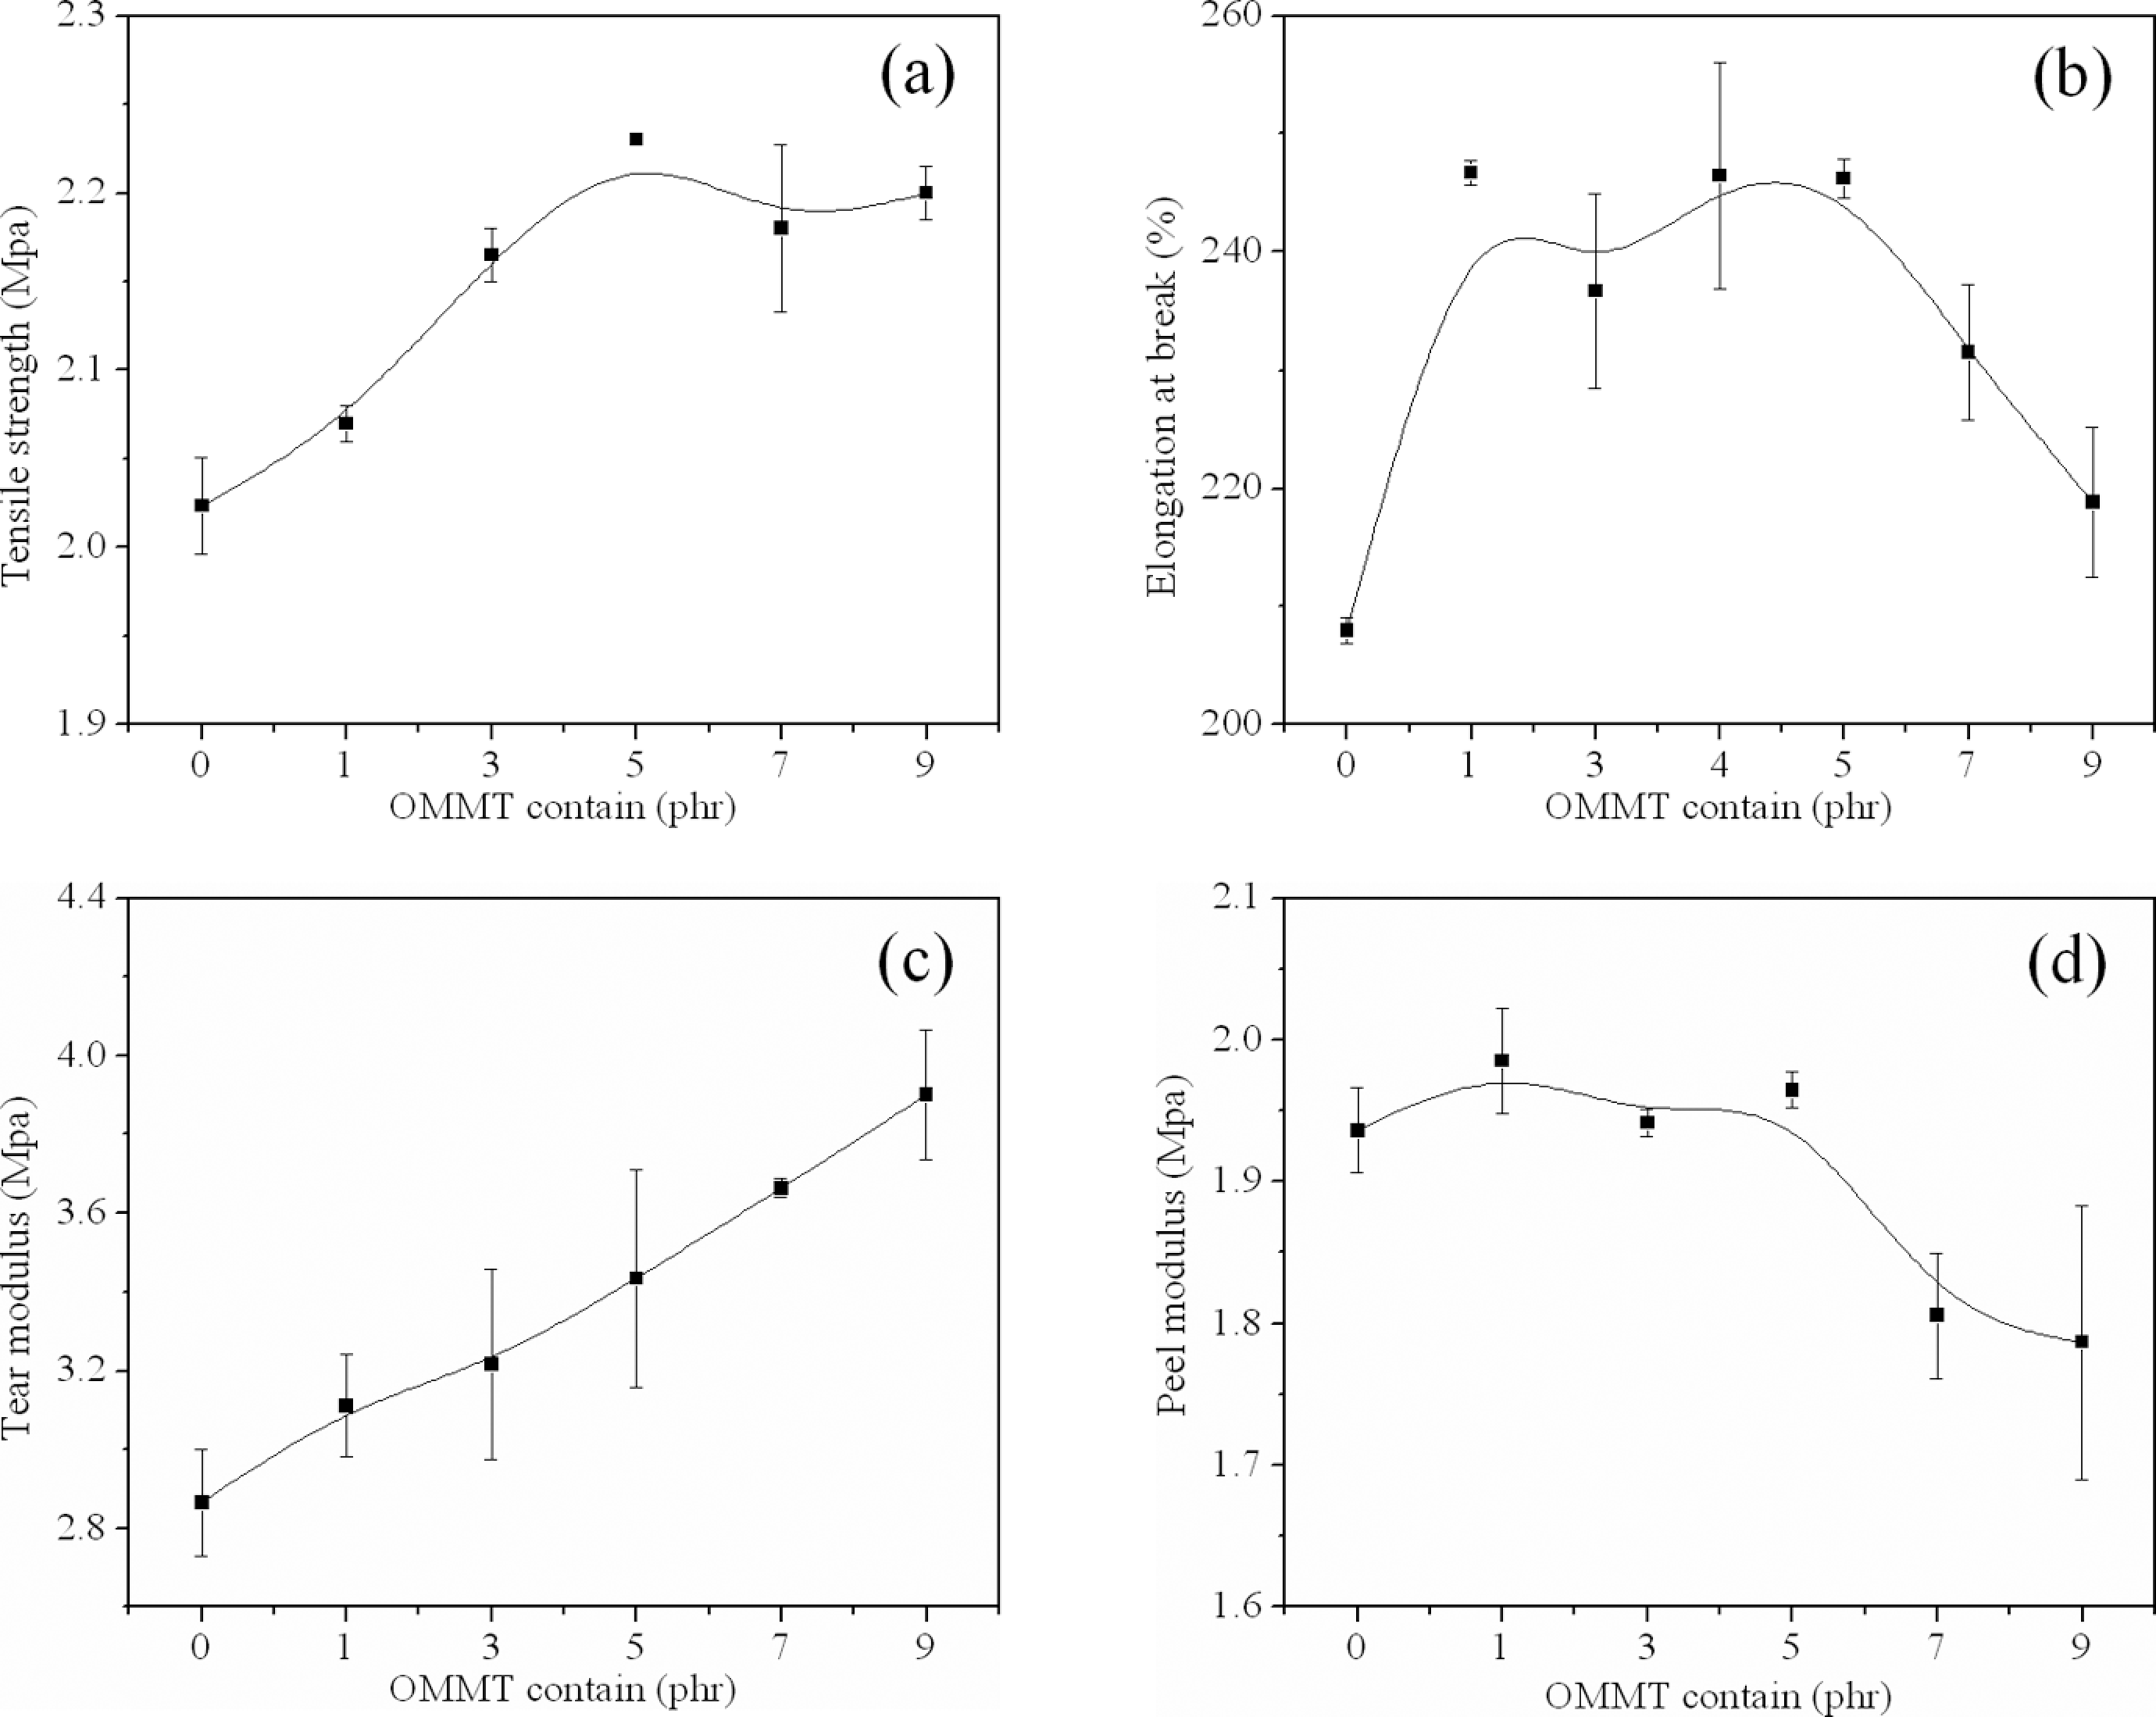
Mechanical properties of the foamed samples. (a) tensile strength, (b) elongation at break, (c) tensile strength and (d) peel strength.
However, with further increase in the clay content to 7 and 9 phr, the foamed samples tended to reduce the mechanical properties in varying degrees and produce weaker materials, mostly because of the particle agglomeration 25 and the uneven cell structure.
Conclusions
EVA/MMT nanocomposite foams were synthesized with different addition of OMMT. The existence of exfoliation structure of nanocomposites was demonstrated by XRD and TEM analysis and the morphology of the foamed samples was obviously smaller by SEM. The uniform dispersion of MMT could be used as a heterogeneous nucleation agent to decrease cell size and enhance the uniformities of cell structure. The size of most cells was close and the structure uniformity of the foams was improved with slight OMMT content (1–5 phr). With the addition of OMMT from 1 to 5 phr, the mechanical properties (tensile strength, elongation at break, tensile strength and peel strength) were enhanced. However, with the further addition of OMMT to 7 and 9 phr, the mechanical properties of the foamed samples tended to decrease because of the particle agglomeration and the uneven cell structure.
Footnotes
Funding
This work was supported by the Major Program of Science Foundation of Shaanxi Province (2009ZKC03-14), Civic Scientific and Technological Project of Wenzhou City, Zhejiang Province (H20100082) and the Graduate Innovation Fund of Shaanxi University of Science and Technology.